Letter

Near-Real-Time Application of SEVIRI Aerosol Optical Depth Algorithm

by
Olga Zawadzka-Manko
*,
Iwona S. Stachlewska
and
Krzysztof M. Markowicz
Institute of Geophysics, Faculty of Physics, University of Warsaw, 02-093 Warsaw, Poland
*
Author to whom correspondence should be addressed.
Remote Sens. 2020, 12(9), 1481; https://doi.org/10.3390/rs12091481
Submission received: 7 April 2020 / Revised: 1 May 2020 / Accepted: 3 May 2020 / Published: 7 May 2020
(This article belongs to the Section Atmospheric Remote Sensing)

Abstract

:
Within the framework of the Satellite-based Monitoring Initiative for Regional Air quality (SAMIRA) project, the near-real-time (NRT) operation has been documented for an in-house developed algorithm used for the retrieval of aerosol optical depth (AOD) maps from the Spinning Enhanced Visible and Infrared Imager (SEVIRI) sensor onboard the Meteosat Second Generation (MSG). With the frequency of 15 min at a spatial resolution of roughly 5.5 × 5.5 km the AOD maps are provided for the country domains of Poland, the Czech Republic, Romania, and Southern Norway. A significant improvement has been reported in terms of modification of the existing prototype algorithm that it suits the operational NRT AOD retrieval for an extended area. This is mainly due to the application of the optimal interpolation method for the AOD estimation on reference days with the use of ground-based measurements of the Aerosol Robotic Network (AERONET) and the Aerosol Research Network (PolandAOD-NET) as well as simulations of the Copernicus Atmosphere Monitoring Service (CAMS). The main issues that have been addressed regarding surface reflectance estimation, cloud screening and uncertainty calculation. Exemplary maps of the NRT retrieval have been presented.

Graphical Abstract

1. Introduction

Despite all the efforts to reduce aerosol emissions and improve air quality in Europe, atmospheric pollution is still a source of health and environmental hazards in many parts of the continent [1]. On a regional scale, special attention should be paid to countries where the emission of air pollutants is still high, especially in large cities and industrial regions, such as Silesia in Poland and Gorj county in Romania.
This topic is explored within the project funded by the European Space Agency Centre for Earth Observation (ESA-ESRIN) and entitled SAtellite based Monitoring Initiative for Regional Air quality (SAMIRA, https://samira.nilu.no/). The overall goal of this project is to develop methods for exploiting existing satellite platforms in order to provide regional air quality products that complement currently available operational services. One of the main objectives of SAMIRA is to improve existing algorithms for the retrieval of aerosol optical depth (AOD) maps from the Spinning Enhanced Visible and Infrared Imager (SEVIRI) instrument, deployed onboard the geostationary Meteosat Second Generation (MSG) platform [2].
The AOD over land is operationally retrieved from several sensors (e.g. Moderate Resolution Imaging Spectroradiometer (MODIS), Multi-angle Imaging SpectroRadiometer (MISR), Ozone Monitoring Instrument (OMI)) onboard Low Earth Orbit (LEO) satellites. Despite many existing algorithms (e.g., [3,4,5,6,7,8,9,10,11,12,13,14,15,16]), no operational product of AOD over land is available from the SEVIRI instrument. The AOD estimation based on the data acquired by geostationary satellites is much more challenging than that based on LEO satellites observation ([17], and references therein). On the other hand, geostationary satellites provide observations at a much higher time resolution. For the years 2004–2012, the Satellite Application Facility on Climate Monitoring (CM SAF) provided climate data records for daily and monthly estimates of the SEVIRI AOD over land and ocean [18]. However, currently, only the European Organisation for the Exploitation of Meteorological Satellites (EUMETSAT) provides an operational product from SEVIRI AOD data, but it is available only for pixels that cover the sea [19].
Ref. [14] proposed a technique for deriving AOD maps from the SEVIRI sensor over the territory of Poland. The paper discusses further modifications and extensions of that prototype algorithm. The main contribution of this work over the earlier one [14] is that uncertainty estimates have been added and the procedure has been automated (including all calculations, input data acquisition and output of the results). The algorithm was adjusted and applied for three additional countries. Note that the design of the algorithm, as well as mathematical details of the code, are described in full detail in [14] and repetitions were avoided in the current paper. Because high time resolution of the SEVIRI AOD over land is not available from the EUMETSAT (it was also not available from the Cloud-Aerosol-Water-Radiation Interactions Data and Services Center (ICARE) at the time this study was conducted), radiances from appropriate channels of SEVIRI are used along with some ground-based measurements and other data sources to estimate) AOD over the subject countries with high time and spatial resolution.
Currently, the new version of the algorithm provides near-real-time (NRT) operational retrieval over Poland, the Czech Republic, Romania and southern Norway. In general, it is possible to obtain the data throughout the whole year if the SEVIRI observations are available. However, as for the most passive satellite sensors, it is clouds and snow cover that are the main obstacles in aerosol detection. Since in Europe these factors are an issue mainly during the cold part of the year, the majority of SEVIRI AOD data are available for the warm part of the year.
The paper is divided into several sections. Section 2 outlines the methodology, including a description of the extended algorithm, the uncertainty estimation and the examples of offline calculations. In Section 3, specifications of the NRT operation are provided along with the NRT AOD maps for selected case studies. In the Conclusions, the paper is summarized with the highlights of the algorithm’s advantages and limitations, as well as providing an outlook for further work and possible additional applications of the algorithm.

2. Materials and Methods

The modification of the prototype algorithm [14] was done step by step and explored on the basis of case studies presented by [20,21,22], with examples of AOD maps derived after certain improvements along with the discussion on the use of lidar and sun-photometer data for the algorithm validation in Poland. The following sections cover a detailed description of the improvements implemented to date, the methodology of the uncertainty estimation, as well as of the near-real-time automation. The main changes introduced in the modified algorithm regard the extension of calculations for new country domains, the surface reflectance estimation, the cloud screening improvement, and the uncertainty calculation.

2.1. Extended SEVIRI AOD Calculations for New Country Domains

The SEVIRI AOD algorithm, designed initially for the territory of Poland [14], was extended to other countries: the Czech Republic, Romania, and southern Norway. For calculations over each country, a domain as small as possible was chosen, but covering the whole territory (given in Table 1), in order to save computing time. For the relatively high spatial resolution (5 × 5 km) of the SEVIRI data, the derived AOD maps over each territory have a large number of pixels (Table 1), which results in time-consuming calculations.
As the objective was near-real-time retrieval, suppression of calculation time for each map was crucial. The issue was addressed by simulating the top-of-atmosphere (TOA) radiance obtained from the SEVIRI sensor and storing it in arrays referred to as look-up tables (LUTs). All simulations of satellite observations were done with the use of the 6S Radiative Transfer Model (Second Simulation of a Satellite Signal in the Solar Spectrum); the vector version released in 2005 (6SV1.0B) used in these calculations provides a relative average accuracy of approximately 0.4–0.6% [23,24]. In order to extend the algorithm for all countries of interest, additional calculations of the LUTs were carried out. Because of the differences in the geographical position of the analysed countries, it was necessary to perform radiative transfer model simulations for three extra view zenith angles (52 , 70 , 73 ).

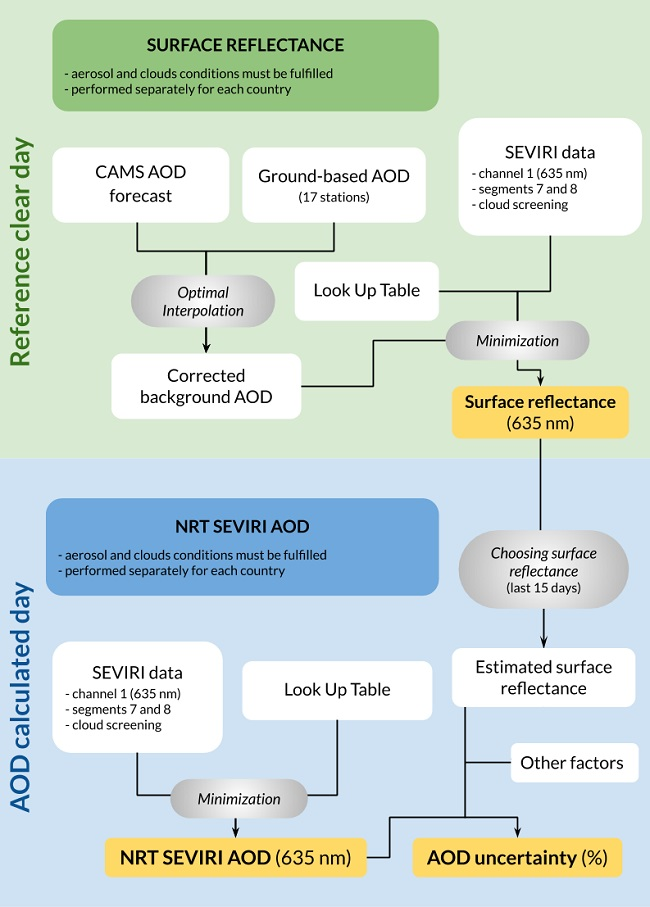
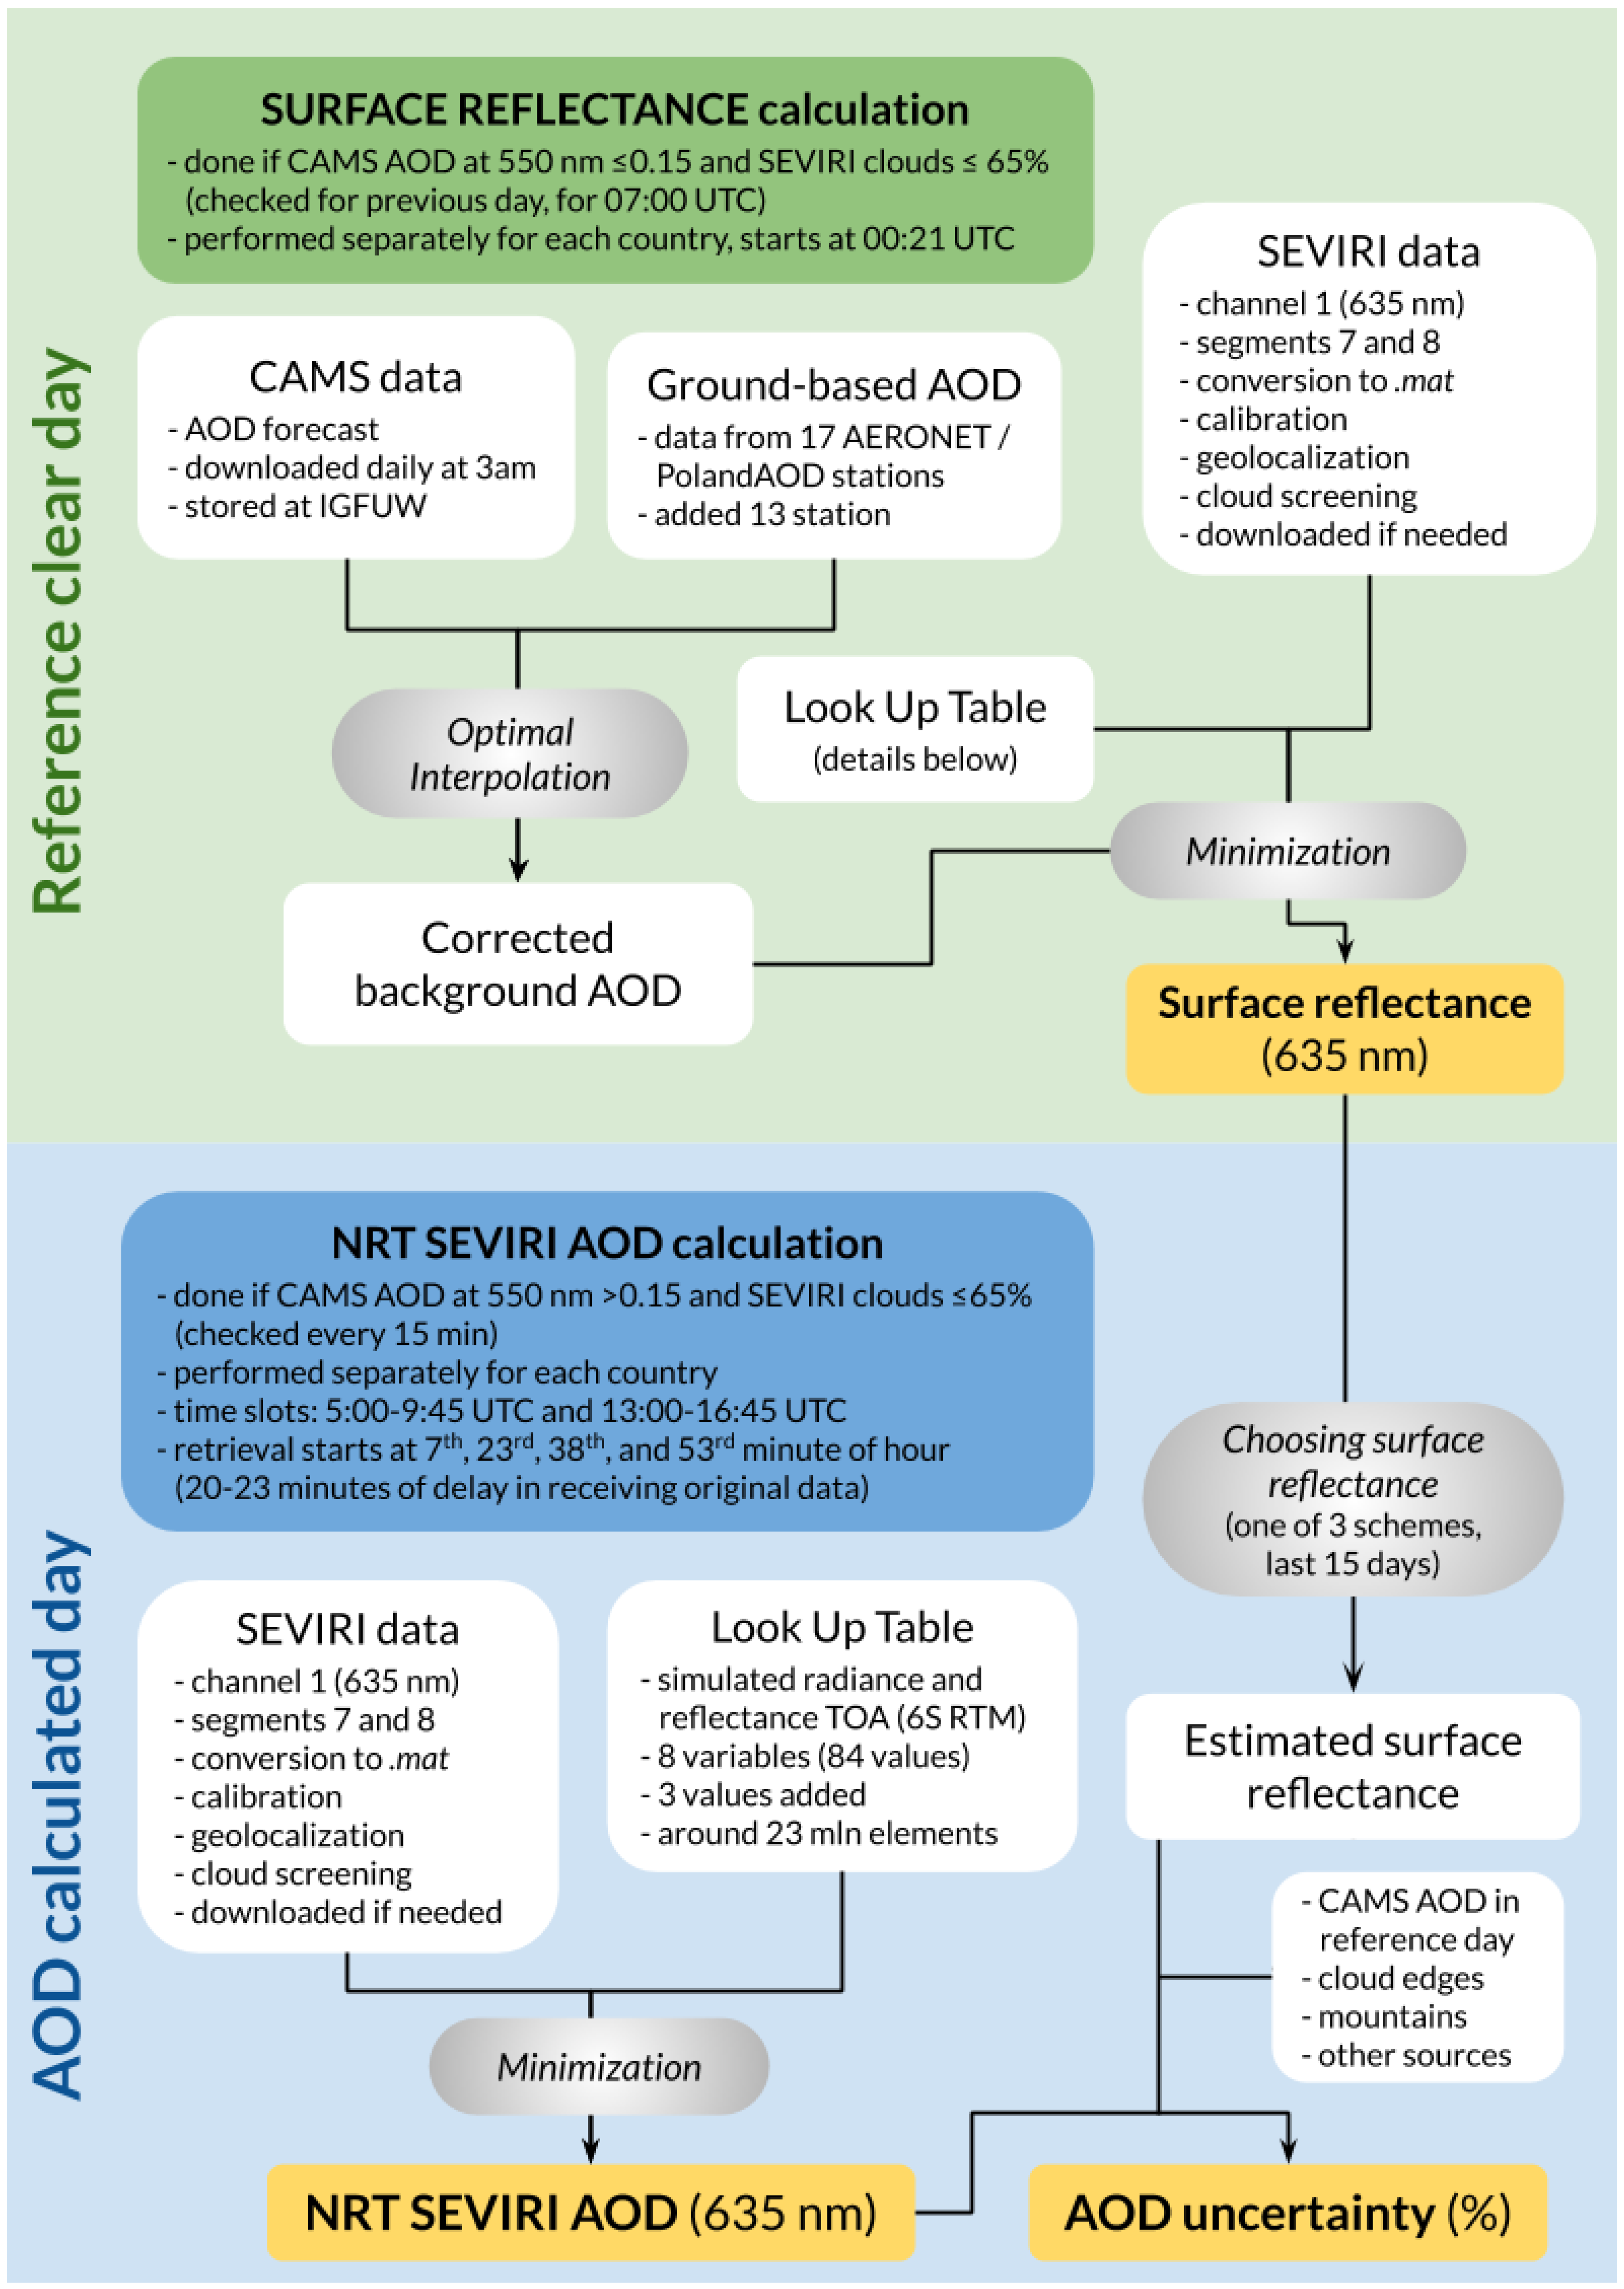
2.2. Surface Reflectance Estimation

The surface properties are estimated for particular conditions. For reference days, cases with a low aerosol load (AOD < 0.15 at 550 nm) were chosen. At the same time, these days had to be relatively cloud-free (cloud cover over country domain estimated based on the TOA reflectance measured by the SEVIRI sensor has to be <65%). The cloud-contaminated pixels were removed based on a classification obtained by using the cloud mask created and programmed by Riedi and Nicolas [25] for the SEVIRI measurements. The calculation scheme required data from channels 635, 865 and 1640 nm, and 3.9, 8.7, 10.8 and 12 μ m. Detailed information on the applied cloud mask can be found in [25] and [14].
Even for low AODs, the elimination of influence of atmospheric components (in particular atmospheric aerosols) on the reflectance measured by the sensor is still essential for a proper estimation of the surface reflectance. Thus, information on AOD on a reference (clear) day is necessary. In the proposed algorithm technically any available AOD information can be used as a source of additional data on the AOD spatial distribution, for example other satellite measurements (e.g. MODIS) or outputs from aerosol transport models (e.g. CAMS). In the described application, we decided to use the operational global-scale CAMS AOD forecast product (https://atmosphere.copernicus.eu/, accessed on 23 March 2020) as background information on the spatial distribution of AOD for the reference day [26,27]. The CAMS data choice was advantageous due to the fact that the CAMS forecast for AOD at 550 nm is operationally available on-line in near-real-time. CAMS provides a full coverage, and thus, there are no data gaps for cloudy pixels, in contrast to the available satellite AOD data. CAMS AOD forecast product for selected hours is routinely downloaded at the PolandAOD-NET Server. In order to cover the whole area of interest, data from the range: 4–30.8 E and 43.2–64.8 N were stored. Because of the significant uncertainty of the AOD derived from the CAMS data (https://atmosphere.copernicus.eu/global-services, accessed on 27 November 2019), they are corrected using the optimal interpolation approach [28] with the ground-based AOD observations.
The optimal interpolation (also known as objective mapping or Gauss-Markov smoothing) is one of the methods used in data assimilation, and it updates a prior state (here CAMS data) with a new observation (here: ground-based AOD), with weights assigned depending on the estimates of their respective accuracies (uncertainties) [28]. In other words, it estimates the field observed at a given location and time through a linear combination of the available data. The weights are chosen so that the expected error of the estimate is a minimum in the least squares sense, and the estimate itself is unbiased. It may be regarded as a Kalman filter approximation, with a set of several modifications. Detailed information on the optimal interpolation method can be found in [28,29,30,31], as well as in [14] (see Section 3.3).
For correcting CAMS data, the measurements from several stations were used (see Table 2). Most of these stations deliver data to the AERosol RObotic NETwork—AERONET (https://aeronet.gsfc.nasa.gov, accessed on 23 March 2020), one of the most spread worldwide aerosol networks [32]. AERONET uses the CIMEL Electronique 318A sun-photometers (https://www.cimel.fr, accessed on 23 March 2020) as standard instruments. The uncertainty of AOD measurements by CIMEL instruments, due primarily to calibration uncertainty, was estimated in [33] to be 0.01 in the VIS and near-IR, increasing to 0.02 in the UV (340 and 380 nm). Information on these uncertainties was used in the optimal interpolation method [14]. One of the AERONET stations, at the Remote Sensing Laboratory in Warsaw (https://www.igf.fuw.edu.pl/en/instruments/laboratorium-pomiarow-zdalnych-e91845-7230/, accessed on 23 March 2020) was created within the framework of the SAMIRA project and it utilizes the sun-photometer of Institute of Optoelectronics (INOE, Romania). The processed AERONET data were downloaded in the near-real-time during the SEVIRI AOD retrieval process, converted to the MATLAB files (.mat files) in an automatic way, and stored at the PolandAOD-NET Server. Improving CAMS AOD forecast with AERONET AOD information allows use to reduce the uncertainties related to the CAMS simulations, and thus to improve the AOD retrieval.
In the next step, surface reflectance (surfREFL) was estimated (with the use of the corrected CAMS AOD), during minimization of the difference between simulated (LUTs) and measured (SEVIRI) reflectances. The obtained results were then used to retrieve the AOD for several days after the reference day. Final SEVIRI AOD (635 nm) data were interpolated to the regular grid of 0.07 E by 0.045 N (area for each domain is given in Table 1) and saved in the NetCDF-4 classic format. Each file contains information on longitude, latitude, AOD, and uncertainty; its size per domain is provided in Table 1.

2.3. AOD Uncertainty Estimation

An analysis of the AOD retrieval results is important for finding out the uncertainty of AOD data. Unfortunately, in this case, analytic calculations of the uncertainty are highly time consuming (taking into account the large spatial domain of SEVIRI maps and, consequently, the number of pixels) and cannot be applied as the basic for NRT calculations. Therefore, the threshold approach for handling the SEVIRI AOD uncertainty estimation is proposed. It is based on a compromise between the speed and robustness of the automated data-quality-flag retrieval and, at the same time, the accurate indication of data quality. When designing the threshold approach, we used the SEVIRI AOD algorithm sensitivity study performed previously by [14] (see Section 4 in [14]).
The sensitivity study results (see Tables 2–4 in [14]) gave quantitative information on the impact of different parameters’ modification on the retrieved AOD. Three dominating factors that play a role in accurate data retrieval have been defined: (1) surface reflectance dependent on minimization with model output and ground-based data, (2) optical depth on the reference day affecting the retrieval days, and (3) optical depth on the retrieval day itself. The thresholds were set taking into account these three factors and the uncertainty is calculated automatically, as is done the AOD retrieval.
The total AOD uncertainty ( U N C ) a given pixel consists of five component uncertainties: the surface reflectance ( U s u r f R E F L ), the AOD on the reference day ( U A O D R E F ), the AOD derived on the calculation day ( U A O D ), the cloud edges ( C L ), and so-called other sources ( o t h e r ). The last component takes into account several factors, such as the single scattering albedo, the asymmetry parameter, and the measured reflectance at the top-of-atmosphere (i.e. SEVIRI measurement uncertainty of 4% [34]). The U N C is derived using the following formula:
U N C [ % ] = U s u r f R E F L · U A O D R E F · U A O D + C L + o t h e r .
The impact of the value of the derived AOD and of the value of the reference day AODREF on the total uncertainty are described as a scale factor, while the share of the remaining total uncertainty components is given in percentages. All values and thresholds (listed in Table 3) were assumed based on the sensitivity study presented in [14].
In general, the higher surfREFL and AODREF, the higher the derived total AOD uncertainty. The higher the aerosol load on the day for which the calculation was performed, the lower the total AOD uncertainty. For cloud edges, the threshold was applied in the case when a certain pixel had a directly neighboring pixel to which a cloud was flagged. Then, if the derived AOD in the pixel of interest was higher than 0.4, then the share in the total uncertainty for this pixel was assumed to be 15%. In this way, the pixels which could have been partly contaminated with clouds are accounted for (note that the cloud edges are difficult to assess and remove as they usually cover only part of the pixel). The last term in Equation (1), described as “other sources”, was estimated at the level of 10%.
After analyzing the retrieval output obtained during the preoperational test-phase, several fine-tuning adjustments were necessary to be added to the code. In the case of the uncertainty calculation, the value of the share of other sources share was increased to 15% for the Czech Republic (low number of ground-based AOD stations) and for Norway (geographic position, complicated shore-line). For the area of Romania, an additional factor was considered, which is the elevation above sea level (a.s.l.), i.e., for all pixels that cover the area located > 1 km a.s.l., the total uncertainty was increased by 10%. These adjustments were included in NRT calculations performed from April 2019 for all domains, whereby from then onwards, the maps are stored at the PolandAOD-NET Server and the High-Performance Computing Server of the Babeș-Bolyai University.
Note that one more component can be considered as playing a role in the estimation of the total uncertainty, namely the AOD ground-truth availability. As to account for this factor, if at a distance of 100 km from the given pixel, there is no ground-based AOD measurement (radius of influence assumed in the algorithm), the total uncertainty should be scaled by a certain factor (d). Thus, the SEVIRI AOD uncertainty can be corrected ( U N C c o r r ) for each pixel as follows:
U N C c o r r [ % ] = U N C [ % ] · d .
However, in the current version of the algorithm, this aspect was omitted due to the requirement posed on the speed of calculation time for NRT retrieval. It should be noted that in the case of SEVIRI spatial resolution, an additional 1 s of calculations for each pixel translates to the entire process lasting a few hours longer (e.g., for Poland, nearly 6 hours).
The described algorithm was initially used for offline calculations. These results were used in various case studies focusing on aerosol research [20,21,22,35].

3. Results

The near-real-time computation consists of two parts: the surface reflectance estimations and the AOD calculations, which are described in two subsections below. Figure 1 depicts the NRT-algorithm flowchart, that is a modification of the prototype algorithm described by [14]. Important changes that have been undertaken to optimize the algorithm are highlighted, especially in relation to the uncertainty calculations.

3.1. Surface Reflectance Calculations

The surface reflectance calculations (surfREFL) started each day at 00:21 UTC, whereby they are calculated separately for each country domain. The following conditions, checked for 7:00 UTC, considered as the most reliable time, must be fulfilled simultaneously: the mean AOD (CAMS) must be ≤0.15 and the cloud cover (SEVIRI cloud mask) must be ≤65%. If fulfilled, the surface reflectance was calculated for the previous day with the use of the following data sources: the SEVIRI data, the AERONET data, and the CAMS AOD forecast (downloaded every day at around 3 a.m.). The data of SEVIRI and AERONET were collected at a particular point of time, only when/if they are needed (so that not all data need to be collected). The SEVIRI data were collected for segments 7 and 8 in the original High Rate Information Transmission format (HRIT, https://www.eumetsat.int/website/home/Data/Products/Formats/index.html) nd pre-processed as described in [14]. The estimated surface reflectance data were stored at the PolandAOD Server for AOD retrieval.

3.2. NRT AOD Retrieval

The SEVIRI AOD retrieval starts at 7th, 23rd, 38th, and 53rd minute of each hour and is done within the time slots 5:00–9:45 UTC and 13:00–16:45 UTC. There are 20 to 23 min of delay in receiving the original data. The AOD computation takes a few minutes and it strictly depends on the number of valid pixels (cloud-free and containing a surface reflectance). The conditions which were checked for each file/time include the following: the mean AOD (CAMS) must be >0.15, and the cloud cover (SEVIRI cloud mask) must be ≤65%. If they are fulfilled simultaneously, the AOD values with their uncertainties are calculated with the use of the SEVIRI data and the surface reflectance data (calculated for a reference day being one of the previous days). The choice of the reference day for the surface reflectance calculation was done with the caveat that the span between the day for which the AOD map is derived and the closest available reference day is fewer than 15 days. Three different versions for choosing the reflectance for each pixel were introduced in the NRT code: the minimal value of the surfREFL from all reference days (used currently, to be the most reliable), the surfREFL obtained on a day with the lowest AOD, or the surfREFL from the closest day, whereby if there is no reflectance data available, an additional 2nd and 3rd days are checked.
The NRT retrieval for southern Norway is strongly limited due to the unfavorable scattering geometry in this region, a significant cloud cover, as well as long and complicated orography, especially of the coastline. Examples of NRT calculation results for each country are presented in Figure 2.

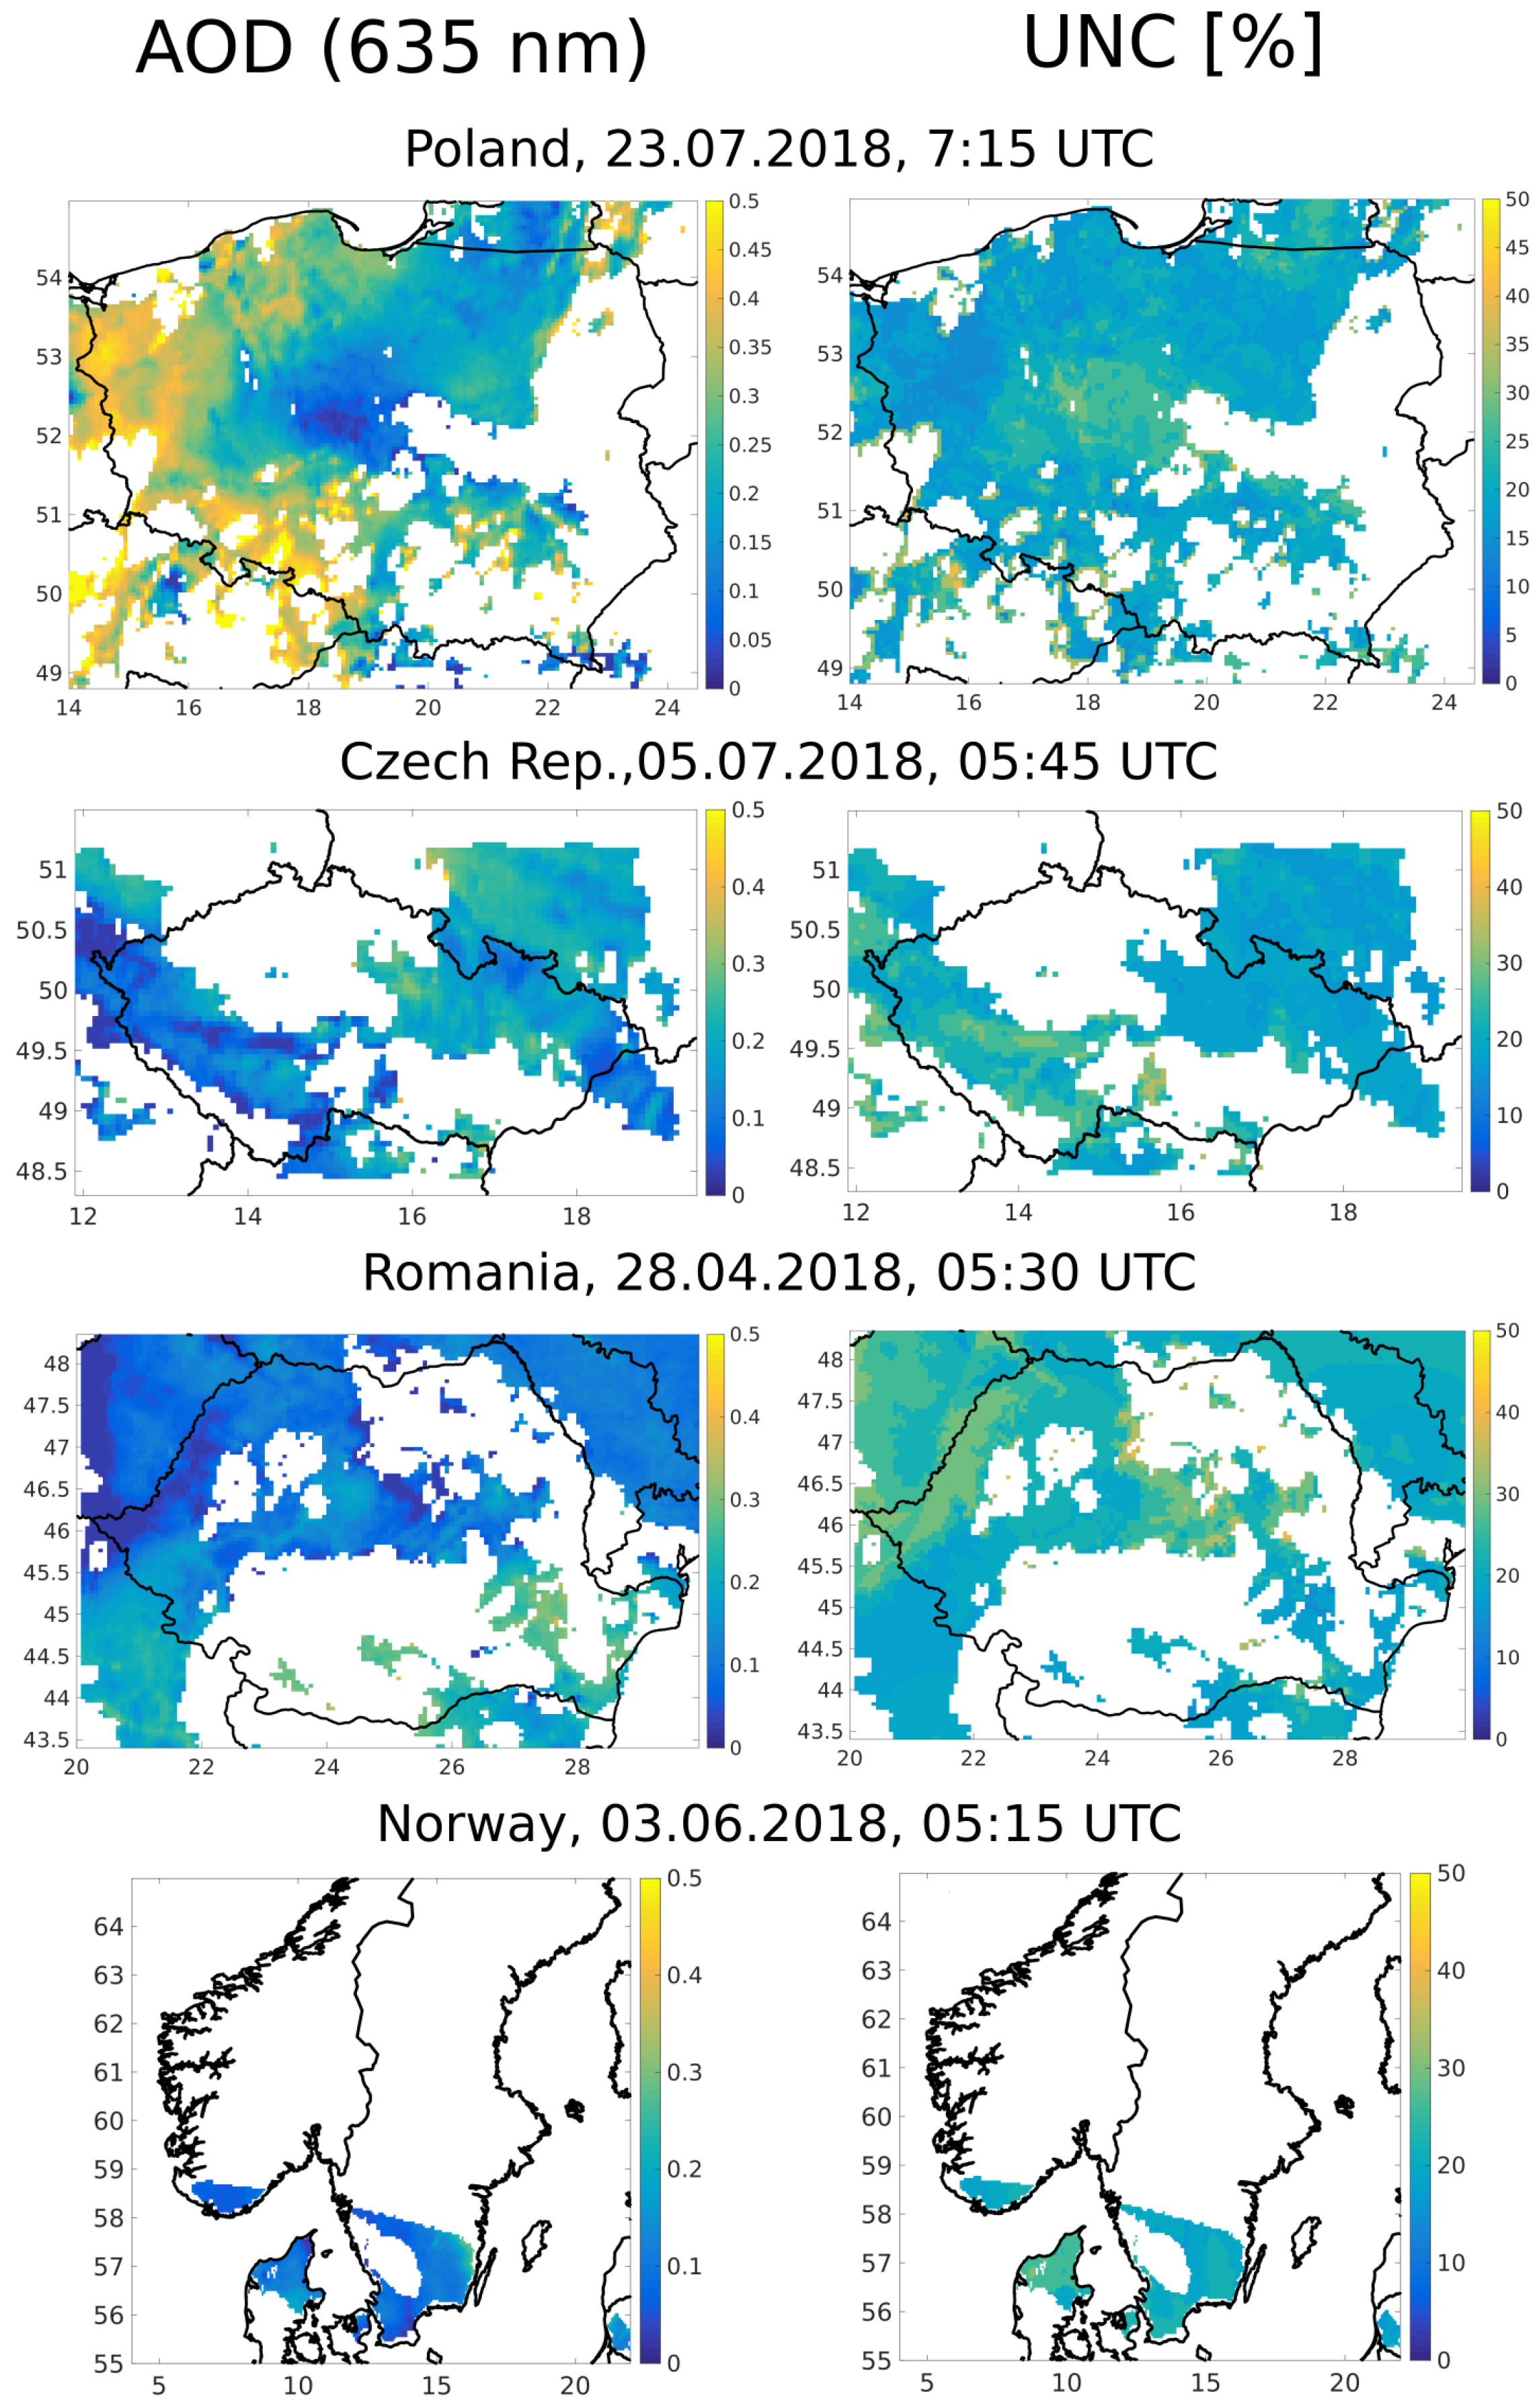
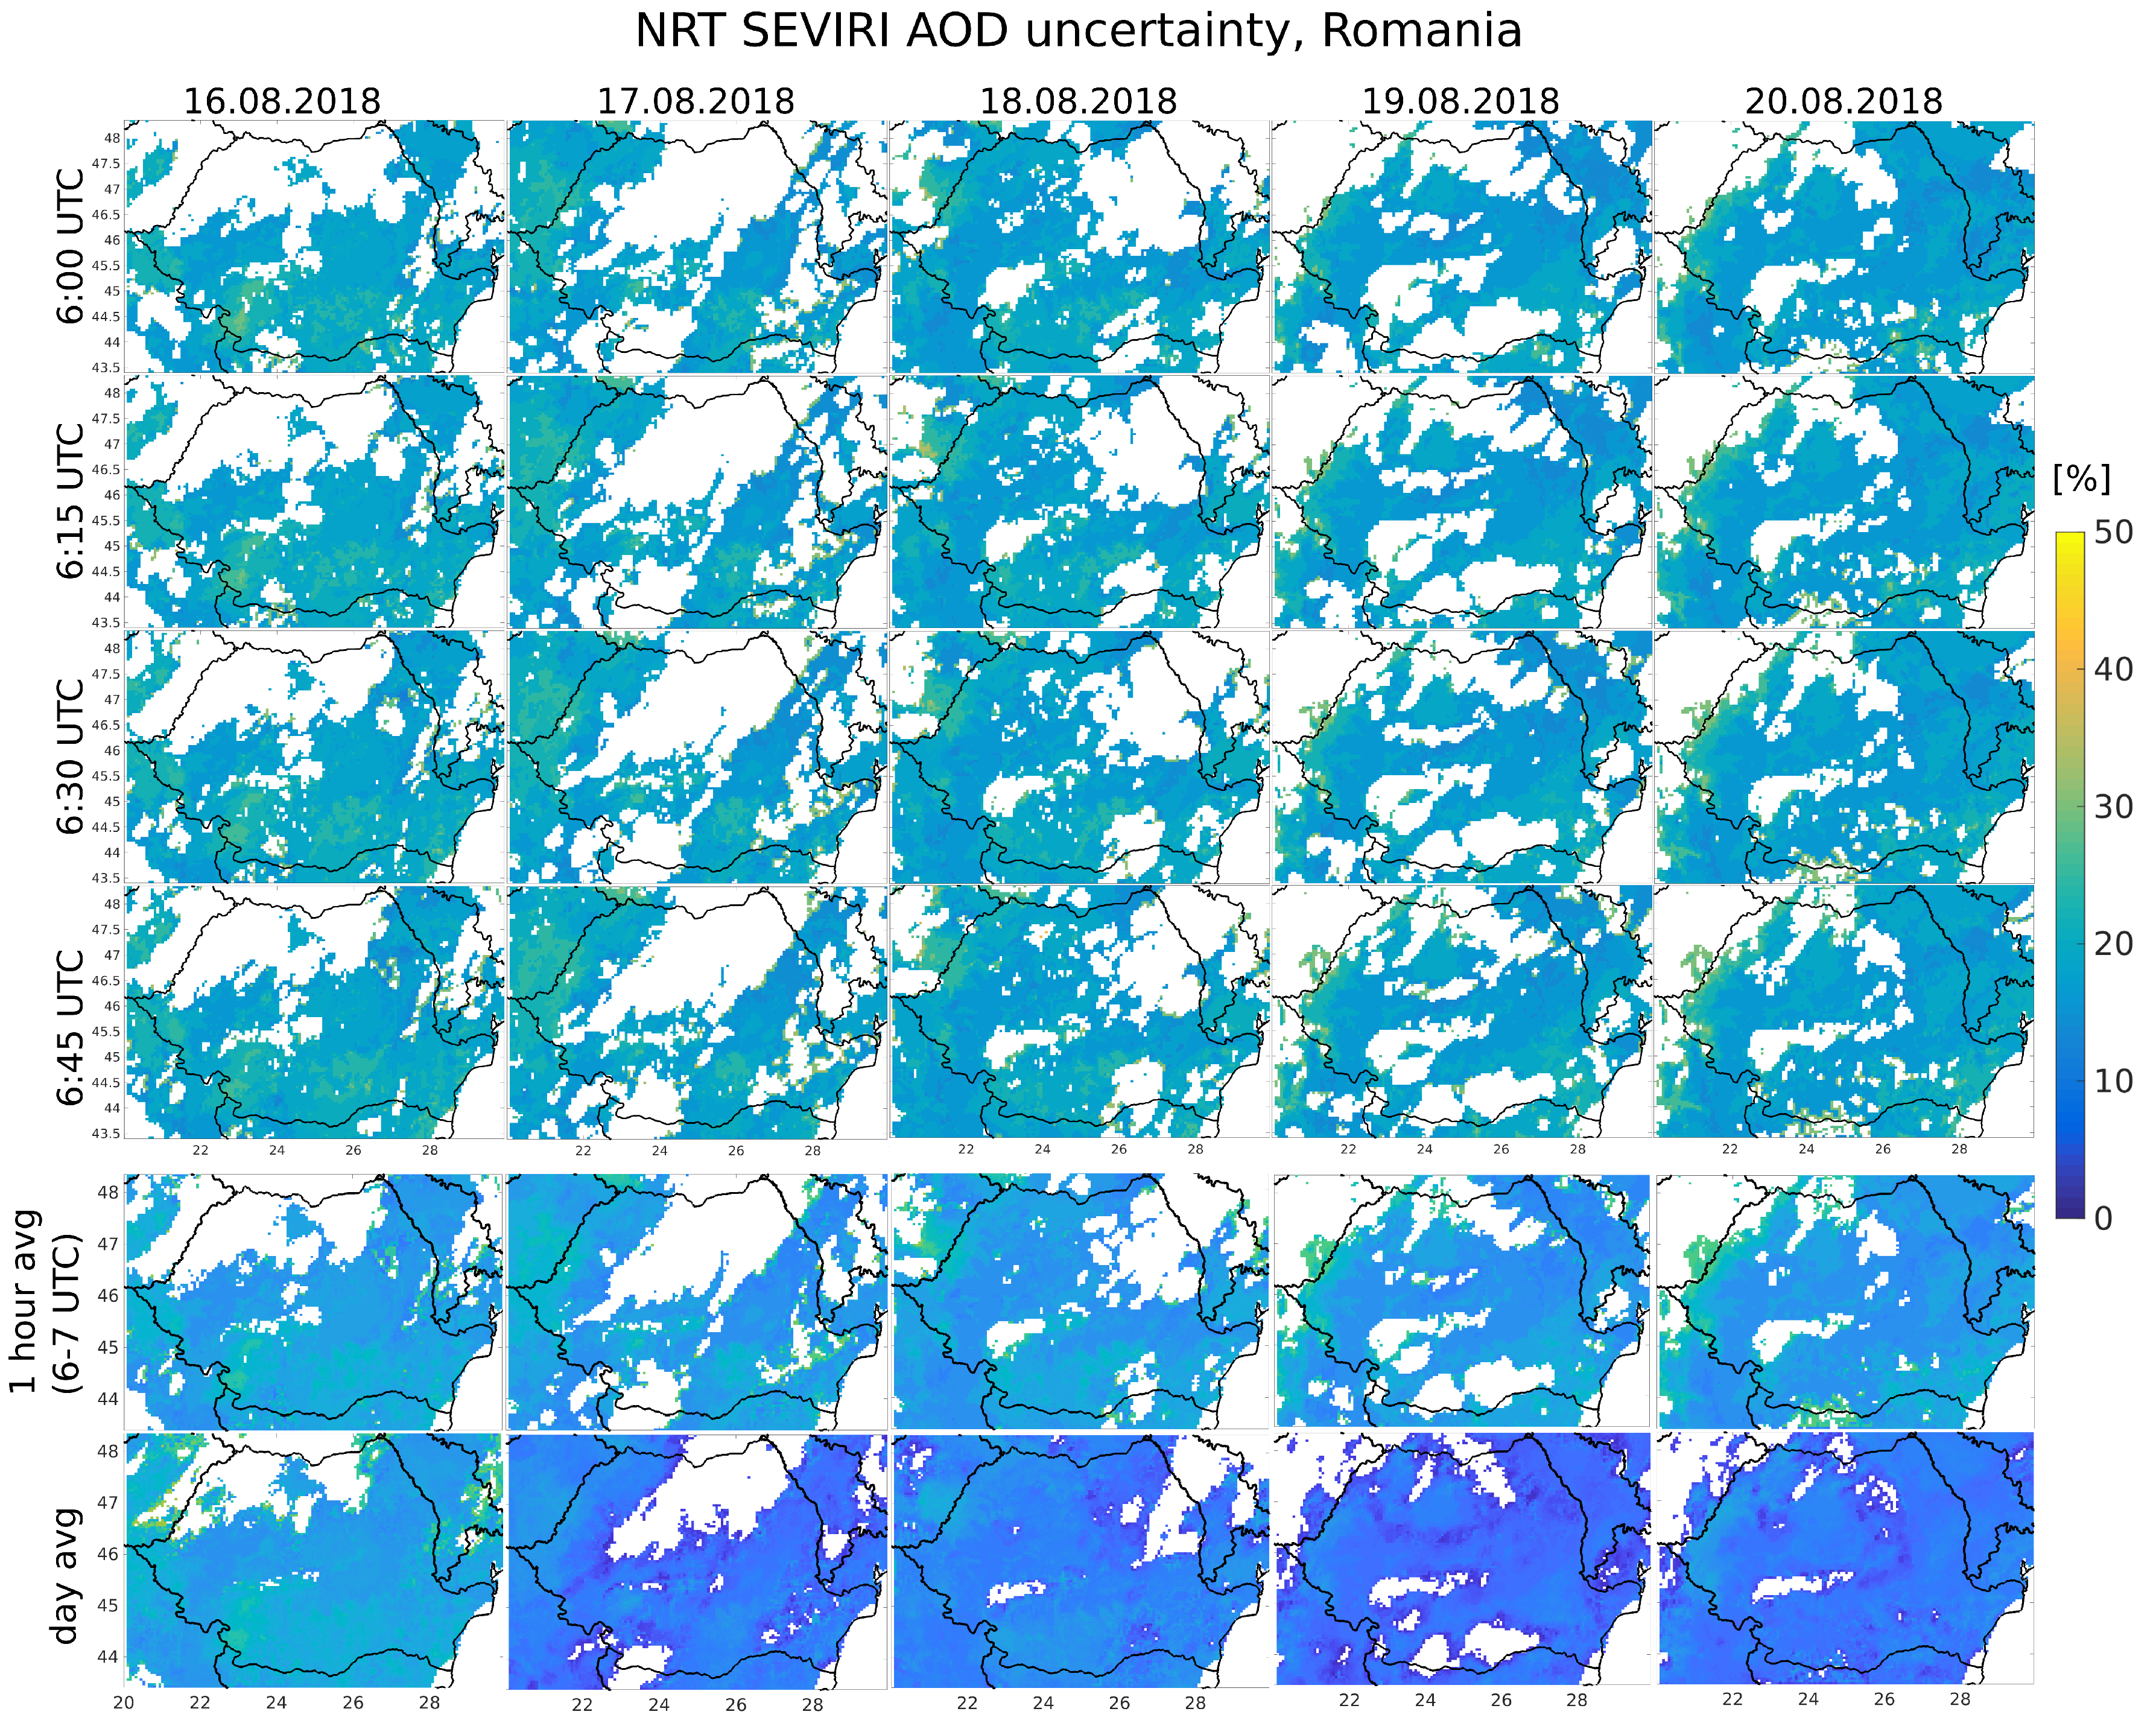
3.3. Example of the NRT Calculations

The largest number of days with available NRT AOD was registered in August 2018 for Romania (i.e., 9, 10, 12–20, 24–26, 29–31 Aug 2018). In Figure 3, several of these days are shown as an example in columns. The first four upper rows contain consecutive maps of AOD obtained with a time resolution of 15 minutes. The shown data cover the hours between 6:00 and 6:45 UTC. The remaining two rows show AOD maps for, respectively, hourly average (6:00–6:45 UTC) and a daily average of AOD data. In the latter case, all possible files for each day were taken into account. For most of the days (17–20 Aug), is clear that the hourly mean of AOD were similar to the 15 min data, while by averaging daily data detailed information was lost. In the case of 16 Aug 2018, small differences in the hourly versus daily mean indicate stable conditions of the atmosphere. Similar relationships can be observed in the AOD uncertainty (Figure 4).
The described algorithm was initially used for offline calculations. These results were used for preliminary validation of the new algorithm, as well as in various case studies focusing on aerosol research [20,21,22,35]. Results of a preliminary validation are shown in [20,21,22], where the AODs obtained from the SEVIRI data were compared with the AODs obtained by the ground-based photometer MFR-7 and CIMEL (columnar) and lidar (within boundary layer), satellite sensor MODIS, as well as aerosol transport models: NAAPS and CAMS. In general, SEVIRI AOD was in accordance with the rest of the mentioned AOD data sources.
A detailed analysis was performed for selected cases for the pixel that covers Warsaw (i.e., correlation with MFR-7 r 2 = 0.91 ) [20,21,22], and for three other locations in Poland [21] (correlation with CIMEL r 2 between 0.6 (mountain station) and 0.86).
Extensive validation of the NRT SEVIRI retrieval of the AOD product and the AOD uncertainties was conducted by the University of Babes-Bolyai (Romanian SAMIRA partner) and it was described in [36]. Their study was focused on analyzing the correlations between the four-month long SEVIRI AOD dataset (June–September 2014, retrieved in a simulated NRT mode) and the temporally closest AOD data of both ground-based (AERONET, PolandAOD) and satellite (MODIS pixels) products. The comparisons of the SEVIRI AOD with the AERONET AOD observations generally showed a good correlation (0.51–0.84). The mean bias was small (0.04–0.14) and the root mean square error (RMSE) was of about 0.1 for all comparison locations (six different sites in two countries). It should be highlighted that those results were dependent on the location (mountains, flatland, seashore) and characteristic (urban, rural) of the ground-based station and the satellite pixel used. For the pixel corresponding to the urban site over the capitol of Warsaw and its vicinity of 50 km, for 199 data points during this period, we obtained the SEVIRI averaged AOD uncertainty of 18.2%, correlation r of 0.8, bias of 0.1 and RMSE of 0.1. This was in agreement with the validation results shown in [20,21,22].

4. Discussion

Within the SAMIRA project, the NRT operation of the in-house developed algorithm for retrieval of SEVIRI AOD with a frequency of 15 min at a spatial resolution of roughly 5.5 × 5.5 km for country domains of Poland, the Czech Republic, Romania, and Southern Norway proved a success. The NRT pre-operation started in May 2018, and was followed by an intensive testing phase. Then, the adjustments described in the current paper were included in the NRT calculations performed from April 2019 onwards. The data files were automatically forwarded to the HPC server in Romania and used in other research tasks, such as the estimation of surface PM 2.5 maps over each country domain [37].
Quick-looks of the SEVIRI maps provided for all country domains are available via the SAMIRA website http://pr-samira.chmi.cz/SamiraMapServer/ (accessed on 27 November 2019). Additionally, AOD maps for Poland domain are available via the PolandAOD-NET Website (http://www.polandaod.pl/, accessed on 27 November 2019).
The limitation of the algorithm related to the surface hot-spot effect for scattering angles close to 180 and a small solar zenith angle is worth discussing. For example, for conditions above the Polish domain, the average SEVIRI zenith angle is close to 60 and the azimuth angle is close to 205 . Therefore, the AOD retrieval can be carried out usually up to 10:00 UTC and after 14:00 UTC (the exact times depend on the time of the year). For other country domains, these hours obviously differ. When the hot-spot effect appears, the retrieved AOD is affected due to increased surface reflectance. In addition, around noon hours, convective clouds develop frequently. In the case of small (sub-pixel) clouds, the TOA reflectance is significantly larger in comparison to clear pixel ones, which leads to an overestimation of the AOD. The retrieval is not feasible for late fall, winter, and early spring (due to the scattering angle and snow cover), as well as, obviously, during the night.
The choice of a reference day (a clean one, with low AOD, and clear-sky) can be an issue if these conditions are fulfilled only partially or not in the whole of the domain, which leads to an underestimation of AOD during non-reference retrieval days. For this reason, the procedure of choosing the reference days and surface reflectance was examined, improved and implemented for automatic work.
There is an issue specific to the southern Norway domain. Due to the geographic position, scattering geometry is unfavorable (satellite and sun zenith angles for this area are very high, near to the radiative transfer code limit). The long and complicated coastline of Norway results in a significant number of pixels that have to be removed. Calculations are possible and performed, yet there were only a few days for which the retrieval was feasible.
In the automatic version of NRT calculations, ground-based regular AOD measurements are required to be available for the optimal interpolation method. This can hinder retrieval for regions in which no photometer data are available, as e.g., Western Czech Republic.
The main advantage of the proposed methodology is the possibility to obtain the AOD maps with a high temporal resolution (15 min), in comparison to polar-orbiting satellites, e.g., the MODIS sensors allow to retrieve the AOD only 2 to 3 times per day. Since the surface reflectance estimation was improved based on the optimal interpolation methods with the use of ground-based measurements, it could be done similarly with the use of aerosol transport model outputs or other satellite observations.
The SEVIRI AOD NRT algorithm can also be applied for other geographical regions, with appropriate modifications. Areas with the ground-based regular AOD measurements (ideally at equidistantly spaced, well-established observational sites) would have a great advantage since it is a requirement for the optimal interpolation method.

Author Contributions

Conceptualization, O.Z.-M. and I.S.S.; methodology, O.Z.-M.; software, O.Z.-M.; formal analysis, O.Z.-M.; resources, K.M.M.; data curation, O.Z.-M.; writing–original draft preparation, O.Z.-M.; writing–review and editing, I.S.S and K.M.M; visualization, O.Z.-M.; funding acquisition, I.S.S. All authors have read and agreed to the published version of the manuscript.

Funding

This research was conducted within the framework of the SAtellite based Monitoring Initiative for Regional Air quality (SAMIRA) project funded by the ESA-ESRIN Contract No.4000117393/16/I-NB and within the framework of the Technical assistance for POlish radar and LIdar Mobile Observation System (POLIMOS) funded by ESA-ESTEC Contract No. 4000119961/16/NL/FF/mg.

Acknowledgments

The SEVIRI data was obtained from EUMETSAT, license number 50001643. This paper contains modified Copernicus Atmosphere Monitoring Service Information (2018); neither the EC nor the ECMWF are responsible for the use of any information contained herein.

Conflicts of Interest

The authors declare no conflict of interest.

References

  1. EEA. Air Quality in Europe—2019 Report; European Environment Agency Report No 10/2019; EEA: Copenhagen, Denmark, 2019; Volume 272. [Google Scholar]
  2. Aminou, D.M. MSG’s SEVIRI Instrument. ESA Bull. 2000, 111, 15–17. [Google Scholar]
  3. Govaerts, Y.M.; Arriaga, A.; Schmetz, J. Operational vicarious calibration of the MSG/SEVIRI solar channels. Adv. Space Res. 2001, 28, 21–30. [Google Scholar] [CrossRef]
  4. Govaerts, Y.M.; Wagner, S.; Lattanzio, A.; Watts, P. Joint retrieval of surface reflectance and aerosol optical depth from MSG/SEVIRI observations with an optimal estimation approach, 1. Theory. J. Geophys. Res. 2010, 115, D02203. [Google Scholar] [CrossRef]
  5. Jolivet, D.; Ramon, D.; Riedi, J.; Roebeling, R. Aerosol retrievals from METEOSAT-8. SAF on Climate Monitoring, Visiting Scientist Report 2006. Available online: https://www.knmi.nl/kennis-en-datacentrum/publicatie/aerosol-retrievals-from-meteosat-8 (accessed on 27 November 2019).
  6. Jolivet, D.; Ramon, D.; Bernard, E.; Deschamps, P.-Y.; Riedi, J.; Nicolas, J.M.; Hagolle, O. Aerosol monitoring over land using MSG/SEVIRI. In Proceedings of the EUMETSAT Meteorological Satellite Conference, Darmstadt, Germany, 8–12 September 2008. [Google Scholar]
  7. Popp, C.; Hauser, A.; Foppa, N.; Wunderle, S. Remote sensing of aerosol optical depth over central Europe from MSG-SEVIRI data and accuracy assessment with ground-based AERONET measurements. J. Geophys. Res. 2007, 112, D24S11. [Google Scholar] [CrossRef] [Green Version]
  8. Brindley, H.E.; Russell, J.E. An assessment of Saharan dust loading and the corresponding cloud-free long-wave direct radiative effect from geostationary satellite observations. J. Geophys. Res. 2009, 114, D23201. [Google Scholar] [CrossRef] [Green Version]
  9. Carrer, D.; Roujean, J.L.; Hautecoeur, O.; Elias, T. Daily estimates of aerosol optical thickness over land surface based on a directional and temporal analysis of SEVIRI MSG visible observations. J. Geophys. Res. 2010, 115, D10208. [Google Scholar] [CrossRef] [Green Version]
  10. Bernard, E.; Moulin, C.; Ramon, D.; Jolivet, D.; Riedi, J.; Nicolas, J.-M. Description and validation of an AOT product over land at the 0.6 mm channel of the SEVIRI sensor onboard MSG. Atmos. Meas. Tech. 2011, 4, 2543–2565. [Google Scholar] [CrossRef] [Green Version]
  11. Bulgin, C.E.; Palmer, P.I.; Merchant, C.J.; Siddans, R.; Gonzi, S.; Poulsen, C.A.; Gareth, E.; Thomas, G.E.; Sayer, A.M.; Carboni, E.; et al. Quantifying the response of the ORAC aerosol optical depth retrieval for MSG SEVIRI to aerosol model assumptions. J. Geophys. Res. 2011, 116, D05208. [Google Scholar] [CrossRef] [Green Version]
  12. Mei, L.; Xue, Y.; de Leeuw, G.; Holzer-Popp, T.; Guang, J.; Li, Y.; Yang, L.; Xu, X.; Li, C.; Wang, Y.; et al. Retrieval of aerosol optical depth over land based on a time series technique using MSG/SEVIRI data. Atmos. Chem. Phys. 2012, 12, 9167–9185. [Google Scholar] [CrossRef] [Green Version]
  13. Carboni, E.; Thomas, G.E.; Sayer, A.M.; Siddans, R.; Poulsen, C.A.; Grainger, R.G.; Ahn, C.; Antoine, D.; Bevan, S.; Braak, R.; et al. Intercomparison of desert dust optical depth from satellite measurements. Atmos. Meas. Tech. 2013, 5, 1973–2002. [Google Scholar] [CrossRef] [Green Version]
  14. Zawadzka, O.; Markowicz, K.M. Retrieval of Aerosol Optical Depth from Optimal Interpolation Approach Applied to SEVIRI Data. Remote. Sens. 2014, 6, 7182–7211. [Google Scholar] [CrossRef] [Green Version]
  15. Fernandes, A.P.; Riffler, M.; Ferreira, J.; Wunderle, S.; Borrego, C.; Tchepeld, O. Comparisons of aerosol optical depth provided by SEVIRI satellite observations and CAMx air quality modelling. In Proceedings of the 36th International Symposium on Remote Sensing of Environment, Berlin, Germany, 11–15 May 2015; Schreier, G., Skrovseth, P.E., Staudenrausch, H., Eds.; Copernicus Gesellschaft Mbh: Gottingen, Germany, 2015; pp. 187–193. [Google Scholar]
  16. Gonzalez, L.; Briottet, X. North Africa and Saudi Arabia day/night sandstorm survey (NASCube). Remote. Sens. 2017, 9, 896. [Google Scholar] [CrossRef] [Green Version]
  17. Sowden, M.; Mueller, U.; Blake, D. Review of surface particulate monitoring of dust events using geostationary satellite remote sensing. Atmos. Environ. 2018, 183, 154–164. [Google Scholar] [CrossRef]
  18. Clerbaux, N.; Ipe, A.; De Bock, V.; Urbain, M.; Baudrez, E.; Velazquez-Blazquez, A.; Akkermans, T.; Moreels, J.; Hollmann, R.; Selbach, N.; et al. CM SAF Aerosol Optical Depth (AOD) Data Record–Edition 1. Satell. Appl. Facil. Clim. Monit. 2017. [Google Scholar] [CrossRef]
  19. Ignatov, A.; Stowe, L. Aerosol retrievals from individual AVHRR channels. Part I: Retrieval algorithm, and transition from Dave to 6S RTM. J. Atmos. Sci. 2002, 59, 313–334. [Google Scholar] [CrossRef] [Green Version]
  20. Stachlewska, I.S.; Samson, M.; Zawadzka, O.; Harenda, K.M.; Janicka, L.; Poczta, P.; Szczepanik, D.; Heese, B.; Wang, D.; Borek, K.; et al. Modification of local urban aerosol properties by long-range transport of biomass burning aerosol. Remote. Sens. 2018, 10, 412. [Google Scholar] [CrossRef] [Green Version]
  21. Stachlewska, I.S.; Zawadzka, O.; Engelmann, R. Effect of heatwave conditions on aerosol optical properties derived from satellite and ground-based remote sensing over Poland. Remote. Sens. 2017, 9, 1199. [Google Scholar] [CrossRef] [Green Version]
  22. Zawadzka, O.; Stachlewska, I.S.; Markowicz, K.M.; Nemuc, A.; Stebel, K. Validation of new satellite aerosol optical depth retrieval algorithm using Raman lidar observations at Radiative Transfer Laboratory in Warsaw. EPJ Web Conf. 2018, 176, 04008. [Google Scholar] [CrossRef] [Green Version]
  23. Vermote, E.; Tanré, D.; Deuzé, J.; Herman, M.; Morcrette, J.J. Second Simulation of the Satellite Signal in the Solar Spectrum, 6S: An overview. IEEE Trans. Geosci. Remote. Sens. 1997, 35, 675–686. [Google Scholar] [CrossRef] [Green Version]
  24. Vermote, E.; Tanré, D.; Deuzé, J.; Herman, M.; Morcrette, J.J.; Kotchenova, S.Y. Second Simulation of a Satellite Signal in the Solar Spectrum—Vector (6SV); Laboratoire d’Optique Atmosphérique: Lille, France, 2006. [Google Scholar]
  25. Riedi, J.; Nicolas, J.M. Science Modules msg.c; Laboratoire d’Optique Atmospherique: Lille, France, 2005. [Google Scholar]
  26. Benedetti, A.; Morcrette, J.-J.; Boucher, O.; Dethof, A.; Engelen, R.J.; Fischer, M.; Flentjes, H.; Huneeus, N.; Jones, L.; Kaiser, J.W.; et al. Aerosol analysis and forecast in the ECMWF Integrated Forecast System. Part II: Data assimilation. J. Geophys. Res. 2009, 114, D13205. [Google Scholar] [CrossRef] [Green Version]
  27. Morcrette, J.-J.; Boucher, O.; Jones, L.; Salmond, D.; Bechtold, P.; Beljaars, A.; Benedetti, A.; Bonet, A.; Kaiser, J.W.; Razinger, M.; et al. Aerosol analysis and forecast in the ECMWF Integrated Forecast System. Part I: Forward modelling. J. Geophys. Res. 2009, 114D, D06206. [Google Scholar]
  28. Rodgers, C. Inverse Methods for Atmospheric Sounding: Theory and Practice; World Scientific: Singapore, 2002. [Google Scholar]
  29. Kalnay, E. Atmospheric Modeling, Data Assimilation, and Predictability; Cambridge University Press: New York, NY, USA, 2003. [Google Scholar]
  30. Ghill, M.; Malanotte-Rizzoli, P. Data assimilation in meteorology and oceanography. Adv. Geophys. 1991, 33, 141–266. [Google Scholar]
  31. Talagrand, O. Assimilation of observations, an introduction. J. Meteorol. Soc. Jpn. 1997, 75, 191–209. [Google Scholar] [CrossRef] [Green Version]
  32. Holben, B.N.; Eck, T.F.; Slutsker, I.; Tanré, D.; Buis, J.P.; Setzer, A.; Vermote, E.; Reagan, J.A.; Kaufman, Y.J.; Nakajima, T.; et al. AERONET—A federated instrument network and data archive for aerosol characterization. Remote. Sens. Environ. 1998, 66, 1–16. [Google Scholar] [CrossRef]
  33. Eck, T.F.; Holben, B.N.; Reid, J.S.; Dubovik, O.; Smirnov, A.; O’Neill, N.T.; Slutsker, I.; Kinne, S. Wavelength dependence of the optical depth of biomass burning, urban and desert dust aerosols. J. Geophys. Res. 1999, 104, 31333–31350. [Google Scholar] [CrossRef]
  34. EUMETSAT. Typical Radiometric Accuracy Noise MSG-1/2. Available online: https://www.eumetsat.int/website/wcm/idc/idcplg?IdcService=GET_FILE&dDocName=PDF_TYP_RADIOMET_ACC_MSG-1-2&RevisionSelectionMethod=LatestReleased&Rendition=Web (accessed on 27 November 2019).
  35. Wang, D.; Szczepanik, D.; Stachlewska, I.S. Interrelations between surface, boundary layer, and columnar aerosol properties over a continental urban site. Atmos. Chem. Phys. Discuss. 2019, 19, 13097–13128. [Google Scholar] [CrossRef] [Green Version]
  36. Ajtai, N.; Radovici, A.; Mereuta, A.; Botezan, C.; Stachlewska, I.; Zawadzka-Manko, O.; Stebel, K.; Zehner, C.; Stefanie, H. SEVIRI Aerosol Optical Depth validation using AERONET and MODIS data in central and eastern Europe. Remote Sens. in preparation.
  37. Boldeanu, M.; Nemuc, A.; Nicolae, D.; Nicolae, V.; Zawadzka-Manko, O.; Stachlewska, I.S.; Ajtai, N.; Dumitrache, R. AOD to PM2.5 conversion algorithm using WRF-Chem and satellite data. Remote Sens. in preparation.
Figure 1. Flowchart of the NRT SEVIRI AOD algorithm.
Remotesensing 12 01481 g001
Figure 2. Examples of the SEVIRI AOD at 635 nm (left column) and AOD uncertainty (UNC) (in %, right column) for four country domains for Romania. Data were obtained from NRT calculations.
Remotesensing 12 01481 g002
Figure 3. SEVIRI AOD at 635 nm in the country domain for Romania. Data were obtained from NRT calculations. In four upper rows, 15 min AOD maps are presented for days 16–20 August 2018. The last two rows contain hourly averages (6:00–6:45 UTC) and daily averages (all possible files for each day).
Remotesensing 12 01481 g003
Figure 4. SEVIRI AOD uncertainty (UNC in %) in the country domain for Romania. Data were obtained from NRT calculations. In four upper rows, 15 min UNC maps are presented for days 16–20 August 2018. The last two rows contain hourly average (6:00–6:45 UTC) and daily average uncertainties (all possible files for each day).
Remotesensing 12 01481 g004
Table 1. Area coverage for each domain chosen for near-real-time (NRT) Spinning Enhanced Visible and Infrared Imager (SEVIRI) aerosol optical depth (AOD) map calculations. “Res.” stands for resolution.
CountryLongitudeRes.LatitudeRes.Domain (Pixels)File Size (.nc)
Poland14–24.5 E0.07 48.8–55 N0.045 138 × 151685 kB
Romania20–29.94 E0.07 43.4–48.36 N0.045 111 × 143527 kB
Czech11.9–19.46 E0.07 48.3–51.49 N0.045 72 × 109270 kB
Norway4–21.99 E0.07 55–64.99 N0.045 223 × 2581.9 MB
Table 2. List of ground-based stations providing AOD data for NRT SEVIRI AOD algorithm. The station marked with a is part of the Poland AOD-NET, while stations marked with b are part of both Aerosol Robotic Network (AERONET) and PolandAOD-NET. It should be noted that data from Sopot station is currently unavailable (since September 2018), however, it was used for calculations made for years 2014 and 2016.
CountryStationInstrumentLON [ ]LAT [ ]
BelskCIMEL20.79251.837
RaciborzCIMEL18.19050.080
PolandRzecinCIMEL16.31052.762
Sopot a MFR-718.56554.451
Strzyzow b CIMEL, MFR-721.86149.879
Warsaw b CIMEL, MFR-720.97052.210
BucarestCIMEL26.03044.348
ClujCIMEL23.55146.768
EforieCIMEL28.63244.075
RomaniaGalata Platform (Bulgaria)CIMEL28.19343.045
GloriaCIMEL29.36044.600
IasiCIMEL27.55647.193
Kishinev (Moldova)CIMEL28.81647.000
CzechBrno AirportCIMEL16.68349.156
BirkenesCIMEL8.25258.388
NorwayGustaw Dalen Tower (Sweden)CIMEL17.46758.594
Palgrunden (Sweden)CIMEL13.15258.755
Table 3. Thresholds and values of uncertainties given for five components of the total SEVIRI AOD uncertainty.
ComponentThresholdsShare of Total Uncertainty
surfREFL ≤ 0.0254%
UsurfREFL0.025 < surfREFL ≤ 0.056%
0.05 < surfREFL ≤ 0.18%
0.1 < surfREFL10%
AODREF ≤ 0.050.8
UAODREF0.05 < AODREF ≤ 0.11
0.1 < AODREF ≤ 0.151.2
0.15 < AODREF1.5
AOD ≤ 0.152
UAOD0.15 < AOD ≤ 0.31.5
0.3 < AOD ≤ 0.51
0.5 < AOD0.5
CLcloudy neighbour, AOD > 0.40 or 15%
Other sourcesconstant value10%

