Abstract
The ice shelf controls the ice flow and affects the rates of sea level rise. Its stability is affected by the basal channel to some extent. However, despite its importance, high spatiotemporal variation in the length of the basal channels and influencing factors remain poorly characterized. Here, we present evidence from satellite and airborne remote-sensing for the basal channel beneath the floating Nioghalvfjerdsfjorden (79 North Glacier) ice shelf in Northeast Greenland. We observe the surface depression of the ice shelf using IceBridge, which is an ongoing NASA mission to monitor changes in polar ice. We find that the basal channel corresponds with the depression. Temporal and spatial changes of the basal channels from 2000 to 2018 are obtained annually. The results show that the main influencing factor affecting the basal channel is the sea surface temperature (SST), and the major area of the channel length change is found in the midstream area of the ice shelf.
1. Introduction
Basal melting has a broad impact on the stability of polar ice shelves and is the main cause of ice loss [1]. Numerous studies have shown that basal melting contributes to a large part of the mass loss of an ice shelf [2,3,4]. Long-term, sustained and high-speed basal melt rates will cause thinning of the ice shelves, which will pose a great threat to the stability of ice shelves and ice sheets, causing the loss of polar ice and sea level rise, especially in regions where the basal melting is greatly affected by the influence of warm waters [4,5,6,7]. The effects of basal melting on polar ice shelves have been evaluated and studied on a large scale [8,9,10,11,12,13,14]. However, research on the changes and stability of ice shelves based on a smaller scale of basal melting is very limited. The basal channel is an important morphological feature of local small-scale changes caused by the basal melting of ice shelves, and its effect on an ice shelf has attracted the attention of scholars [14,15,16]. Studies have been performed to confirm the existence of the basal channel using satellite altimetry, remote-sensing images, and radar data [13,14,15,16,17]. However, there are still considerable deficiencies in the research and understanding of the evolution process of basal channels and their influence on the melting and stability of ice shelves.
Basal channels are formed and exist at the bottom of ice shelves, mostly due to the rising plume of meltwater at the base of an ice shelf because of buoyancy, appearing similar to an upside-down river. A study found that basal channels are common at the bottoms of polar ice shelves, especially in areas where there is significant melting at the bottom [15,18], such as the Petermann Glacier in Greenland and the Pine Island Glacier in the Antarctic [14,19,20,21,22]. Other researchers have noted that similar channels exist at the bottom of some ice shelves without significant melting, and these channels are mainly caused by melting water at the bottom of the ice sheet, such as the discharge of subglacial lakes or glacial suture areas [17,23,24]. Using satellite images, altimetry data and airborne ice-penetrating radar as verification data, Alley (2016) found that most basal channels exist in new crevasses, thus concluding that the appearance of basal channels may lead to ice shelf collapse in some regions [25,26]. Due to the limited availability of observational data and research, there are still disputes about the effects of basal channels on the stability of ice shelves, and no consistent conclusion has been reached. Research on basal channel models also confirms this controversy. Gladish et al. (2012) and Millgate et al. (2013) found that a decrease in the melting rate at the bottom of an ice shelf could help protect the ice shelf [27,28]. Vaughan et al. (2012) and Sergienko et al. (2013) used model research on the internal stress of an ice shelf to show that the basal channel will increase the internal stress of an ice shelf, leading to breakage and weakened stability [29,30]. Therefore, monitoring and analyzing the temporal and spatial changes of the basal channel in an ice shelf can provide important reference values for subsequent ice shelf stability studies.
Basal channels are located at the bottom of ice shelves, which can be tens to hundreds of meters high, making the channels difficult to observe directly over a large range or long time series [15]. Ice-penetrating radar observations are the most direct and effective technique for obtaining basal channel data [31,32,33,34]. However, due to the special geographical location and environment of the poles, the relevant data obtained using this technology are very limited [35]. Considering that an ice shelf is an elastic fluid, a basal channel will cause changes in the morphological characteristics of the ice shelf surface [36,37,38,39,40]. By using satellite image and satellite altimetry data, the information of the basal channel can be obtained through changes in the morphological characteristics of the ice shelf surface [17,25]. Benefiting from the all-weather, long-term and wide-range technical advantages of satellite observations, using satellite imagery and altimetry data combined with limited ice-penetrating radar observations for verification is the most effective method for observing the long-term evolution process of a basal channel. Nioghalvfjerdsfjorden (also referred to as 79 North Glacier, hereafter, 79NG) is a major outlet glacier in Northeast Greenland [24,41,42,43,44,45,46,47]. It is the main overflow glacier in Northeast Greenland, and the mass loss of its overflow ice shelf mainly comes from the ice–sea contact surface [48,49]. Therefore, whether basal channels exist under 79NG and how different influencing factors affect basal channel changes is worthy of attention.
We have mapped and analyzed variation of the basal channel of the 79NG ice shelf in Northeast Greenland from 2000 to 2018. The basal channel was identified using the surface visible in satellite imagery, and the result was validated through NASA’s Operation IceBridge. Satellite laser altimetry profiles from the Ice, Cloud and land Elevation (ICESat) mission were also used to verify the accuracy of the depression extraction on the ice shelf surface. To explain the reliability of the basal channel extraction process at the physical level, ANSYS finite element software was used to simulate the surface movement of the ice shelf with and without a basal channel. It also provides a strong theoretical basis for visual interpretation to extract basal channels. To further investigate the spatial and temporal changes of the basal channel, factors such as the sea surface temperature (SST), surface melting days and calving front of the 79 NG ice shelf were analyzed and discussed.
2. Materials
2.1. Study Area
The 79NG ice shelf is located at Northeast Greenland as shown in Figure 1, with a length of more than 70 km and a width of 20 km at mid-distance. The grounding line is 600 meters below sea level. 79NG and Zachariæ Isstrøm (ZI) discharge the majority of the Northeast Greenland Ice Stream, whose drainage basin area is more than . This region has the potential to raise the global sea level by 1.1 m in the unlikely case of a complete loss of this ice sheet. The maximum ice velocity of the 79NG ice shelf at the grounding line can reach ~1.4 km/yr. The speed slows down at the calving front, mainly due to the limitations imposed by some islands and ice. Mouginot (2015) used data from NASA’s Operation IceBridge to show that the 79 NG ice shelf lost 30% of its thickness at the grounding line between 1999 and 2014 [48]. Based on a comprehensive analysis of the ice shelf surface characteristics, ice thickness and bedrock data, Mayer (2018) found that the 79NG ice shelf has been in an unstable state since at least 2001, and the corresponding changes cannot be caused by ice flux or surface melting. According to the 2012 ice-penetrating radar direction along the ice velocity, most of the ice shelves above the first airborne radar flight paths are more than 250 meters thick. The ice shelves between the first and the third path are between 200 and 230 meters thick. The ice shelves below the third path are all less than 200 meters thick. For the reasons mentioned above, the 79NG ice shelf was divided into three sections according to the airborne radar flight paths: upstream (above the first flight path), midstream (between the first and third paths) and downstream (below the third path).
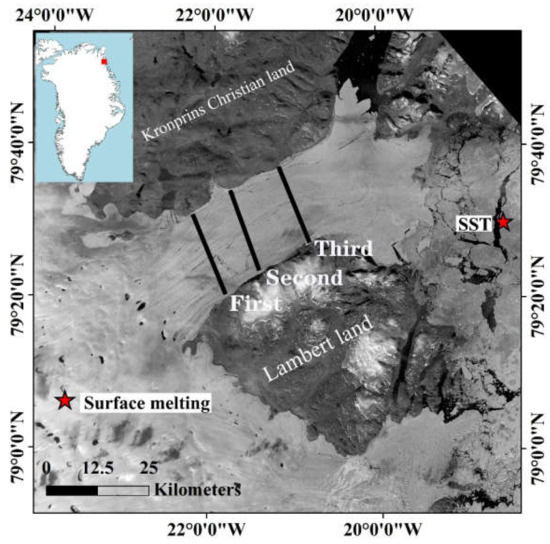
Figure 1.
79NG ice shelf of Landsat 7. The black solid lines represent airborne radar flight paths in 2012 and 2017 (the first and second solid black lines are the common route positions of 2012 and 2017 ice bridge data; the third black solid line is the exclusive route of 2012). Greenland surface melting: the red star in lower left corner represents the position of the central point and the spatial resolution of the dataset is. Sea Surface Temperature (SST): the red star in upper right corner represents the position of central point and the spatial resolution of the dataset.
2.2. Data
2.2.1. Landsat
The Landsat series of satellite imagery data were obtained from the official website of the United States Geology Survey (USGS). Nineteen images were used in this paper, which are all panchromatic (band 8) data from Landsat 7/8 with a 15 m spatial resolution, as shown in Table 1. These data were used to extract the morphological features of the ice shelf surface. The acquisition time of selected images were limited from the end of June to the beginning of August. The surface information is clear within this time interval, which is more conducive to the extraction of surface morphological features.

Table 1.
Summary of Landsat images used in this study.
2.2.2. ICESat
ICESat is a satellite launched by NASA in January 2003 for the study of polar regions. It has an orbital altitude of 600 km, an inclination of 94°, a revisit period of 91 days, a light spot diameter of 72 m and a sampling interval of 173 m [42,43]. The observation period is from October 2003 to October 2009, but due to the technical faults of the satellite laser, it adopts a mission mode for observation and observes only two or three phases every year. Its primary goal is to quantify the material balance of the ice sheet to understand the impact of climate and environmental changes on polar ice reserves and global sea level changes. This dataset is mainly used for surface depression confirmation during basal channel extraction.
2.2.3. IceBridge
The IceBridge data acquired by NASA’s IceBridge program combine a variety of airborne equipment to obtain ice sheet surface topography, bedrock topography, grounding line location, ice thickness, sea ice distribution and other Arctic and Antarctic data [44,45]. In this paper, IceBridge was used to obtain ice shelf surface and bottom terrain. The distribution of the basal channel was verified by IceBridge to ensure its accuracy. The product has an along-track resolution of approximately 25 m and a sample spacing of approximately 14 m. Although IceBridge data include very limited observations in the study area, observations along the ice shelf cross-section in 2012 and 2017 effectively validate and screen the basal channel extraction results.
2.2.4. Grounding Line
The location of the grounding zone marks the area where the ocean terminal glacier begins to float. The detection of the grounding line presently consists of field detection and remote-sensing extraction. Considering the elastic fluid characteristics of the ice shelf, a grounding zone is formed under the action of ocean tides. This means that the area between two grounding lines is the grounding zone. To more accurately distinguish the type of basal channel, this paper used the grounding line provided by the Climate Change Initiative (CCI) as the judgment basis [24]. The dataset includes five outflow glaciers in northern Greenland.
2.2.5. Greenland Topographic Data
To determine the location of the subglacial drainage outlet, the subglacial drainage system needs to be simulated using the Greenland bed and surface digital elevation model (DEM) and bed DEM as input parameters for the calculation [50]. The spatial resolution of the two types of data is 150 meters. The overall RMS of the differences between the DEM and ICESat elevation is ±9.1 m, as provided by the Ice Sheet Modeling Group [51]. The accuracy of the bed topography data can reach 35 m, and the error can be large in locations with higher ice velocities (greater than 300 m per year).
3. Methods
3.1. Basal Channel Formation and Surface Depression
The main simulation analysis tool used is finite element analysis (FEA). In this paper, ANSYS finite element software was used to simulate the creep process of the ice shelf [52,53]. Some influencing factors are not considered, such as ice melting and snowfall. The relationship between the basal channel and ice shelf surface depression was explained by the Norton creep model, which is commonly applied for creep regimes. The specific form of the Norton creep model is as follows [54,55,56]:
: Change in equivalent creep strain with respect to time
A: Creep strain hardening coefficient
: Equivalent stress
n: Glen index
Q: Creep activation energy
t: Temperature ()
Assuming that the ice shelf temperature is a constant value and that the equivalent creep rate is independent of the temperature, Equation (1) is simplified as follows:
This simplified equation is called Glen’s Law [39]. We use the simulated glacier motion parameters proposed by Cuffey: and [57]. Figure 2 shows the flow chart of the software simulation. The effect of the presence of a basal channel on the ice shelf was shown in Figure 3:

Figure 2.
Creep simulation flowchart.
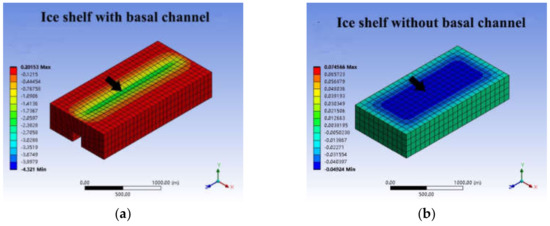
Figure 3.
The annual deformation of the ice shelf under the action of its own gravity and buoyancy effect of seawater. (a) The ice shelf with a basal channel, the corresponding position of surface appears obvious depression. (b) The ice shelf with no basal channel, there is no obvious depression on the ice shelf surface ( year = seconds). The model of the ice shelf is and the basal channel is (Length × Width × Height). The model resolution is 100 m.
Through the continuous tracking displacement of one point on the ice shelf surface (black arrow in Figure 3), it was found that an ice shelf underlain by a basal channel exhibited a strong rate of subsidence. For an ice shelf without a basal channel, the surface depression where the surface of the ice shelf changes most with time is significantly less than that under the former condition as shown in Figure 4. This also confirms the results obtained by previous studies [17,25].
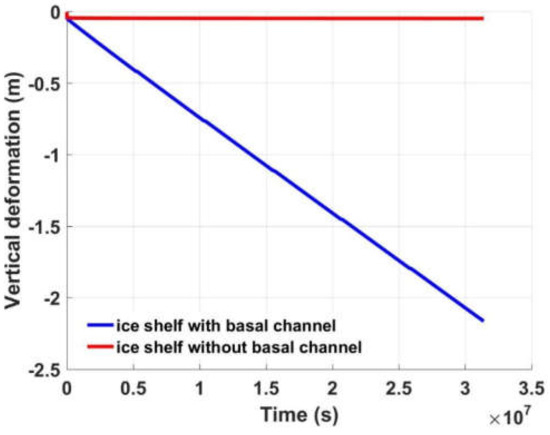
Figure 4.
The annual vertical displacement at the geometric center of the ice shelf surface. (The location is indicated by the black arrow in Figure 2).
3.2. Formation and Identification of Basal Channels
Basal channels are identified as surface depressions visible in satellite imagery due to the correlation between the surface depression and the basal channel [25]. Alley et al. (2016) developed three channel categories based on whether the channels intersect the grounding line and whether they are coincident with the simulated location of subglacial outflow. Based on the above standards, basal channels can be divided into subglacially-sourced channels, grounding-line-sourced channels and ocean-sourced channels. The formation of a subglacially-sourced channel occurs when the fresh water released by the subglacial drainage outlets is less salty than the surrounding sea water. The fresh water continues to cut through the bottom of the ice shelf as it rises in a plume along the subglacial surface, creating a basal channel based on the drainage of the subglacial river. The prerequisite for the formation of a grounding-line-sourced channel is that the warmer seawater at the bottom generates enough melt water near the grounding line. Similar to the formation process of the subglacially-sourced channel, the freshwater density generated by melting under the action of the warm seawater at the bottom of the ice shelf is lower than that of the surrounding seawater. Under the action of buoyancy, it will rise along the surface of the ice shelf and continuously cut the ice shelf to form a channel at the base of the ice shelf. The ocean-sourced channel is formed by the same principle as the grounding-line-sourced channel. When the warm water layer at the bottom is thick, the starting position of the channel is far from the ground line. The specific processes of the extraction of different types of basal channels are shown in Figure 5.
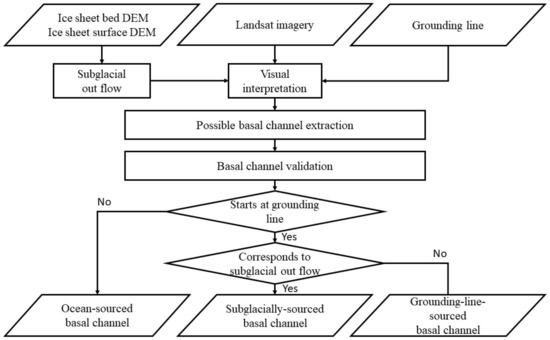
Figure 5.
Basal channel extraction flowchart.
To ensure the accuracy of the basal channel extraction results, ICESat and IceBridge data were used to validate and filter the extraction results.
Figure 6b shows that the depression on the surface is perennial. The depth of the depression passed by track 1325 is approximately 12 meters, and the depth of the depression passed by track 0343 is approximately 20 meters. Based on this finding, it can be preliminarily determined that the surface depression obtained by visual interpretation based on Landsat images is desirable.
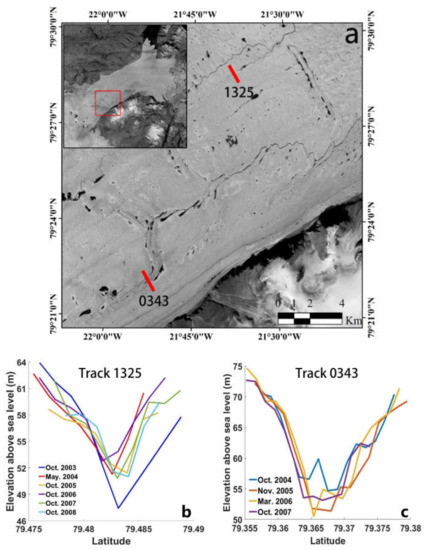
Figure 6.
An example of a depression on the 79NG ice shelf verified by ICESat. (a) Depression distribution on the surface of 79NG ice shelf. The solid red line indicates ICESat satellite orbit. (b) and (c) represent the ICESat data track 1325 and track 0343 respectively.
IceBridge validation data of three flight courses covering the ice shelf in 2012 and two in 2017 are shown in Figure 1. To more intuitively understand the correlation between the surface features and basal channels, Figure 7 shows the Landsat imagery of the ice shelf surface and their corresponding IceBridge data, respectively. The positions with dark grey values in Figure 7a usually correspond to depressions on the ice shelf surface. Figure 7b shows the shape of the basal channel (the red line within the yellow area). The channel has obvious “bulges” and the morphological characteristics are the opposite of those at the surface (blue line). This indicates that it is feasible to extract the basal channel. The remaining IceBridge data used for surface depression verification are shown in Appendix A (Figure A1, Figure A2, Figure A3 and Figure A4).
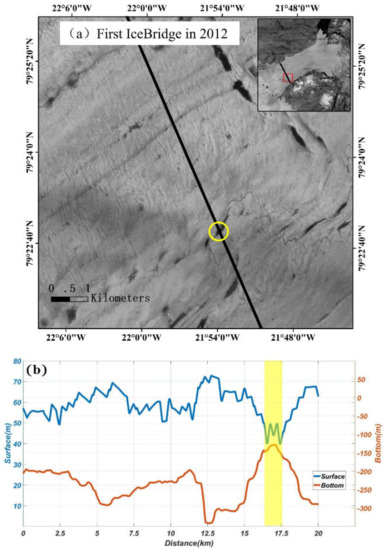
Figure 7.
The first IceBridge in 2012 validates data and Landsat imagery. (a) shows the surface morphology at the first IceBridge data in 2012, with IceBridge airborne radar flight path (black solid line). The location indicated by the yellow circle is the area confirming the existence of the basal channel. (b) shows the results from the first IceBridge in 2012. The yellow area corresponds to the yellow circle in (a).
The channels were never initially identified using basal topography data as results from the data were not available for all ice shelves. Based on previous studies and our simulation results, the first identification was always made using satellite imagery [17,25]. The identification of a feature as any type of basal channel is ambiguous. The following principles will help improve the accuracy of the discrimination and extraction of different types of basal channels. Subglacially-sourced basal channels can be judged by two factors: (1) starting immediately at the grounding line and (2) starting at the same position as the subglacial river outlet. In addition, this type of channel may include abrupt changes in the channel path, which are interpreted to signify reorganizations of subglacial hydrology. Aside from these shifts, subglacially-sourced channels tend to follow the ice flow direction closely and dissipate gradually towards the ice edge. Grounding-line-sourced basal channels are very similar to subglacially-sourced channels. The biggest difference between them is that the origins of the channel are different, which is also caused by their formation mechanisms. Figure 8 shows a portion of the 79NG ice shelf. The red arrow identifies a grounding-line-sourced channel, and the black arrow marks a subglacially-sourced channel. Both types of channels originate near the grounding line, and the only difference is whether they correspond to a subglacial river outlet. The ocean-sourced basal channel is quite different from the first two types of channels. Criteria used for judging whether a channel belongs to this type is that the basal channel starts far from the grounding line and tends to originate or move towards peninsulas or small islands at the shear edge of the ice shelf. Figure 9 shows two ocean-sourced basal channels near the Kronprins Christian land. The most obvious feature is that they are close to the peninsula and far from the grounding line [25,58].
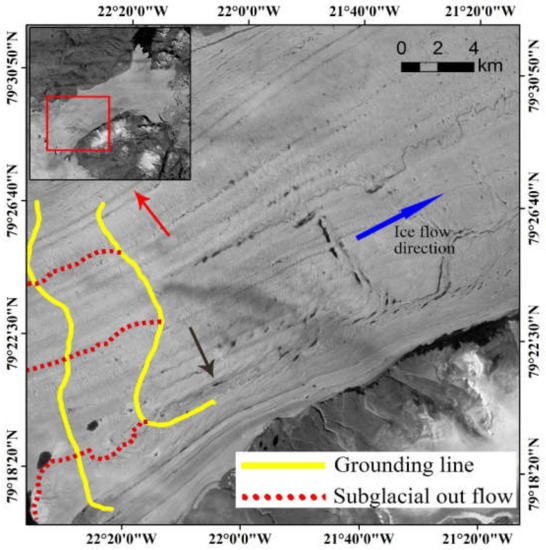
Figure 8.
A portion of the 79NG ice shelf as shown in the 2012 Landsat imagery. The red arrow marks a grounding-line-sourced basal channel. Black arrow marks a subglacially-sourced channel.
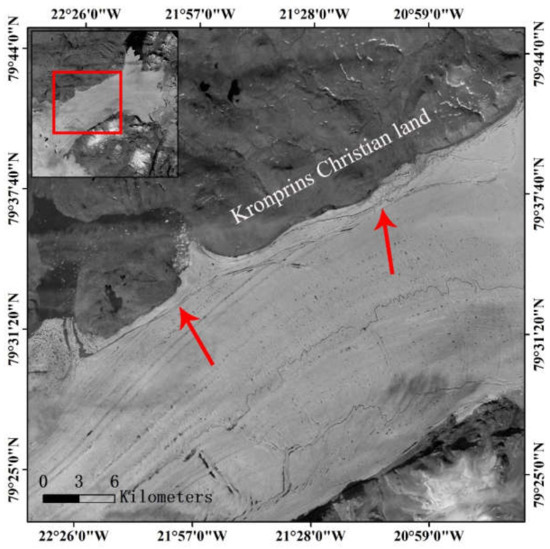
Figure 9.
A portion of the 79NG Ice Shelf as shown in the 2012 Landsat imagery. The red arrows mark ocean-sourced basal channel.
4. Results and Discussion
4.1. Spatiotemporal Series of Basal Channel
The spatiotemporal variation sequence of the basal channel was extracted from the annual Landsat 7/8 image data of the 79NG ice shelf in Northeast Greenland from 2000 to 2018. Figure 10 shows the total basal channel distribution in 2000. The complete basal channel distribution results were shown in Appendix A (Figure A5).
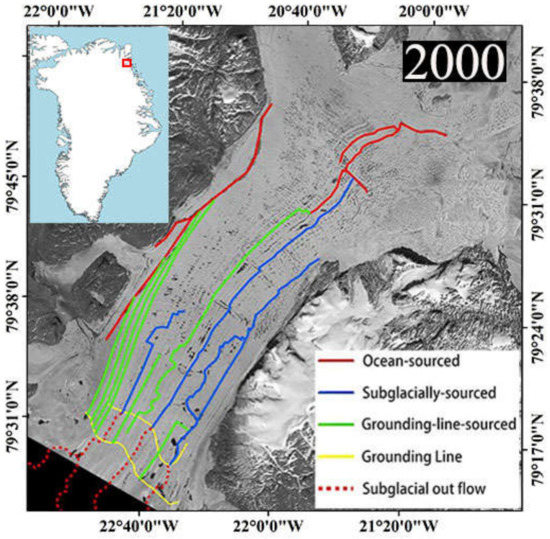
Figure 10.
The distribution of 79NG ice shelf basal channels in 2000.
To describe the difference in the spatial distribution of changes in the length of the basal channel more intuitively, the 79NG ice shelf was divided into three parts: upstream, midstream and downstream. In this paper, the root mean square (RMS) of the annual increment with the basal channel was used as the evaluation standard. , where and represent basal channel length in one year and time scale respectively.
The area where the length of ocean-sourced basal channel changes mainly focuses on the downstream of the ice shelf as shown in Figure 11. This is due to its spatial distribution, as they are mainly concentrated in the calving front of the ice shelf. The length of grounding-line-sourced basal channel changed mostly in the upstream and midstream. This is because the grounding-line-sourced basal channel starts from the ice shelf grounding line. Most are short in length and end upstream or midstream, so the changes are concentrated at this location. The RMS of the subglacially-sourced channel length is 7.4 km in the midstream, which is higher than the other two areas. This is for the subglacially-sourced channel that has continuous and stable outlet drainage support under the ice sheet, making it longer than the grounding-line-sourced channel. Under the condition that the initial position remains unchanged, changes of the subglacially-sourced basal channel length can only occur in the midstream of the ice shelf.
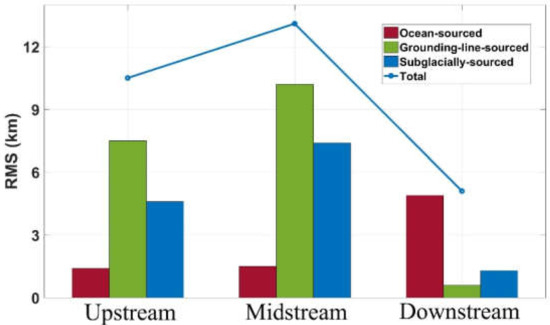
Figure 11.
The RMS of basal channel length annual increment from 2000 to 2018 in 79NG.
According to the time scale analyzed (Figure 12), the length of the basal channel did not appear monotonously elongated or shortened for consecutive years before 2009. After 2009, except for a slight decline in 2013, the total length of the different types of basal channels reached the maximum value within the statistical range in 2014. The grounding-line-sourced basal channel changed the most in the primary stage of development of the basal channel from 2009 to 2014 and the stage of shortening from 2014 to 2018. Combining the above content, it is not difficult that the change in the length of the basal channel is mainly concentrated in the midstream of the ice shelf, especially during 2009–2014.
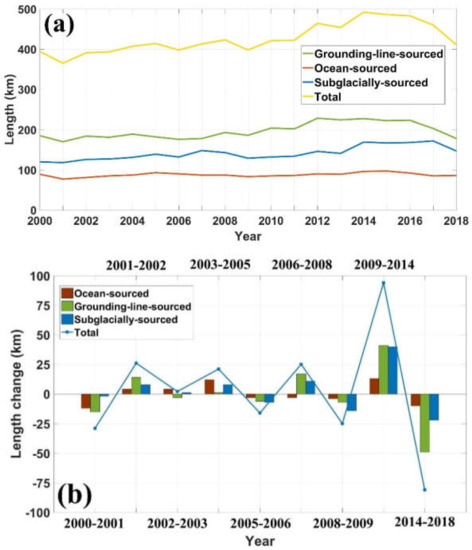
Figure 12.
Time series of basal channel length change. (a) The interannual variation of the grounding-line-sourced basal channel, ocean-sourced basal channel and subglacially-sourced basal channel. (b) Variation trend of three type of basal channel in length: positive value represents length elongation of the basal channel in the corresponding timescale; negative value represents length shortening of the channel in the corresponding timescale.
4.2. Ocean-Sourced Basal Channel
The SST and shelf calving front were used to analyze the changes of the ocean-sourced basal channel. The two influencing factors were provided by Met Office Hadley Center (MOHC) and Climate Change Initiative (CCI) separately [58,59]. However, the dataset of the ice shelf calving front provided by CCI contains only contains the descriptions of the 79NG for two relevant years (2008 and 2015). To further investigate the correlation between the basal channel and calving front from 2000 to 2018, we extracted it manually from Landsat 7/8 images and combine it with available two-year data provided by CCI. The reason for choosing these influencing factors is mainly based on two strategies when extracting ocean-sourced basal channels: (1) away from the grounding line and (2) downstream of the ice shelf. Based on the above criteria, the SST and calving front were used in the basal channel analysis in this region.
Figure 13 shows the changes in the calving front of the 79NG ice shelf from 2000 to 2018. Large calving events occurred near the calving front from 2002 to 2005 and 2015 to 2016. For ease of description, the 79NG ice shelf was divided into two parts according to the ‘A’ and ‘B’ areas in Figure 13. Area B was further divided into two disintegration sites, Area I and Area II. According to Table 2, the largest collapse area occurred in 2002–2002 (Area II) and was. The longest retreat distance occurred in 2015–2016 (Area I). Compared with Area B, the length of the ocean-sourced channel near Area A was relatively stable from 2000 to 2018, and the calving front had no collapse events at Area A. Figure 14 shows the change curves of the ocean-sourced basal channel and SST between 2000 and 2018. The SST did not change significantly between 2000 and 2011 but increased abnormally after 2012, from to. It fell below zero in 2017. The correlation coefficient between the ocean-sourced basal channel and the SST in region A is 0.63, the value in region B is 0.66 and that in region C is 0.21. In region C, the maximum length of the ocean-sourced basal channel appeared in 2005 and 2015, and a large collapse event occurred in these two years, as shown in Table 2. Compared with the obvious fluctuation of the basal channel length change in region C, the length of the ocean-sourced basal channel in region B varied more gradually, and the RMS values of the basal channel length annual increment in region B and region C are 1.5 and 4.4, respectively.
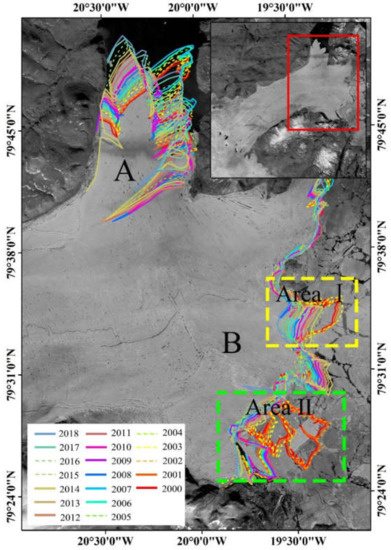
Figure 13.
The location change of the calving front of 79NG ice shelf shown in the base map of Landsat 7 image data in 2012. Area A and B are the two main outlets of 79NG ice shelf, where the yellow (Area I) and green (Area II) rectangular boxes indicate that a large disintegration event has occurred in this area. The different color curves represent the position of the calving front of the ice shelf in different years. In these colored lines, the solid lines represent the major calving events that did not occur during the year, and the dotted lines represent the major calving events that occurred during the year.

Table 2.
Collapse area and retreat distance at 79NG ice shelf calving front.
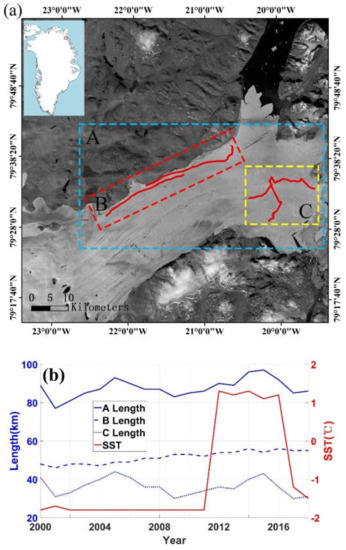
Figure 14.
Variations in the length of ocean-sourced basal channel. (a) shows the distribution of ocean-sourced basal channel, where the red, yellow and blue dotted boxes represent the total length of ocean source basal channel in region B, region A and region C, respectively. (b) shows the changes of ocean-sourced channel length in different regions and the annual change of SST. The three blue lines show in the legend correspond to the length of ocean sourced basal channel in regions A, B and C respectively (refer to the left y-coordinate for coordinate axes). The solid red line represents the data results of the sampling location of SST in Figure 1a (refer to the y-coordinate on the right of the coordinate axis).
Correlation analysis of the changes in the length of ocean-sourced basal channels was conducted between the SST and calving front [60]. Rignot and Steffen (2015) found a large number of basal channels in Northwest Greenland due to warm ocean waters underneath [15]. SST as the average temperature can represent the depth of surface seawater from 1–20 meters, and some of the heat from the surface water can also be transferred to the deep ocean during the heat exchange process, thus extending the range (200 meters or more) [61]. This can promote the melting of the ice shelf base and develop the ocean-sourced basal channel length through a buoyant plume of melting water. The ocean-sourced basal channel is also affected by the position change of the ice shelf calving front, especially in region C, which shows more dramatic changes than does region B (Figure 14a). The main consideration here is that as the calving front of ice shelf changes, large areas of disintegration occur. (1) The distance between the ocean-sourced channel and the calving front shortens significantly within a short time, which makes the shelf more susceptible to the influence of warm surface water. (2) As the new section contacts the warm surface water, the large amount of fresh water produced by the melting drives the vertical circulation of the water near the calving front. These two factors promote the development of ocean-sourced basal channels at the same time [62].
4.3. Grounding-Line-Sourced Basal Channel
The grounding-line-sourced basal channel was formed by the action of warm seawater at the bottom of the ice shelf, which produced meltwater near the grounding line. In this analysis, the SST was used to replace the bottom seawater temperature data to analyze the changes of the grounding-line-sourced channel length. There are two main reasons for this approach. (1) The location of the Atlantic Intermediate Water (AIW) is below 300 meters according to the average depth statistics from 1979 to 2016. The melting of the ground line of the 79NG ice shelf is precisely caused by the action of AIW. However, there is a lack of long-time series conductivity, temperature and depth (CTD) data in this area, so it is difficult to obtain the changes of the water mass in this layer and analyze their influence on the grounding-line-sourced channel length. (2) According to the thickness of the 79NG ice shelf studied in this paper, except for the basal channels near the ground line, which are located 600 meters below sea level, the midstream and downstream of the ice shelf are all within 200 (±30) meters. While the basal channel starts from the grounding line, its changes in length mainly occur in the midstream and downstream of the ice shelf.
Figure 15 shows the time series of the SST near the calving front of the 79NG ice shelf and the length of the grounding-line-sourced basal channel. From 2000 to 2011, the SST was below zero, and changes were not obvious. During the same period, the length of the grounding-line-sourced channel slightly changed. The three years with obvious changes are as follows: growth of 14 km in 2001–2002, of 15 km in 2007–2008 and of 18 km in 2009–2010. In 2012, the SST increased abnormally and broke through the freezing point to reach the maximum value in the time series. During the same period, the length of the grounding-line-sourced basal channel showed an obvious upward trend and broke 220 km. At the end of 2012, the maximum change range of the channel was 26 km longer. From 2012 to 2016, the SST was stable above , and the length of the grounding-line-sourced channel was within during the same period, showing little change. In 2017–2018, with the SST falling below the freezing point, the length of the grounding-line-sourced basal channel was reduced to less than 220 km. Statistical analysis reveals that the correlation coefficient between the SST and the length of the grounding-line-sourced channel is 0.89.
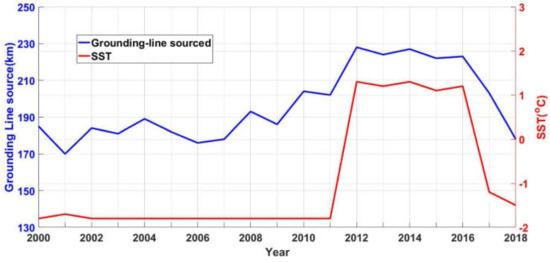
Figure 15.
The time series of grounding-line-sourced channel and SST.
The relationship between the length of the grounding-line-sourced basal channel and the SST indicates that (1) during the period from 2000 to 2011, the SST was relatively stable, and the length of the grounding-line-sourced channel showed a small variation. This was due to the influence of the AIW on the grounding line at the bottom of the ice shelf. (2) From 2012 to 2016, the abnormal temperature rise of the SST promoted the further development of the grounding-line-sourced basal channel, and the decline of the SST in 2017–2018 caused the shortening of the length of the grounding-line-sourced channel during this period. Alley et al. (2016) used satellite imagery and airborne ice-penetrating radar to map extensive basal channels. Within the channels, warm water was found to erode the ice shelf base and drive channel evolution [25]. The SST promotion of the grounding-line-sourced basal channel length occurs in the same way.
4.4. Subglacially-Sourced Basal Channel
Since the subglacially-sourced basal channel is formed under the action of subglacial drainage, melting water from the surface of the ice sheet can enter the ice sheet bottom through crevasses and moulins to promote the development of a subglacial water system and increase the discharge of subglacial water, thus affecting the changes of the basal channel [63]. Therefore, in this section, the influence of surface melting on changes in the basal channel was discussed [64]. Considering that the length of the subglacially-sourced channel also changes in the midstream of the ice shelf, which is the same as the case for the grounding-line-sourced basal channel, this paper also analyzed the influence of the SST on the length of the subglacially-sourced basal channel.
Figure 16 shows the time series of the subglacially-sourced basal channel length, melting days of the ice sheet surface and SST. During the period of no significant change in the SST from 2000 to 2011, the length of the subglacially-sourced channel was mainly affected by the surface melting days. The correlation coefficient between the subglacially-sourced basal channel and melting days is 0.76 from 2000 to 2013. The melting days of the ice sheet reached maximums in 2003, 2005 and 2007, and the length of the subglacially-sourced basal channel also reached a peak during the same periods. Between 2007 and 2009, as the melting days decreased, the length of the basal channel decreased from a maximum of 148 km to 129 km, and the cumulative change was 19 km. After 2012, the SST rose abnormally at first and then fell below zero in 2017, and the length of the subglacially-sourced basal channel changed accordingly. Through a statistical analysis of the limited data, the conclusion is drawn as follows. From 2000 to 2011, the subglacially-sourced basal channel was mainly affected by the melting days. After 2012, the subglacially-sourced basal channel was mainly affected by the SST. From 2012 to 2013, this type of basal channel was affected by the melting days and SST combined. However, due to the lack of melting days after 2013, it is impossible to further analyze the corresponding influencing mechanism on the basal channel length change.
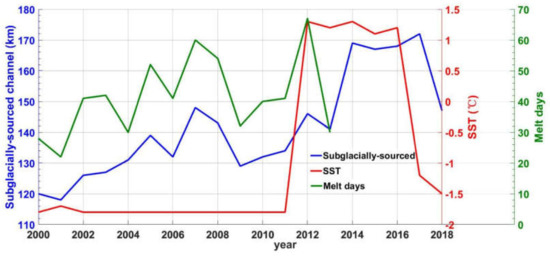
Figure 16.
The time series of subglacially-sourced channel, SST and ice sheet surface melting days.
The mechanism of two influencing factors on subglacially-sourced basal channel length change are as follows. (1) Melting days affect the amount of water that melts on the surface. The melting water forms a complex and diverse ice hydrological system under the influence of the surface topography of the ice sheet, including supraglacial rivers, supraglacial lakes, crevasses and moulins. Meierbachtol et al. (2013) suggested this system can drive the mass loss of the ice shelf through the crevasses and moulins to form a subglacial hydrological system [63]. It also promotes the development of subglacial water systems and the formation of a wide range of subglacially-sourced basal channels through the relevant data analysis. (2) Changes in the SST affect the melting of the bottom of the ice shelf. A large amount of melting water is produced at the base of the ice shelf and flows into the existing basal channel, further promoting the development of the basal channel [16,22,24].
4.5. Uncertainties Analysis
Our method captures channels that are typically ∼50–400 m across and incised ∼10–20 m in the surface (∼5–25 m in the ice shelf base) in the study area. In some cases, the identification of a feature as any type of basal channel is ambiguous. The image interpretation errors caused by three external factors should be overcome in the process of basal channel extraction. (1) In 2003, the fault of the Scan Line Corrector (SLC) of Landsat 7 led to strip deletion of image data, which affected the extraction of linear features on the ice shelf surface to some extent. (2) Affected by severe weather conditions, some areas are covered by snow, resulting in inconspicuous surface features and increased difficulty in extraction. (3) Greenland is generally believed to respond gradually to climate warming, mainly through melting at the surface [65]. Similar surface depressions can also be formed under the action of melting water cutting even if there is no basal channel. To minimize the impact of the above factors, ICESat data from 2003–2008 and separate IceBridge verification data from 2012 and 2017 were obtained. Surface features were extracted according to the characteristics of the basal channel continuity to ensure the integrity of each basal channel to the greatest extent. With these validation data, some errors, mainly concentrated in the midstream and downstream of the ice shelf, were eliminated.
As shown in Figure 17, in the third IceBridge verification position in 2012, the rectangular box with solid yellow lines corresponds to the verification data in Figure 17b. In this area, the ice-penetrating radar shows a 20 meter high basal channel at the bottom of the ice shelf, but satellite images showed no significant continuous surface depressions in this area. Therefore, the basal channel in this area is not marked in our study. In addition, the blue arrow in Figure 17a points to the intersection of a supraglacial river in IceBridge where there is a significant depression on the ice shelf surface, but the corresponding basal ice shelf topography data show that there is no basal channel under the ice shelf at this location. In this study, it was assumed that the supraglacial river was formed by surface melt water, rather than being a surface depression caused by the basal channel. Therefore, the supraglacial river was not drawn as a basal channel in this study.
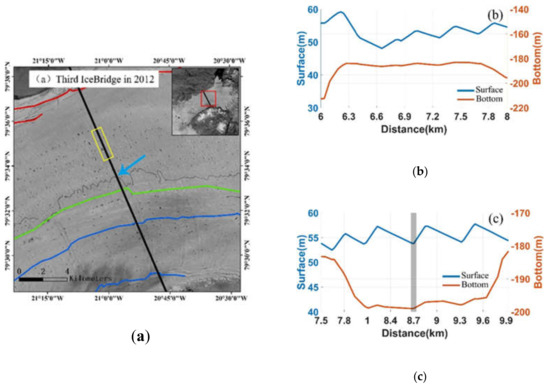
Figure 17.
(a) Landsat image near the third IceBridge airborne radar flight path in 2012. Ocean-sourced basal channel (red solid line), grounding-line-sourced basal channel (Green solid line), subglacially-sourced basal channel (blue solid line). (b) IceBridge data corresponds to the position marked by the yellow solid box in (a). (c) IceBridge data with gray background represent a supraglacial river terrain indicated by blue solid arrow in figure (a).
5. Conclusions
We used satellite imagery to extract the long-term sequence of basal channels at the 79NG ice shelf in Northeast Greenland for the first time and analyze corresponding the temporal and spatial changes. Through IceBridge and ICESat data verification, conclusions were obtained indicating that the main spatial change of the basal channel is concentrated in the midstream of the ice shelf. From the above sections, it is not difficult to find that the SST is always the main influencing factor. This coincides with the findings of previous studies [15,25]. Based on SST data, surface melting of the ice sheet and the calving front changes of the ice shelf, different types of basal channels are affected by different factors, and the following conclusions are drawn. (1) During the period from 2000 to 2011, when there were only small changes in SST, the ocean-sourced channel was mainly affected by the changes of the calving front location. The subglacially-sourced channel starts at the subglacial outflow, and its formation process is dominated by subglacial drainage. Meltwater enters the ice sheet bottom through crevasses and moulins, thus promoting the length of the subglacially-sourced channel, indicating that the subglacially-sourced channel is mainly affected by the melting days of the ice sheet surface. From 2000 to 2011, the length of the grounding-line-sourced channel showed a small change, which was speculated in this paper to be influenced by the AIW. (2) During the period from 2012 to 2018, the SST first increased abnormally in 2012 and then fell below zero after 2017. Our results indicated that the ocean-sourced channel is influenced by the SST and ice shelf calving front changes. The subglacially-sourced channel and grounding-line-sourced channel are mainly affected by the SST.
The formation and evolution of a basal channel is an extremely complicated process that is affected by many aspects. This paper only analyzed the reasons for basal channel length changes based on limited factors and does not further explore the corresponding influencing mechanism of the width and height of the basal channel. This approach is based on the following two reasons. (1) There are few measured data for the bottoms of the ice shelves, and the temporal resolution of ice-penetrating radar is insufficient. With the continuous outward movement of the ice shelf as whole, it is impossible to record the changes in width and height of a basal channel at the same position due to the fixed aerial survey line. (2) Because of snow cover and water erosion, it is difficult to quantify the height and depth of a basal channel according to the surface morphological characteristics provided by remote-sensing images. The investigation of the formation and evolution of basal channels is still in the exploration stage, and observational data still need to be further strengthened. The reasons behind the changes of different types of basal channels and their impacts on the overall stability of an ice shelf need to be further studied.
Author Contributions
Z.W., X.S., and B.Z. conceived of the study, supervised the experiments and improved the manuscript. T.L. and H.G. contributed to the analysis and discussion. All authors have read and agreed to the published version of the manuscript.
Funding
This work was supported in part by the National Key Research and Development Program of China (2018YFC1406102), the Key Program of National Natural Science Foundation of China (grant number 41531069), the National Natural Science Foundation of China (41776195, 41941010 and 41676179).
Conflicts of Interest
The authors declare no conflict of interest.
Appendix A
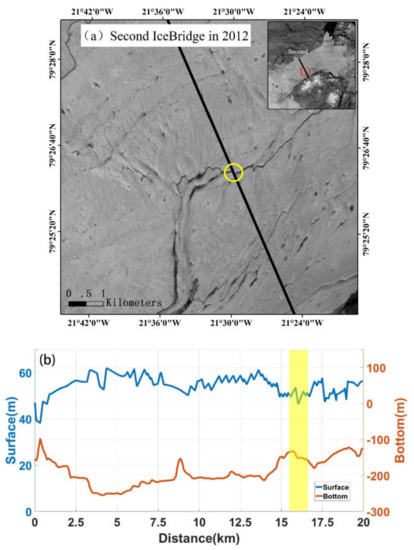
Figure A1.
The second IceBridge in 2012 validates the data and Landsat imagery. (a) shows the surface morphology at the second IceBridge data in 2012, with IceBridge airborne radar flight path (black solid line). The location indicated by the yellow circle is the area confirming the existence of the basal channel. (b) shows the results from the second IceBridge in 2012. The yellow area corresponds to the yellow circle in (a).
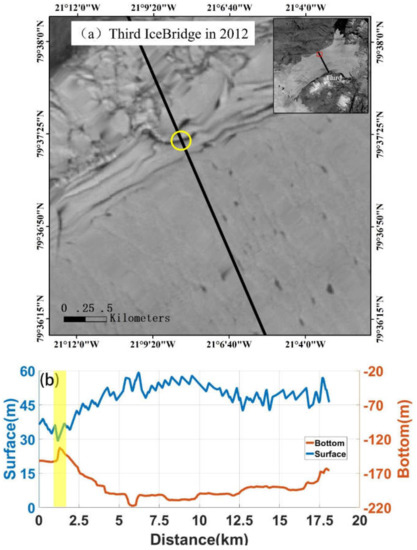
Figure A2.
The third IceBridge in 2012 validates the data and Landsat imagery. (a) shows the surface morphology at the third IceBridge data in 2012, with IceBridge airborne radar flight path (black solid line). The location indicated by the yellow circle is the area confirming the existence of the basal channel. (b) shows the results from the third IceBridge in 2012. The yellow area corresponds to the yellow circle in (a).
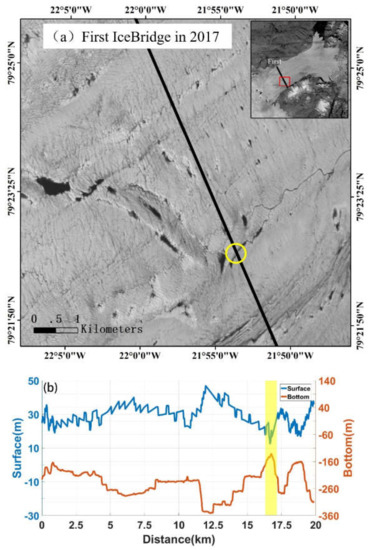
Figure A3.
The first IceBridge in 2017 validates the data and Landsat imagery. (a) shows the surface morphology at the first IceBridge data in 2017, with IceBridge airborne radar flight path (black solid line). The location indicated by the yellow circle is the area confirming the existence of the basal channel. (b) shows the results from the first IceBridge in 2017. The yellow area corresponds to the yellow circle in (a).
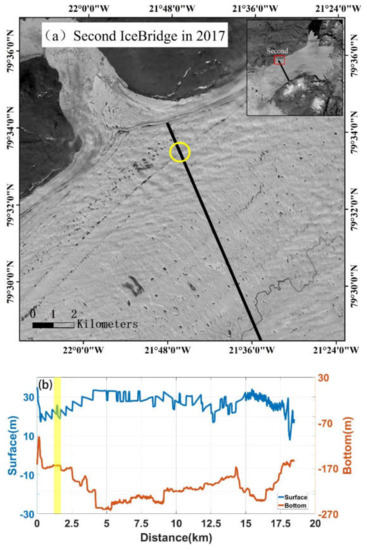
Figure A4.
The second IceBridge in 2017 validates the data and Landsat imagery. (a) shows the surface morphology at the second IceBridge data in 2017, with IceBridge airborne radar flight path (black solid line). The location indicated by the yellow circle is the area confirming the existence of the basal channel. (b) shows the results from the second IceBridge in 2017. The yellow area corresponds to the yellow circle in (a).
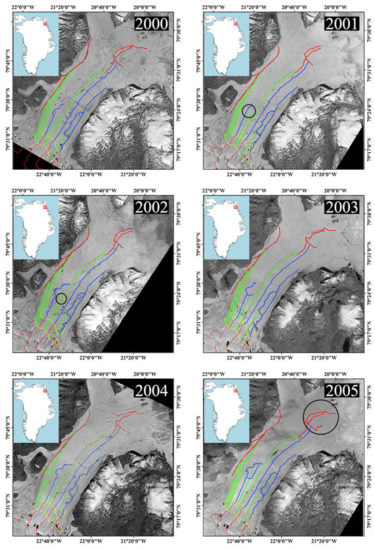
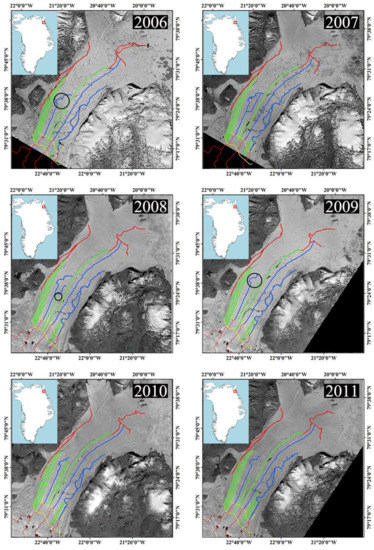
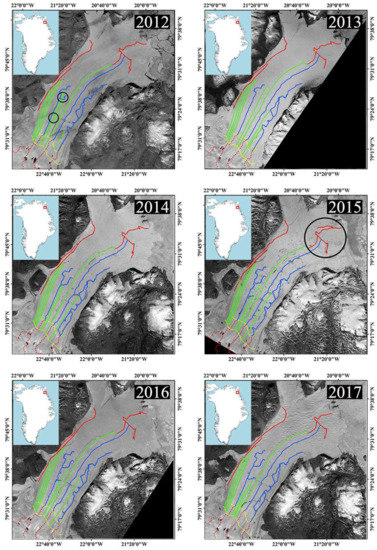
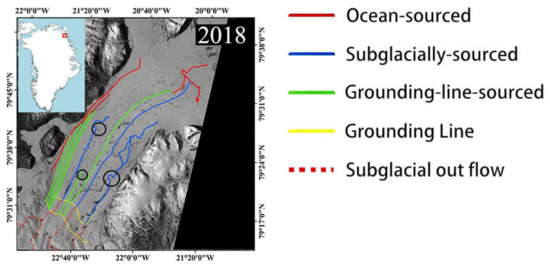
Figure A5.
The distribution of 79NG ice shelf basal channels from 2000 to 2018. The positions marked by black circles in some images represent the areas with large changes in the basal channel.
Once the basal channel is formed, its type will not change, and the channel will not disappear within a short time, existing for at least several years [25]. After distinguishing the types of various basal channels based on the surface terrain characteristics, the approximate distribution of the basal channels in the area is obtained. The extraction of the above basal channel result is reliable according to the description of the extraction strategy of the relevant basal channel in the manuscript. The basal channel extraction figures shown in Figure A5 contain black solid circles indicating that the length of the channel in the circled area changed. In the years 2006, 2009 and 2018, where the circled basal channel locations appear abrupt changes in the corresponding channel path, this is an obvious feature of subglacially-sourced basal channel. The locations with black circles in the figures are mainly concentrated in the midstream of the ice shelf, except for the years of 2005 and 2015. Satellite imagery from 2005 and 2015 in Figure A5 shows that the ocean-sourced basal channel near the calving front underwent great changes in length. This was mainly due to the severe shrinkage of the calving front during these two years, which resulted in large-scale disintegration.
References
- Lazeroms, W.M.J.; Jenkins, A.; Gudmundsson, G.H.; Wal, R.S.W. Modelling present-day basal melt rates for Antarctic ice shelves using a parametrization of buoyant meltwater plumes. Cryosphere 2018, 12, 49–70. [Google Scholar] [CrossRef]
- Jacobs, S.S.; Jenkins, A.; Giulivi, C.F.; Dutrieux, P. Stronger ocean circulation and increased melting under pine island glacier ice shelf. Nat. Geosci. 2011, 4, 519–523. [Google Scholar] [CrossRef]
- Joughin, I.; Smith, B.E.; Holland, D.M. Sensitivity of 21st century sea level to ocean-induced thinning of pine island glacier, antarctica. Geophys. Res. Lett. 2010, 37, L20502. [Google Scholar] [CrossRef]
- Shepherd, A.; Wingham, D.; Wallis, D.; Giles, K.; Sundal, A.V. Correction to “recent loss of floating ice and the consequent sea level contribution”. Geophys. Res. Lett. 2010, 37, 17. [Google Scholar] [CrossRef]
- Fogwill, C.J.; Golledge, N.R.; Kowalewski, D.E.; Levy, R.H.; Gasson, E.G.W.; Naish, T.R. The multi-millennial Antarctic commitment to future sea-level rise. Nature 2015, 526, 421–425. [Google Scholar]
- Ritz, C.; Edwards, T.L.; Durand, G.; Payne, A.J.; Peyaud, V.; Hindmarsh, R.C.A. Potential sea-level rise from Antarctic ice-sheet instability constrained by observations. Nature 2015, 528, 115. [Google Scholar] [CrossRef]
- Pollard, D.; DeConto, R.M. Description of a hybrid ice sheet-shelf model, and application to Antarctica. Geosci. Model Dev. 2012, 5, 1273–1295. [Google Scholar] [CrossRef]
- Rignot, E.; Jacobs, S.; Mouginot, J.; Scheuchl, B. Ice-shelf melting around Antarctica. Science 2013, 341, 266–270. [Google Scholar] [CrossRef]
- Liu, Y.; Moore, J.C.; Cheng, X.; Gladstone, R.M.; Hui, F. Ocean-driven thinning enhances iceberg calving and retreat of Antarctic ice shelves. Proc. Natl. Acad. Sci. USA 2015, 112, 3263–3268. [Google Scholar] [CrossRef]
- Depoorter, M.A.; Bamber, J.L.; Griggs, J.A.; Lenaerts, J.T.M.; Ligtenberg, S.R.M.; Van, B.M.R. Calving fluxes and basal melt rates of Antarctic ice shelves. Nature 2013, 502, 89. [Google Scholar] [CrossRef]
- Pritchard, H.D.; Ligtenberg, S.R.M.; Fricker, H.A.; Vaughan, D.G.; Broeke, M.R.V.D.; Padman, L. Antarctic ice-sheet loss driven by basal melting of ice shelves. Nature 2012, 484, 502. [Google Scholar] [CrossRef] [PubMed]
- Paolo, F.S.; Fricker, H.A.; Padman, L. Volume loss from Antarctic ice shelves is accelerating. Science 2015, 348, 327–331. [Google Scholar] [CrossRef] [PubMed]
- Gourmelen, N.; Goldberg, D.N.; Snow, K.; Henley, S.F.; Bingham, R.G.; Kimura, S. Channelized melting drives thinning under a rapidly melting Antarctic ice shelf. Geophys. Res. Lett. 2017, 44, 9796–9804. [Google Scholar] [CrossRef]
- Jenkins, A.; Dutrieux, P.; Jacobs, S.S.; Mcphail, S.D.; Perrett, J.R.; Webb, A.T. Observations beneath Pine Island Glacier in West Antarctica and implications for its retreat. Nat. Geosci. 2010, 3, 468. [Google Scholar] [CrossRef]
- Rignot, E.; Steffen, K. Channelized bottom melting and stability of floating ice shelves. Geophys. Res. Lett. 2008, 35, L0250. [Google Scholar] [CrossRef]
- Dutrieux, P.; Stewart, C.; Jenkins, A.; Nicholls, K.W.; Corr, H.F.J.; Rignot, E. Basal terraces on melting ice shelves. Geophys. Res. Lett. 2014, 41, 5506–5513. [Google Scholar] [CrossRef]
- Le Brocq, A.M.; Ross, N.; Griggs, J.A.; Bingham, R.G.; Corr, H.F.J.; Ferraccioli, F. Evidence from ice shelves for channelized meltwater flow beneath the Antarctic Ice Sheet. Nat. Geosci. 2013, 6, 945. [Google Scholar] [CrossRef]
- Fricker, H.A.; Coleman, R.; Padman, L.; Scambos, T.A.; Brunt, K.M. Mapping the grounding zone of the Amery Ice Shelf, East Antarctica using InSAR, MODIS and ICESat. Antarct. Sci. 2009, 21, 515–532. [Google Scholar] [CrossRef]
- Bindschadler, R.; Vaughan, D.G.; Vornberger, P. Variability of basal melt beneath the Pine Island Glacier ice shelf, West Antarctica. J. Glaciol. 2011, 57, 581–595. [Google Scholar] [CrossRef]
- Mankoff, K.D.; Jacobs, S.; Tulaczyk, S.M.; Stammerjohn, S.E. The role of Pine Island Glacier ice shelf basal channels in deep-water upwelling, polynyas and ocean circulation in Pine Island Bay, Antarctica. Ann. Glaciol. 2012, 53, 123–128. [Google Scholar] [CrossRef]
- Dutrieux, P.; Vaughan, D.G.; Corr, H.F.J.; Jankins, A.; Holland, P.R.; Joughin, I.; Fleming, A. Pine Island glacier ice shelf melt distributed at kilometre scales. Cryosphere 2013, 7, 1543–1555. [Google Scholar] [CrossRef]
- Rignot, E.; Jacobs, S.S. Rapid bottom melting widespread near Antarctic ice sheet grounding lines. Science 2002, 296, 2020–2023. [Google Scholar] [CrossRef] [PubMed]
- Langley, K.; Von Deschwanden, A.; Kohler, J.; Sinisalo, A.; Matsuoka, K.; Hattermann, T.; Humbert, A.; Nost, O.A.; Isaksson, E. Complex network of channels beneath an Antarctic ice shelf. Geophys. Res. Lett. 2014, 41, 1209–1215. [Google Scholar] [CrossRef]
- Marsh, O.J.; Fricker, H.A.; Siegfried, M.R.; Christianson, K. High basal melting forming a channel at the grounding line of Ross Ice Shelf, Antarctica. Geophys. Res. Lett. 2016, 43, 250–255. [Google Scholar] [CrossRef]
- Alley, K.E.; Scambos, T.A.; Siegfried, M.R.; Fricker, H.A. Impacts of warm water on Antarctic ice shelf stability through basal channel formation. Nat. Geosci. 2016, 9, 290. [Google Scholar] [CrossRef]
- Motyka, R.J.; Truffer, M.; Fahnestock, M.; Mortensen, J.; Søren, R.; Howat, I. Submarine melting of the 1985 Jakobshavn Isbræ floating tongue and the triggering of the current retreat. J. Geophys. Res. Earth Surf. 2011, 116, 1–41. [Google Scholar] [CrossRef]
- Gladish, C.V.; Holland, D.M.; Holland, P.R.; Price, S.F. Ice-shelf basal channels in a coupled ice/ocean model. J. Glaciol. 2012, 58, 1227–1244. [Google Scholar] [CrossRef]
- Millgate, T.; Holland, P.R.; Jenkins, A.; Johnson, H.L. The effect of basal channels on oceanic ice-shelf melting. J. Geophys. Res. Ocean. 2013, 118, 6951–6964. [Google Scholar] [CrossRef]
- Vaughan, D.G.; Corr, H.F.J.; Bindschadler, R.A.; Dutrieux, P.; Gudmundsson, G.H.; Jenkins, A.; Newman, T.; Vornberger, P.; Wingham, D. Subglacial melt channels and fracture in the floating part of Pine Island Glacier, Antarctica. J. Geophys. Res. Earth Surf. 2012, 117, F03012. [Google Scholar] [CrossRef]
- Sergienko, O.V. Basal channels on ice shelves. J. Geophys. Res. Earth Surf. 2013, 118, 1342–1355. [Google Scholar] [CrossRef]
- Matsuoka, K.; Maeno, H.; Uratsuka, S.; Fujita, S.; Furukawa, T.; Watanabe, O. A ground-based, multi-frequency ice-penetrating radar system. Ann. Glaciol. 2002, 34, 171–176. [Google Scholar] [CrossRef][Green Version]
- Kurtz, N.T.; Farrell, S.L.; Studinger, M.; Galin, N.; Harbeck, J.P.; Lindsay, R.; Onana, C.D.; Panzer, B.; Sonntag, J.G. Sea ice thickness, freeboard, and snow depth products from Operation IceBridge airborne data. Cryosphere 2013, 7, 1035–1056. [Google Scholar] [CrossRef]
- Shi, L.; Allen, C.T.; Ledford, J.R.; Rodriguez-Morales, F.; Gogineni, S. Multichannel coherent radar depth sounder for NASA operation ice bridge. Proceeding of the 2010 IEEE International Geoscience and Remote Sensing Symposium, Honolulu, HI, USA, 25–30 June 2010; volume, pp. 1729–1732. [Google Scholar]
- Lindbäck, K.; Pettersson, R.; Doyle, S.H.; Helanow, C.; Jansson, P.; Kristensen, S.S.; Stenseng, L.; Forsberg, R.; Hubbard, A. High-resolution ice thickness and bed topography of a land-terminating section of the Greenland Ice Sheet. Earth Syst. Sci. Data 2014, 6, 331–338. [Google Scholar] [CrossRef]
- Schroeder, D.M.; Dowdeswell, J.A.; Siegert, M.J.; Bingham, R.G.; Maho, Y.L. Multidecadal observations of the Antarctic ice sheet from restored analog radar records. Proc. Natl. Acad. Sci. USA 2019, 116, 18867–18873. [Google Scholar] [CrossRef]
- Sinha, N.K. Crack-enhanced creep in polycrystalline material: Strain-rate sensitive strength and deformation of ice. J. Mater. Sci. 1988, 23, 4415–4428. [Google Scholar] [CrossRef]
- Treverrow, A.; Budd, W.F.; Jacka, T.H.; Warner, R.C. The tertiary creep of polycrystalline ice: Experimental evidence for stress-dependent levels of strain-rate enhancement. J. Glaciol. 2012, 58, 301–314. [Google Scholar] [CrossRef]
- Steenis, K.; Hicks, F.E.; Hrudey, T.M.; Beltaos, S. Modelling creep deformation in floating ice. Can. J. Civ. Eng. 2003, 30, 28–41. [Google Scholar] [CrossRef][Green Version]
- Glen, J.W. The creep of polycrystalline ice. Proceedings of the Royal Society of London. Series A. Math. Phys. Sci. 1955, 228, 519–538. [Google Scholar]
- Thomas, R.H. The Creep of Ice Shelves Theory. J. Glaciol. 1973, 12, 45–53. [Google Scholar] [CrossRef][Green Version]
- Rignot, E.; Mouginot, J. Ice flow in Greenland for the international polar year 2008–2009. Geophys. Res. Lett. 2012, 39, L11501. [Google Scholar] [CrossRef]
- Borsa, A.A.; Moholdt, G.; Fricker, H.A.; Brunt, K.M. A range correction for ICESat and its potential impact on ice-sheet mass balance studies. Cryosphere 2014, 8, 345–357. [Google Scholar] [CrossRef]
- Fricker, H.A.; Padman, L. Ice shelf grounding zone structure from ICESat laser altimetry. Geophys. Resolut. Lett. 2006, 33, L15502. [Google Scholar] [CrossRef]
- Kurtz, N.T.; Farrell, S.L. Large–scale surveys of snow depth on Arctic sea ice from operation IceBridge. Geophys. Resolut. Lett. 2011, 38, L20505. [Google Scholar] [CrossRef]
- Farrell, S.L. A first assessment of icebridge snow and ice thickness data over arctic sea ice. IEEE Trans. Geosci. Remote Sens. 2012, 50, 2098–2111. [Google Scholar] [CrossRef]
- Schaffer, J.; Von Appen, W.J.; Dodd, P.A.; Hofstede, C.; Mayer, C.; Steur, L.; Kanzow, T. Warm water pathways toward Nioghalvfjerdsfjorden Glacier, Northeast Greenland. J. Geophys. Res. Ocean. 2017, 122, 4004–4020. [Google Scholar] [CrossRef]
- Wilson, N.J.; Straneo, F. Water exchange between the continental shelf and the cavity beneath Nioghalvfjerdsbræ (79 North Glacier). Geophys. Res. Lett. 2015, 42, 7648–7654. [Google Scholar] [CrossRef]
- Mouginot, J.; Rignot, E.; Scheuchl, B.; Fenty, I.; Khazendar, A.; Morlighem, M. Fast retreat of Zachariæ Isstrøm, northeast Greenland. Science 2015, 350, 1357–1361. [Google Scholar] [CrossRef]
- Mayer, C.; Schaffer, J.; Hattermann, T.; Floricioiu, D.; Krieger, L.; Dodd, P.A.; Kanzow, T.; Licciulli, C.; Schannwell, C. Large ice loss variability at Nioghalvfjerdsfjorden Glacier, Northeast-Greenland. Nat. Commun. 2018, 9, 2768. [Google Scholar] [CrossRef]
- Drewry, D.; Robin, G. Form and flow of the Antarctic ice sheet during the last million years. Clim. Rec. Polar Ice Sheet 1983, 28–38. [Google Scholar]
- Howat, I.M.; Negrete, A.; Smith, B.E. The Greenland ice mapping project (gimp) land classification and surface elevation data sets. Cryosphere Discuss. 2014, 8, 1509–1518. [Google Scholar] [CrossRef]
- Chen, S.; Wang, S.; Li, C.; Hu, Q.; Yang, H. A Seismic Capacity Evaluation Approach for Architectural Heritage Using Finite Element Analysis of Three-Dimensional Model: A Case Study of the Limestone Hall in the Ming Dynasty. Remote Sens. 2018, 10, 963. [Google Scholar] [CrossRef]
- ANSYS Release 9.0 Documentation 2004. Available online: https://epdf.pub/ansys-verification-manual-ansys-release-90.html. (accessed on 5 November 2014).
- Betten, J. Creep Mechanics; Springer: Aachen, Germany, 2008; p. 52. [Google Scholar]
- Bråthe, L.; Josefson, L. Estimation of Norton-Bailey parameters from creep rupture data. Met. Sci. 1979, 13, 660–664. [Google Scholar] [CrossRef]
- Zheng, M.; Han, L.; Qiu, Z.; Li, H.; Ma, Q.; Che, F. Simulation of permanent deformation in high-modulus asphalt pavement using the Bailey-Norton creep law. J. Mater. Civ. Eng. 2016, 28, 04016020. [Google Scholar] [CrossRef]
- Paterson, W.B.S. The Physics of Glaciers; Elsevier: Amsterdam, The Netherlands, 2016; pp. 72–75. [Google Scholar]
- Brocq, L.; Payne, A.; Siegert, M.; Alley, R. A subglacial water-flow model for West Antarctica. J. Glacial 2009, 55, 879–888. [Google Scholar] [CrossRef]
- Rayner, N.A. Global analyses of sea surface temperature, sea ice, and night marine air temperature since the late nineteenth century. J. Geophys. Res. 2003, 108, 4407. [Google Scholar] [CrossRef]
- Chauché, N.; Hubbard, A.; Gascard, J.C.; Box, J.E.; Bates, R.; Koppes, M. Ocean properties, ice-ocean interactions, and calving front morphology at two major west Greenland glaciers. Cryosphere Discuss. 2013, 7, 6. [Google Scholar]
- Jones, H.; Marshall, J. Convection with rotation in a neutral ocean: A study of open-ocean deep convection. J. Phys. Oceanogr. 1993, 23, 1009–1039. [Google Scholar] [CrossRef]
- Jiuxin, S. A review of ice shelf-ocean interaction in Antarctica. Polar Res. 2015, 030, 287–302. [Google Scholar]
- Meierbachtol, T.; Harper, J.; Humphrey, N. Basal drainage system response to increasing surface melt on the Greenland ice sheet. Science 2013, 341, 777–779. [Google Scholar] [CrossRef]
- Picard, G.; Fily, M.; Gallee, H. Surface melting derived from microwave radiometers: A climatic indicator in Antarctica. Ann. Glaciol. 2007, 46, 29–34. [Google Scholar] [CrossRef]
- Zwally, H.J.; Abdalati, W.; Herring, T.; Larson, K.; Saba, J.; Steffen, K. Surface melt-induced acceleration of Greenland ice-sheet flow. Science 2002, 297, 218–222. [Google Scholar]
© 2020 by the authors. Licensee MDPI, Basel, Switzerland. This article is an open access article distributed under the terms and conditions of the Creative Commons Attribution (CC BY) license (http://creativecommons.org/licenses/by/4.0/).