A Change-Driven Image Foveation Approach for Tracking Plant Phenology


 , , and
Abstract
:
1. Introduction
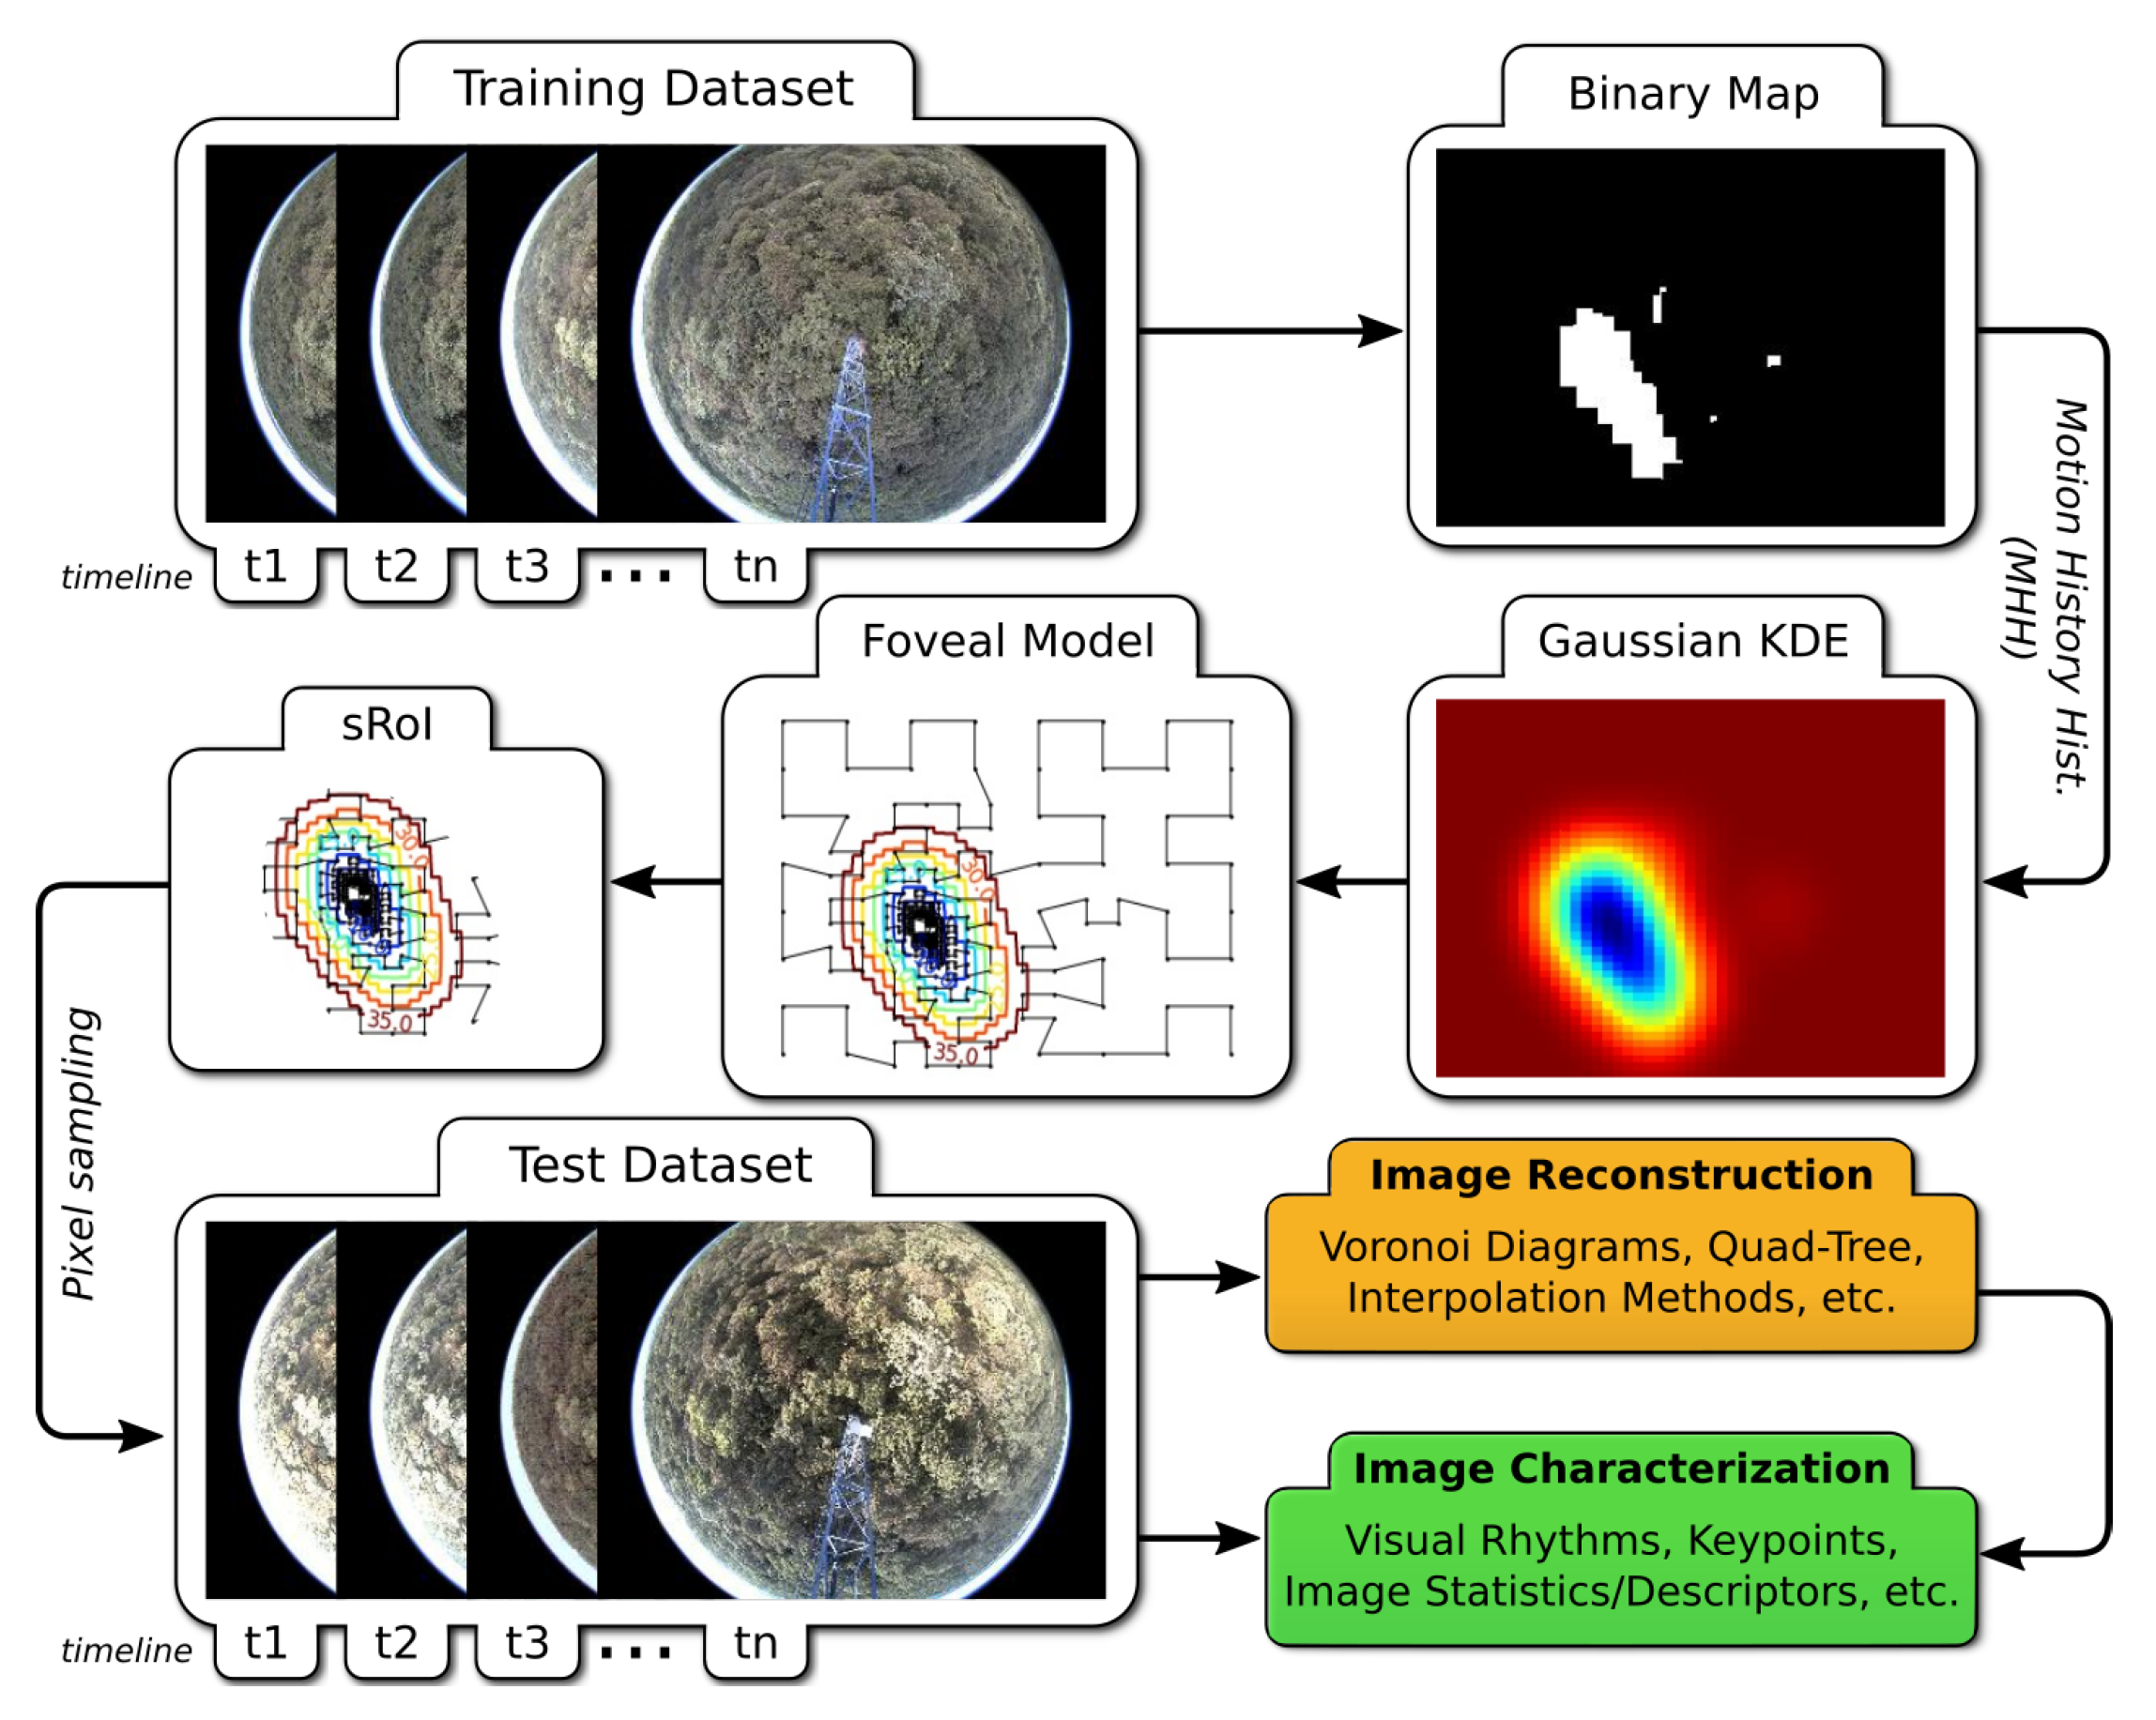
2. Proposed Approach
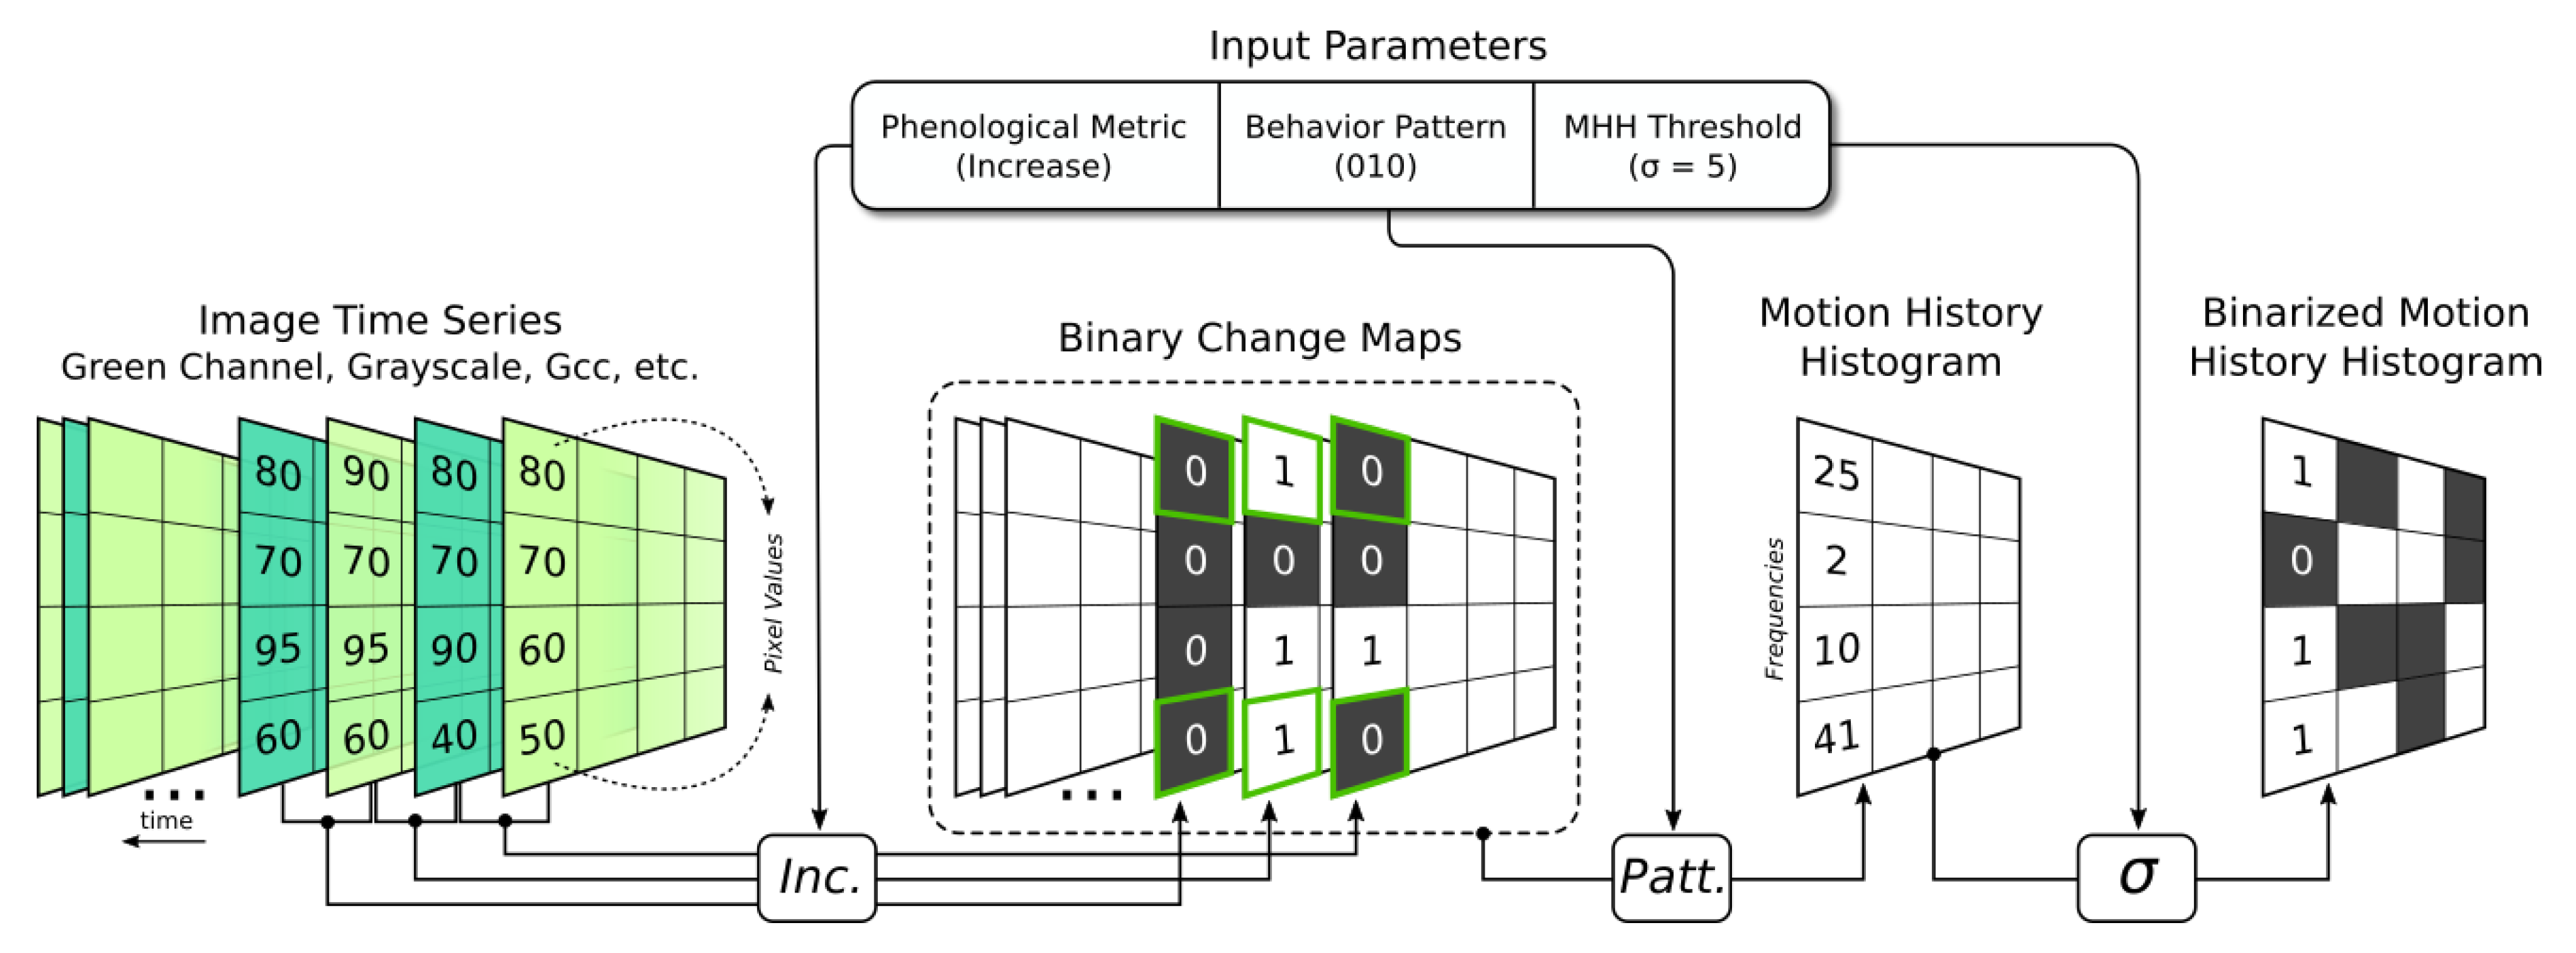
- Binary Map: This step creates a binary map encoding a phenological event, and segments the image space into foveal and peripheral regions. For such, we employ a motion history histogram (MHH) [19] to create a frequency map representing the spatial occurrence of binary behavior patterns over a sequence of binary change maps (CM). A CM encodes a desired change, which is determined by a phenological metric, between two RGB images. For instance, the metric of Increase (Equation (1)) can be used to encode a Green-up event by capturing increases in the green-channel pixel values (leaves) of a certain plant individual over time.In Equation (1), stands for the change map of two consecutive images from the sequence (the first one at timestamp t), and refers to the -pixel value in the t-th image. Note that a sequence of N images yields CMs.The successful use of CMs to depict changes on plant phenology was developed and tested using data derived from ground-based direct visual observation, and relying on MHHs to detect and represent temporal changes in arbitrary temporal multivariate numerical data [20]. Here, we applied the proposed binary encoding approach to characterize phenological events. The MHH stores the frequency each pixel featured a specific behavior in the CM sequence. For instance, a “short” Increase behavior can be modeled as 0110, which refers to an increase of the values of a specific pixel in two consecutive images. Figure 2 exemplifies the idea of detecting binary patterns in a series of typical phenological images. However, we use a binarized version of MHH as we are only interested in pixel positions where a pattern was detected with a frequency greater than a threshold sigma (). Figure 3 illustrates the complete process.
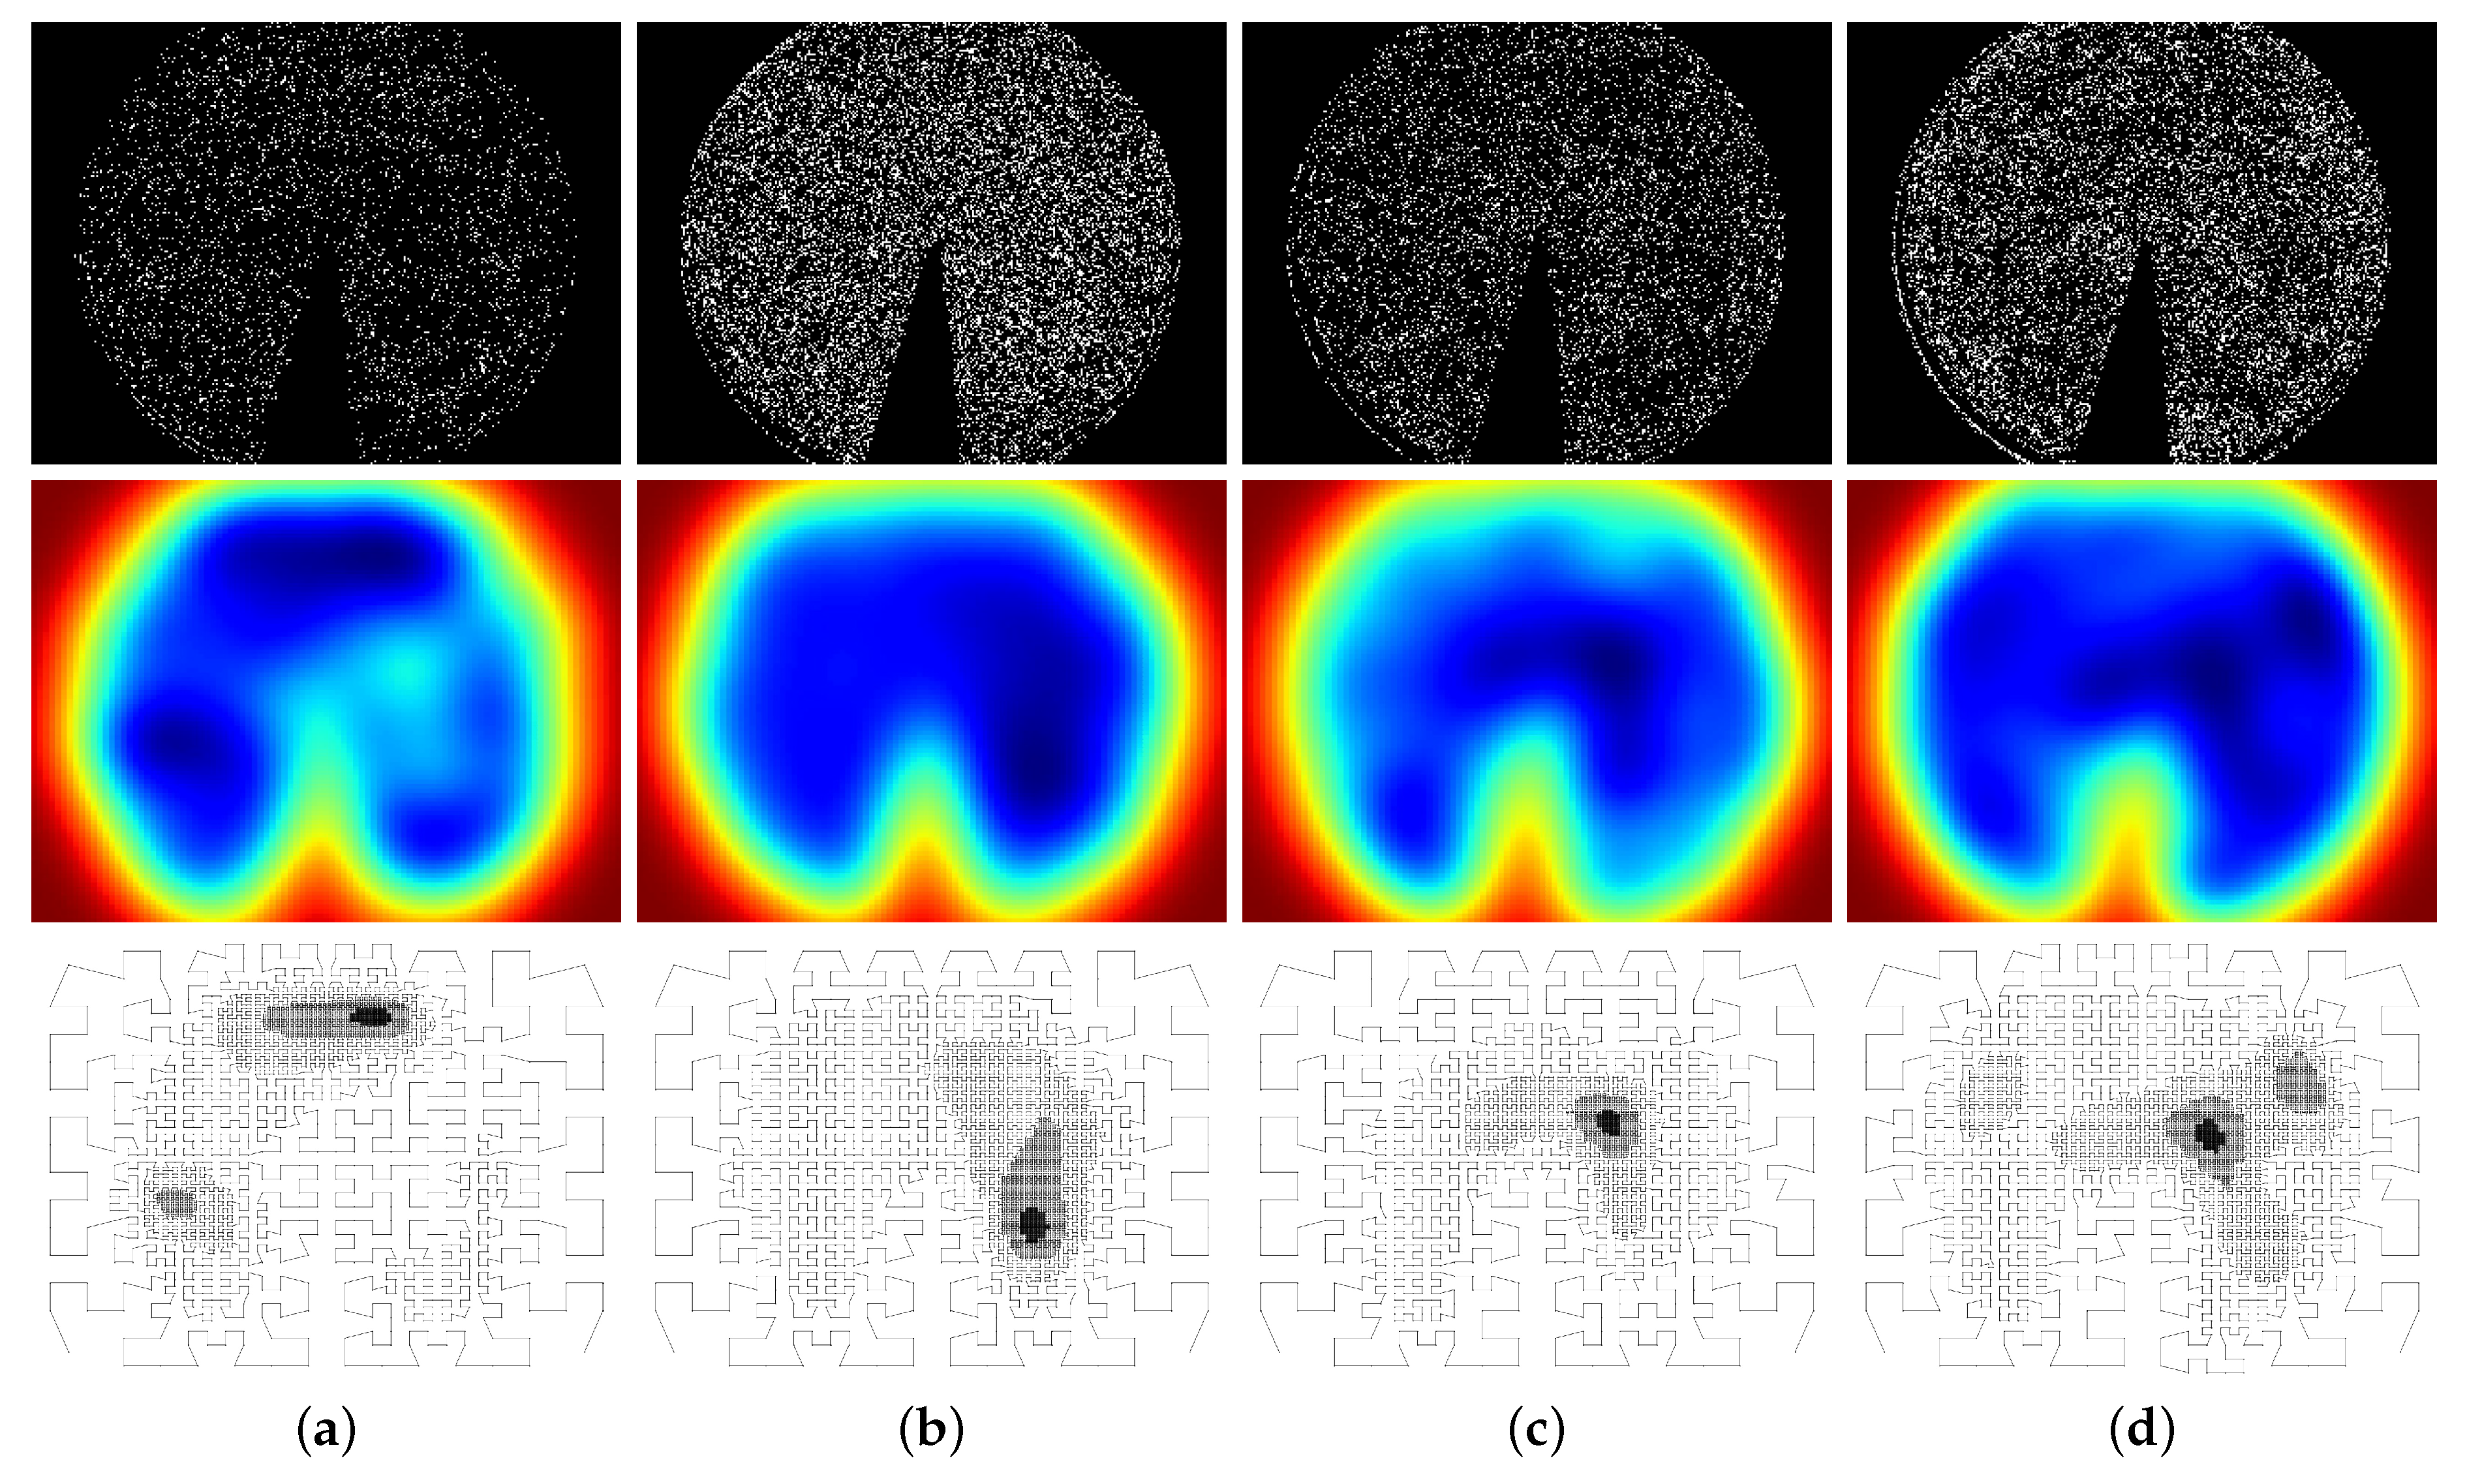
- Gaussian Kernel Density Estimation (KDE): After delineating foveal and peripheral regions, the next step estimates a 2-d non-parametric probability density function from the binary map using a KDE. The final artifact of this process is a 2-d real-valued matrix representing the corresponding function and matching the size of the map. However, as an inverse analogy to the distribution of cones in the retina, we adjusted the function such that its values increase with the distance to the fovea(s), thus resembling an upside-down 2-d mixture of Gaussians. In Figure 1, the red and blue regions indicate high and low values, respectively.
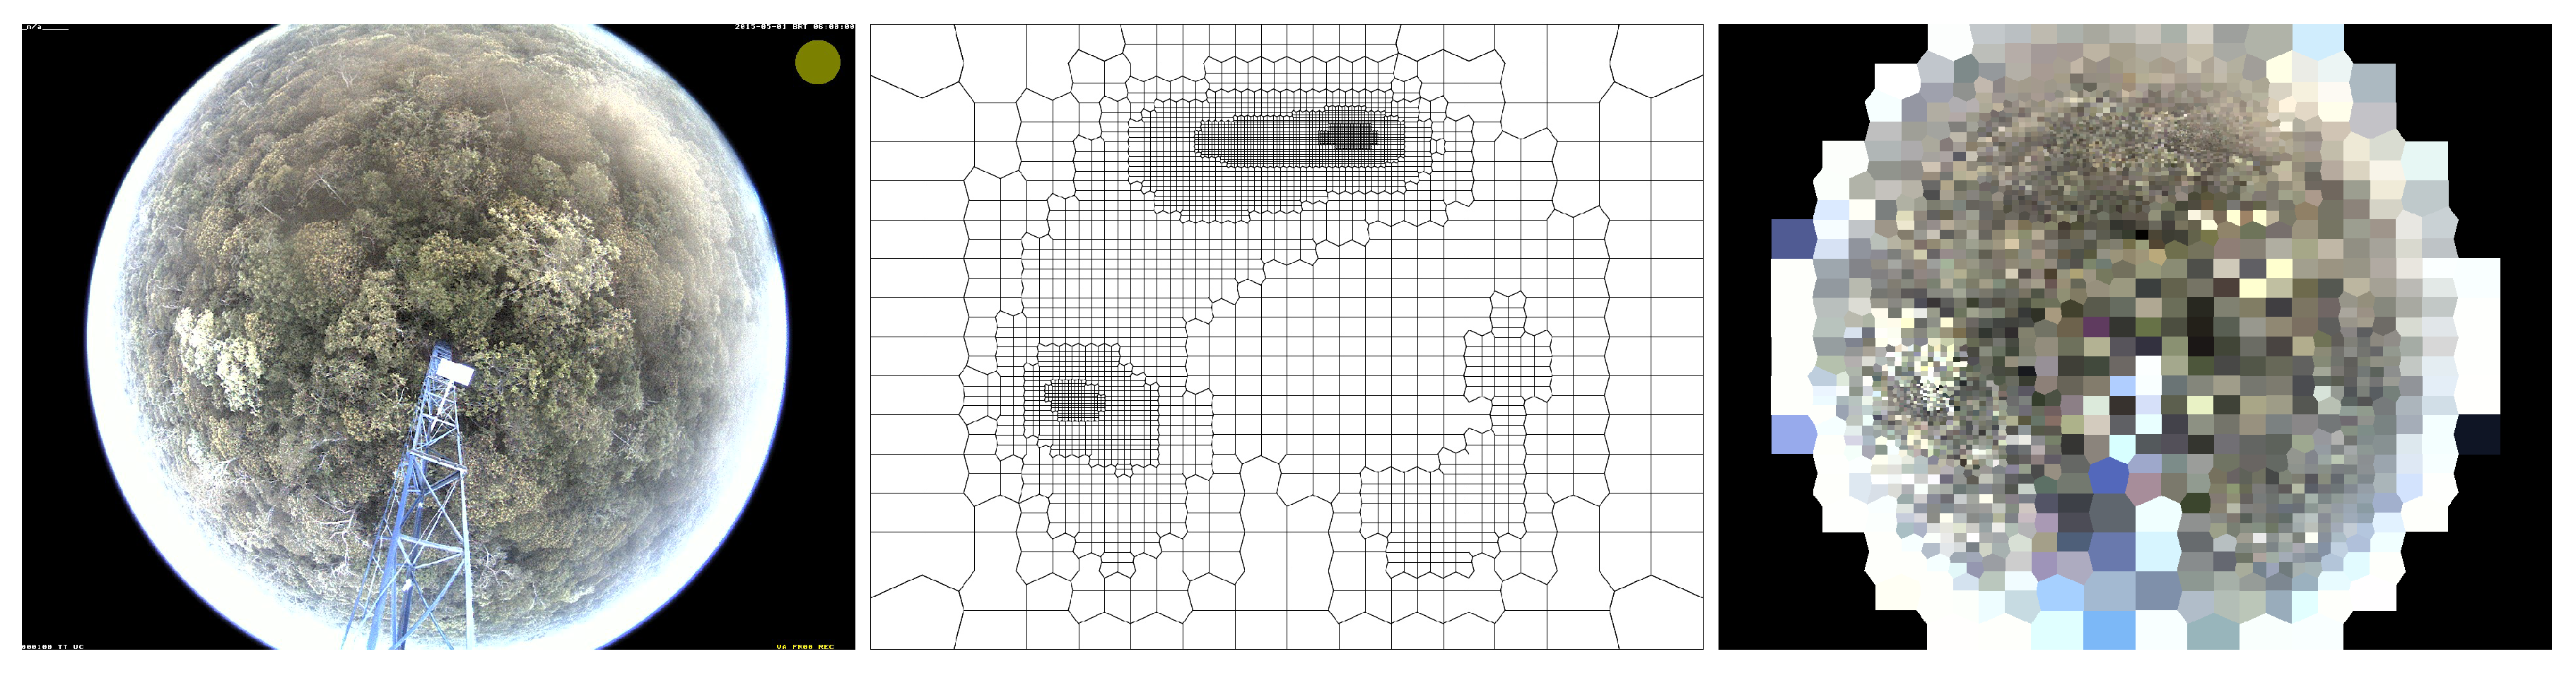
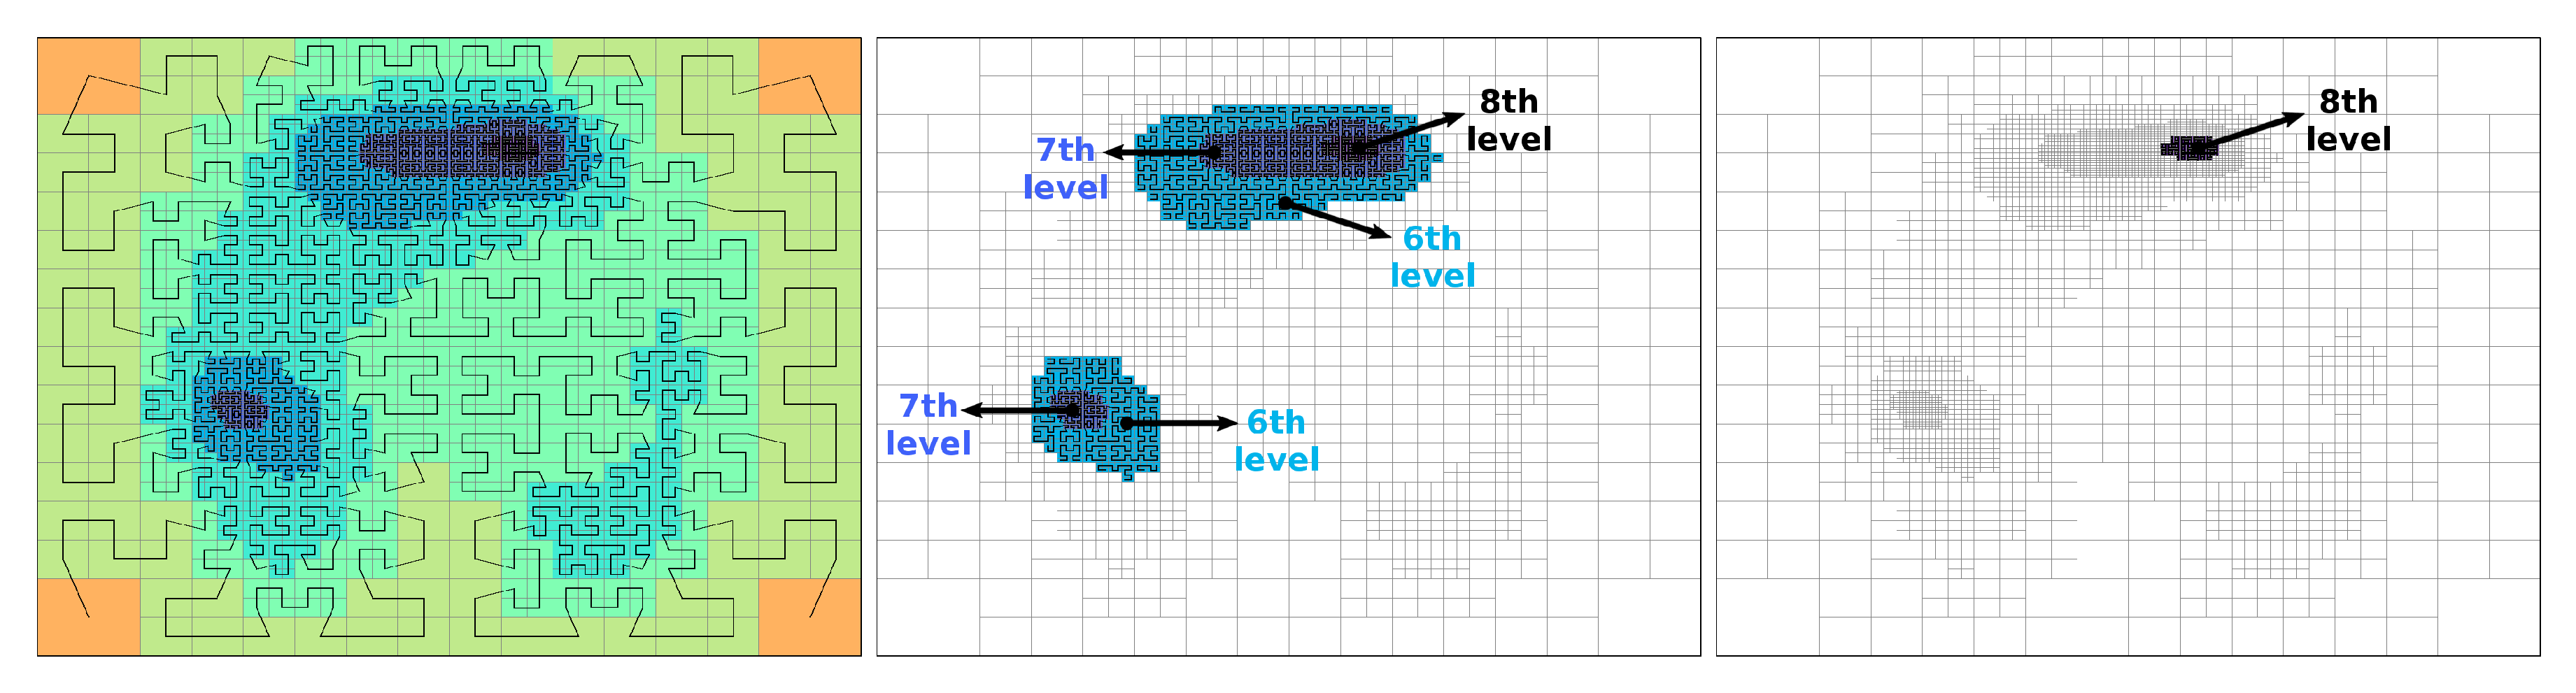
- Foveal Model: We used the non-parametric function and a Hilbert curve in a pixel-sampling procedure to create a foveal model. The Hilbert curve maps a 1-d parameter space to a higher-dimensional space (i.e., 2-d), thus creating a sequential order by visiting each midpoint of a square once. Unlike a usual raster-scan approach, the Hilbert curve favors the preservation of locality properties inherent in multidimensional data, as it traverses neighboring regions prior to visiting distant ones [21].The proposed method initially divides the image space into four squares around its center. Given that the Euclidean distances of the square’s midpoint to its two closest neighbors are greater than the value of the non-parametric function at the midpoint, each square is then recursively divided into four equal-sized squares. This can be envisioned as a gradual refinement process in which more pixels are sampled the closer these are to a fovea. The stop condition occurs when trying to reach subpixel positions, when a square is not refined any further. The final curve is not homogeneous (see Figure 1), with its vertices constituting the non-uniform sampling scheme.
- Space-Variant Region of Interest (sROI): Although the foveal model may contain regions of variable interest, one might choose only a subset of them. Having a gradually-decreasing resolution from the foveal centers towards peripheral regions could be helpful in specific circumstances. Instead of using a delimiting rectangular window or a binary mask over a uniform image, a space-variant model allows us to deal with a non-uniformly constrained region of interest, which we refer hereafter as sROI, that may represent a phenological behavior of a given plant individual over time.
3. Materials and Methods
3.1. Dataset
3.2. Foveal Models
3.3. Image Reconstruction
4. Results
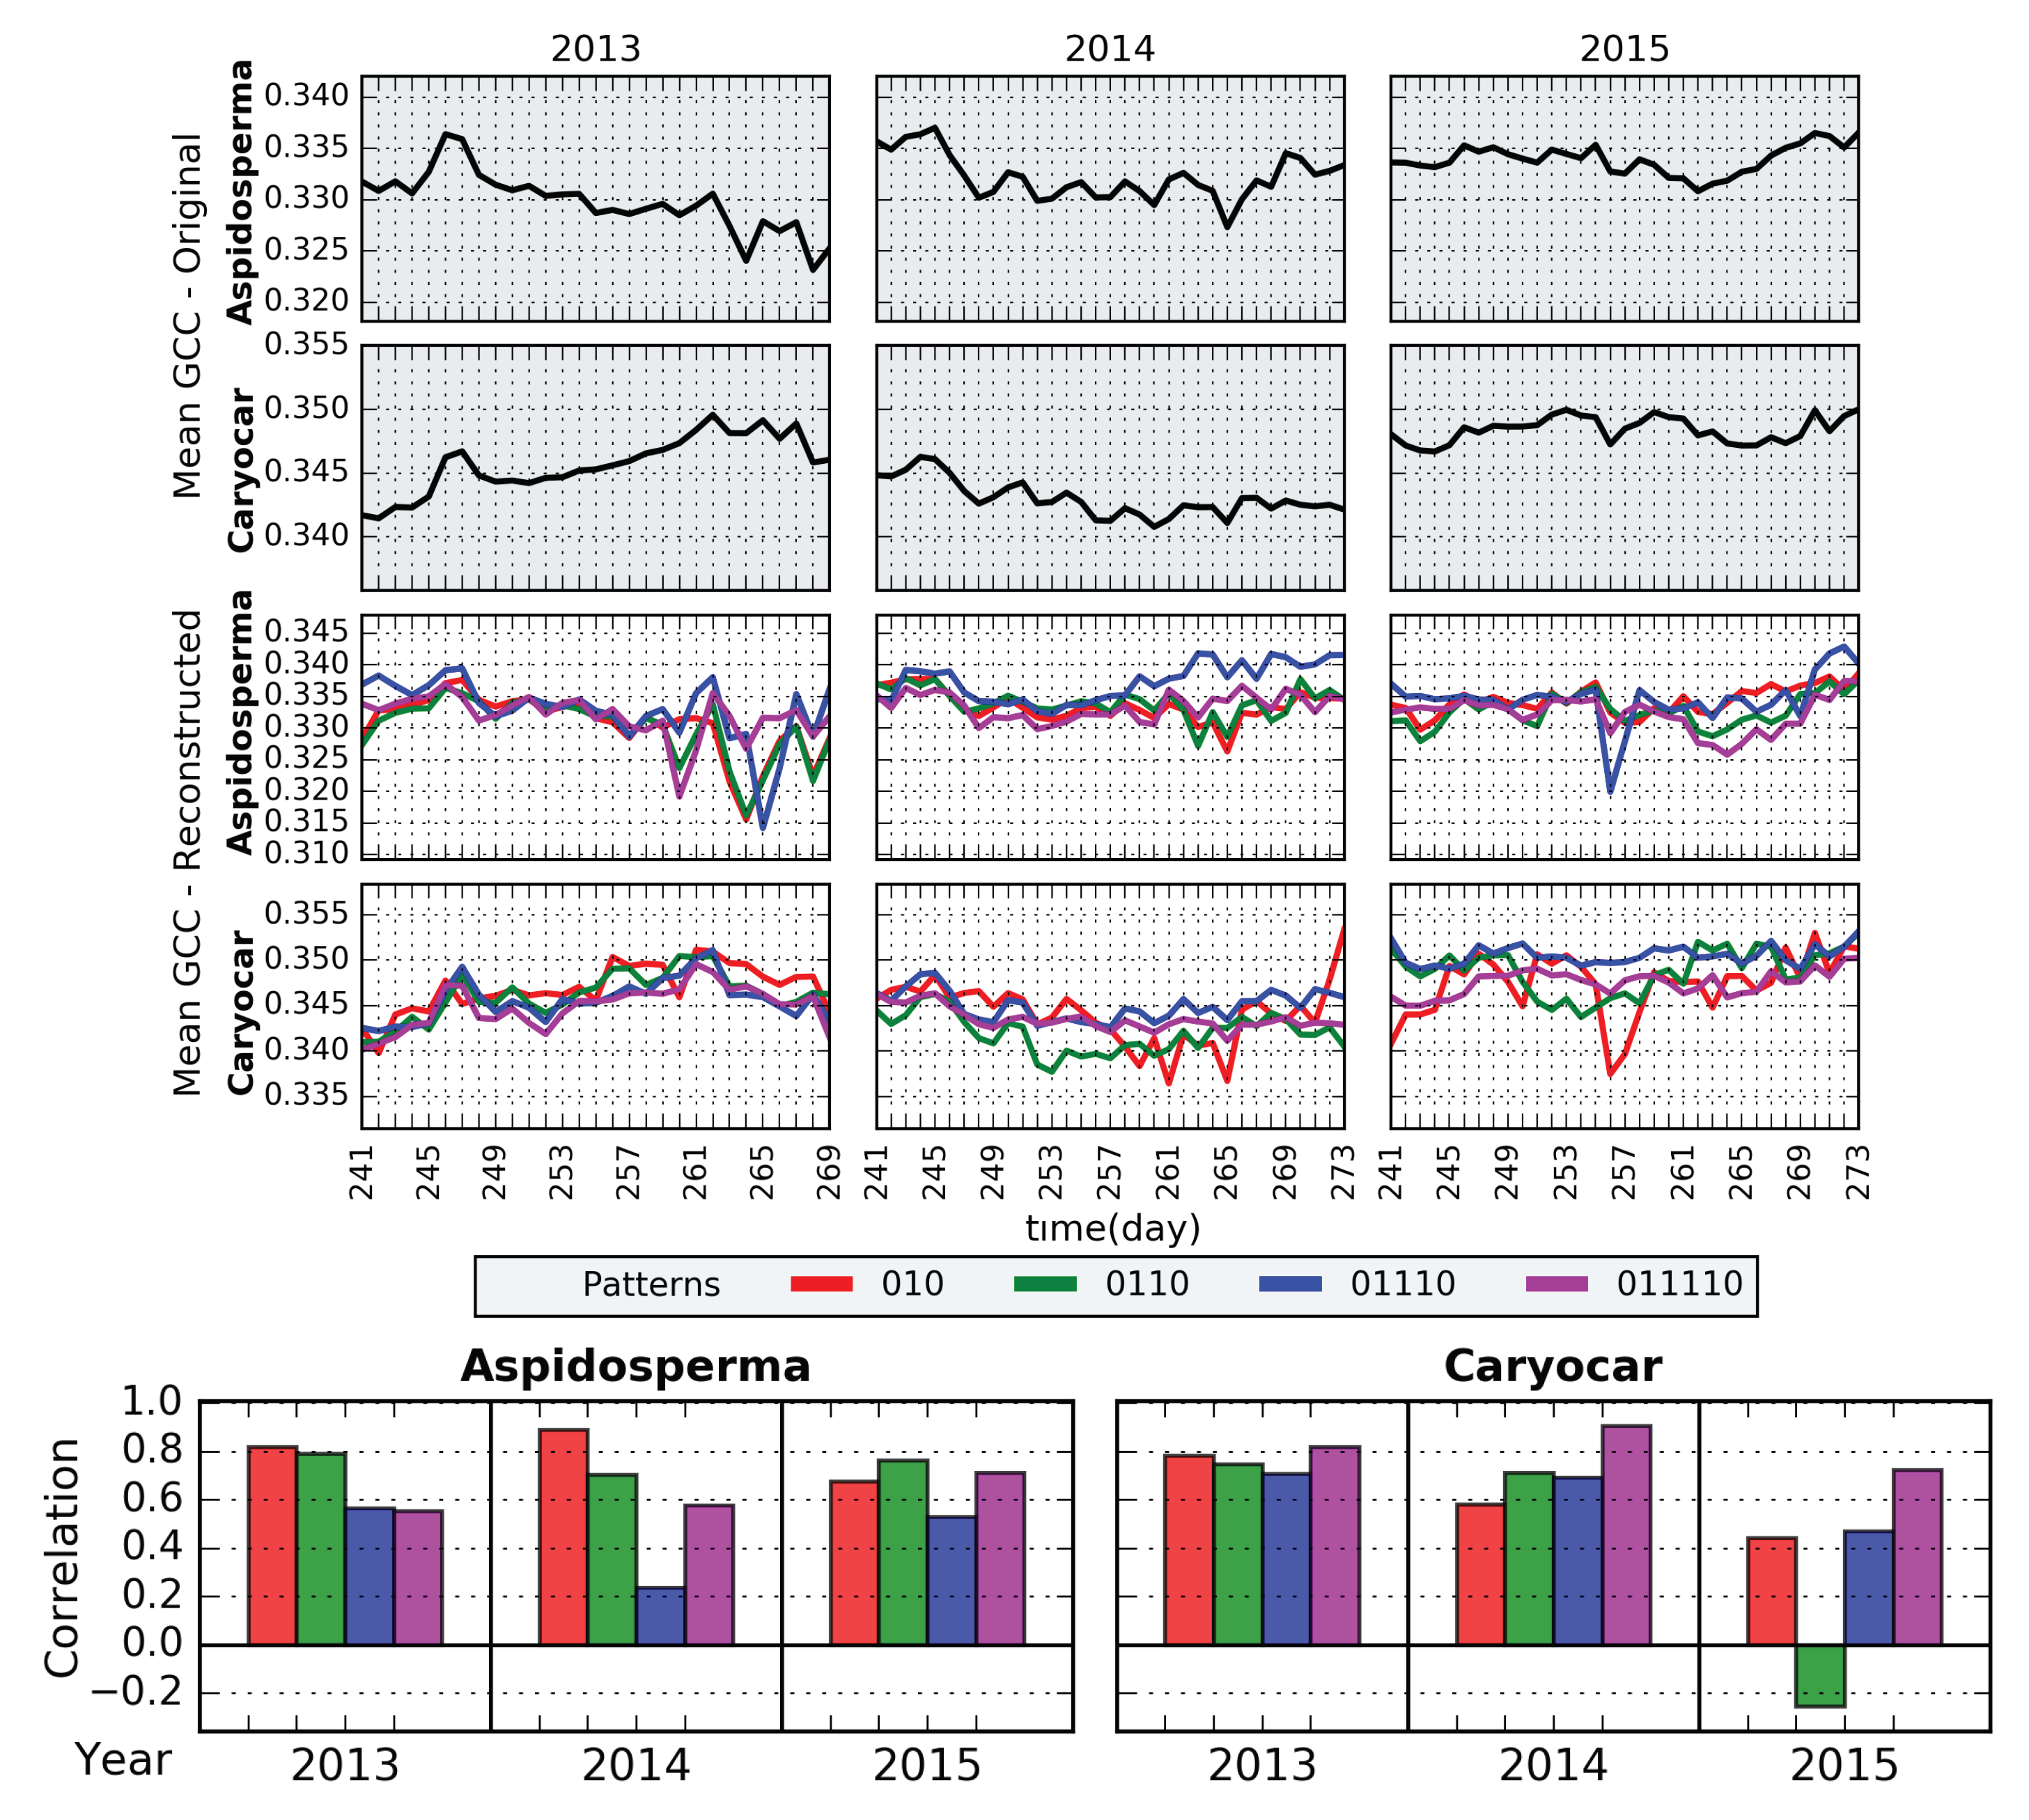
4.1. Evaluation for Reconstructed Images and ROIs
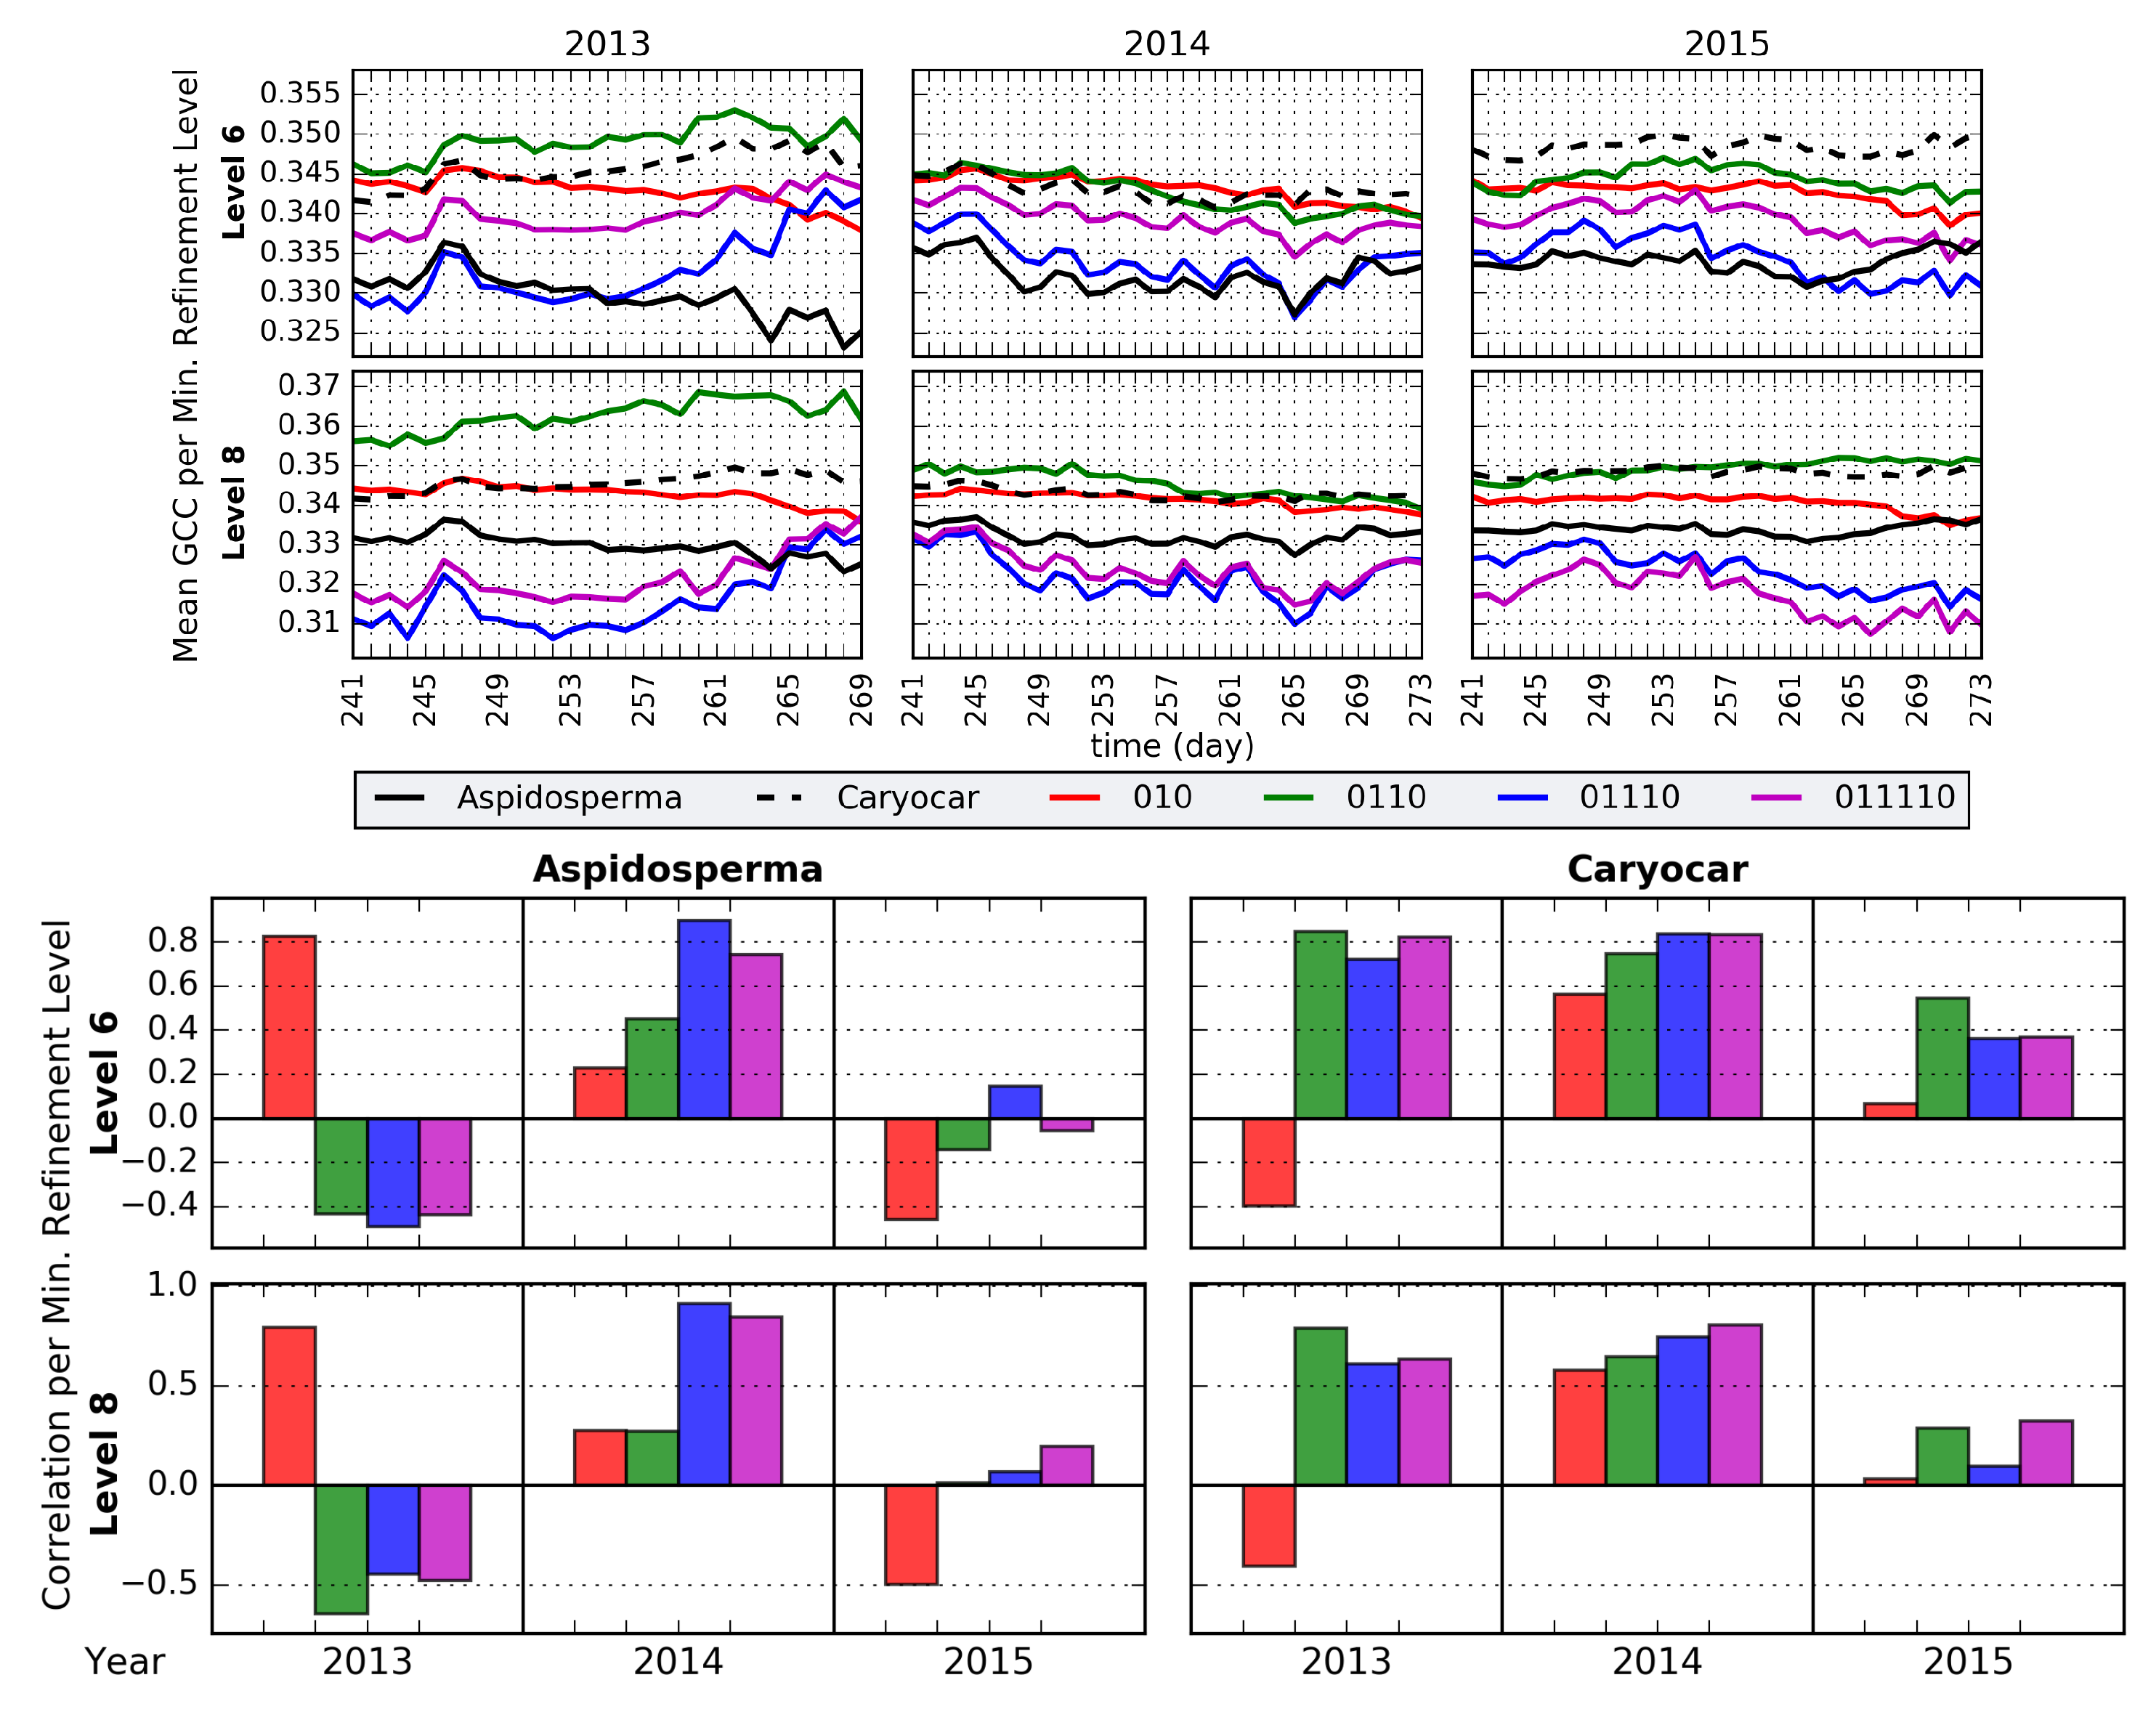
4.2. Evaluation for sROIs
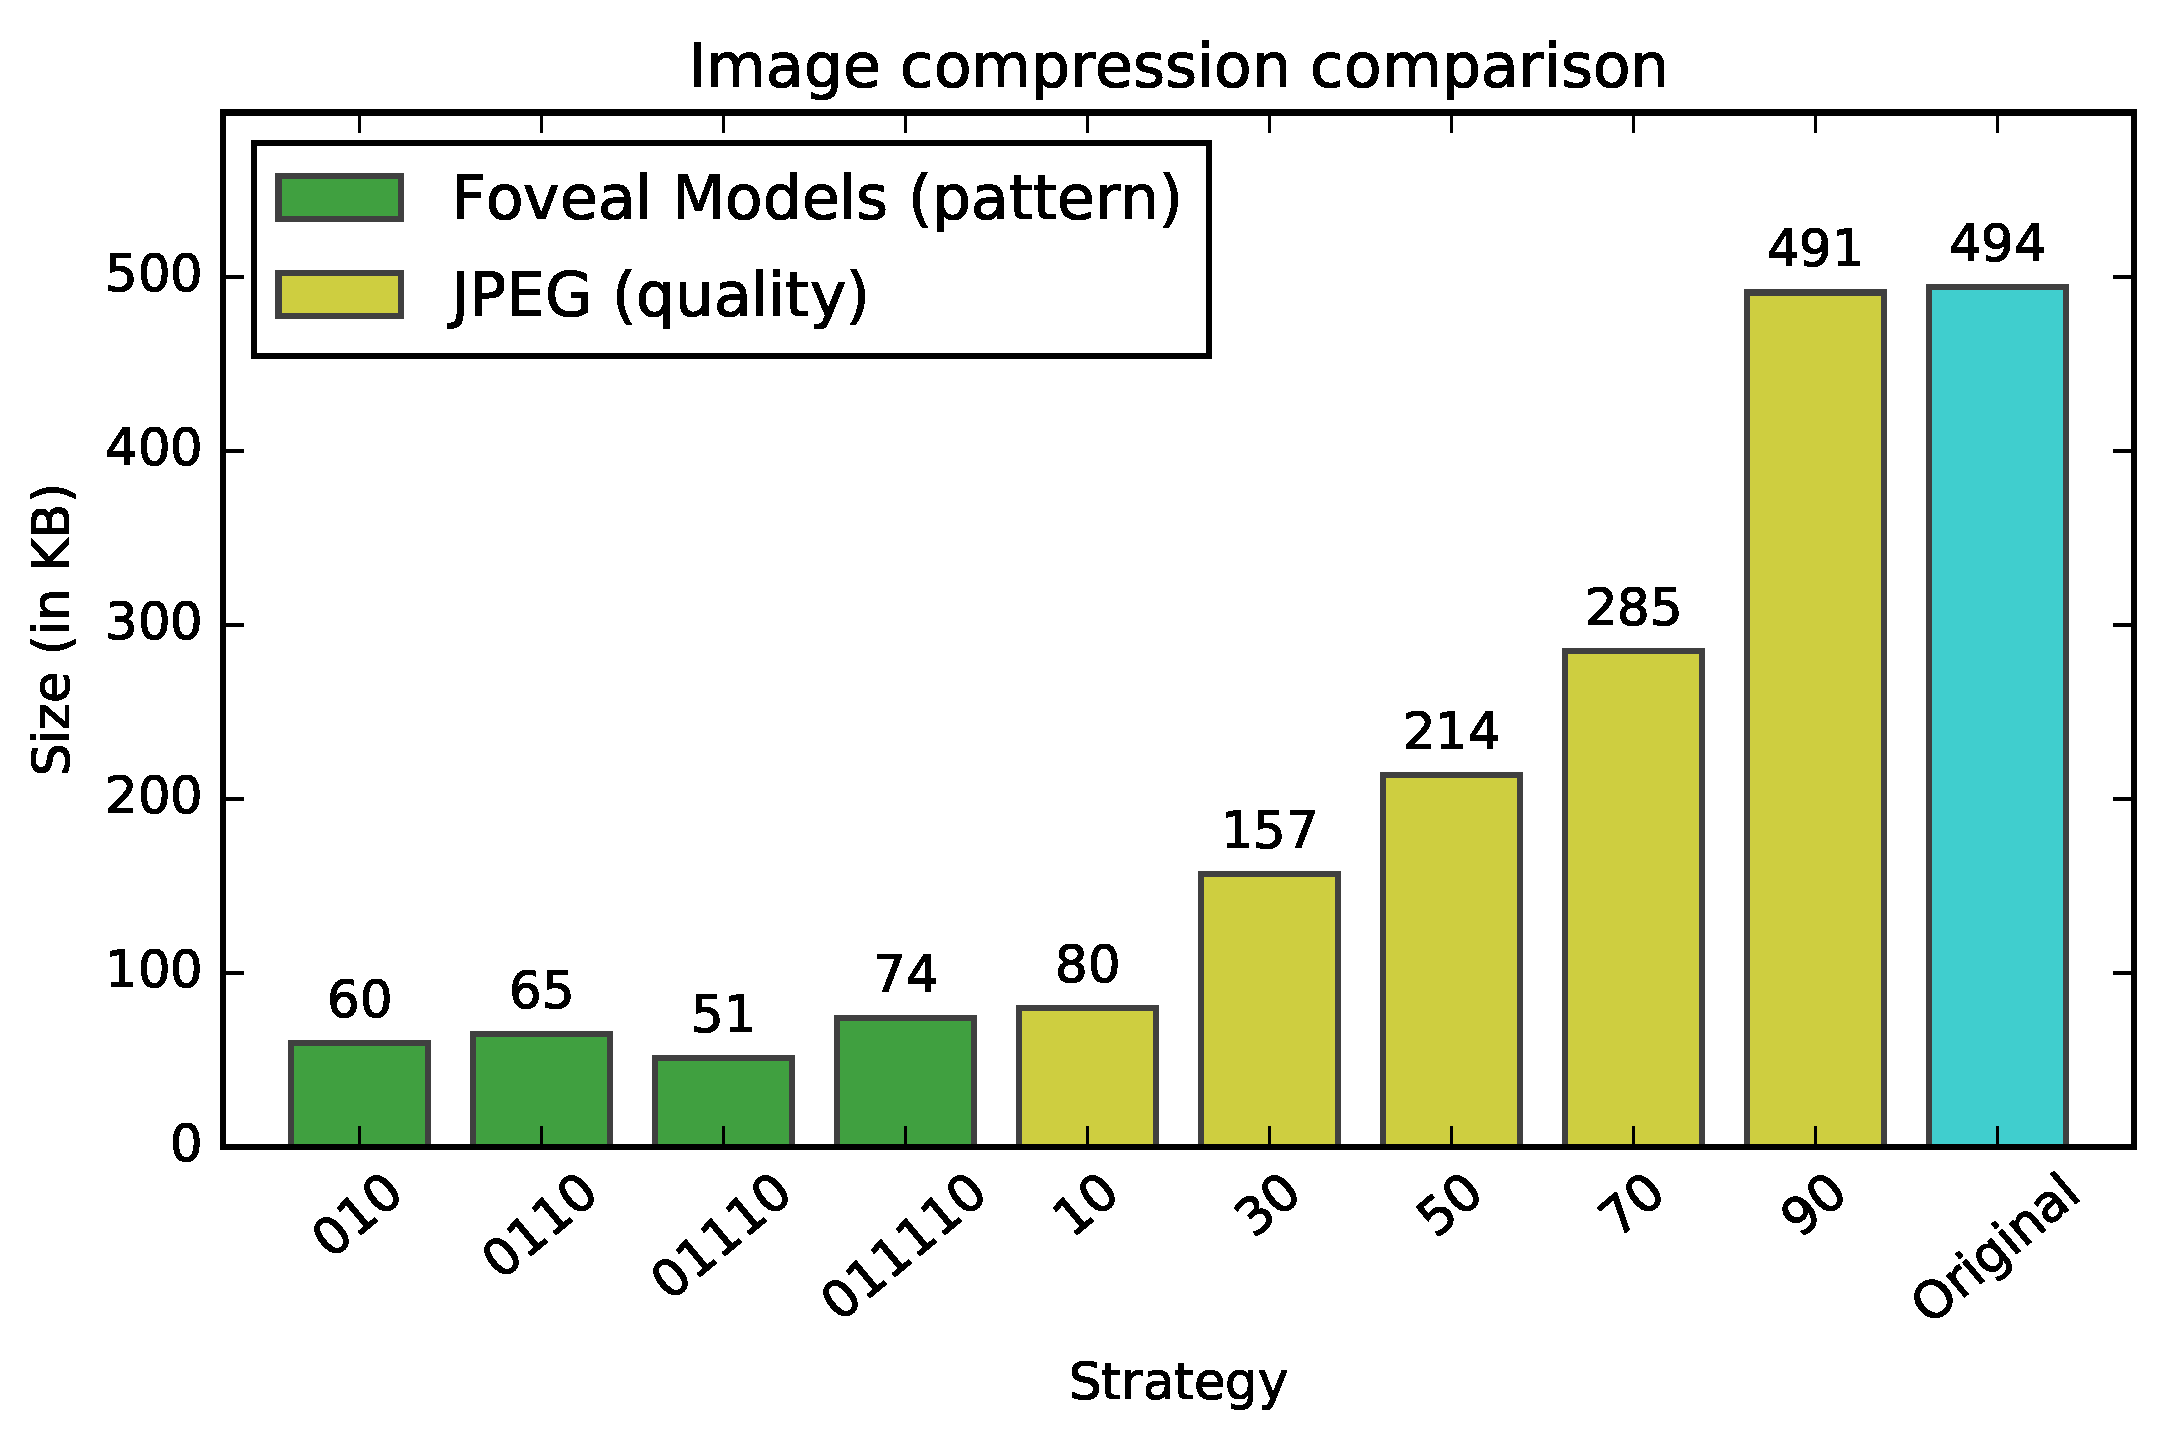
4.3. Storage Usage
5. Conclusions
Author Contributions
Funding
Conflicts of Interest
References
- Zhao, M.; Gersch, T.M.; Schnitzer, B.S.; Dosher, B.A.; Kowler, E. Eye movements and attention: The role of pre-saccadic shifts of attention in perception, memory and the control of saccades. Vis. Res. 2012, 74, 40–60. [Google Scholar] [CrossRef] [PubMed] [Green Version]
- Wandell, B.A. Foundations of Vision; Sinauer Associates, Incorporated: Sunderland, MA, USA, 1995. [Google Scholar]
- Bolduc, M.; Levine, M.D. A Review of Biologically Motivated Space-Variant Data Reduction Models for Robotic Vision. Comput. Vis. Image Underst. 1998, 69, 170–184. [Google Scholar] [CrossRef] [Green Version]
- Jurie, F. A new log-polar mapping for space variant imaging. Pattern Recognit. 1999, 32, 865–875. [Google Scholar] [CrossRef]
- Traver, J.V.; Bernardino, A.; Moreno, P.; Santos-Victor, J. Appearance-Based Object Detection in Space-Variant Images: A Multi-model Approach. In Image Analysis and Recognition: ICIAR 2004; Springer: Berlin/Heidelberg, Germany, 2004; pp. 538–546. [Google Scholar]
- Traver, V.J.; Bernardino, A. A review of log-polar imaging for visual perception in robotics. Robot. Auton. Syst. 2010, 58, 378–398. [Google Scholar] [CrossRef]
- Scassellati, B. Eye Finding via Face Detection for a Foveated, Active Vision System. In Proceedings of the Fifteenth National/Tenth Conference on Artificial Intelligence/Innovative Applications of Artificial Intelligence, American Association for Artificial Intelligence (AAAI ’98/IAAI ’98), Madison, WI, USA, 27–29 July 1998; pp. 969–976. [Google Scholar]
- Pardo, F.; Llorens, I.; Micó, F.; Boluda, J.A. Space variant vision and pipelined architecture for time to impact computation. In Proceedings of the 5th International Workshop on Computer Architectures for Machine Perception, Padova, Italy, 11–13 September 2000; pp. 122–126. [Google Scholar]
- Niu, Y.; Chang, J.; Lv, F.; Shen, B.; Chen, W. Low-cost dynamic real-time foveated imager. Appl. Opt. 2017, 56, 7915–7920. [Google Scholar] [CrossRef] [PubMed]
- Shi, C.; Zhang, J.; Zhang, Y. A Novel Vision-Based Adaptive Scanning for the Compression of Remote Sensing Images. IEEE Trans. Geosci. Remote Sens. 2016, 54, 1336–1348. [Google Scholar] [CrossRef]
- Bektas, K.; Cöltekin, A.; Krüger, J.; Duchowski, A.T. A Testbed Combining Visual Perception Models for Geographic Gaze Contingent Displays; Bertini, E., Kennedy, J., Puppo, E., Eds.; Eurographics Conference on Visualization (EuroVis)—Short Papers; The Eurographics Association: Norrköping, Sweden, 2015. [Google Scholar] [CrossRef]
- Morellato, L.P.C.; Alberton, B.; Alvarado, S.T.; Borges, B.; Buisson, E.; Camargo, M.G.G.; Cancian, L.F.; Carstensen, D.W.; Escobar, D.F.; Leite, P.T.; et al. Linking plant phenology to conservation biology. Biol. Conserv. 2016, 195, 60–72. [Google Scholar] [CrossRef] [Green Version]
- Schwartz, M.D. Phenology: An Integrative Environmental Science; Springer: Berlin, Germany, 2013. [Google Scholar]
- Richardson, A.D.; Braswell, B.H.; Hollinger, D.Y.; Jenkins, J.P.; Ollinger, S.V. Near-surface remote sensing of spatial and temporal variation in canopy phenology. Ecol. Appl. 2009, 19, 1417–1428. [Google Scholar] [CrossRef] [PubMed]
- Alberton, B.; da S. Torres, R.; Cancian, L.F.; Borges, B.D.; Almeida, J.; Mariano, G.C.; dos Santos, J.; Morellato, L.P.C. Introducing digital cameras to monitor plant phenology in the tropics: Applications for conservation. Perspect. Ecol. Conserv. 2017, 15, 82–90. [Google Scholar] [CrossRef]
- Reed, B.C.; Schwartz, M.D.; Xiao, X. Remote Sensing Phenology: Status and the Way Forward. In Phenology of Ecosystem Processes; Noormets, A., Ed.; Springer: New York, NY, USA, 2009; pp. 231–246. [Google Scholar] [CrossRef]
- Klosterman, S.; Melaas, E.; Wang, J.A.; Martinez, A.; Frederick, S.; O’Keefe, J.; Orwig, D.A.; Wang, Z.; Sun, Q.; Schaaf, C.; et al. Fine-scale perspectives on landscape phenology from unmanned aerial vehicle (UAV) photography. Agric. For. Meteorol. 2018, 248, 397–407. [Google Scholar] [CrossRef]
- Floren, A.; Bovik, A.C. Chapter 14—Foveated Image and Video Processing and Search. In Academic Press Library in Signal Processing; Trussell, J., Srivastava, A., Roy-Chowdhury, A.K., Srivastava, A., Naylor, P.A., Chellappa, R., Theodoridis, S., Eds.; Elsevier: Amsterdam, The Netherlands, 2014; Volume 4, pp. 349–401. [Google Scholar]
- Meng, H.; Pears, N.; Freeman, M.; Bailey, C. Motion History Histograms for Human Action Recognition. In Embedded Computer Vision; Kisačanin, B., Bhattacharyya, S.S., Chai, S., Eds.; Springer: London, UK, 2009; pp. 139–162. [Google Scholar]
- Mariano, G.C.; Soares, N.C.; Morellato, L.P.C.; Torres, R.D.S. Change Frequency Heatmaps for Temporal Multivariate Phenological Data Analysis. In Proceedings of the 2017 IEEE 13th International Conference on e-Science (e-Science), Auckland, New Zealand, 24–27 October 2017; pp. 305–314. [Google Scholar]
- Bader, M. Space-Filling Curves: An Introduction with Applications in Scientific Computing, 1st ed.; Springer: Berlin, Germany, 2013; Volume 1. [Google Scholar]
- Alberton, B.; Almeida, J.; Helm, R.; Torres, R.D.S.; Menzel, A.; Morellato, L.P.C. Using phenological cameras to track the green up in a cerrado savanna and its on-the-ground validation. Ecol. Inform. 2014, 19, 62–70. [Google Scholar] [CrossRef]
- Sonnentag, O.; Hufkens, K.; Teshera-Sterne, C.; Young, A.M.; Friedl, M.; Braswell, B.H.; Milliman, T.; O’Keefe, J.; Richardson, A.D. Digital repeat photography for phenological research in forest ecosystems. Agric. For. Meteorol. 2012, 152, 159–177. [Google Scholar] [CrossRef]
- Wang, Z.; Bovik, A.C.; Sheikh, H.R.; Simoncelli, E.P. Image quality assessment: From error visibility to structural similarity. IEEE Trans. Image Process. 2004, 13, 600–612. [Google Scholar] [CrossRef] [PubMed] [Green Version]


| Metric/Pattern | 010 | 0110 | 01110 | 011110 |
|---|---|---|---|---|
| RMSE | 0.2532 | 0.2493 | 0.2509 | 0.2414 |
| MAE | 0.1580 | 0.1555 | 0.1570 | 0.1508 |
| SSIM | 0.3837 | 0.3862 | 0.3836 | 0.3833 |
| PSNR | 11.9327 | 12.0676 | 12.0135 | 12.3479 |
| Storage Results | 010 | 0110 | 01110 | 011110 | ||||
|---|---|---|---|---|---|---|---|---|
| Full | sROI | Full | sROI | Full | sROI | Full | sROI | |
| Number of points (pixels) | 4123 | 2954 | 4954 | 3606 | 3286 | 2069 | 5629 | 4187 |
| Approx. size (in kilobytes) | 12.07 | 8.65 | 14.51 | 10.56 | 9.62 | 6.06 | 16.49 | 12.26 |
| Original image size | (1280 × 960) pixels × 3 bytes = 3600 kilobytes | |||||||
| Approx. reduction in size (%) | 99.66 | 99.75 | 99.59 | 99.70 | 99.73 | 99.83 | 99.54 | 99.65 |
© 2020 by the authors. Licensee MDPI, Basel, Switzerland. This article is an open access article distributed under the terms and conditions of the Creative Commons Attribution (CC BY) license (http://creativecommons.org/licenses/by/4.0/).
Share and Cite
Silva, E.; Torres, R.d.S.; Alberton, B.; Morellato, L.P.C.; Silva, T.S.F. A Change-Driven Image Foveation Approach for Tracking Plant Phenology. Remote Sens. 2020, 12, 1409. https://doi.org/10.3390/rs12091409
Silva E, Torres RdS, Alberton B, Morellato LPC, Silva TSF. A Change-Driven Image Foveation Approach for Tracking Plant Phenology. Remote Sensing. 2020; 12(9):1409. https://doi.org/10.3390/rs12091409
Chicago/Turabian StyleSilva, Ewerton, Ricardo da S. Torres, Bruna Alberton, Leonor Patricia C. Morellato, and Thiago S. F. Silva. 2020. "A Change-Driven Image Foveation Approach for Tracking Plant Phenology" Remote Sensing 12, no. 9: 1409. https://doi.org/10.3390/rs12091409
APA StyleSilva, E., Torres, R. d. S., Alberton, B., Morellato, L. P. C., & Silva, T. S. F. (2020). A Change-Driven Image Foveation Approach for Tracking Plant Phenology. Remote Sensing, 12(9), 1409. https://doi.org/10.3390/rs12091409