Abstract
The wettest 2018 long rainy season (March to May (MAM)) resulted in daily intensive rainfall events in East Africa that have seriously affected the environment and economy in many countries. Land subsidence is one of the environmental disasters that has occurred due to the long rainy season in Kenya for many years. However, it has received limited scientific attention. In this paper, we incorporate hydrological (soil moisture active–passive (SMAP) and loading models) and geodetic data (global positioning system (GPS) and interferometric synthetic aperture radar (InSAR)) to study hydrological changes and their associated subsidence potential in Kenya. Results show that widespread subsidence of more than 20 mm was associated with the MAM season in Kenya during 2018, based on SBAS InSAR measurements. The high values of land subsidence were well correlated with the areas of intense flooding during the MAM season. The widespread subsidence during the wet season has implications for the stability of the earth’s surface during the season rather than creating the possibility of potential stresses along active faults. These stresses may trigger seismicity that is expected to pose risks to urban features. The results of the current study can help governmental authorities to adopt proper urban planning that avoids or minimizes the risks of land subsidence in the areas of sinkholes.
1. Introduction
Following the devastating drought that struck the Horn of Africa for two years (2016–2017), the wettest 2018 long rainy season (March to May (MAM)) resulted in episodes of exceptional rainfall every day [1]. The rainfall events triggered extensive flooding with a notably high impact on society, including a significant number of casualties and the displacement of around one million people. This impact extended to environmental and economic disasters, including crop failures, livestock deaths, and water and shallow aquifer contamination across Kenya, Somalia, Ethiopia, Uganda, and South Sudan [2,3,4]. Land subsidence is one of the environmental disasters that has occurred as a result of the rainy seasons in Kenya for a long time [5]. However, few studies have been conducted into this phenomenon.
The hydroclimatic cycle (event-to-event) dominates the terrestrial hydrological regimes in East Africa, where a prolonged dry spell may be interrupted by exceptionally wet seasons [6]. East Africa experiences two rainy seasons caused by different climate circulation mechanisms: a short season, extending from October to December, and the long season that extends from March to May (MAM). The short season is typically associated with a strong Indian Ocean dipole (IOD) and the El Niño southern oscillation (ENSO) (the weather is wet during El Niño episodes, and dry during La Niña episodes) [7]. The long rainy season (MAM) is correlated with changes in sea surface temperature in the northwest Indian Ocean and the seasonal cycle of the quasi-biennial oscillation and Madden–Julian oscillation (MJO) [8,9]. Fluctuations between the two seasons have been notable since the 1960s but have shown no significant climatic trend [8]. In general, Kenya experiences a moderate drought or floods every three to four years rather than a major drought every 10 years [10]. The 2016–2017 drought event was the most notable drought in the last few decades, and it was probably associated with the La Niña conditions. This drought event was interrupted by the extensive flooding of the 2018 MAM rainy season, which was the wettest season recorded in 70 years. The burden imposed by the two hydroclimatic extremes has affected the economy of the country, and there is a possibility of this continuing with high severity into the future. It is estimated that by 2030, the costs could reach 2.6% per year of the gross domestic product (GDP) of the country [10]. In this context, many negative consequences may be triggered by the continuous changes to the hydrological regimes in Kenya, including land subsidence.
Land subsidence is a process that frequently occurs across the Great Rift Valley in Kenya after the long rainy season. The process occurs either suddenly or steadily and is usually associated with no horizontal deformations [11]. Through the subsidence process, rainwater falls into subsurface channels and moves along the connected fissures down slopes and faults to form subsurface streams and open channels. The subsurface streams subsequently erode the rocks to the extent that deep sinkholes are created, leading to eventual underground collapse [12]. Subsidence resulted in collapsing buildings and roads and potential loss of life in Nakuru and Barut areas (central Kenya) in 1988, 1993, and 1997 [12]. Using very low-frequency electromagnetic (VLF-EM), magnetic, and gravity methods, Dindi [5] was able to identify and map the hazardous areas of land subsidence in southwest Nakuru town. The results of the geophysical investigation indicated that the spatial orientation of the subsiding areas was in a north–south direction, which is remarkably aligned with the structural trends of the Rift Valley. Capturing the land deformations related to rain using geodetic techniques (e.g., global positioning system (GPS) and interferometric synthetic aperture radar (InSAR)) is rarely possible due to the rapid occurrence of floods (within days or weeks). Therefore, the absence of a GPS station or the availability of only longer temporal baselines for the SAR satellites potentially hinders the detection and measurement of land deformations associated with rapid events such as flooding. Unlike rapid flooding, the solid-earth response to hydrological events that take months to years (e.g., monsoons, the seasonal cycle of land water, and droughts) has been extensively monitored using both GPS and InSAR techniques. For example, the seasonal changes in land deformation due to hydrological loading has been assessed in many regions, such as southern Alaska [13], the Himalayas [14], West Africa [15], East Africa [16], and Australia [17]. To study monsoon impacts, Steckler et al. [18] used 18 GPS stations to measure the vertical deformations that resulted from water load during the summer monsoon in Bangladesh. They measured loading deformations equivalent to >50% of the total variance of the vertical deformation.
After the launch of the Sentinel-1 satellites in 2014, their short latency time (a week) created the possibility of mapping the extent of flooding [19,20] and its associated land subsidence [21]. Recently, Miller and Shirzaei [22] mapped the extent of Hurricane Harvey in eastern Texas, US, and concluded that the subsidence rate was in the order of 5mm/year, which affected 85% of the flooded area. Zhang et al. [23] used Sentinel-1 data to detect and map the flooded area during Hurricane Irma in Palmdale, southern Florida, in 2017. Taking advantage of the coherence change due to flooding, Chini et al. [24] mapped the flooded urban areas during Hurricane Harvey in Houston, Texas. They concluded that the smaller the temporal baseline of SAR images, the more suitable they are for detecting coherence changes in the flooded areas. In contrast, the longer the temporal baseline, the more suitable the images are for classifications of urban land [24].
In this study, we present the first assessment of the MAM season-induced land deformations in Kenya using GPS, InSAR, and hydrological loading models. We first present the magnitude and duration of the MAM season using precipitation (P) and soil moisture (SM) anomalies from across the East African countries (Kenya, Uganda, Ethiopia, Somalia, and South Sudan). Second, the vertical land deformations and flood extent are mapped using the Sentinel-1 satellite radar system. Third, the estimated magnitude of land deformations from GPS and InSAR are compared with the model calculation of load deformations.
2. Materials and Methods
Different hydrological, geodetic, and loading models’ data are incorporated into this research as described below.
2.1. Hydrological Data (CPC, SMAP, VIC, NOAH-3.3)
The daily precipitation data of the climate prediction center (CPC) project was used to map the intensity of precipitation during the MAM season. CPC data is available globally at a spatial resolution of 0.5° * 0.5° based on global gauge stations [25]. Similarly, soil moisture (SM) saturation was estimated from the soil moisture active–passive (SMAP) satellites. SMAP satellites provide daily data regarding land surface soil moisture with a 2–3 days’ repeat cycle. The images of 9 km spatial resolution is included in this research, which represents a daily global composite product of the surface soil moisture [26,27]. Also, two global hydrological models were used to investigate the state of the hydrological fluxes and SM in Kenya before, during, and after the MAM. These models are the variable infiltration capacity (VIC) model and NOAH-3.3 model [28,29]. The VIC model is one of four land surface models that simulate the states of water and energy budget components derived from the global land data assimilation system of version 1. The VIC model simulates various hydrological fluxes, including P, evapotranspiration (ET), and runoff (R) along with the storage of SM, canopy water, and snow water. The version implemented here has a temporal resolution of a month and a spatial resolution of 1.0° * 1.0°. Similarly, NOAH-3.3 simulates the same hydrological variables with different parameters. NOAH-3.3 represents the GLDAS-2.1 version with a spatial resolution of 0.25° * 0.25° at monthly time intervals [28,29,30]. The differences between the two versions of GLDAS rely on correcting the biases in forcing data of the agricultural meteorological modeling system (AGMET) radiation flux field and using the global precipitation climatology project (GPCP) and tropical rainfall measuring mission dataset instead of the CPC merged analysis of precipitation (CMAP) dataset [31]. To show the intensity of the precipitation, the data has been fitted to the regional empirical cumulative density functions (ECDF) [32]. ECDF is probability distribution functions of the precipitation rate and soil moisture saturation during the MAM season. It represents the cumulative distribution of rainfall and soil saturation in East Africa at monthly scale relative to the total populations (January–June 2018). It ranges from 0 to 1, where the values close to zero indicate small or no areas under flooding with low soil saturation and low rainfall. The maximum values indicate the highest saturation of the soil and high rainfall, therefore, the highest probability of flooding. The averaged time series of hydrological fluxes and SM changes across Kenya through the MAM event were obtained based on VIC and NOAH-3.3 models.
2.2. Geodetic Data
We used two independent geodetic data sources (GPS and SAR) to map and estimate the deformations during the 2018 flood events associated with the MAM season. The GPS data were represented by the available (DKUT) station located at longitude 36.961°E and latitude 0.398°S and at an altitude of 1775 m above sea level. This data was acquired from the Nevada geodetic lab [33]. The DKUT time series were organized in a processing chain as part of the global solution data, including more than 8000 stations [33]. The daily RINEX GPS files were processed using the precise point positioning method [34] implemented by the GPS inferred positioning system (GIPSY) OASIS II software. A number of conventions and models are used for correction and to obtain the final results, the estimation of white noises, tidal ocean loading, and pole tidal loading, including the satellite orbital information and calibrating the antenna phases [35,36]. The final result of the coordinates is compared to the global reference frame from the International GNSS Service 2008 (IGS08). To suppress the common-mode errors (CME) [37], which usually result from previous corrections, the singular spectrum analysis (SSA) method was used for the final results. SSA decomposes the time series into interpretable components with no prior assumptions [38]. The CME was identified as a highly varied component. The trend component was reconstructed using eigentriples one and four, and for the season component eigentriples three, five, and six were used. The rest of the 10 eigentriples represented the CME component. The analysis was applied only to the vertical component. By applying the SSA, the variance of the component was reduced from 9.6 mm in the raw data to 3.8 mm in the reconstructed components. SSA was used to model the seasonal signal from the GPS time series [38,39].
The InSAR data were represented by 74 images (Figure 2 and Table S1 in the Supplementary Information Section) acquired by a Sentinel-1 satellite from August 2016 to June 2019 with an ascending orbit of path 57 and frame 1175 (Figure 1), Level-1, single-look complex (SLC). The InSAR radar data with a temporal baseline of 100 days and spatial baseline of up to 100 m were coregistered at the pixel level using the orbital information and the 30 m digital elevation model (DEM) acquired by the shuttle radar topography mission (SRTM) [40]. The coregistered images were then used to generate a high number of interferograms, 518 pairs, that allowed monitoring of the short temporal deformations (Figure 2). The images were aligned to the super master image captured on 26 February 2018. The interferometric phase was then obtained by (1) removing the topographic phase with the DEM of 30 m spatial resolution, (2) suppressing the noise of the phase using an adaptive filter of wavelength 300, and (3) unwrapping the remaining phase based on the statistical-cost, network-flow algorithm [41,42]. The unwrapped phases were combined to generate a coherence rate of land displacement at different temporal scales using the small-baseline subset method (SBAS) [43,44]. To estimate the contributions of the topographic and ionospheric delay, as well as to remove them, the iterative common scene method was used [45]. Finally, the rate of deformation at the acquisition dates and the mean velocity were estimated using the least squares method [41].
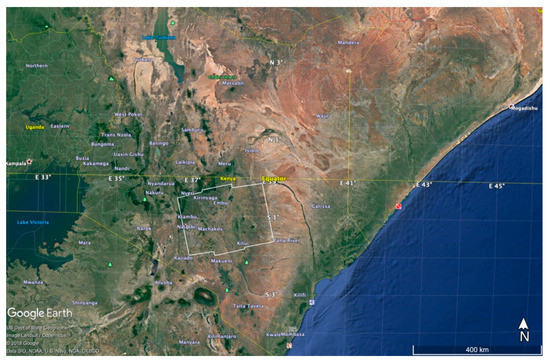
Figure 1.
Location of a Sentinel-1 frame (1175) from ascending path 57 in Kenya, mapped onto the terrain view of the Earth’s surface from Google Earth.
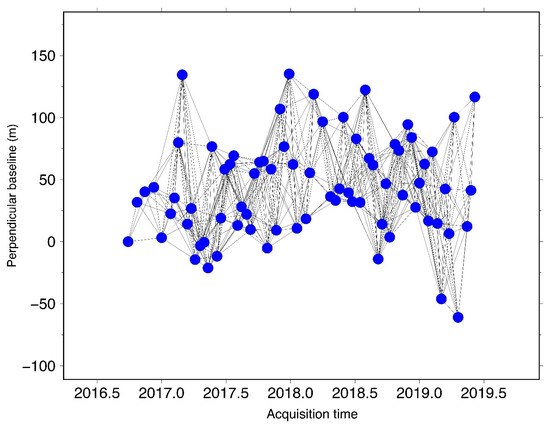
Figure 2.
The interferogram network (518 pairs) based on 74 images of the path and the middle frame, 1175. This network was used to construct the deformation rate and mean velocity based on the SBAS method in the time interval 2016 to 2019. List of images along with the technical specifications are given in Table S1.
To map the spatial extent of the MAM flooding in Kenya, the same Sentinel-1 scenes were first processed for the radiometric calibration, in which the backscattering coefficients were produced from the pixel values [46]. Speckle filtering using a boxcar filter of window size 3 * 3 was applied to the absolute phase of the scattered coefficients to minimize the noise levels in the images [47]. To separate the flooded areas from the non-flooded areas, the filtered, backscattered histogram was analyzed. The lower values represented the flooded areas, and the higher values were the pixels showing no impact from the flood. Different threshold values were tested to produce an effective value, using the values of known water bodies. The value that produced the 90th percentile was adopted to discriminate the flooded and the non-flooded areas. The newly created images were geometrically corrected using the range-doppler terrain correction [48].
2.3. Loading Model (HYDL)
To investigate the flood-loading deformation associated with the MAM season in Kenya, we used the hydrological loading model. The daily global vertical deformation model was developed based on weather models that included the runoff and the total water storage available at a 0.5° * 0.5° regular grid at daily temporal resolution. The input data for the model were outputs from the European Center for Medium-Range Weather Forecasts (ECMWF) [49]. The model represented the movement of the mass center of a given geographic location compared to the global mass center based on water storage from the land surface discharge model (LSDM) [49]. The total mass represents the masses of the snow, soil moisture, surface water, rivers, lakes, and wetlands. The data were resampled at a 0.125° * 0.125° degree, and available from 1976 to present. Here we used the weighted loading area from the model for central Kenya in one year extending from December 2017 to December 2018. The data represent the load deformation resulting from changes in flood plains, soil moisture, and groundwater during one year of dry and wet seasons in central Kenya.
3. Results
3.1. Hydrological Responses to the Long Rainy Season MAM 2018
Using the ECDF method, the distribution of the precipitation and soil moisture changes were mapped across the East African countries from January to June 2018. During January to the end of February, the region experienced low rainfall and dry soil (represented by bright colors in Figure 3) in Kenya, Somalia, Ethiopia, South Sudan, Uganda, Rwanda, and Burundi. Only in Tanzania was the precipitation higher, and the soil was saturated during January (represented by the dark color in Figure 3). Precipitation was below average for the two consecutive rainy seasons of 2016 and 2017, and the prolonged drought affected the whole Horn of Africa, resulting in hunger and humanitarian crises [50]. The 2016–2017 prolonged drought was associated with the La Niña event [51]. Following the dry years, precipitation increased to be higher than normal in February in Rwanda, Burundi, and Ethiopia. However, it was not enough to fully saturate the soil. Starting from March and continuing to the end of May, most of the region experienced a highly wet season where ECDF ranged from 0.75 to 1. Similarly, the saturation of the soil ranged from 0.75 to 1, except in South Sudan where the saturation did not reach high values during April. The rainfall and saturation of the soil reached the optimum level during April, when the wet soil could not absorb any more water, producing overland flow and flooding in Kenya, Somalia, Ethiopia, Eretria, Djibouti, Uganda, Rwanda, and Burundi. By the end of May, the situation was back to normal (saturation near zero) across Kenya and Somalia. However, in South Sudan and Ethiopia, the precipitation was still high. The MAM season of 2018 is considered one of the wettest seasons on record in Kenya. This is generally attributed to the combined effect of the active MJO events in phases 2–4 and a tropical cyclone event in the southern Indian Ocean [1].
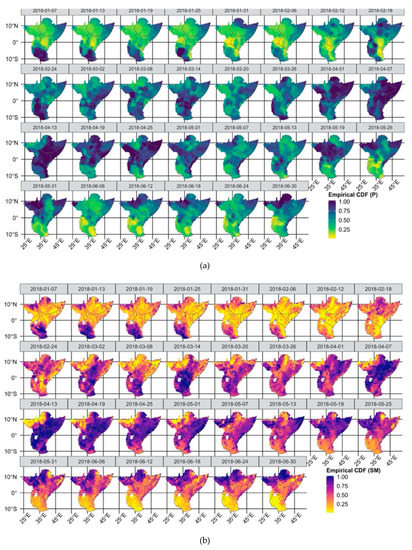
Figure 3.
The ECDF for precipitation (a) and soil moisture (b) in East Africa. Figures created using the SMAPR package [53].
The hydrological variations before and after the long rainy season in the water budget in the study area including the input (P) and outputs (evapotranspiration, surface runoff, and soil moisture) based on VIC and NOAH-3.3 models are presented in Figure 4. When comparing the precipitation, it can be seen that the peak of the wet season in 2016, as estimated by the NOAH-3.3 model, is higher than that of 2018. The MAM season of 2016 represented the wet season that interrupted the 2015 drought. However, this trend is significantly overturned using the estimation of P based on the VIC model (Figure 4), in which the peak of P in the 2018 MAM season is much higher than that of 2016. Both the NOAH-3.3 and VIC models show a dry season in 2017. The maximum peak of P through the 2018 MAM season occurred during April: ~243 mm and ~205 mm as estimated from NOAH-3.3 and VIC models, respectively. For ET, the peaks of the two rainy seasons in 2016 and 2017 were smaller than that of the 2018 season, which is consistent with the region’s dominant hydroclimatic changes. However, the estimated peaks of the ET generated by the NOAH-3.3 and VIC models are highly comparable in the 2016 season: 70–74 mm/month (Figure 4). Comparable values are also observed for the 2018 season in the two models (i.e., 80–105 mm/month) (Figure 4). For R, which includes the total runoff (surface flow and subsurface flow), both models are consistent with the drought and flood changes. However, the NOAH-3.3 runoff is higher than that shown by the VIC model. The peaks of the R during the MAM 2018 were 46 mm/month for the NOAH-3.3 and 25 mm/month for the VIC model. The subsurface flow constitutes more than 50% of the total runoff estimated by the NOAH-3.3. NOAH-3.3 may overestimate R and underestimate the ET in the region, whereas the VIC model may underestimate the R or overestimate the ET. In general, according to the models, the disaggregation of P into ET and R in land surface models varies with climate regions, and the estimates are sensitive to the ET and R parameters [52].
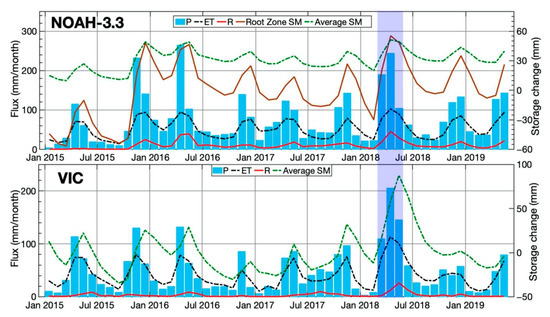
Figure 4.
The change in hydrological fluxes (P, ET, and R) and soil moisture content in Kenya based on the NOAH-3.3 and VIC models. The highlighted blue shows the timing of the short wet-season anomalies.
Regarding the change in SM, the dryness of the soil was persistent during the drought period of 2015. The 2015 drought was followed by the relatively long wet season (October to December) and continued with the MAM 2016. From the summer of 2016 to the MAM 2018, the prolonged drought continued, as suggested by the estimates of both the surface soil moisture and the root zone moisture contents from the two models (Figure 4). The wetness of the soil reached its peak from April to May of 2018 with a maximum of 87 mm and 51 mm as estimated by the VIC and the NOAH-3.3 models, respectively. Similarly, the moisture of the root zone reached its peak in the same periods with relatively high values of 55 mm (Figure 4). The drastic deficit in the root zone soil moisture was estimated using the NOAH-3.3 model only. The hydrological fluxes are aligned with the recorded flooding that occurred through the 2018 MAM season. Many consequences were recorded in association with the flooding of this season. One of these consequences was the land deformation that we monitored and measured in the study area located in central Kenya.
3.2. Land Deformation Related to MAM Season
The land motions associated with the exceptional rainy MAM season demonstrate varying magnitudes of subsidence, shown by both GPS and InSAR measurements (Figure 5 and Figure 6). The precipitation rates between 2017 and 2018 were plotted against the estimates of the load deformations, as determined from the hydrological loading model (HYDL) and the nonlinear trend of the GPS station, filtered by the singular spectral analysis (SSA) method. For the first three months (December 2017 to February 2018), the precipitation level showed an average of 23 mm/month. Throughout this temporal interval, the surface displacement was marginal, with an average of 1.0 mm uplift as determined from both the HYDL and the GPS station. Starting from March 2018, the precipitation increased markedly, with a magnitude of ~180 mm, and it continued to increase, reaching its highest magnitude of ~250 mm in April. This significant increase in rainfall greatly developed terrestrial water storage, resulting in mass load-induced land subsidence. Both the HYDL model and the GPS measurements reflected sharp land subsidence of 5 mm through March and April, during the highest hydrologic mass loading. This magnitude of land subsidence remained almost consistent through May 2018. Following the end of the rainy season, the land had started an isostatic rebound by the end of May 2018, which recovered 50% of the subsiding land by August 2018. In the meantime, the GPS station showed stable movement by the end of April 2018 through May. However, the subsidence continued gradually from June until August 2018, reaching 9.0 mm (Figure 5). The GPS measurements indicated a surface rebound in September 2019. The HYDL model is a product of all summations of the mass loading of all storage components that respond in time to changes in rainfall rates. The GPS displacement represents the direct movement of the earth as a result of increasing mass loading as the rain gradually increases. The InSAR results demonstrated further the land motion estimated by both the HYDL model and the GPS, but in different magnitudes.
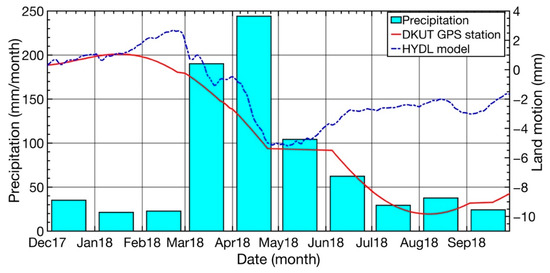
Figure 5.
The change in precipitation during the MAM season, based on the NOAH-3.3 model, and the corresponding land motion based on the HYDL loading model, which accounts for the loading of the total water storage and the nonlinear trend of the vertical component estimated by the SSA for the DKUT GPS station.
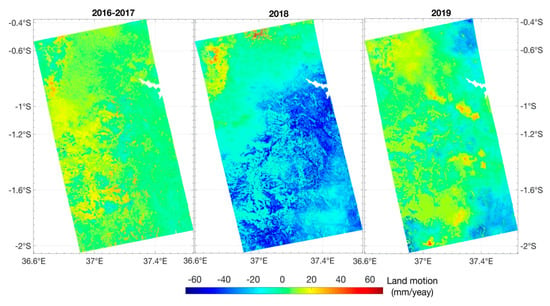
Figure 6.
The mean land motion velocity estimated based on SBAS of Sentinel -1 between 2016 and 2019 for the path 57 and the middle of 1175 frame.
The InSAR results in Figure 6 show that the subsidence was widespread in 2018 across the analyzed frame, in contrast with low deformation rates recorded in 2017 and 2019. Through the temporal interval of 2016–2017, the values of the InSAR measurements were consistently low throughout the studied frame, indicating no significant land deformation (Figure 6). However, some relatively high values can be noticed in scattered spots throughout the analyzed frame. Their scattered pattern may or may not indicate potential significance. In 2018, the InSAR measurements presented high values of land subsidence ranging from 20.0 mm to 40.0 mm/year. Interestingly, the subsiding area is wide and has a NE–SW trend. In 2019, it seemed that most of the subsided areas had recovered and showed a smaller magnitude of land deformation, comparable to that seen in 2017. The area of the highest subsidence is occupied mainly by the Kapiti-Athi and Thika plains.
4. Discussion
Land subsidence can be a naturally driven (e.g., tectonic movements [54] and permafrost processes [55]), or a human-driven process (e.g., aquifer compaction [56,57,58,59] and hydrocarbon extraction [60,61]). Sinkholes are areas that subside naturally due to different mechanisms across many geographical locations [62,63]. In Kenya, the relationship between land subsidence and sinkholes has been generally considered in the context of geologic and geomorphic studies. The study area where land subsidence took place in response to the MAM rainy season comprises four main regions: the Kapiti, Athi, Embakasi, and Thika plains [64] (Figure 7). This area is comprised of a low-lying plain with low slopes toward the west and northwest [65]. In response to the volcanic activities associated with the African Rift Valley, the low-lying plains have been filled by fissure lava eruptions [64,66]. These plains were formed by a variety of volcanic eruptions during different temporal stages [64,66]. In response to high temperature and annual rainfall ranging from ~700 to 1000 mm, the volcanic rocks have been eroded, forming clay soils in different colors and at different thicknesses [67,68]. Sandy clay loams also occur as pockets and bands in the Athi river area [67]. Tectonically, the faulting in the rift zone and its margins comprises three major periods: major faults, grid faults, and cross faults [68]. The major faults have N–S trends and preceded the volcanic activities in the region. The grid faults developed in the Middle Pleistocene era and marked the end of the main volcanic events in the area. The cross faults and minor faults have affected all other structural features in the Nairobi area [68]. Below fault scarps or at fault-line intersections, sinkholes exist [68]. Under heavy rain, soils that fill the sinkhole subside as the bottom materials are flushed downward [68]. Ngecu and Nyambok [12] first monitored the ground subsidence at the Nakuru area in the central Rift Valley northwest of the study area. This ground subsidence occurs along parallel fault zones in several areas in Nakuru township during or after heavy rain events [5,12]. They attributed the ground subsidence to the oversaturation of the common volcanoclastic sediments, resulting in a reduction of the shear strengths of these sediments. The mass hydrologic loads of the saturated sediments induced subterranean erosion along faults, resulting in eventual falling of these unconsolidated sediments into subsurface channels, forming the sinkholes [12] (Figure S1). Soil subsidence and formation of sinkholes may also occur in areas where no faults exist [68] when subsidence occurs within soft and incohesive soils after rain. One of the main characteristics of the Rift Valley zone and its environs is the occurrence of daily tremors and seismic activities [5,68]. The relationship between land subsidence and seismic activities was studied in the land subsidence of 1985 in the Nakuru area. The study indicated that no lateral displacements were detected along the subsidence zones of the 1985 incident [5]. The interpretation of the occurrence of land subsidence as a result of subterranean erosion during and after heavy rains has been outweighed in the Nakuru area [5,68]. Considering the magnitude and distribution of land subsidence, we may speculate that the subsidence during the rainy seasons could trigger future seismicity rather than increasing the spatial extents and magnitude of flooding in the study area. The link between heavy rainfall and the occurrence of earthquakes was primarily established by Huang et al. [69] in southern California along the San Andreas fault. They observed a correlation between the intense dry/wet cycle (and therefore the surface load) and the occurrences of earthquakes with magnitudes greater than six. Furthermore, land subsidence can potentially intensify flooding by changing flood plain boundaries and base flood drainage [22,70] and by lowering flood control structures [71].
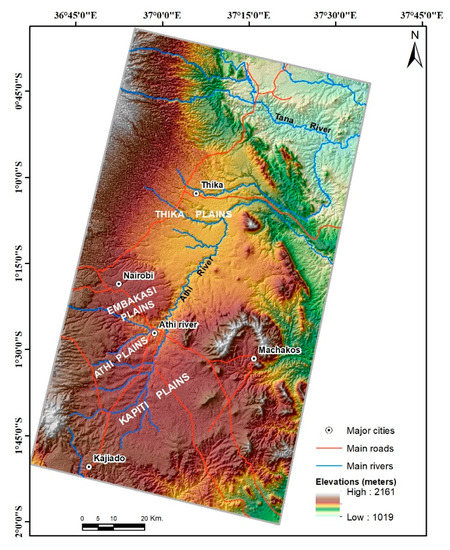
Figure 7.
The main morphological features in the study area.
To investigate the relationship between the flooding of the MAM season and land subsidence in the studied area (Figure 7), the flooded areas were estimated using the scattering coefficient technique, as mentioned in Section 2.2. The spatial correlation implied a strong relationship between the areas of high magnitudes of land subsidence (Figure 6) and those areas that experienced intense flooding during the MAM (Figure 8).
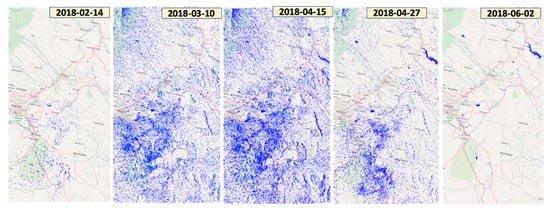
Figure 8.
The flood extent in the same frame of Figure 6. The blue pixels show the flooded places during the MAM season.
The blue dots in Figure 8 represent the flooded areas between March and June 2018. The maximum spatial distribution of the points was mapped in the second week of April. Before March or after May 2018, the scattering points are limited and represent only the normal water bodies in the study area. From the comparison between the HDYL model and the GPS measurements and the comparison between the InSAR measurements and flood mapping extents using radar data, it is possible to conclude that there is a potential relationship between heavy rainfall and ground subsidence in the study area. The occurrence of heavy rainfall events and flooding over volcanoclastic regions covered mainly by clay soils would intensify the sinkhole processes in which subterranean channel erosion actively flushes bottom materials downwards. Accordingly, land subsidence can take place. The effects of the spatial locations, the spatial pattern of the active faults, and the seismic activities of these faults on the land subsidence in the study area require more detailed investigation. Although this paper may have helped provide an empirical example for the climate-driven deformations in Kenya, many limitations can be outlined. For instance, the absence of dense GPS stations prohibited proper validation of InSAR measurements of land deformation. In addition, the unavailability of in situ rainfall and flood gauge stations to substantiate the various hydrological parameters extracted from earth observation satellites and hydrologic models’ data is another limitation. In addition, given the severity of the 2018 rainy season and the widespread viscoelastic sediments and intense faulting along the East African rift system, it is likely expected that similar deformations may have occurred in other regions. However, it is beyond our capability to address these phenomenal earth processes across the vast areas covered by the heavy rains of the MAM season.
5. Conclusions
Using SMAP satellite and hydrological models, we mapped the surplus precipitation and soil moisture that accompanied the long MAM rainy season of 2018 across the Horn of Africa. In Kenya, for the first time, we have shown the solid-earth responses to the MAM season using loading models, GPS, and interferometric analysis of the synthetic aperture radar (InSAR) data. We found that the MAM rainy season resulted in widespread land subsidence up to > 20 mm in Kenya during 2018 based on the SBAS InSAR with ~500 interferograms. The rate of land subsidence measured from InSAR is higher than the estimated rates from both the nearby GPS site and the hydrological loading model. The areas showing a high magnitude of ground subsidence were spatially correlated with the intensively flooded areas during the MAM season of 2018. Recovery had occurred by the end of 2018 and the beginning of 2019. Considering the magnitude and distribution of the land subsidence, we may speculate that the subsidence during the rainy seasons could trigger future seismicity. From economic and societal perspectives, the solid-earth responses to the surface loading of the wet and dry cycles have a severe environmental and humanitarian impact. Governments are advised to adopt a strategic plan when constructing roads and building across draining systems that may not function adequately to drain rainwater.
Supplementary Materials
The following are available online at https://www.mdpi.com/2072-4292/12/9/1390/s1.
Author Contributions
A.R.: problem statement, methodology, data curation, formal analysis, writing, and review. E.H.: formal analysis, writing, review, and editing. All authors have read and agreed to the published version of the manuscript.
Funding
This research received no external funding.
Acknowledgments
We thank the editor and two anonymous reviewers for their insightful comments and suggestions that helped to improve the original manuscript. The senior author is grateful to the support of the Jackson School of Geosciences, University of Texas at Austin.
Conflicts of Interest
The author declares no conflicts of interest.
Data Availability
Data incorporated in this research is available free through the these webpages: Sentinel-1 (https://scihub.copernicus.eu/dhus/#/home), GLDAS models (https://earthdata.nasa.gov/), and HYDL model (https://www.gfz-potsdam.de/en/esmdata/loading/).
References
- Kilavi, M.; MacLeod, D.; Ambani, M.; Robbins, J.; Dankers, R.; Graham, R.; Helen, T.; Salih, A.; Todd, M. Extreme rainfall and flooding over central Kenya including Nairobi city during the long-rains season 2018: Causes, predictability, and potential for early warning and actions. Atmosphere 2018, 9, 472. [Google Scholar] [CrossRef]
- OCHA. OCHA Flash Update #1: Floods in Kenya|25 April 2018; OCHA: New York, NY, USA, 2018. [Google Scholar]
- OCHA. OCHA Somalia Flash Update #4-Humanitarian Impact of Heavy Rains|8 May 2018; OCHA: New York, NY, USA, 2018. [Google Scholar]
- Ogwang, B.A.; Kabengwela, M.H.; Dione, C.; Kamga, A. The State of Climate of Africa in 2017; African Centre for Meteorological Applications for Development: Niamey, Niger, 2018. [Google Scholar]
- Dindi, E. An assessment of the performance of the geophysical methods as a tool for the detection of zones of potential subsidence in the area southwest of Nakuru town, Kenya. Environ. Earth Sci. 2015, 73, 3643–3653. [Google Scholar] [CrossRef]
- Nicholson, S.E. An analysis of recent rainfall conditions in eastern Africa. Int. J. Climatol. 2016, 36, 526–532. [Google Scholar] [CrossRef]
- Nicholson, S.E. Climate and climatic variability of rainfall over eastern Africa. Rev. Geophys. 2017, 55, 590–635. [Google Scholar] [CrossRef]
- AEA Group. Final Report. Kenya: Climate Screening and Information Exchange; AEA Group: Birmingham, AL, USA, 2008. [Google Scholar]
- MacLeod, D. Seasonal forecasts of the East African long rains: Insight from atmospheric relaxation experiments. Clim. Dyn. 2019, 53, 4505–4520. [Google Scholar] [CrossRef]
- Parry, J.-E.; Echeverria, D.; Dekens, J.; Maitima, J. Climate risks, vulnerability and governance in Kenya: A review. In Commissioned by: Climate Risk Management Technical Assistance Support Project (CRM TASP), Joint Initiative of Bureau for Crisis Prevention and Recovery and Bureau for Development Policy of UNDP. 2012. Available online: https://www.iisd.org/pdf/2013/climate_risks_kenya.pdf (accessed on 28 April 2020).
- Abuuru, D. Ground Subsidence in the Nakuru area: Results of the Seismic Refraction Survey; Mines and Geological Department: Nairobi, Kenya, 1990.
- Ngecu, W.M.; Nyambok, I.O. Ground subsidence and its socio-economic implications on the population: A case study of the Nakuru area in Central Rift Valley, Kenya. Environ. Geol. 2000, 39, 567–574. [Google Scholar] [CrossRef]
- Fu, Y.N.; Freymueller, J.T.; Jensen, T. Seasonal hydrological loading in southern Alaska observed by GPS and GRACE. Geophys. Res. Lett. 2012, 39. [Google Scholar] [CrossRef]
- Fu, Y.; Freymueller, J.T. Seasonal and long-term vertical deformation in the Nepal Himalaya constrained by GPS and GRACE measurements. J. Geophys. Res. Solid Earth 2012, 117. [Google Scholar] [CrossRef]
- Nahmani, S.; Bock, O.; Bouin, M.N.; Santamaria-Gomez, A.; Boy, J.P.; Collilieux, X.; Metivier, L.; Panet, I.; Genthon, P.; de Linage, C.; et al. Hydrological deformation induced by the West African Monsoon: Comparison of GPS, GRACE and loading models. J. Geophys. Res. Solid Earth 2012, 117. [Google Scholar] [CrossRef]
- Birhanu, Y.; Bendick, R. Monsoonal loading in Ethiopia and Eritrea from vertical GPS displacement time series. J. Geophys. Res. Solid Earth 2015, 120, 7231–7238. [Google Scholar] [CrossRef]
- Han, S.C. Elastic deformation of the Australian continent induced by seasonal water cycles and the 2010-2011 La Nina determined using GPS and GRACE. Geophys. Res. Lett. 2017, 44, 2763–2772. [Google Scholar] [CrossRef]
- Steckler, M.S.; Nooner, S.L.; Akhter, S.H.; Chowdhury, S.K.; Bettadpur, S.; Seeber, L.; Kogan, M.G. Modeling Earth deformation from monsoonal flooding in Bangladesh using hydrographic, GPS, and Gravity Recovery and Climate Experiment (GRACE) data. J. Geophys. Res. Solid Earth 2010, 115. [Google Scholar] [CrossRef]
- Twele, A.; Cao, W.X.; Plank, S.; Martinis, S. Sentinel-1-based flood mapping: A fully automated processing chain. Int. J. Remote Sens. 2016, 37, 2990–3004. [Google Scholar] [CrossRef]
- Martinis, S. Improving flood mapping in arid areas using Sentinel-1 time series data. In Proceedings of the 2017 IEEE International Geoscience and Remote Sensing Symposium (IGARSS), Fort Worth, TX, USA, 23–28 July 2017; pp. 193–196. [Google Scholar]
- Prasetyo, Y.; Yuwono, B.; Ramadhanis, Z. Spatial Analysis of Land Subsidence and Flood Pattern Based on DInSAR Method in Sentinel Sar Imagery and Weighting Method in Geo-Hazard Parameters Combination in North Jakarta Region. In Proceedings of the IOP Conference Series: Earth and Environmental Science, Surakarta, Central Java, Indonesia, 9–10 August 2017; p. 012009. [Google Scholar]
- Miller, M.M.; Shirzaei, M. Land subsidence in Houston correlated with flooding from Hurricane Harvey. Remote. Sens. Environ. 2019, 225, 368–378. [Google Scholar] [CrossRef]
- Zhang, B.; Wdowinski, S.; Oliver-Cabrera, T.; Koirala, R.; Jo, M.; Osmanoglu, B. Mapping the extent and magnitude of sever flooding induced by Hurricane IRMA with multi-temporal SENTINEL-1 SAR and Insar observations. Int. Arch. Photogramm. Remote Sens. Spat. Inf. Sci. 2018, 42, 2237–2244. [Google Scholar] [CrossRef]
- Chini, M.; Pelich, R.; Pulvirenti, L.; Pierdicca, N.; Hostache, R.; Matgen, P. Sentinel-1 InSAR Coherence to Detect Floodwater in Urban Areas: Houston and Hurricane Harvey as A Test Case. Remote Sens. Basel 2019, 11, 107. [Google Scholar] [CrossRef]
- Chen, M.; Shi, W.; Xie, P.; Silva, V.B.; Kousky, V.E.; Wayne Higgins, R.; Janowiak, J.E. Assessing objective techniques for gauge-based analyses of global daily precipitation. J. Geophys. Res. Atmos. 2008, 113, D04110. [Google Scholar] [CrossRef]
- Entekhabi, D.; Njoku, E.G.; O’Neill, P.E.; Kellogg, K.H.; Crow, W.T.; Edelstein, W.N.; Entin, J.K.; Goodman, S.D.; Jackson, T.J.; Johnson, J. The soil moisture active passive (SMAP) mission. Proc. IEEE 2010, 98, 704–716. [Google Scholar] [CrossRef]
- Jackson, T.; O’Neill, P.; Njoku, E.; Chan, S.; Bindlish, R.; Colliander, A.; Entekhabi, D. Soil Moisture Active Passive (SMAP) Project Calibration and Validation for the L2/3_SM_P Version 3 Data Products; JPL D-93720; Jet Propulsion Laboratory, California Institute of Technology, JPL Publication: Pasadena, CA, USA, 2016. [Google Scholar]
- Rodell, M.; Houser, P.R.; Jambor, U.; Gottschalck, J.; Mitchell, K.; Meng, C.J.; Arsenault, K.; Cosgrove, B.; Radakovich, J.; Bosilovich, M.; et al. The global land data assimilation system. Bull. Am. Meteorol. Soc. 2004, 85, 381. [Google Scholar] [CrossRef]
- Beaudoing, M.R.H.K. GLDAS VIC Land Surface Model L4 Monthly 1.0 × 1.0 Degree V001; Goddard Earth Sciences Data and Information Services Center (GES DISC), Ed.; Goddard Earth Sciences Data and Information Services Center (GES DISC): Greenbelt, MD, USA, 2007. [CrossRef]
- Beaudoing, H.M.R. GLDAS Noah Land Surface Model L4 Monthly 0.25 × 0.25 Degree V2.1; Goddard Earth Sciences Data and Information Services Center (GES DISC): Greenbelt, MD, USA, 2016. [CrossRef]
- Rui, H.; Beaudoing, H. README Document for NASA GLDAS Version 2 Data Products; National Aeronautics and Space Administration Goddard Earth Science Data Information and Services Center (GES DISC): Greenbelt, MD, USA, 2018.
- Choulakian, V.; Eljabi, N.; Moussi, J. On the Distribution of Flood Volume in Partial Duration Series Analysis of Flood Phenomena. Stoch. Hydrol. Hydraul. 1990, 4, 217–226. [Google Scholar] [CrossRef]
- Blewitt, G.; Hammond, W.; Kreemer, C. Harnessing the GPS data explosion for interdisciplinary science. Eos 2018, 99, 1–2. [Google Scholar] [CrossRef]
- Zumberge, J.F.; Heflin, M.B.; Jefferson, D.C.; Watkins, M.M.; Webb, F.H. Precise point positioning for the efficient and robust analysis of GPS data from large networks. J. Geophys. Res. Solid Earth 1997, 102, 5005–5017. [Google Scholar] [CrossRef]
- Hammond, W.C.; Blewitt, G.; Kreemer, C. GPS Imaging of vertical land motion in California and Nevada: Implications for Sierra Nevada uplift. J. Geophys. Res. Solid Earth 2016, 121, 7681–7703. [Google Scholar] [CrossRef] [PubMed]
- Blewitt, G.; Kreemer, C.; Hammond, W.C.; Gazeaux, J. MIDAS robust trend estimator for accurate GPS station velocities without step detection. J. Geophys. Res. Solid Earth 2016, 121, 2054–2068. [Google Scholar] [CrossRef] [PubMed]
- Wdowinski, S.; Bock, Y.; Zhang, J.; Fang, P.; Genrich, J. Southern California Permanent GPS Geodetic Array: Spatial filtering of daily positions for estimating coseismic and postseismic displacements induced by the 1992 Landers earthquake. J. Geophys. Res. Solid Earth 1997, 102, 18057–18070. [Google Scholar] [CrossRef]
- Golyandina, N.; Nekrutkin, V.; Zhigljavsky, A.A. Analysis of Time Series Structure: SSA and Related Techniques; Chapman and Hall/CRC: Boca Raton, FL, USA; New York, NY, USA; Washington, DC, USA; London, UK, 2001. [Google Scholar]
- Chen, Q.; van Dam, T.; Sneeuw, N.; Collilieux, X.; Weigelt, M.; Rebischung, P. Singular spectrum analysis for modeling seasonal signals from GPS time series. J. Geodyn. 2013, 72, 25–35. [Google Scholar] [CrossRef]
- Farr, T.G.; Rosen, P.A.; Caro, E.; Crippen, R.; Duren, R.; Hensley, S.; Kobrick, M.; Paller, M.; Rodriguez, E.; Roth, L.; et al. The shuttle radar topography mission. Rev. Geophys. 2007, 45. [Google Scholar] [CrossRef]
- Sandwell, D.; Mellors, R.; Tong, X.; Wei, M.; Wessel, P. GMTSAR: An InSAR Processing System Based on Generic Mapping Tools; Library—Scripps Digital Collection: San Diego, UC, USA, 2011. [Google Scholar]
- Chen, C.W.; Zebker, H.A. Phase unwrapping for large SAR interferograms: Statistical segmentation and generalized network models. IEEE Trans. Geosci. Remote 2002, 40, 1709–1719. [Google Scholar] [CrossRef]
- Berardino, P.; Fornaro, G.; Lanari, R.; Sansosti, E. A new algorithm for surface deformation monitoring based on small baseline differential SAR interferograms. IEEE Trans. Geosci. Remote 2002, 40, 2375–2383. [Google Scholar] [CrossRef]
- Tong, X.P.; Schmidt, D. Active movement of the Cascade landslide complex in Washington from a coherence-based InSAR time series method. Remote Sens. Environ. 2016, 186, 405–415. [Google Scholar] [CrossRef]
- Tymofyeyeva, E.; Fialko, Y. Mitigation of atmospheric phase delays in InSAR data, with application to the eastern California shear zone. J. Geophys. Res. Solid Earth 2015, 120, 5952–5963. [Google Scholar] [CrossRef]
- Freeman, A. Radiometric calibration of SAR image data. Int. Arch. Photogramm. Remote Sens. 1993, 29, 212. [Google Scholar]
- Lee, J.-S.; Jurkevich, L.; Dewaele, P.; Wambacq, P.; Oosterlinck, A. Speckle filtering of synthetic aperture radar images: A review. Remote Sens. Rev. 1994, 8, 313–340. [Google Scholar] [CrossRef]
- Wegmuller, U. Automated terrain corrected SAR geocoding. In Proceedings of the IEEE 1999 International Geoscience and Remote Sensing Symposium, IGARSS’99 (Cat. No. 99CH36293), Hamburg, Germany, 28 June–2 July 1999; pp. 1712–1714. [Google Scholar]
- Dill, R.; Dobslaw, H. Numerical simulations of global-scale high-resolution hydrological crustal deformations. J. Geophys. Res. Solid Earth 2013, 118, 5008–5017. [Google Scholar] [CrossRef]
- OCHA. East Africa Drought Situation Report No. 1|February 21, 2017; OCHA: New York, NY, USA, 2017. [Google Scholar]
- Uhe, P.; Philip, S.; Kew, S.; Shah, K.; Kimutai, J.; Mwangi, E.; van Oldenborgh, G.J.; Singh, R.; Arrighi, J.; Jjemba, E.; et al. Attributing drivers of the 2016 Kenyan drought. Int. J. Climatol. 2018, 38, e554–e568. [Google Scholar] [CrossRef]
- Zheng, H.; Yang, Z.L.; Lin, P.R.; Wei, J.F.; Wu, W.Y.; Li, L.C.; Zhao, L.; Wang, S. On the Sensitivity of the Precipitation Partitioning Into Evapotranspiration and Runoff in Land Surface Parameterizations. Water Resour. Res. 2019, 55, 95–111. [Google Scholar] [CrossRef]
- Schira, M.J.M.O.Z. Smapr: Acquisition and Processing of NASA Soil Moisture Active-Passive. 2019. Available online: https://cran.r-project.org/web/packages/smapr/index.html (accessed on 28 April 2020).
- Chen, Y.-G.; Liu, T.-K. Holocene uplift and subsidence along an active tectonic margin southwestern Taiwan. Quat. Sci. Rev. 2000, 19, 923–930. [Google Scholar] [CrossRef]
- Liang, B.; Zhang, G.-S.; Liu, D.-R. Experimental study on thawing subsidence characters of permafrost under frost heaving and thawingcirculation. Yantu Gongcheng Xuebao Chin. J. Geotech. Eng. 2006, 28, 1213–1217. [Google Scholar]
- Coplin, L.; Galloway, D. Houston-Galveston, Texas: Land Subsidence in the United States. US Geol. Surv. Circ. 1999, 1182, 35–48. [Google Scholar]
- Sneed, M.; Galloway, D.L. Aquifer-System Compaction and Land Subsidence: Measurements, Analyses, and Simulations: The Holly Site, Edwards Air Force Base, Antelope Valley, California; US Department of the Interior, US Geological Survey: Washington, DC, USA, 2000.
- Rateb, A.; Kuo, C.Y. Quantifying Vertical Deformation in the Tigris-Euphrates Basin Due to the Groundwater Abstraction: Insights from GRACE and Sentinel-1 Satellites. Water 2019, 11, 1658. [Google Scholar] [CrossRef]
- Chaussard, E.; Wdowinski, S.; Cabral-Cano, E.; Amelung, F. Land subsidence in central Mexico detected by ALOS InSAR time-series. Remote Sens. Environ. 2014, 140, 94–106. [Google Scholar] [CrossRef]
- Holzer, T.L.; Bluntzer, R.L. Land Subsidence Near Oil and Gas Fields, Houston, Texas. Groundwater 1984, 22, 450–459. [Google Scholar] [CrossRef]
- Psimoulis, P.; Ghilardi, M.; Fouache, E.; Stiros, S. Subsidence and evolution of the Thessaloniki plain, Greece, based on historical leveling and GPS data. Eng. Geol. 2007, 90, 55–70. [Google Scholar] [CrossRef]
- Holzer, T.L. Mitigating Losses from Land Subsidence in the United States; National Academies: Washington, DC, USA, 1991. [Google Scholar] [CrossRef]
- Waltham, T.; Waltham, A.C.; Bell, F.G.; Culshaw, M.G. Sinkholes and Subsidence: Karst and Cavernous Rocks in Engineering and Construction; Springer Science & Business Media: Berlin/Heidelberg, Germany, 2005. [Google Scholar]
- Ojany, F.F. The Mound Topography of the Thika and Athi Plains of Kenya: A Problem of Origin (Die Kleinhügeltopographie der Thikaund Athi-Ebenen von Kenya: Das Problem ihres Ursprungs). Erdkunde 1968, 269–275. [Google Scholar]
- Gevaerts, E. Hydrogeology of the Nairobi area; Government of Kenya, Water Development Department: Nairobi, Kenya, 1964.
- Gregory, J.W. The Rift Valleys and Geology of East Africa: An Account of the Origin & History of the Rift Valleys of East Africa & Their Relation to the Contemporary Earth-Movements Which Transformed the Geography of the World. With Some account of the Prehistoric Stone Implements, Soils, Water Supply, & Mineral Resources of the Kenya Colony; Seeley, Service & Co. limited: London, UK, 1921. [Google Scholar]
- Scott, R.M. The Soils of the Nairobi-Thika-Yatta-Machakos Area; Government of Kenya, Department of Agriculture: Nairobi, Kenya, 1963.
- Saggerson, E. Geology of the Nairobi Area; Mines & Geological Department: Nairobi, Kenya, 1991.
- Huang, L.-S.; McRaney, J.; Teng, T.-L.; Prebish, M. A preliminary study on the relationship between precipitation and large earthquakes in Southern California. Pure Appl. Geophys. 1979, 117, 1286–1300. [Google Scholar] [CrossRef]
- Wang, J.; Gao, W.; Xu, S.; Yu, L. Evaluation of the combined risk of sea level rise, land subsidence, and storm surges on the coastal areas of Shanghai, China. Clim. Chang. 2012, 115, 537–558. [Google Scholar] [CrossRef]
- Dixon, T.H.; Amelung, F.; Ferretti, A.; Novali, F.; Rocca, F.; Dokka, R.; Sella, G.; Kim, S.-W.; Wdowinski, S.; Whitman, D. Subsidence and flooding in New Orleans. Nature 2006, 441, 587–588. [Google Scholar] [CrossRef]
© 2020 by the authors. Licensee MDPI, Basel, Switzerland. This article is an open access article distributed under the terms and conditions of the Creative Commons Attribution (CC BY) license (http://creativecommons.org/licenses/by/4.0/).
