Article

A New Soil Moisture Retrieval Algorithm from the L-Band Passive Microwave Brightness Temperature Based on the Change Detection Principle

1
Northeast Institute of Geography and Agroecology, Chinese Academy of Sciences, Changchun 130102, China
2
Changchun Jingyuetan Remote Sensing Test Site, Changchun 130102, China
3
College of Resources and Environment, University of Chinses Academy of Sciences, Beijing 100049, China
4
Shanghai Aerospace Electronic Technology Institute, Shanghai 201109, China
5
School of Geomatics and Prospecing Engineering, Jilin Jianzhu University, Changhcun 130118, China
*
Author to whom correspondence should be addressed.
Remote Sens. 2020, 12(8), 1303; https://doi.org/10.3390/rs12081303
Submission received: 25 March 2020 / Revised: 14 April 2020 / Accepted: 17 April 2020 / Published: 20 April 2020
(This article belongs to the Section Remote Sensing in Geology, Geomorphology and Hydrology)

Abstract

:
The launch of the SMOS (Soil Moisture and Ocean Salinity) and SMAP (Soil Moisture Active Passive) satellites has led to the development of a series of L-band soil moisture retrieval algorithms. In these algorithms, many input parameters (such as leaf area index and soil texture) and empirical coefficients (such as roughness coefficient (hP, NRP) and crop structure parameter (bP, ttP)) are needed to calculate surface soil moisture (SSM) from microwave brightness temperature. Many previous studies have focused on how to determine the value of these coefficients and input parameters. Nevertheless, it can be difficult to obtain their ‘real’ values with low uncertainty across large spatial scales. To avoid this problem, a passive microwave remote sensing SSM inversion algorithm based on the principle of change detection was proposed and tested using theoretical simulation and a field SSM dataset for an agricultural area in northeastern China. This algorithm was initially used to estimate SSM for radar remote sensing. First, theoretical simulation results were used to confirm the linear relationship between the change rates for SSM and surface emissivity, for both H and V polarization. This demonstrated the reliability of the change detection algorithm. Second, minimum emissivity (or the difference between maximum emissivity and minimum emissivity) was modeled with a linear relationship between vegetation water content, derived from a three-year (2016–2018) SMAP L3 SSM dataset. Third, SSM values estimated by the change detection algorithm were in good agreement with SMAP L3 SSM and field SSM, with RMSE values ranging from 0.015~0.031 cm3/cm3 and 0.038~0.051 cm3/cm3, respectively. The V polarization SSM accuracy was higher than H polarization and combined H and V polarization accuracy. The retrieved SSM error from the change detection algorithm was similar to SMAP SSM due to errors inherited from the training dataset. The SSM algorithm proposed here is simple in form, has fewer input parameters, and avoids the uncertainty of input parameters. It is very suitable for global applications and will provide a new algorithm option for SSM estimation from microwave brightness temperature.

Graphical Abstract

1. Introduction

Surface soil moisture (SSM) plays an important role in governing water and energy cycles at the land–atmosphere boundary. Estimation of SSM using remote sensing methods has become a key component of observation and research programs (e.g., the Global Energy and Water Cycle Experiment (GWEWX), the Integrated Global Water Cycle Observation (IGWCO), and the Global Soil Wetness Project (GSWP)) [1,2]. In addition, accurate SSM monitoring and prediction play a crucial role in research on crop growth status, predicting flood and drought events, hydrology research, and global change research [3,4,5].
Due to its strong penetration ability and sensitivity to SSM [6], microwave remote sensing technology has become the primary method for SSM estimation. From the early SMMR (Scanning Multichannel Microwave Radiometer), SSMI (Special Sensor Microwave/Imager), AMSR-E (Advanced Microwave Scanning Radiometer for EOS), AMSR2 (Advanced Microwave Scanning Radiometer 2) and FY (Fengyun) series of satellite-based passive microwave radiometers, to more recent SMOS (Soil Moisture and Ocean Salinity), Aquarius and SMAP (Soil Moisture Active Passive) sensors, one of the goals of these satellite missions is to obtain global SSM. Due to the difference in observation frequencies and the forward simulation model, many SSM algorithms have been developed based on physical and empirical principles. It is confirmed that L-band is the best band for estimating SSM in existing satellites. Thus, we briefly review parts of these L-band SSM inversion algorithms in the following part.
These algorithms include SMOS L2/L3, SMAP L2, the dual channel algorithm (DCA), the land parameter retrieval model (LPRM), multi-orbit retrievals of soil moisture and optical depth (MT-DCA) and other algorithms (such as the explicit radiative transfer model and methods based on neural networks or local regressions) [7]. Although they have produced good SSM estimation results, the whole estimation process is still relatively complex and requires a lot of input parameters, which are also difficult to measure and obtain (such as effective scattering albedo, soil texture, etc.). Therefore, these algorithms also have some limitations: 1) Due to different data sources and processing methods, input parameters may have different uncertainties in different regions of the world, which are difficult to evaluate quantitatively; 2) Parameters are heterogeneous within a microwave pixel but are considered as homogeneous pixels in the SSM inversion process; 3) Some parameters (such as effective scattering albedo, vegetation structure parameters (ttH and ttV), and roughness parameters (NRV and NRH)) need to be assumed to be constant under certain circumstances (such as land cover type or vegetation type), and many previous studies have determined how these parameters are quantified.
Integrating the existing problems and the research basis for soil moisture algorithms, we hope to use change detection to develop an SSM estimation method based on microwave brightness temperature. The change detection algorithm idea was first proposed by Wagner et al. (1999) [8], who used it to estimate temporal SSM with ERS-1 and ERS-2 scatterometer data cycles. The core idea of this algorithm is a linear relationship between SSM change and the change in the backscatter coefficient, which is affected by vegetation characteristics. NDVI (Normalized Difference Vegetation Index) is generally used to represent the vegetation canopy influence [9,10]. The algorithm’s feasibility has been verified through soil moisture estimation by radar remote sensing. Its advantage lies in its simplicity, which directly links the radar backscatter coefficient change with SSM change and reduces the impact of input parameter uncertainty. The disadvantage is that the minimum backscatter coefficient is somewhat related to surface roughness, which changes over time on an agricultural soil surface. Therefore, the algorithm is more suitable for grassland or shrub cover with constant (or slowly changing) roughness.
Given the limitations of existing SSM algorithms and the advantages of the change detection algorithm, this study discusses and analyzes the applicability of the change detection algorithm for estimating SSM from passive microwave brightness temperature. The algorithm was first analyzed from the physical perspective (physical model). Second, SSM, surface temperature and vegetation water content (VWC) datasets provided by SMAP were used to calculate the minimum (or maximum) of land surface emissivity and the minimum (or maximum) SSM used in the algorithm. Then, estimated SSM validation was carried out by in situ SSM, and finally, the advantages and disadvantages of the algorithm were analyzed along with its application potential.

2. Data and Methods

2.1. Study Area and in Situ SSM

The study area was located in the agricultural area of Dehui County (125°14′~126°24′ E, 44°02′~44°53′ N), Jilin Province, China (Figure 1). Annual average temperature and precipitation are 4.4 °C and 520 mm, respectively. This area has a mid-temperate zone and a continental monsoon climate with four distinct seasons. SSM varies greatly across the seasons, a condition that is very suitable for the development and validation of the soil moisture algorithm [11]. This area belongs to China’s main grain production area and black soil belt, so it is mainly used for agricultural development. Therefore, crop type heterogeneity within a microwave pixel is low and the proportion of farmland is greater than 90%.
In this area, a dense soil moisture observation network, with an area of 36 × 36 km, was established to provide the ground-based SSM dataset by 28 METER EC-5 soil moisture sensors (Figure 1). To reduce the impacts of agricultural activities and the soil freeze–thaw cycle on observation data quality, the soil moisture sensors only collect data from May to September each year. In May (after sowing), all soil moisture nodes are installed in the field. At the end of September (before harvesting), they are taken back to the laboratory for calibration to ensure data quality. Three years of the ground-based SSM dataset (2016–2018) are used in this study. Although the soil texture (clay: 11.5%~12.5%, sand: 51.5%~60.6%), topography (average slope < 4.5°), and land cover (percent of farmland > 90%) in this area are all relatively homogeneous, to obtain high-quality SSM at the passive microwave pixel scale, the Thiessen polygon method was used to convert point-scale soil moisture to pixel-scale [12].

2.2. SMAP L3 SSM Dataset

The SMAP L3 Radiometer Global Daily 36 km EASE-Grid Soil Moisture Product provides a composite of daily global land surface condition estimates retrieved by the SMAP passive microwave radiometer. Surface soil moisture (SMAP L3 SSM), surface temperature (TS), corrected L-band brightness temperature (TB), and vegetation water content (VWC) from the SMAP L3 SSM dataset were used in this study with a global, cylindrical 36 km Equal-Area Scalable Earth Grid (EASE-Grid 2.0) [13]. SMAP L3 SSM reflects soil water content change at soil depths of 0~5 cm estimated from SMAP TB. SMAP TB represents the weighted average of SMAP Level-1B brightness temperatures, whose boresights fall within each 36 km EASE-Grid 2.0 grid cell. SMAP TS is the effective soil temperature, the weighted value of surface soil temperature (Tsurf) and deep soil temperature (Tdeep). Tsurf refers to the average soil temperature for the first soil layer (0–10 cm) and Tdeep refers to the average soil temperature for the second soil layer (10–20 cm) in the GMAO GEOS-5 land surface model. The SMAP VWC is derived from 1km MODIS NDVI data. Only one VWC is provided in the SMAP L3 dataset, but both ascending (6:00 p.m.) and descending (6:00 a.m.) orbital data are provided for TS, SSM, and TB [14].

2.3. Change Detection Algorithm

2.3.1. Microwave Emission Model

A simple zero-order radiation transfer approach (τ–ω) was used to simulate the L-band brightness temperature of vegetated soil, which has been used for retrieving SSM and modeling brightness temperature by many researchers [15,16,17,18,19]. The τ–ω model is applicable for frequencies less than ~5 GHz [20], and is therefore appropriate for simulating L-band emissions. The τ–ω model is expressed as follows [19]:
T b = T a up + t a [ ( 1 ω ) ( 1 t v ) T C + ( 1 ω ) ( 1 t v ) T C R s t v + ( 1 R s ) T s t v ]
where Tb is the simulated brightness temperature (K), T a up represents upwelling atmospheric emissions, ω is the single scattering albedo of the canopy, ta and tv are atmospheric and canopy transmissivities, respectively, TS and Tc are the effective soil and canopy temperatures, respectively (K), and Rs is the reflectivity of the rough soil surface.
The atmospheric effect was ignored in this study due to its relatively high transparency in the L-band [21,22]. In satellite SSM retrieval, canopy temperature (TV) is usually assumed to be equal to soil temperature (TS) because TV and TS are in a state of approximate heat balance for satellite (such as SMAP) local transit times of 6:00 a.m. and 18:00 p.m. Under these two assumptions, we can obtain surface emissivity (e) from Equation (1):
e = ( 1 ω ) ( 1 t v ) + ( 1 ω ) ( 1 t v ) R s t v + ( 1 R s )   t v
where the meaning of each symbol of Equation (2) is the same as that of Equation (1).

2.3.2. Change Detection Algorithm Derivation

The change detection algorithm concept came from radar remote sensing and its theoretical basis was the linear relationship between the relative change of the backscatter coefficient and relative SSM change [8]. Many studies have estimated SSM from radar data based on the change detection algorithm [9,10,23].
Here, we discuss the feasibility, problems, and potential of the algorithm’s application in passive microwave remote sensing. First, we analyzed whether there is a linear relationship between the relative SSM change and relative change in surface emissivity. Second, we derived the specific expression of this method. According to the algorithm used in radar remote sensing, the corresponding formula for passive microwave remote sensing for a vegetated soil surface can be written as:
SSM SSM MAX SSM MIN SSM MAX = e e MIN e MAX e MIN
where SSM is surface soil moisture, and SSMMIN and SSMMAX are SSM minimum and maximum values. e is the surface emissivity of vegetated soil defined by Equation (2), and eMIN and eMAX are the minimum and maximum values of e. Equation (3) determines the feasibility of the change detection algorithm based on passive microwave remote sensing. To verify this, taking Equation (2) into Equation (3) and simplifying, we obtain:
SSM SSM MAX SSM MIN SSM MAX = r r MAX r MIN r MAX
Here, r is soil surface reflectivity, and rMIN and rMAX are the minimum and maximum values of r. Next, we needed to verify the applicability of Equation (4). We used the I2EM model [24] to simulate the surface reflectivity (r) under different surface roughness (surface correlation length (cl) = 10 cm, surface root mean square height (s) = 0.5 cm, 1 cm, 2 cm and 3 cm) and soil moisture (SSM = 0.05~0.35 cm3/cm3 with 0.01 cm3/cm3 interval) conditions, the Mironov model [25] was used to calculate the complex dielectric constant of wet soil and the incidence angle was fixed at 40°. Figure 2 shows the relationship between the relative change of surface reflectivity and SSM, and indicates that the linear relationship given by Equation (4) was basically correct for both polarizations (horizontal and vertical) and various surface roughness conditions.
Because the change detection algorithm based on passive microwave remote sensing emissivity is feasible for estimating SSM, the SSM estimation expression must be derived from Equation (3) and can be written as:
SSM = e e MIN e MAX e MIN ( SSM MIN SSM MAX ) + SSM MAX
Equation (5) shows that values for minimum emissivity (eMIN) and the difference between the minimum and maximum emissivity (eMAXeMIN) must be determined prior to estimating SSM. Values of eMIN and eMAXeMIN are affected by vegetation type, VWC, surface roughness, soil texture, and topography. The pixel-based change detection algorithm assumes that roughness, soil texture and terrain are time invariant for a fixed pixel [23]. Therefore, we only considered vegetation change when solving for eMIN and eMAXeMIN.

2.3.3. Determining Maximum and Minimum Surface Emissivity

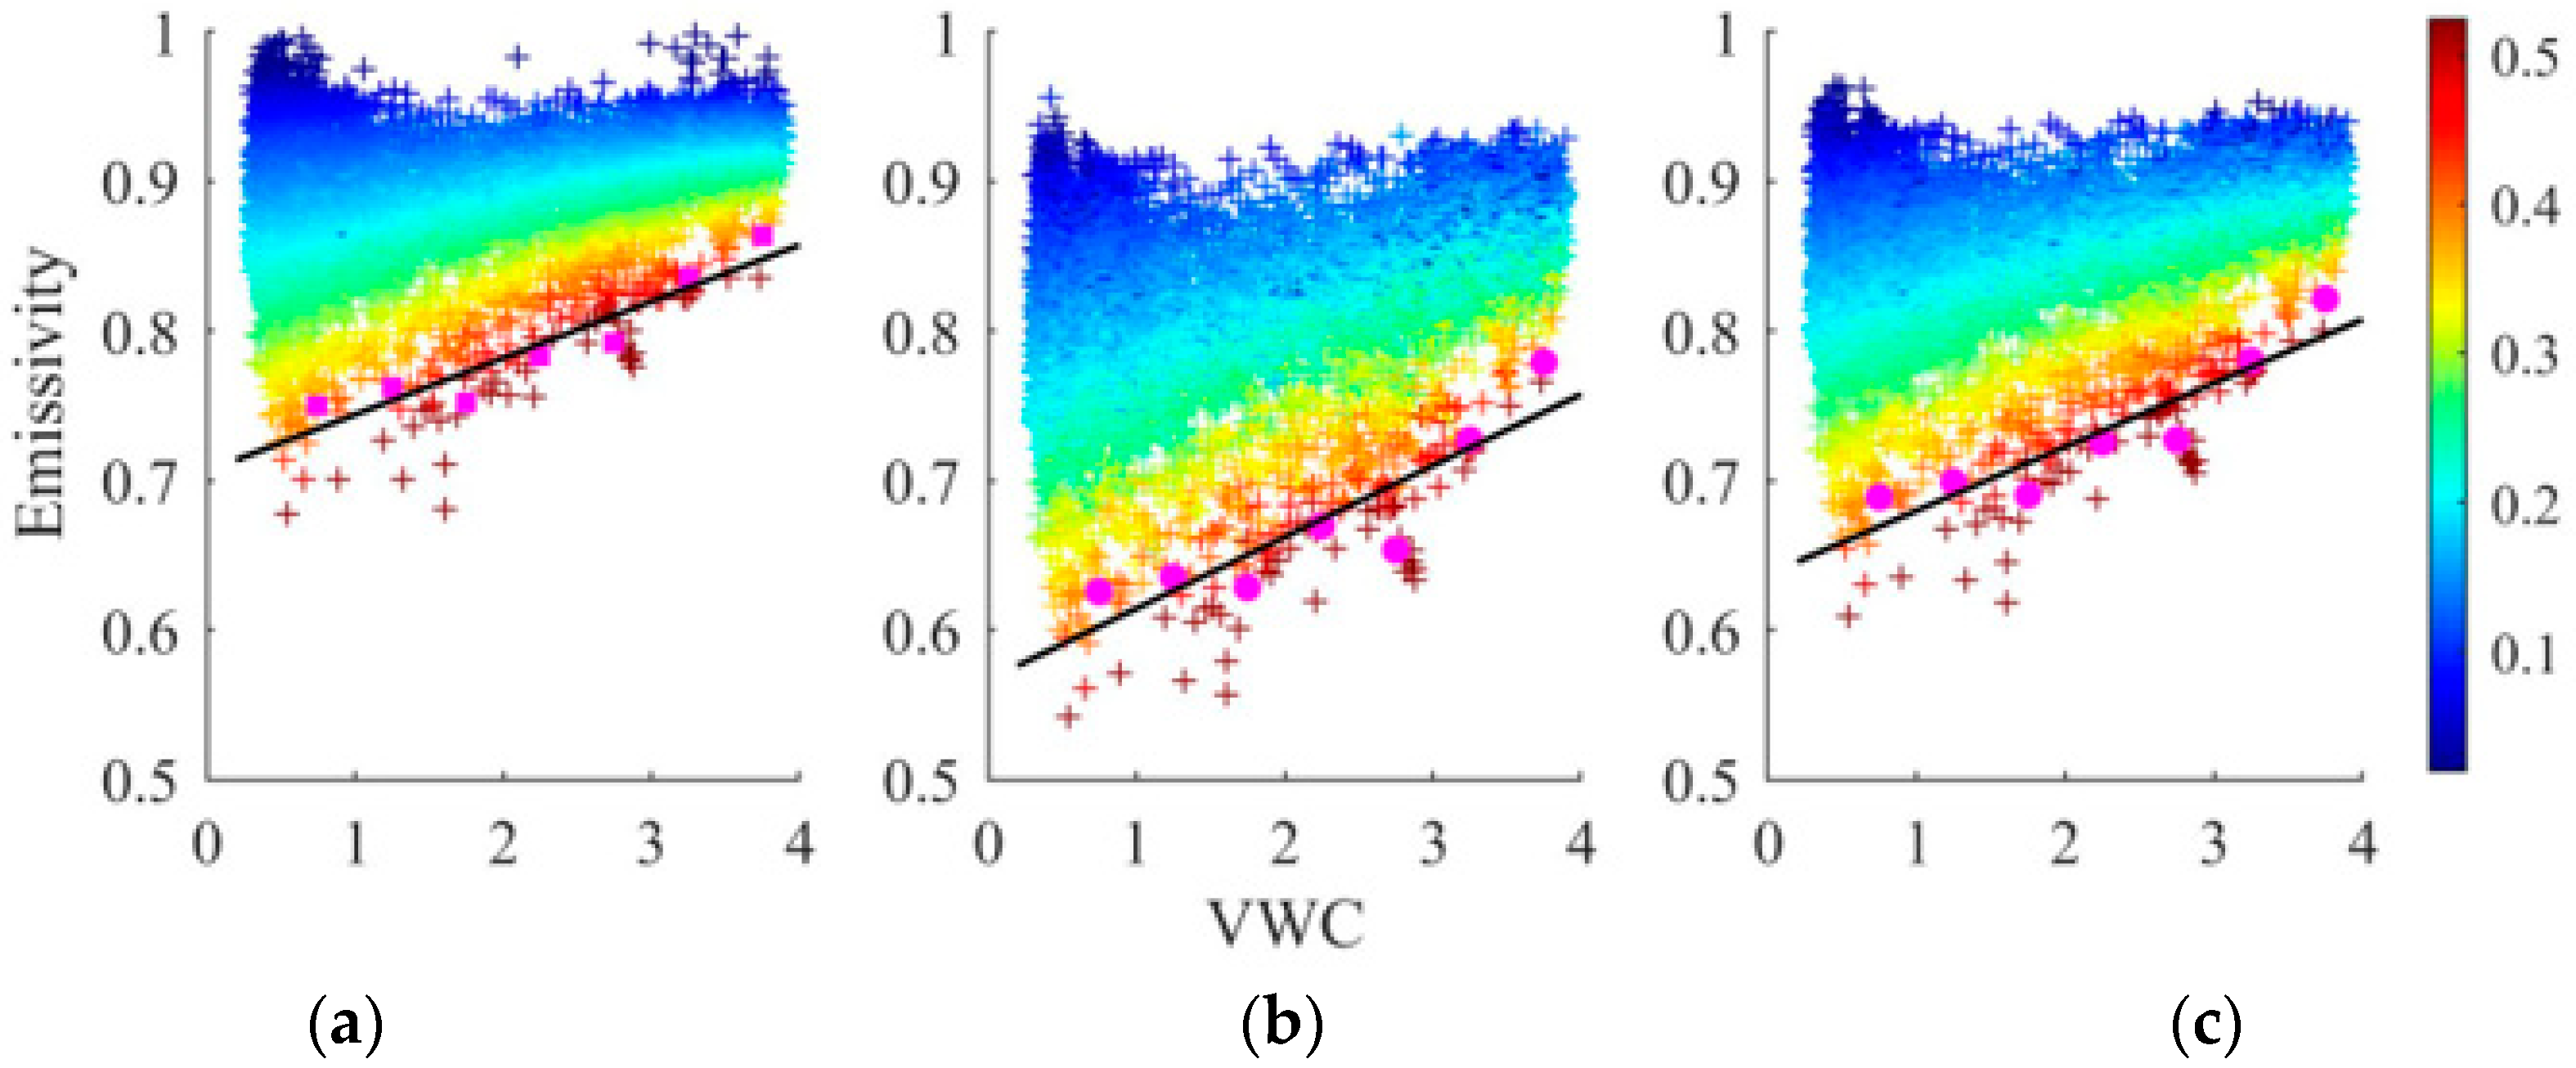
Assuming that surface roughness, texture and topography remain constant, surface emissivity is mainly affected by SSM and vegetation. Using the basic theory of microwave remote sensing, eMIN for bare soil was obtained for the maximum SSM, and the maximum emissivity was obtained for the minimum SSM. Vegetated soil surface emissivity is also related to vegetation parameters (such as VWC), and eMIN and eMAXeMIN were determined according to statistics for VWC. TB, TS, VWC, and SSM from the SMAP L3 product were used. To eliminate outliers, we segmented VWC at 0.5kg/m2 intervals and calculated the cumulative probability density distribution for each VWC segment, taking the value at the position where the cumulative probability distribution was 1% as the minimum emissivity. Figure 3 and Figure 4 show the relationships between eMIN and VWC for SMAP ascending and descending orbits respectively. This demonstrated that eMIN was obtained for the maximum SSM for H polarization, V polarization, and combined H and V polarizations, and that eMIN increased with VWC. This was because the increased emissivity from the vegetation canopy was greater than decreased emissivity of the soil surface attenuated by the canopy. In addition, there was a good linear relationship between eMIN and VWC, indicated by higher R2 [0.79,0.97] (Table 1). This showed that eMIN could be predicted by VWC.
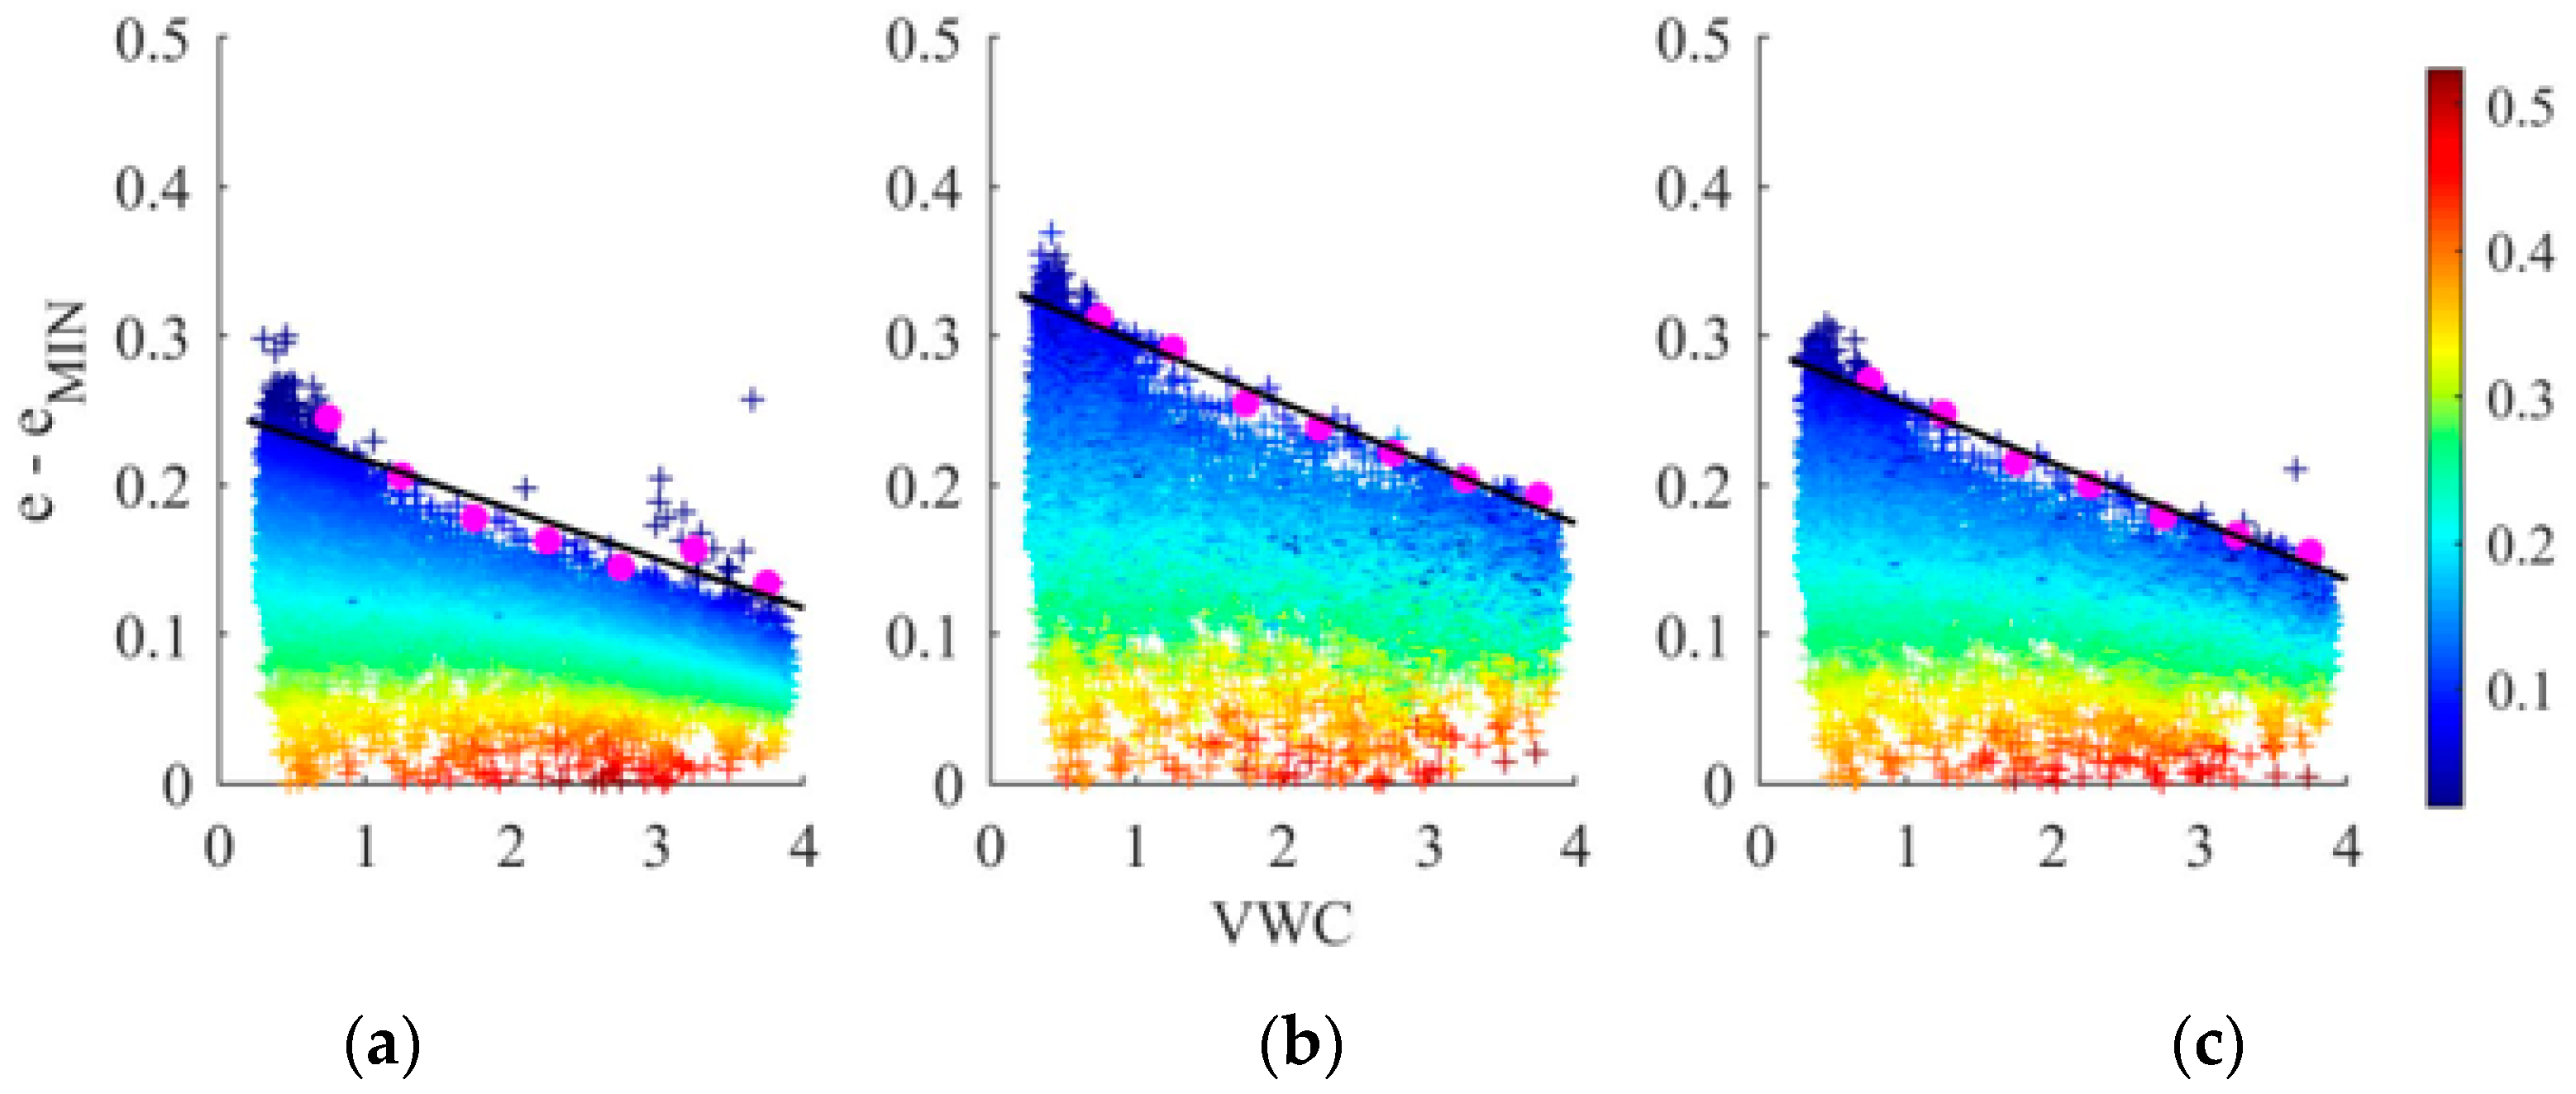
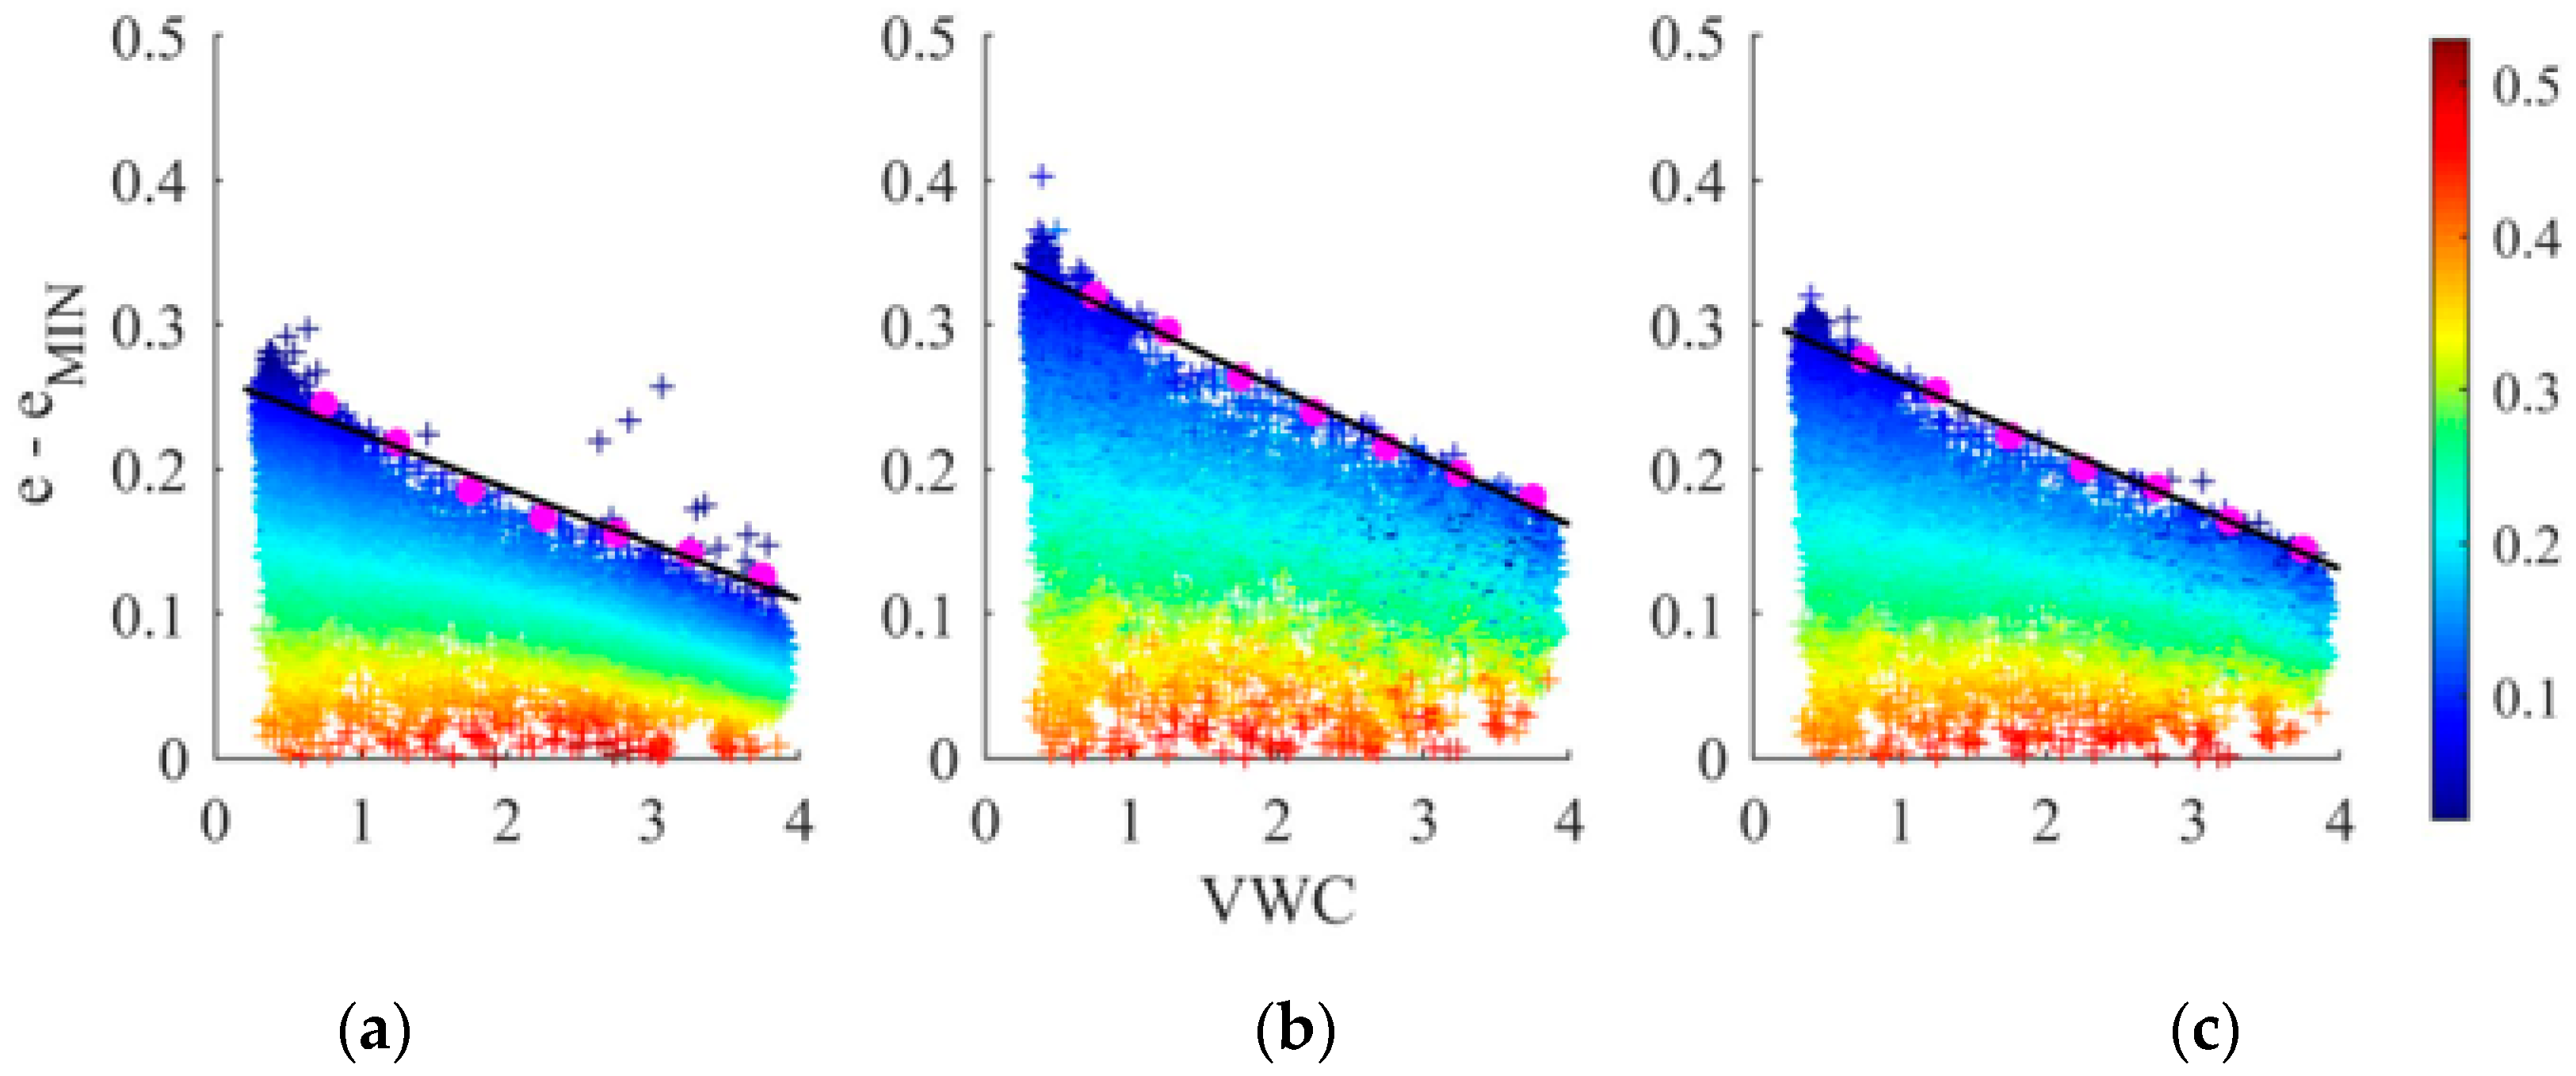
There are two methods for calculating eMAXeMIN: 1) Calculate eMAX according to the VWC segment in the same way as eMIN, and obtain the difference eMAXeMIN; 2) Calculate the difference between e and eMIN and then compute the maximum value of e− eMIN, i.e., the value of eMAXeMIN. In this study, the second method was adopted. Similarly, we took the value of the 99% cumulative probability distribution function as the value of eMAXeMIN to exclude outliers. The relationship between eMAXeMIN and VWC is shown in Figure 5 and Figure 6. This showed that eMAXeMIN values appeared when SSM is the direst for the same VWC. In contrast to eMIN, the value of eMAXeMIN decreased as VWC increased. A good linear relationship between eMAXeMIN and VWC was also indicated by higher R2 [0.86,0.99] (Table 1). This showed that the value of eMAXeMIN can be predicted by VWC.
Once eMIN and eMAXeMIN were determined, SSMMAX and SSMMIN were calculated and SSM was estimated. Here, SSMMAX and SSMMIN refer to the historical SSM maximum and minimum values for a single pixel. Therefore, their values can also be obtained by counting historical pixel values. To avoid the influence of extreme hydrological events (drought and flooding), 95% of the maximum and minimum SSM values were assigned to SSMMAX and SSMMIN. In this study, the 2016~2018 SMAP L3 SSM values were adopted to estimate SSMMAX and SSMMIN.

3. Results

3.1. Comparison of SSM Derived from Change Detection Algorithm and SMAP L3 SSM

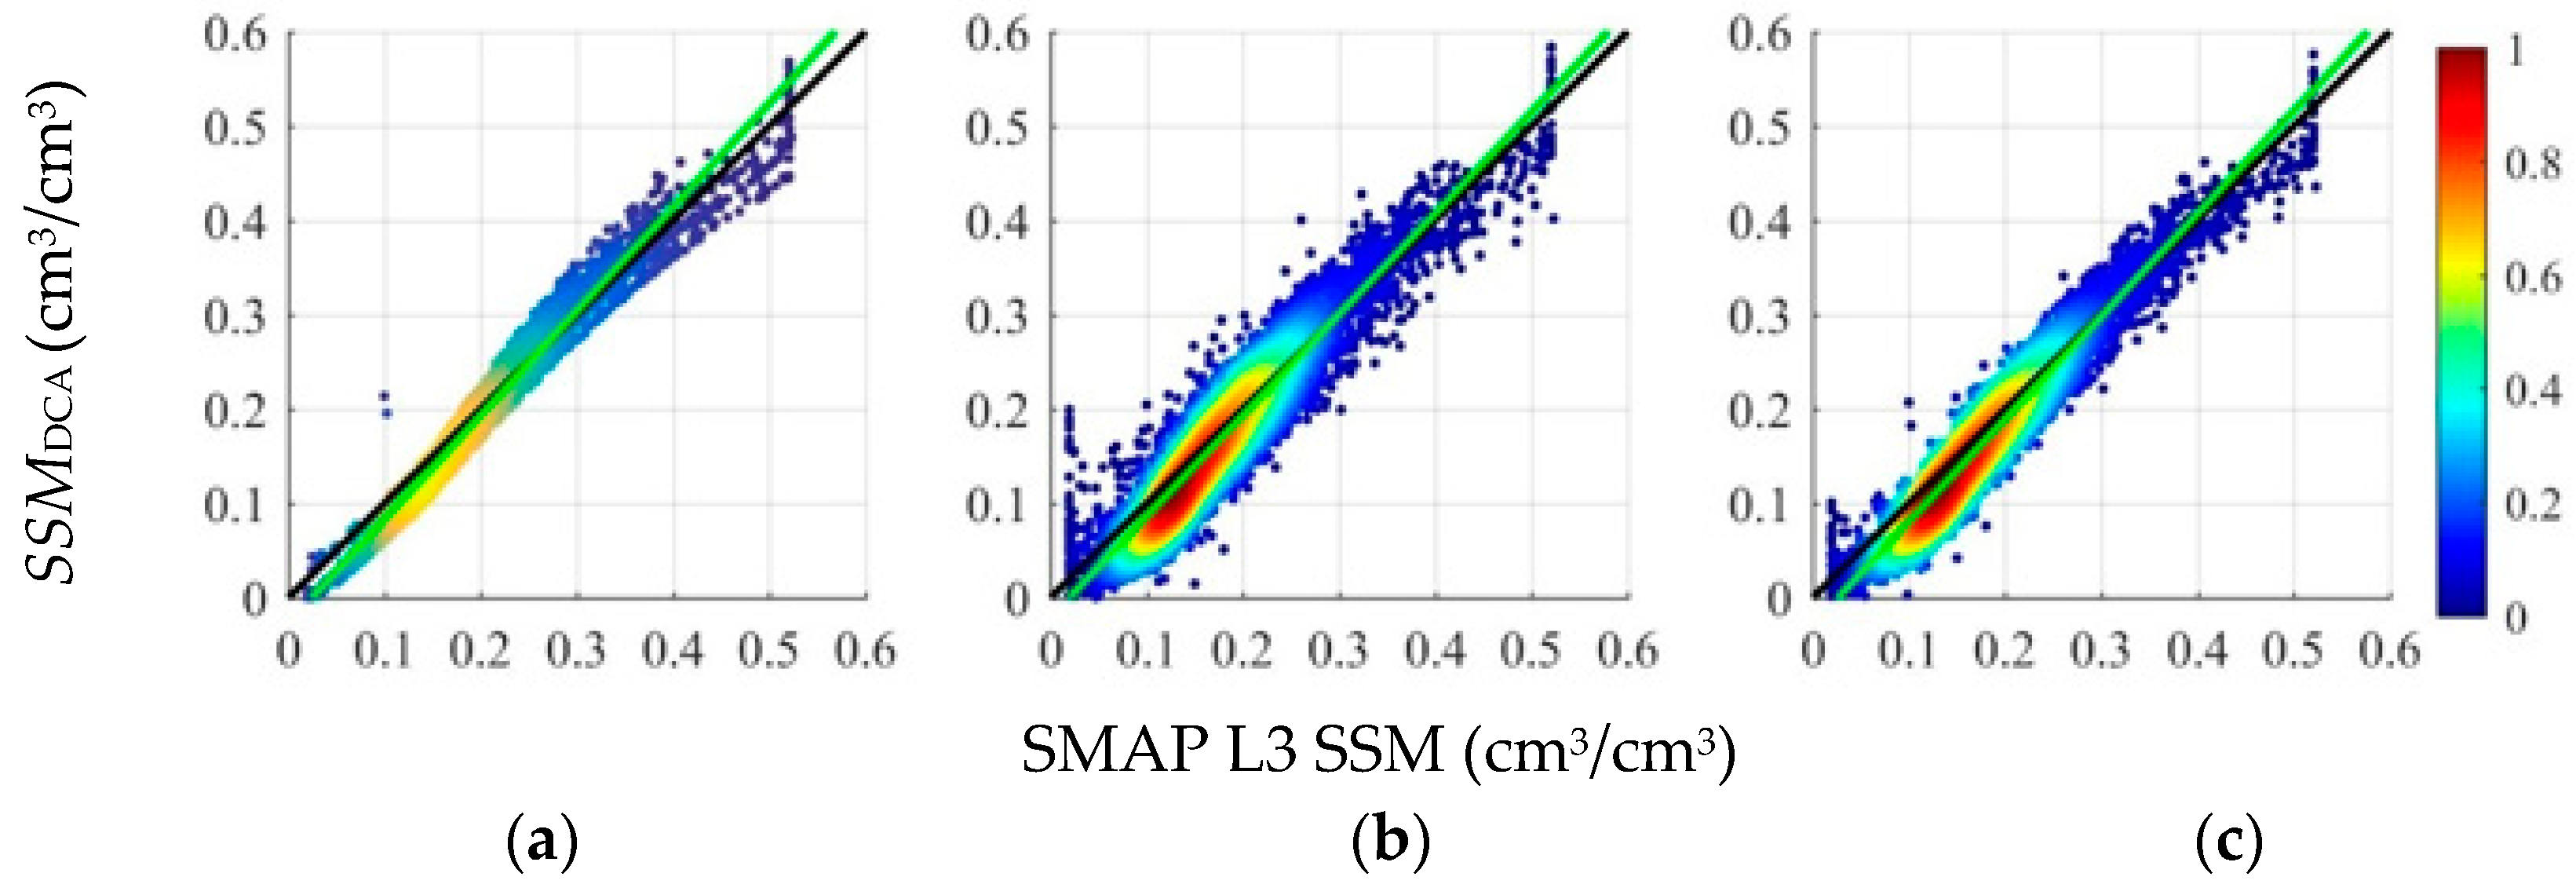
Based on the brightness temperature and TS in the SMAP L3 SSM dataset, the emissivity (e) was derived, and eMIN and eMAX − eMIN was obtained from the VWC data in the SMAP L3 SSM dataset by the fitted linear relationship (Table 1). Then, we combine Equation (5) with the statistical extreme value of SSM (SSMMIN and SSMMAX) to derive SSM (SSMDCA) based on the change detection algorithm. Figure 7 compares SMAP L3 SSM and SSMDCA for ascending orbit, and Figure 8 shows the same results for descending orbit. SMAP L3 SSM and SSMDCA were highly consistent, as indicated by high R2 and low RMSE values (Table 2). Similar SSMDCA accuracy was achieved for both ascending and descending orbits, while little difference accuracy was found for various polarizations. SSMDCA accuracy was the highest for V polarization, followed by combined H and V polarization, and finally H polarization (Table 2). This result corresponded to the simulation results in Figure 2, so the linear relationship between relative SSM change and relative emissivity change was better for V polarization than H polarization.

3.2. Comparison of SSM Derived From Change Detection Algorithm and In Situ SSM

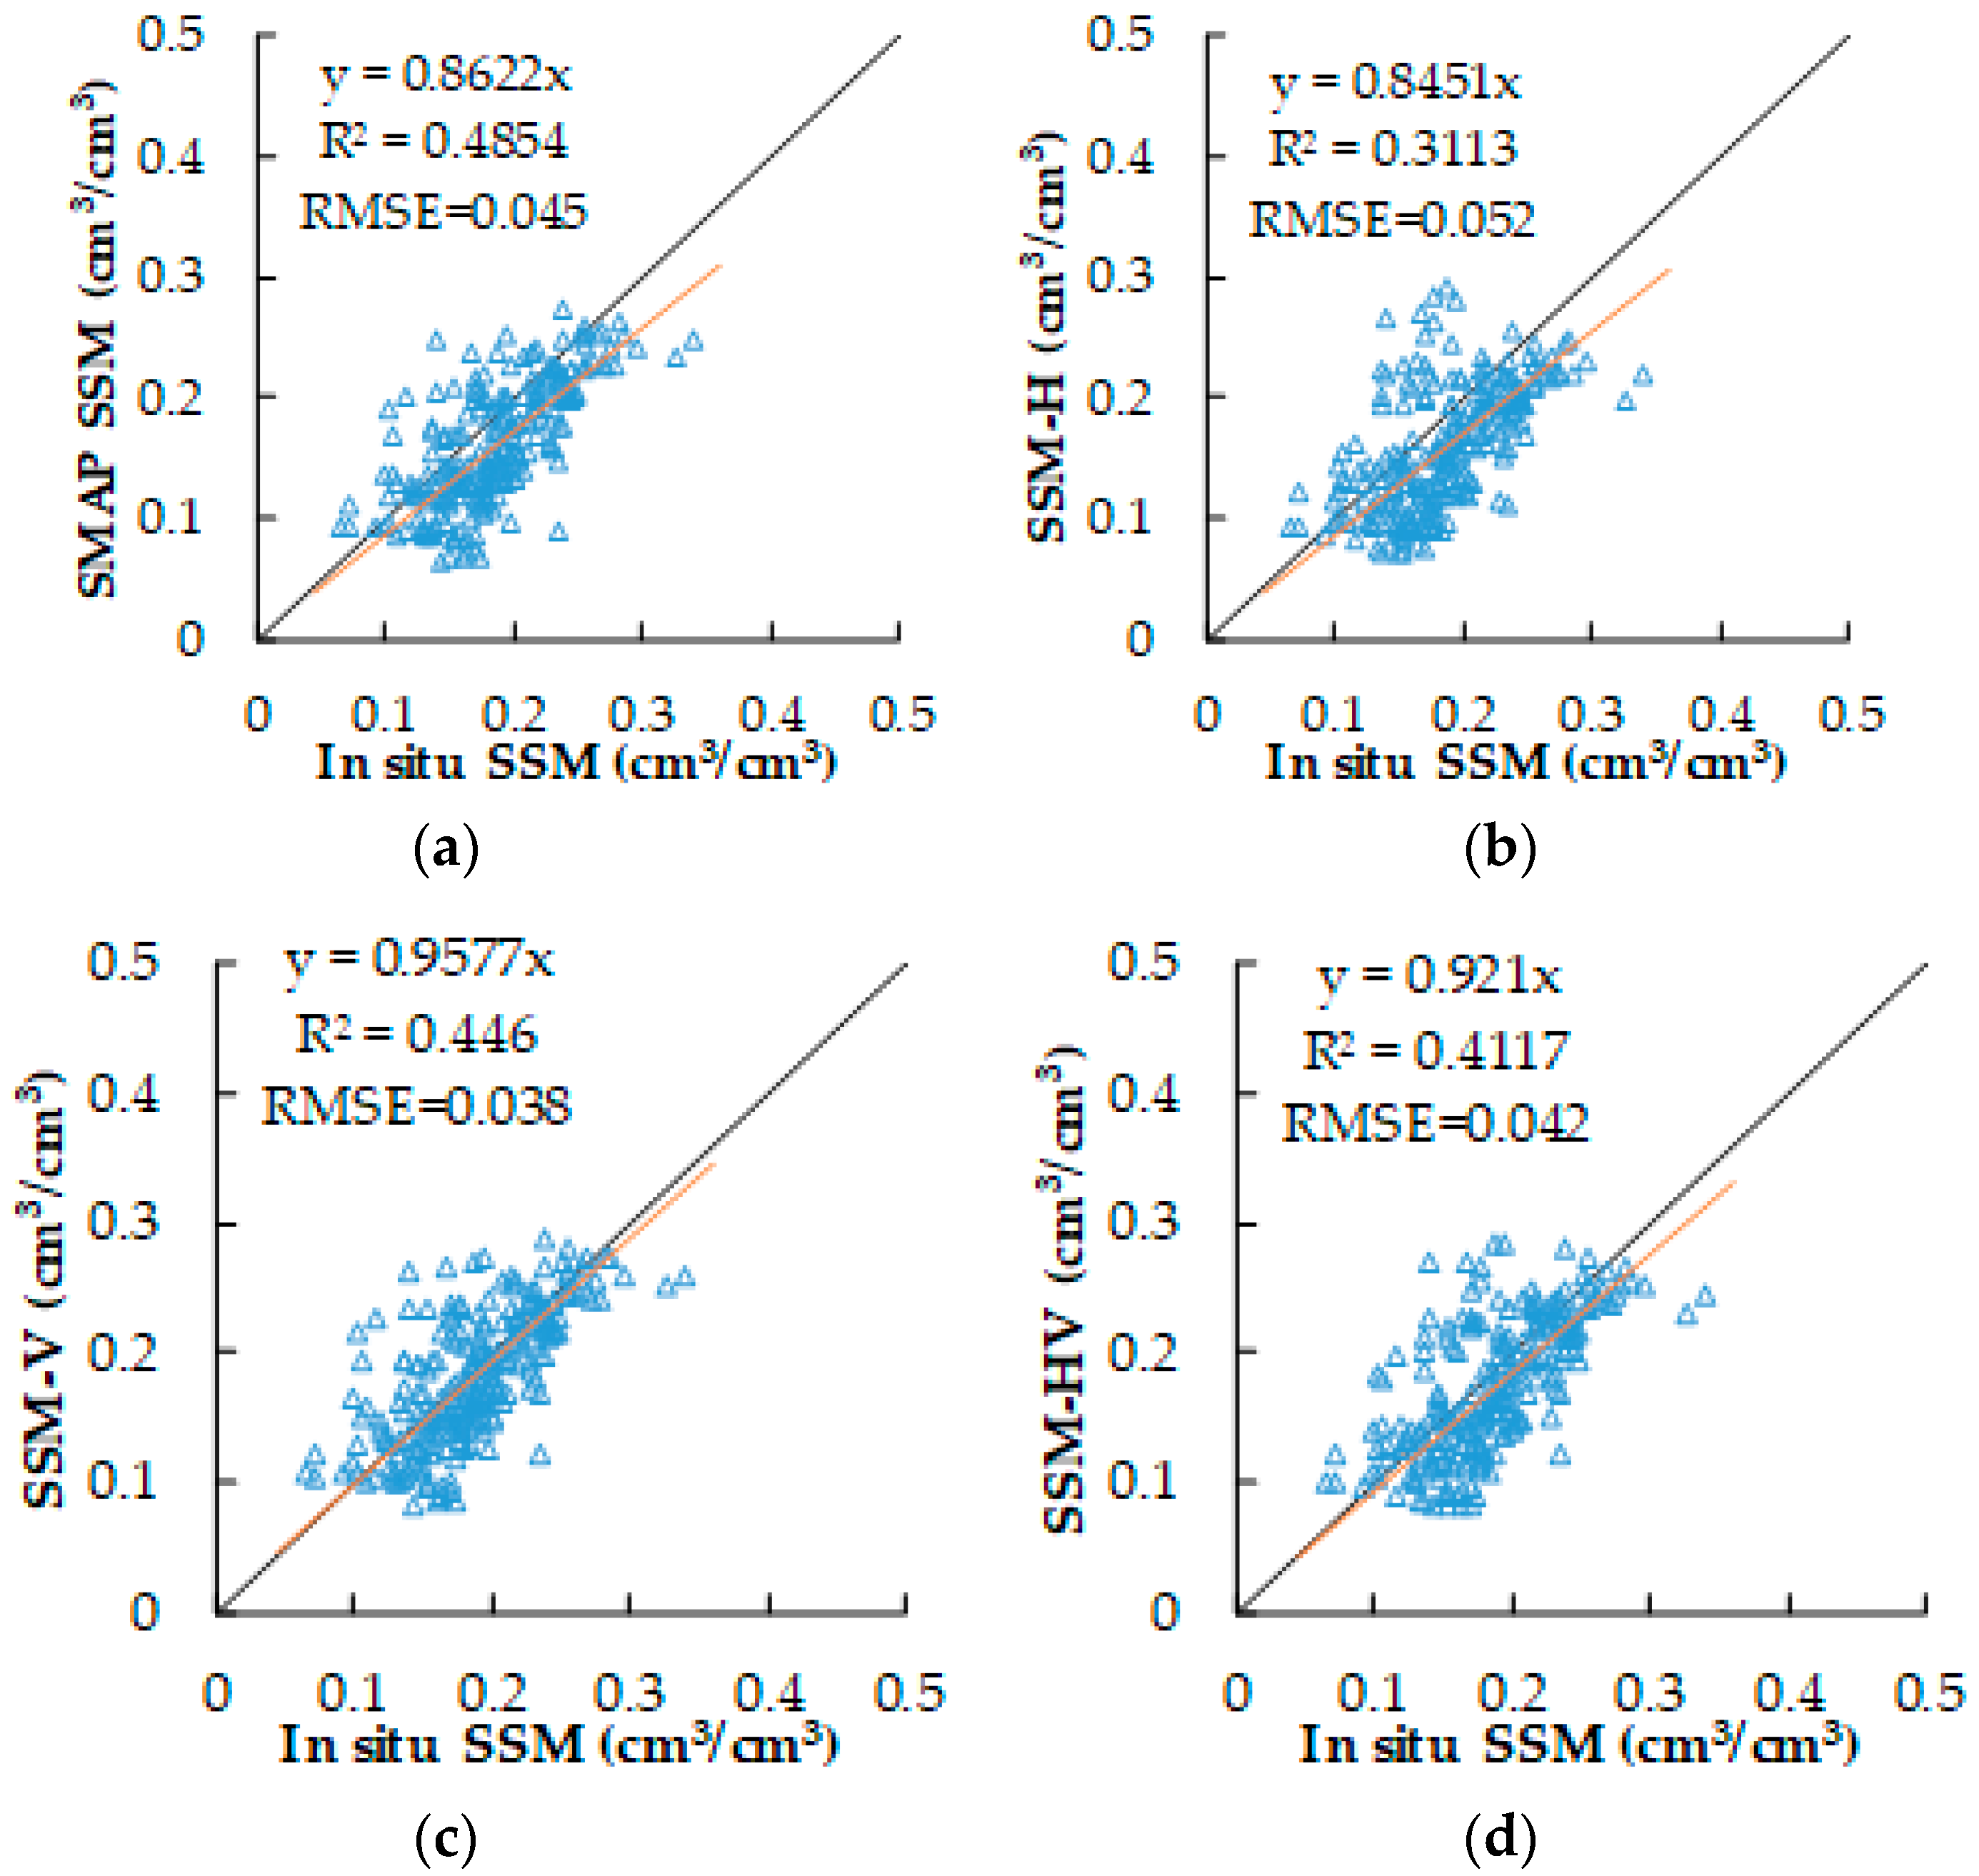
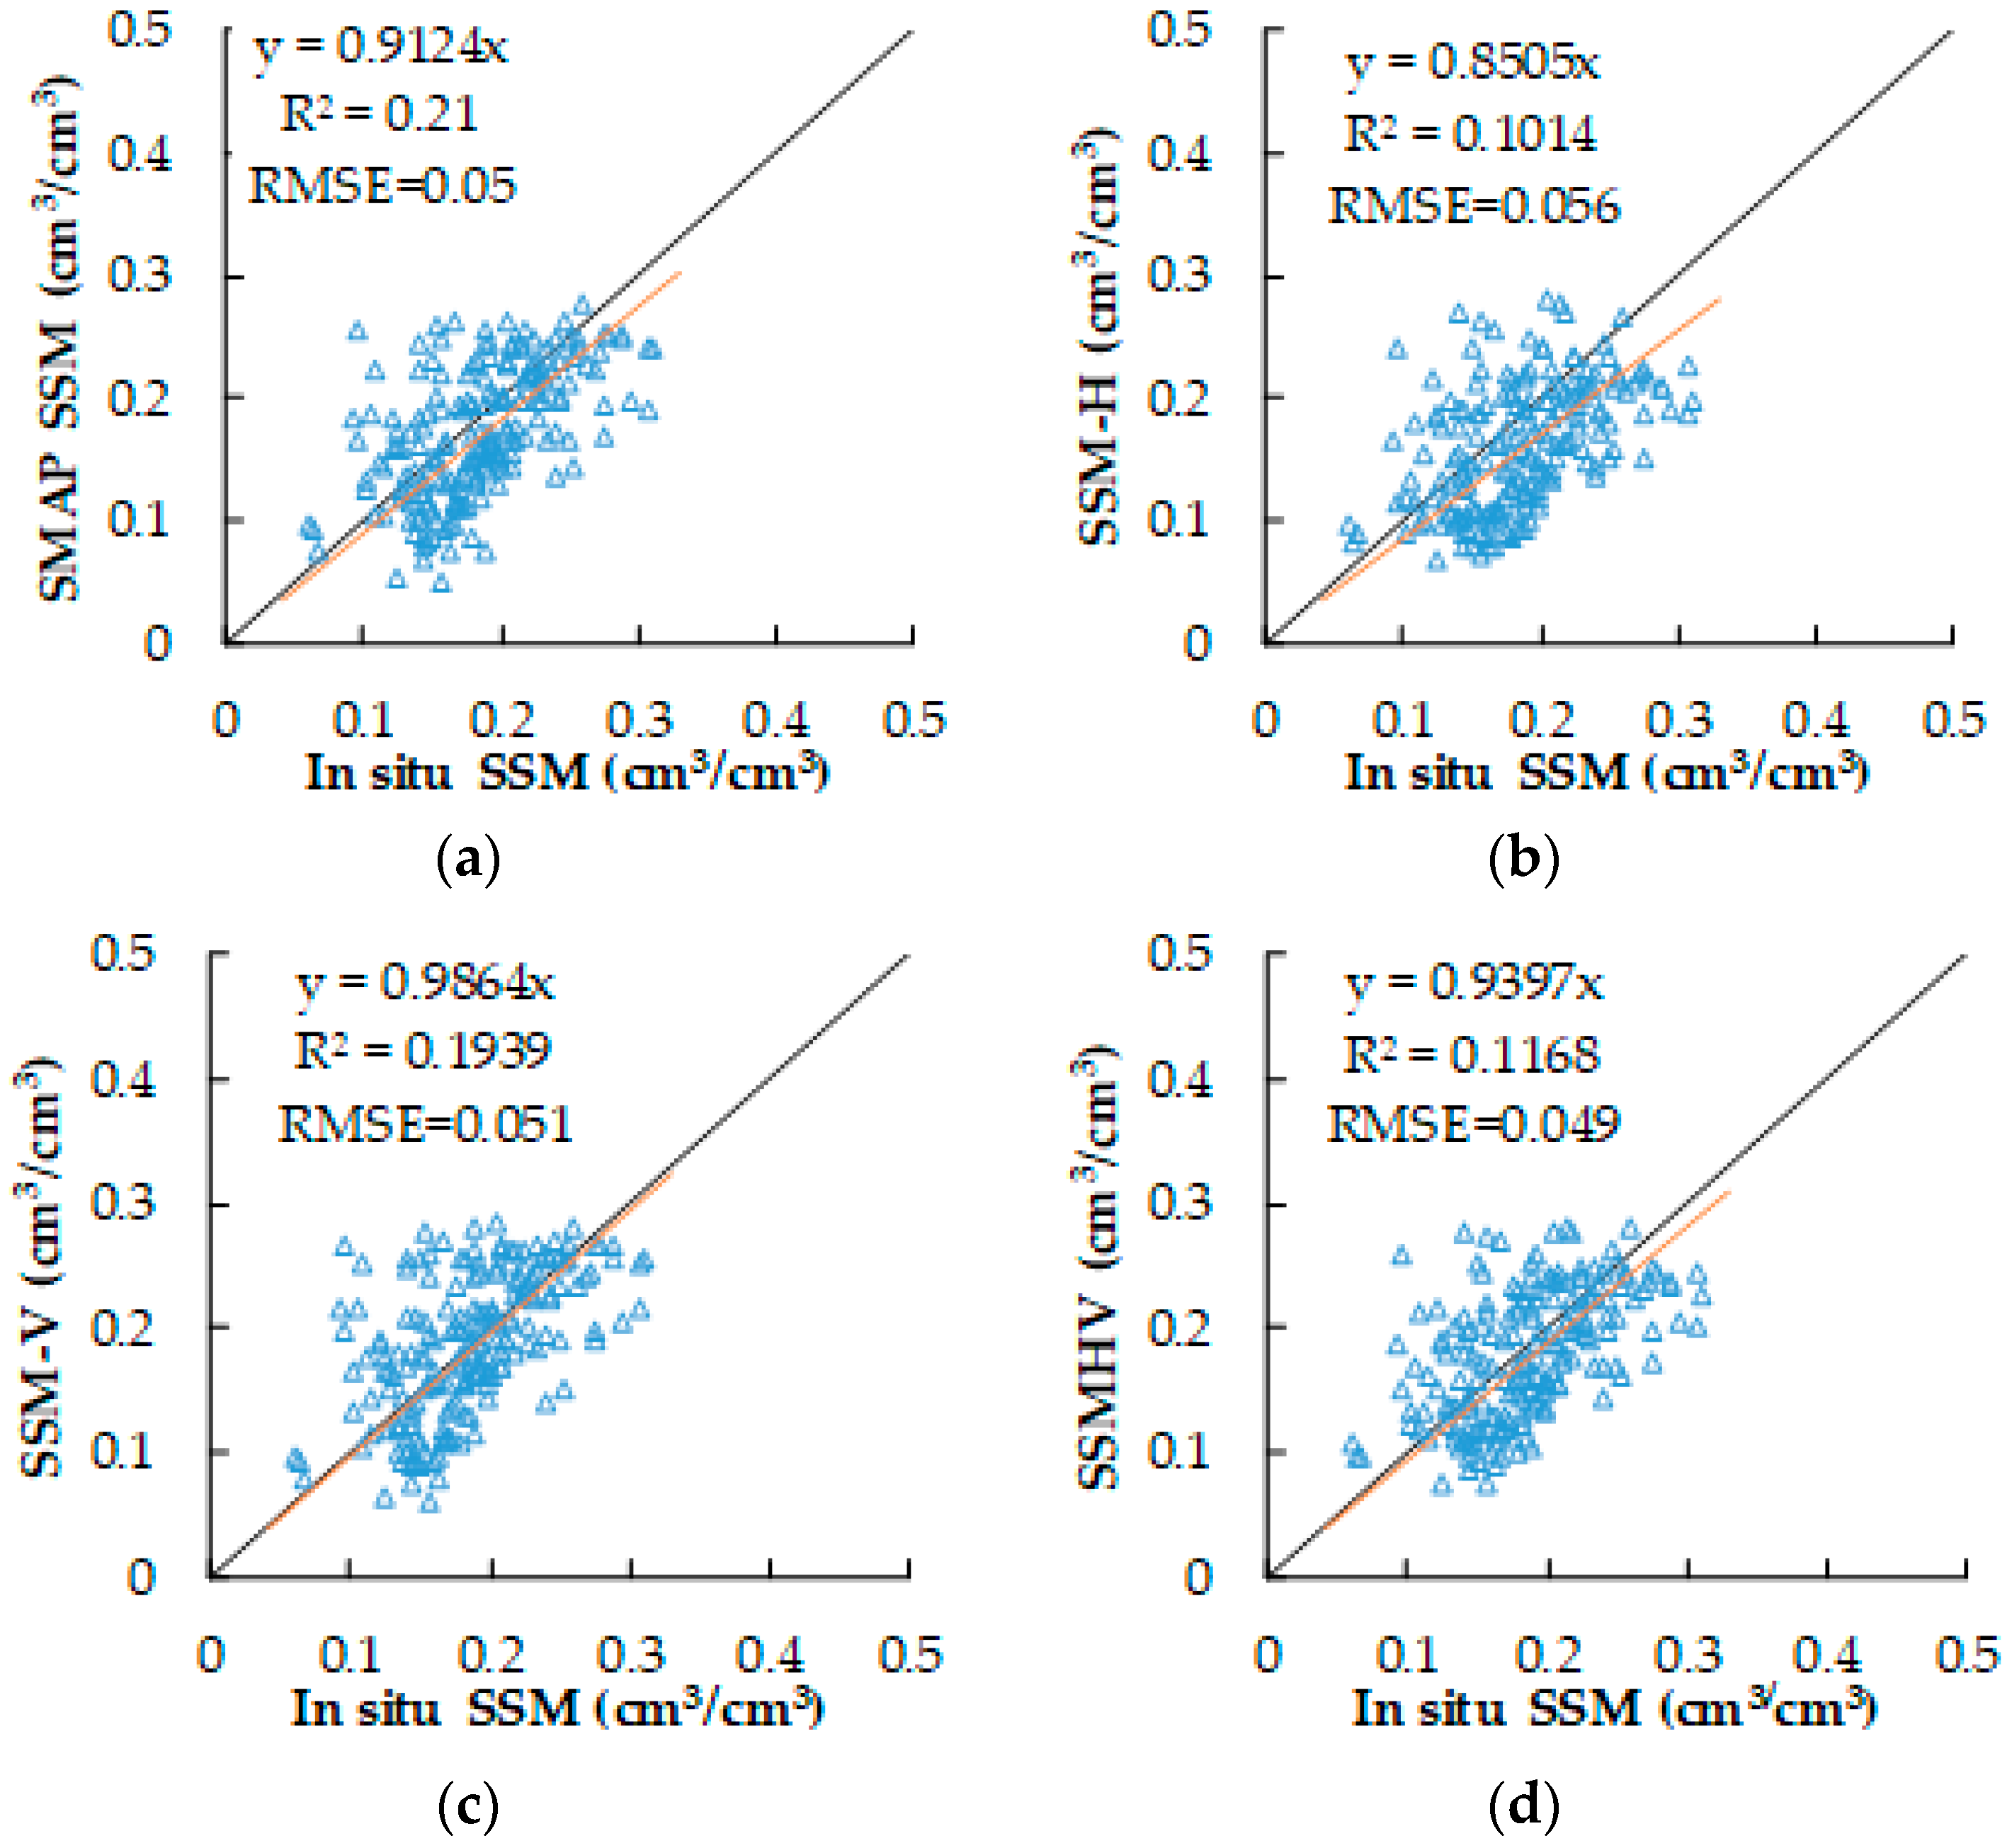
After assessing the consistency between SSMDCA and SMAP L3 SSM, it was necessary to further analyze the consistency between SSMDCA and in situ SSM. Hourly point-scale in situ SSM values from the soil moisture observation network, closest to the satellite transit time, were up-scaled to the SMAP pixel scale as the ‘true’ SSM, which was used to evaluate SSMDCA. For SMAP’s ascending orbit, respective RMSE values were 0.045 cm3/cm3, 0.052 cm3/cm3, 0.038 cm3/cm3, 0.042 cm3/cm3 for estimated SSM from SMAP L3, SMAP H pol TB, SMAP V pol TB, and combined H and V pol TB. The corresponding bias values were 0.024 cm3/cm3, 0.026 cm3/cm3, 0.0055 cm3/cm3 and 0.0125 cm3/cm3 (Figure 9). SSMDCA-V performed better than the other three SSM results due to its low RMSE and bias. For SMAP’s descending orbit, RMSE values were 0.050 cm3/cm3,0.056 cm3/cm3, 0.051 cm3/cm3, 0.049 cm3/cm3 for estimated SSM from SMAP L3, SMAP H pol TB, SMAP V pol TB, and combined H and V pol TB. The corresponding bias values were 0.012 cm3/cm3, 0.023cm3/cm3, −0.003 cm3/cm3 and 0.006 cm3/cm3 (Figure 10). SSMDCA-VH performance was better than the other three SSM results. However, the correlation coefficient between SMAP L3 SSM and in situ SSM was higher than all three SSMDCA results. This showed that compared with in situ SSM, SSMDCA accuracy was equivalent to or better than the SMAP algorithm. Possible reasons for this will be analyzed in the next section.

4. Discussion

4.1. Temporal Distribution of SSM Error

Comparing the temporal distribution of SSM error can support analysis of the error sources of different SSM algorithms. We compared the errors from four SSM results (SMAP L3 SSM and three SSM results estimated from different SMAP data polarizations based on the change detection algorithm). For ascending orbit, the SSM bias results indicated that SSM was underestimated for May and July, and overestimated for August and September (Figure 11). High RMSE and ubRMSE values occurred in June and low values occurred in September. For descending orbit, there was no clear seasonal change in bias, RMSE, or ubRMSE (Figure 12). The SSM bias estimated from SMAP H polarization TB increased overtime. Both RMSE and ubRMSE were about 0.05 cm3/cm3 over the study period, with slightly lower values in May and September and higher values during the other three months.
Generally, the temporal distributions of SSM error for three change detection algorithms were similar to the SMAP L3 SSM error. The SSM bias estimated from the combined TB of H and V polarizations was close to SMAP SSM, while RMSE and ubRMSE values for SSM estimated from the TB at V polarization was closer to SMAP SSM.

4.2. Dependence of Bias on SSM Algorithm Input Parameters

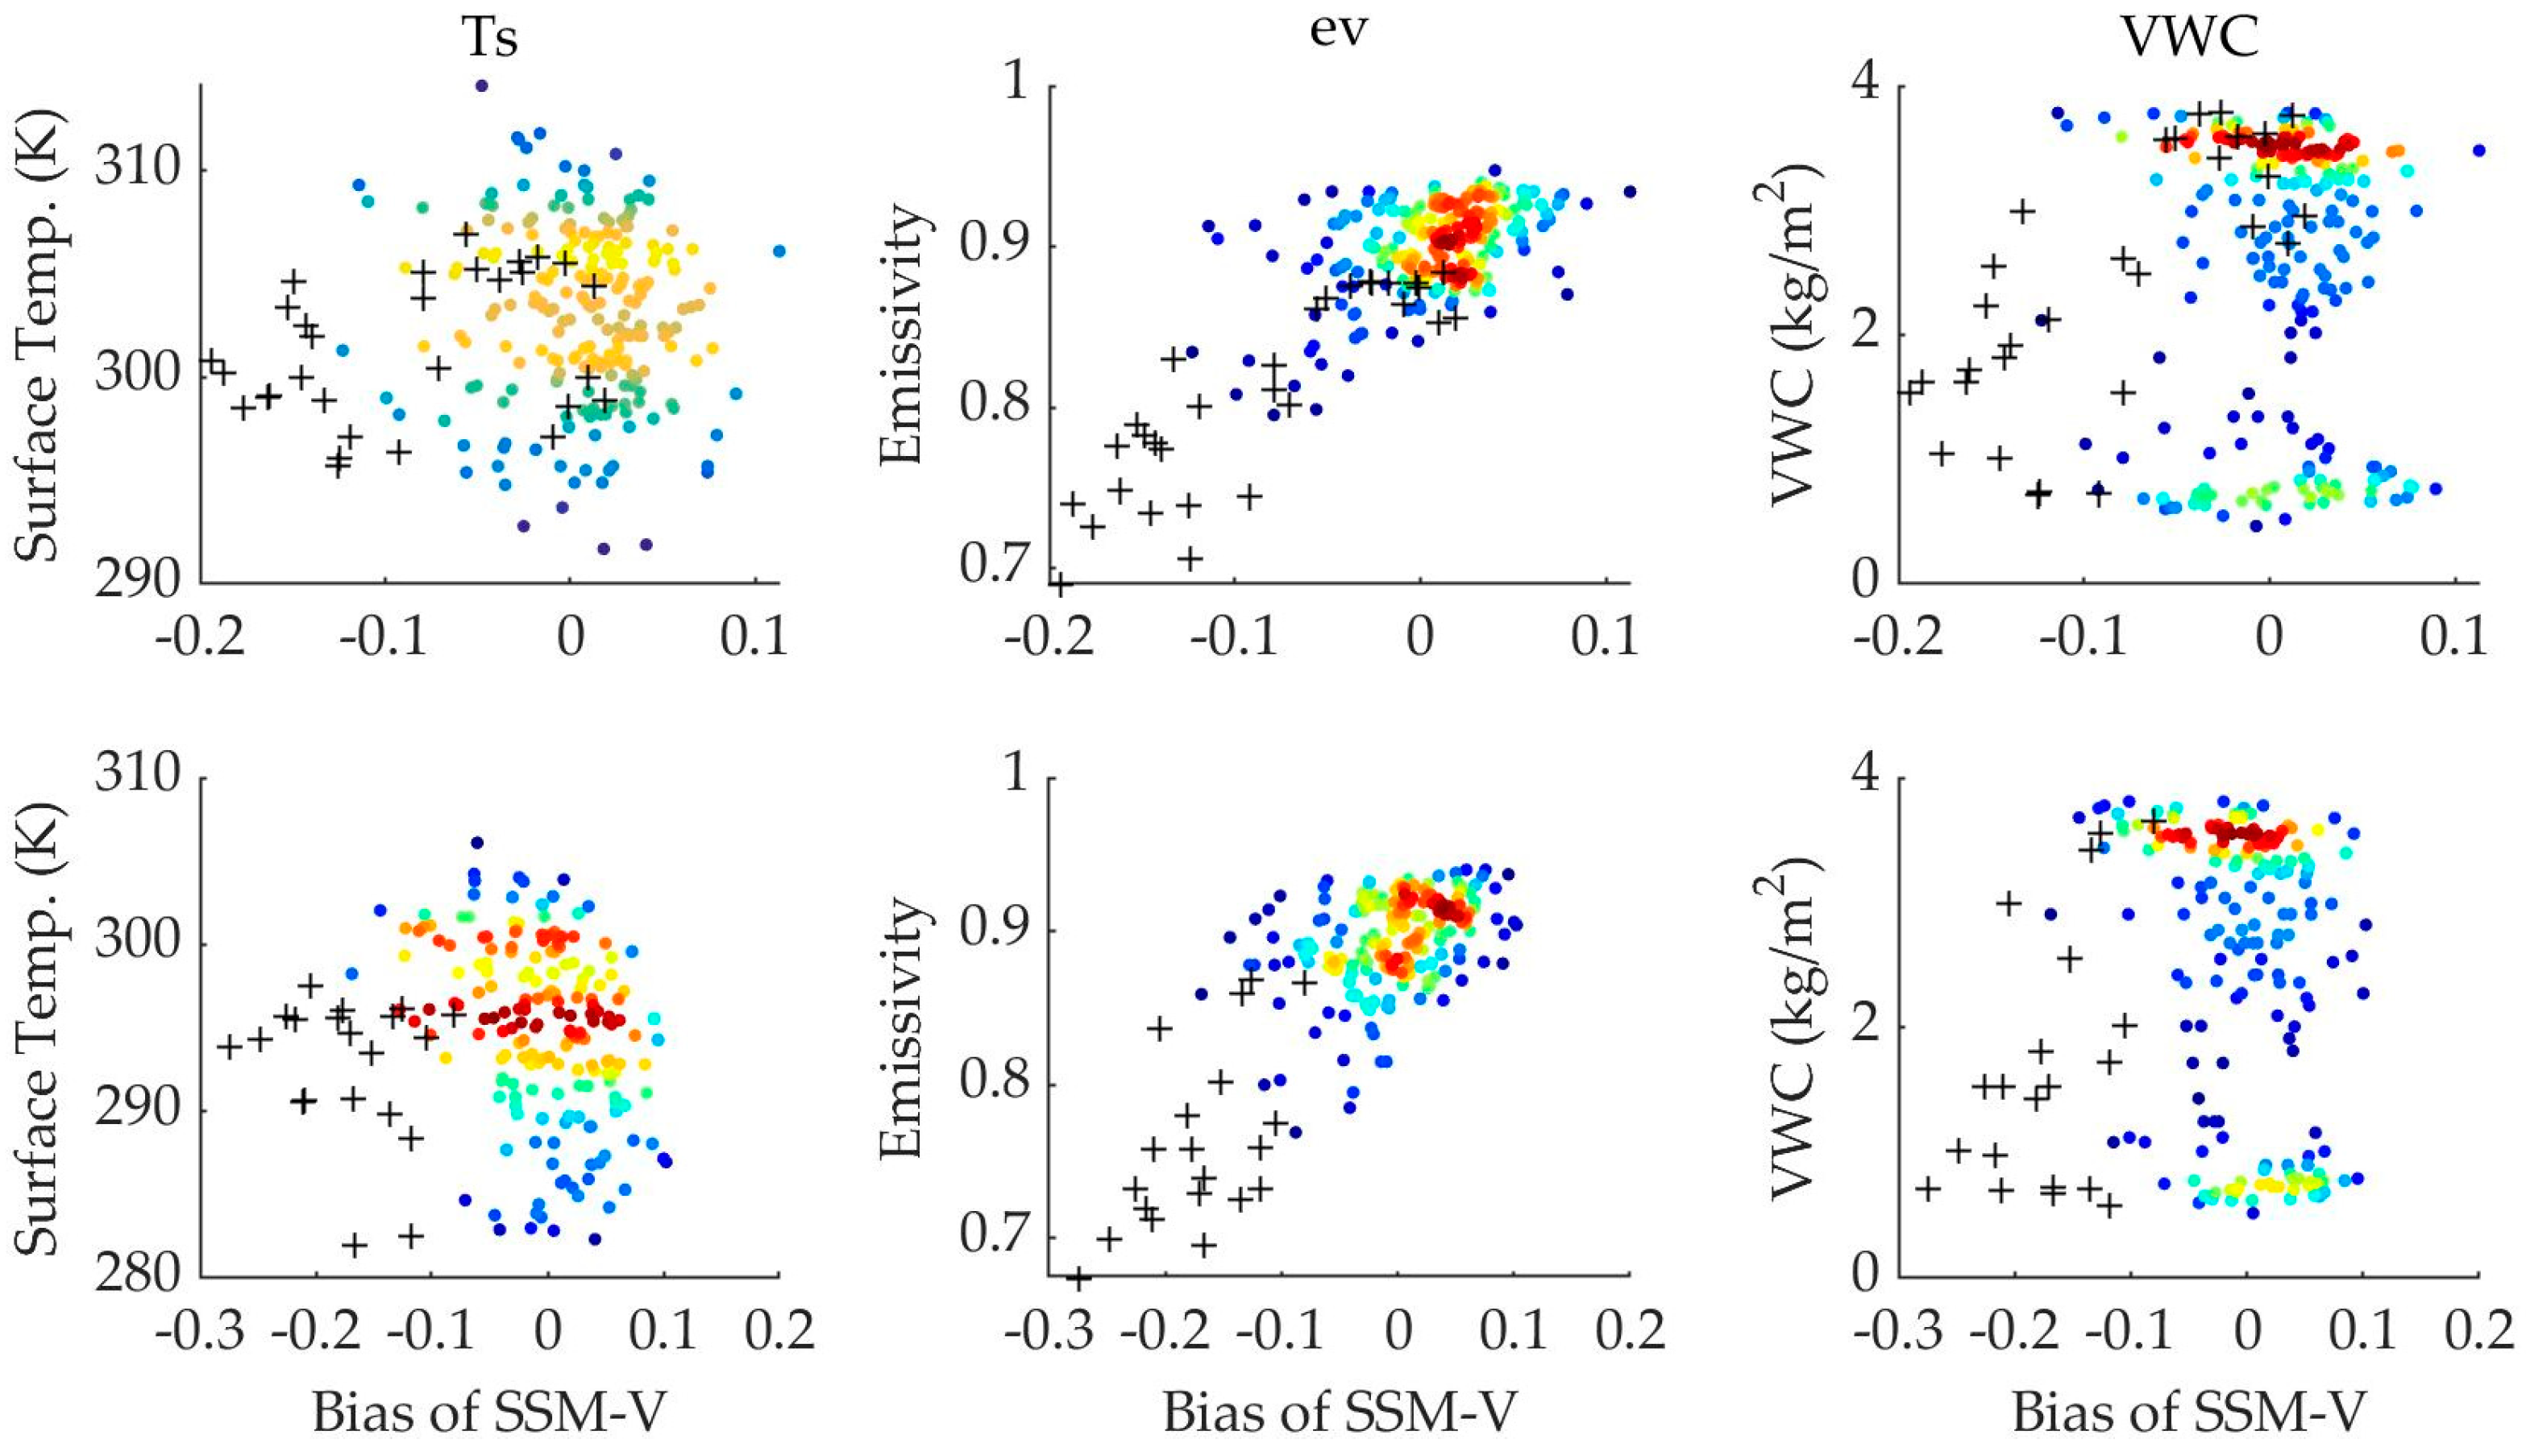
To further analyze the SSM bias sources, we analyzed the relationship between SSM bias and the SSM algorithm input parameters. Because the four error results were similar, the V polarization SSM result that was the closest to SMAP L3 SSM was selected for this analysis. Figure 13 shows the dependence of SSM bias on TS, VWC, and surface emissivity for ascending and descending orbits. SSM bias on days when rainfall exceeded 10 mm is indicated by a “+”, and a high bias was observed on those days. There was no clear dependence of bias on TS and VWC, as opposed to surface emissivity. Except for rainfall events, a negative bias occurred for relatively low surface emissivity and a positive bias occurred under high surface emissivity (Figure 13). This meant that the algorithm overestimated SSM for wet soils and underestimated it for dry soils. SSMMAX and SSMMIN values may be problematic because only three years of data were used in this study. It may also be related to the uncertainty of VWC used in the SMAP algorithm. In this study area, the highest VWC value was about 4 kg/m2 in the SMAP algorithm, lower than the actual maximum (close to 10 kg/m2) [26]. Underestimated VWC may have overstated the soil contribution to total brightness temperature in the SSM algorithm, leading to the underestimation of SSM.

4.3. Limitations, Advantages, and Potential for SSM Estimation Using the Change Detection Algorithm

The change detection algorithm is based on the principle of surface microwave radiation and belongs to the semi-empirical algorithm. Its advantage lies in its simplicity. On the other hand, the challenge is to reliably estimate eMAX (and eMIN) and SSMMAX (and SSMMIN). The vegetated surface emissivity is affected by SSM, surface roughness, VWC and canopy structure, soil texture, soil organic matter, land cover type, topography, heterogeneity, and other factors. The change detection algorithm can reduce the influence of time invariant variables at the pixel-scale (such as soil texture, organic matter, topography, land cover, and roughness) on the accuracy of retrieved SSM. The effects of time-varying variables (such as canopy properties) are parameterized by VWC (or NDVI). SSMMAX and SSMMIN values for a pixel are related to dry and wet climate zones. Therefore, SSMMAX and SSMMIN may differ across climate zones. The existing SSM values need to be used to train SSMMAX and SSMMIN. Therefore, a longer SSM data time series leads to higher algorithm stability.
Similar to SMAP, surface roughness is assumed to be a constant that does not change with time in the change detection algorithm. In fact, surface roughness changes with human activities associated with farming activities and rainfall. The change detection algorithm can eliminate the influence of incoherent radiation caused by changing surface roughness to a certain extent, using combined polarized brightness temperature. However, performance in practical applications is not very good and the effect of surface roughness on this algorithm needs to be further explored.
The reason why VWC is used to establish the relationship with SMAP emissivity in this study is that the differences of vegetation types are taken into account in the calculation of VWC based on NDVI. It means that the same NDVI may correspond to different VWC for different vegetation types. The attenuation of the incident electromagnetic wave and self-radiation of the vegetation canopy mainly depend on its VWC and structure. Although VWC is estimated based on NDVI, this study uses VWC to establish the relationship, mainly to reduce the modeling error of vegetation attenuation and self-radiation ability under different vegetation types.

5. Conclusions

This work was carried out to verify the feasibility of the change detection algorithm for estimating SSM from L-band passive microwave TB, and can be divided into two aspects: theoretical simulation based on the radiative transfer model and validation based on in situ soil moisture. The following conclusions were obtained:
(1) Based on the simulated L-band reflectivity of bare soil under different conditions (surface roughness, SSM), there was an approximate linear relationship between the SSM and surface emissivity with R2 > 0.98 for both H and V polarization. This meant that the change detection algorithm could be used to estimate SSM from passive microwave TB.
(2) Time-series values for TB, TS, VWC and SSM provided by SMAP L3 dataset were used to calculate the minimum emissivity (eMIN) and eMAX − eMIN for each VWC interval, and a linear relationship between them was developed for ascending and descending orbits. This was applied in the change detection algorithm.
(3) SSM values estimated by the change detection algorithm were in good agreement with SMAP L3 SSM and up-scaled in situ SSM from the soil moisture observation network. This showed that the algorithm can be used to estimate SSM in China’s northeastern farmland area. The SSM estimation accuracy of V polarization TB was higher than H polarization and combined H and V polarization.
(4) The temporal distribution of SSM error (bias, RMSE and ubRMSE) estimated by the change detection algorithm was very similar to SMAP L3 SSM. This may be because eMIN and the maximum value of eeMIN (also for SSMMIN and SSMMAX) in the algorithm were trained according to SMAP L3 SSM.
Although this study confirmed the feasibility of using the change detection algorithm for SSM estimation based on passive microwave remote sensing, the sources and characteristics of errors need to be further analyzed. It should also be validated for other land cover types and at larger spatial scales.

Author Contributions

Conceptualization, X.Z.; methodology, B.L.; validation, L.L.; formal analysis, T.J.; resources, X.X.; data curation, H.X. and Y.S.; writing—original draft preparation, Z.F.; writing—review and editing, X.L. (Xiaofeng Li); visualization, X.L. (Xiaojie Li). All authors have read and agreed to the published version of the manuscript.

Funding

This research was funded by the NATIONAL NATURAL SCIENCE FOUNDATION OF CHINA, grant number 41971323.

Acknowledgments

Thanks NSIDC for providing the SMAP L3 dataset.

Conflicts of Interest

The authors declare no conflict of interest.

References

  1. Magagi, R.; Berg, A.A.; Goita, K.; Belair, S.; Jackson, T.J.; Toth, B.; Walker, A.; Mcnairn, H.; O’Neill, P.E.; Moghaddam, M. Canadian Experiment for Soil Moisture in 2010 (CanEx-SM10): Overview and Preliminary Results. IEEE Trans. Geosci. Remote Sens. 2012, 51, 347–363. [Google Scholar] [CrossRef] [Green Version]
  2. Shi, J.C.; Yang, D.; Du, J.Y.; Jiang, L.M.; Chai, L.N.; Mao, K.B.; Peng, X.; Ni, W.J.; Xiong, C.; Qiang, L. Progresses on microwave remote sensing of land surface parameters. J. Sci. China Earth Sci. 2012, 55, 1052–1078. [Google Scholar] [CrossRef]
  3. Entekhabi, D.; Njoku, E.G.; O’Neill, P.E.; Kellogg, K.H.; Crow, W.T.; Edelstein, W.N.; Entin, J.K.; Goodman, S.D.; Jackson, T.J.; Johnson, J.; et al. The Soil Moisture Active Passive (SMAP) Mission. Proc. IEEE 2010, 98, 704–716. [Google Scholar] [CrossRef]
  4. Kerr, Y.H.; Waldteufel, P.; Wigneron, J.P.; Delwart, S.; Cabot, F.; Boutin, J.; Escorihuela, M.J.; Font, J.; Reul, N.; Gruhier, C.; et al. The SMOS Mission: New Tool for Monitoring Key Elements ofthe Global Water Cycle. Proc. IEEE 2010, 98, 666–687. [Google Scholar] [CrossRef] [Green Version]
  5. Bazzi, H.; Baghdadi, N.; El Hajj, M.; Zribi, M.; Belhouchette, H. A Comparison of Two Soil Moisture Products S2MP and Copernicus-SSM over Southern France. J. Sel. Top. Appl. Earth Obs. Remote Sens. 2019, 12, 3366–3375. [Google Scholar] [CrossRef]
  6. Kerr, Y.H.; Waldteufel, P.; Wigneron, J.P.; Martinuzzi, J.; Font, J.; Berger, M. Soil moisture retrieval from space: The Soil Moisture and Ocean Salinity (SMOS) mission. IEEE Trans. Geosci. Remote Sens. 2002, 39, 1729–1735. [Google Scholar] [CrossRef]
  7. Wigneron, J.-P.; Jackson, T.J.; O’Neill, P.; De Lannoy, G.; Rosnay, P.; Walker, J.P.; Ferrazzoli, P.; Mironov, V.; Bircher, S.; Grant, J.P.; et al. Modelling the passive microwave signature from land surfaces: A review of recent results and application to the L-band SMOS & SMAP soil moisture retrieval algorithms. Remote Sens. Environ. 2017, 192, 238–262. [Google Scholar]
  8. Wagner, W.; Lemoine, G.; Borgeaud, M.; Rott, H. A study of vegetation cover effects on ERS scatterometer data. IEEE Trans. Geosci. Remote Sens. 1999, 37, 938–948. [Google Scholar] [CrossRef]
  9. Srivastava, H.S.; Patel, P.; Sharma, Y. Large-area soil moisture estimation using multi-incidence-angle RADARSAT-1 SAR data. IEEE Trans. Geosci. Remote Sens. 2009, 47, 2528–2535. [Google Scholar] [CrossRef]
  10. Baghdadi, N.; Aubert, M.; Cerdan, O.; Franchistéguy, L.; Viel, C.; Eric, M.; Zribi, M.; Desprats, J.F. Operational Mapping of Soil Moisture Using Synthetic Aperture Radar Data: Application to the Touch Basin (France). Sensors 2007, 7, 2458–2483. [Google Scholar] [CrossRef]
  11. Zheng, X.M.; Bai, Y.; Jiang, T.; Zhao, X.W.; Yang, J.W. Evaluation of SMAP Passive Soil Moisture Products using in-situ data from a dense observation network over Agricultural Area in Northeast China. IEEE Int. Geosci. Remote Sens. Symp. 2018, 3779–3882. [Google Scholar] [CrossRef]
  12. Colliander, A.; Jackson, T.J.; Bindlish, J.R.; Chan, S.; Das, N.; Kim, S.B.; Cosh, M.H.; Dunbar, R.S.; Dang, L.; Pashaian, L.; et al. Validation of SMAP surface soil moisture products with core validation sites. Remote Sens. Environ. 2017, 191, 215–231. [Google Scholar] [CrossRef]
  13. O’Neill, P.E.; Chan, S.; Njoku, E.G.; Jackson, T.; Bindlish, R. SMAP L3 Radiometer Global Daily 36 km EASE-Grid Soil Moisture, Version 6. Boulder, Colorado USA. NASA National Snow and Ice Data Center Distributed Active Archive Center. In Proceedings of the 2019 Photonics & Electromagnetics Research Symposium—Fall (PIERS—Fall), Xiamen, China, 17–20 December 2019. [Google Scholar] [CrossRef]
  14. O’Neill, P.E.; Bindlish, R.; Chan, S.; Chaubell, J.; Njoku, E.G.; Jackson, T. Algorithm Theoretical Basis Document Level 2 & 3 Soil Moisture (Passive) Data Products, Revision E, 2019b, JPL D-66480. Available online: https://nsidc.org/sites/nsidc.org/files/technical-references/L2_SM_P_ATBD_rev_E_Aug2019.pdf (accessed on 18 April 2020).
  15. Le Vine, D.M.; Karam, M.A. Dependence of attenuation in a vegetation canopy on frequency and plant water content. IEEE Trans. Geosci. Remote Sens. 1996, 34, 1090–1096. [Google Scholar] [CrossRef]
  16. Loew, A. Impact of surface heterogeneity on surface soil moisture retrievals from passive microwave data at the regional scale: The Upper Danube case. Remote Sens. Environ. 2008, 112, 231–248. [Google Scholar] [CrossRef]
  17. Wigneron, J.P.; Calvet, J.C.; De Rosnay, P.; Kerr, Y.; Waldteufel, P.; Saleh, K.; Escorihuela, M.J.; Kruszewski, A. Soil moisture retrievals from biangular L-band passive microwave observations. IEEE Geosci. Remote Sens. Lett. 2004, 1, 277–281. [Google Scholar] [CrossRef]
  18. Wigneron, J.P.; Kerr, Y.; Waldteufel, P.; Saleh, K.; Escorihuela, M.J.; Richaume, P.; Ferrazzoli, P.; De Rosnay, P.; Gurney, R.; Calvet, J.C.; et al. L-band microwave emission of the biosphere (L-MEB) model: Description and calibration against experimental data sets over crop fields. Remote Sens. Environ. 2007, 107, 639–655. [Google Scholar] [CrossRef]
  19. Van de Griend, A.A.; Wigneron, J.P.; Waldteufel, P. Consequences of surface heterogeneity for parameter retrieval from 1.4-GHz multiangle SMOS observations. IEEE Trans. Geosci. Remote Sens. 2003, 41, 803–811. [Google Scholar] [CrossRef]
  20. Wigneron, J.P.; Laguerre, L.; Kerr, Y.H. A simple parameterization of the L-band microwave emission from rough agricultural soils. IEEE Trans. Geosci. Remote Sens. 2001, 39, 1697–1707. [Google Scholar] [CrossRef]
  21. Li, D.; Jin, R.; Che, T.; Walker, J.; Gao, Y.; Ye, N.; Wang, S. Soil moisture retrieval from airborne PLMR and MODIS products in the Zhangye oasis of middle stream of the Heihe River Basin, China. J. Adv. Earth Sci. 2014, 29, 295–305. [Google Scholar] [CrossRef]
  22. Jiang, T.; Zhao, K.; Zheng, X.M.; Chen, S.; Wan, X.K. Dynamic bp in the L Band and Its Role in Improving the Accuracy of Soil Moisture Retrieval. J. Chin. Geogr. Sci. 2019, 29, 283–292. [Google Scholar] [CrossRef] [Green Version]
  23. Attarzadeh, R.; Amini, J.; Notarnicola, C.; Greifeneder, F. Synergetic Use of Sentinel-1 and Sentinel-2 Data for Soil Moisture Mapping at Plot Scale. Remote Sens. 2018, 10, 1285. [Google Scholar] [CrossRef] [Green Version]
  24. Ulaby, F.T.; Long, D.G. Microwave Radar and Radiometric Remote Sensing; University Michigan Press: Ann Arbor, MI, USA, 2014; p. 252. ISBN 978-0-472-11935-6. [Google Scholar]
  25. Mironov, V.; Savin, I. A temperature-dependent multi-relaxation spectroscopic dielectric model for thawed and frozen organic soil at 0.05–15 GHz. Phys. Chem. Earth 2015, 83–84, 57–64. [Google Scholar] [CrossRef]
  26. Zheng, X.M.; Ding, Y.L.; Zhao, X.W.; Bai, Y.; Li, X.F.; Zhao, K.; Jiang, T. Uncertainty evaluation at three spatial scales for the NDVI-based VWC estimation method used in the SMAP algorithm. Remote Sens. Lett. 2019, 10, 563–572. [Google Scholar] [CrossRef]
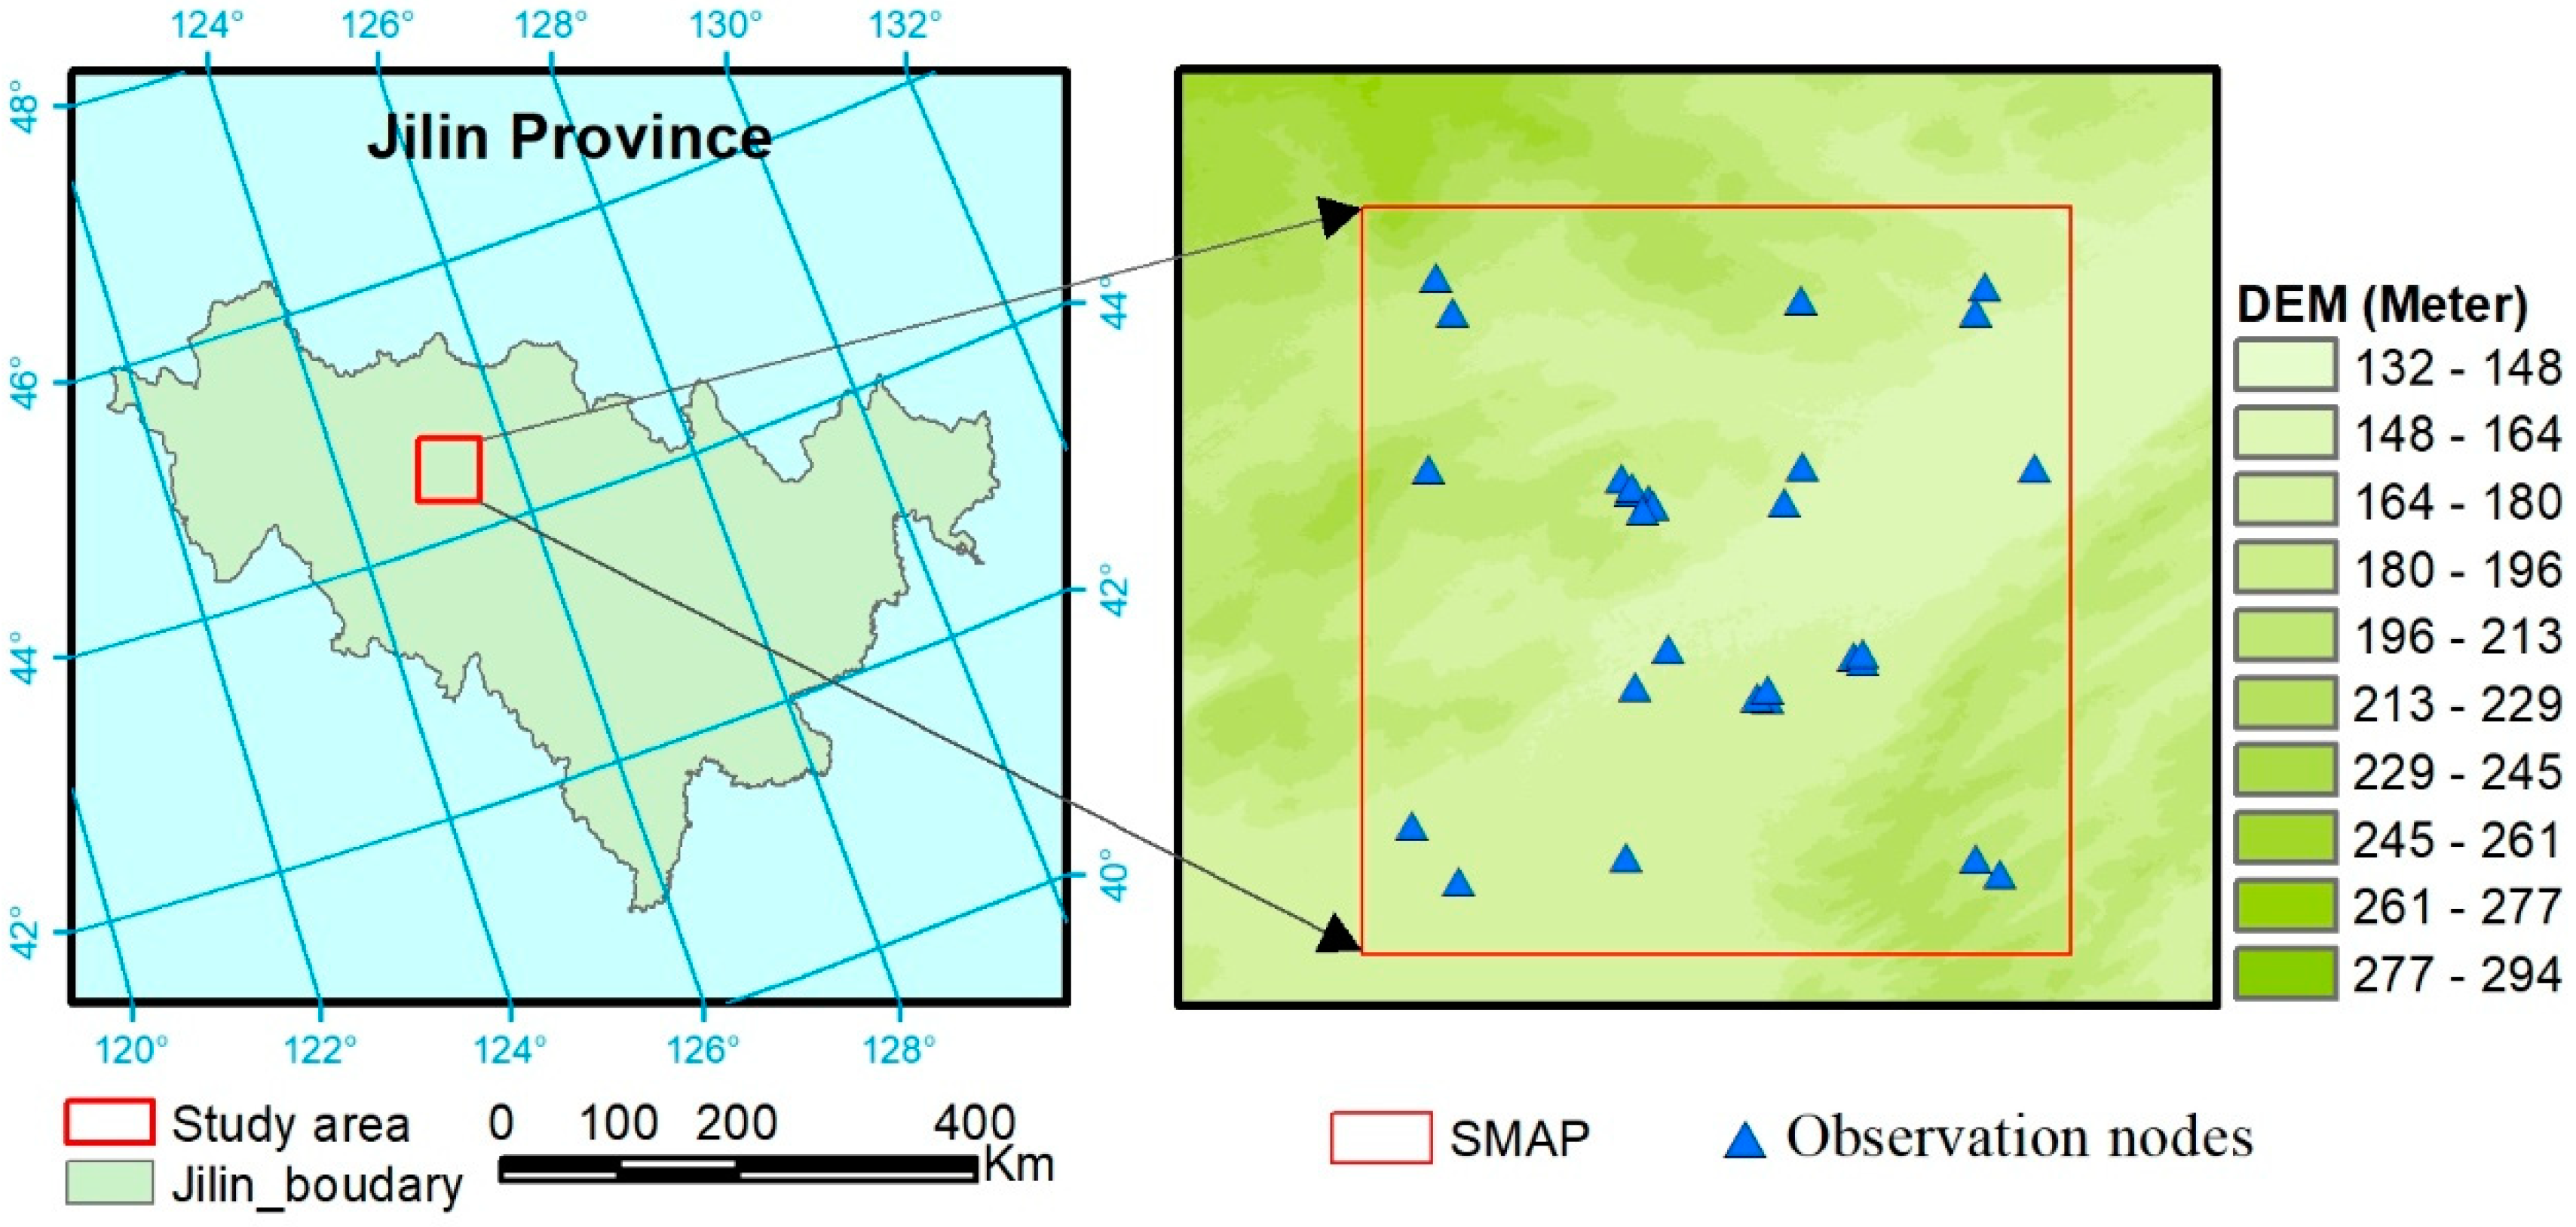
Figure 1. Location of the study area and field soil moisture observation nodes.
Remotesensing 12 01303 g001
Figure 2. The relationship between the relative change of SSM (RC_SSM) and surface reflectivity (RC_e) for horizontal (a) and vertical (b) polarization for various surface roughness conditions (cl = 10 cm, s = 0.5 cm, 1 cm, 2 cm and 3 cm).
Remotesensing 12 01303 g002
Figure 3. Minimum surface emissivity for vertical (a), horizontal (b) and combined vertical and horizontal (c) polarization at different VWC levels based on the ascending SMAP dataset. The color of ‘+’ indicates the change in SSM. The pink circles represent eMIN calculated for each VWC interval. The black solid line is the fitted linear relationship between eMIN and VWC.
Remotesensing 12 01303 g003
Figure 4. Minimum surface emissivity for vertical (a), horizontal (b) and combined vertical and horizontal (c) polarization at different VWC levels based on the descending SMAP dataset. The color of ‘+’ indicates the change in SSM. The pink circles represent eMIN calculated for each VWC interval. The black solid line is the fitted linear relationship between eMIN and VWC.
Remotesensing 12 01303 g004
Figure 5. Difference between maximum and minimum of surface emissivity for vertical (a), horizontal (b) and combined vertical and horizontal (c) polarization at different VWC levels based on the ascending SMAP dataset. The color of ‘+’ indicates the change of SSM. The pink circles represent eMAX − eMIN calculated by each VWC interval. The black solid line is the fitted linear relationship between eMAX − eMIN and VWC.
Remotesensing 12 01303 g005
Figure 6. Difference between maximum and minimum of surface emissivity for vertical (a), horizontal (b) and combined vertical and horizontal (c) polarization at different VWC levels based on the descending SMAP dataset. The color of ‘+’ indicates the change of SSM. The pink circles represent eMAX − eMIN calculated by each VWC interval. The black solid line is the fitted linear relationship between eMAX − eMIN and VWC.
Remotesensing 12 01303 g006
Figure 7. Comparison of SSM retrieved from the change detection algorithm (SSMDCA) developed in this study and SMAP L3 SSM for V (a), H (b) and 0.5(H + V) (c) polarization for ascending orbit (N = 6631) from 2016–2018. The color of the colorbar indicates the point density of SSMDCA and SMAP L3 SSM.
Remotesensing 12 01303 g007
Figure 8. Comparison of SSM retrieved from the change detection algorithm (SSMDCA) developed in this study and SMAP L3 SSM for V (a), H (b) and 0.5(H+V) (c) polarization for descending orbit (N = 6631) from 2016–2018. The color of the colorbar indicates the point density of SSMDCA and SMAP L3 SSM.
Remotesensing 12 01303 g008
Figure 9. Comparison of in situ SSM values (cm3/cm3) and retrieved SSM values (cm3/cm3) for ascending orbit from 2016–2018. (a) SMAP L3, (b) H pol, (c) V pol, (d) 0.5(H + V). The black line is the 1:1 line and the brown line is the fitted linear equation.
Remotesensing 12 01303 g009
Figure 10. Comparison of in situ SSM values (cm3/cm3) and retrieved SSM values (cm3/cm3) for descending orbit from 2016–2018. (a) SMAP L3, (b) H pol, (c) V pol, (d) 0.5(H + V). The black line is the 1:1 line and the brown line is the fitted linear equation.
Remotesensing 12 01303 g010
Figure 11. Change in average monthly bias, RMSE and ubRMSE of estimated SSM for four algorithms with time, based on the SMAP ascending brightness temperature from 2016–2018.
Remotesensing 12 01303 g011
Figure 12. (a) Monthly bias, (b) RMSE and (c) ubRMSE of estimated SSM from the 2016-2018 SMAP descending brightness temperature based on the four algorithms (SMAP baseline, DCA-H, DCA-V and DCA-HV)
Remotesensing 12 01303 g012
Figure 13. Dependence of SSM bias on inversion model input parameters from 2016–2018. The above three figures show results for ascending orbit and the bottom three figures show results for descending orbit. The cross symbol “+” indicates that daily rainfall exceeded 10 mm and the color of the data point indicates the density.
Remotesensing 12 01303 g013
Table 1. Fitted linear relationships between VWC and eMIN (eMAXeMIN), and corresponding fitted parameters (R2, RMSE—root mean squared error) derived from SMAP ascending and descending L3 SSM datasets for an agricultural area in northeast China from 2016–2018.
OrbitPol.eMINeMAX-eMIN
SlopeInterceptR2RMSESlopeInterceptR2RMSE
Aev0.037840.70620.870.019−0.033160.25010.860.015
eh0.04780.56650.790.029−0.040480.33630.970.008
0.5(eh + ev)0.042650.63720.840.021−0.038940.29250.970.007
Dev0.045240.68420.970.008−0.038540.26370.960.009
eh0.055090.54540.880.024−0.047460.35140.990.005
0.5(eh + ev)0.048420.62080.940.014−0.043590.30540.990.004
Table 2. The fitted coefficient and statistical error of SMAP L3 SSM and estimated SSM from SMAP L3 dataset based on the change detection algorithm developed here.
OrbitPolarizationabR2RMSE
Aev1.102−0.026660.960.016
eh1.071−0.020790.890.031
0.5(eh + ev)1.089−0.028420.930.023
Dev1.116−0.042170.970.015
eh1.074−0.035910.920.027
0.5(eh + ev)1.088−0.036620.960.019