Article

Upscaling UAS Paradigm to UltraLight Aircrafts: A Low-Cost Multi-Sensors System for Large Scale Aerial Photogrammetry

Unit of Forest and Nature Management, Gembloux Agro-Bio Tech, University of Liège, 5030 Gembloux, Belgium
*
Author to whom correspondence should be addressed.
Remote Sens. 2020, 12(8), 1265; https://doi.org/10.3390/rs12081265
Submission received: 10 January 2020 / Revised: 13 April 2020 / Accepted: 14 April 2020 / Published: 16 April 2020

Abstract

:
The use of unmanned aerial systems (UASs) has rapidly grown in many civil applications since the early 2010s. Nowadays, a large variety of reliable low-cost UAS sensors and controllers are available. However, contrary to ultralight aircrafts (ULAs), UASs have a too small operational range to efficiently cover large areas. Flight regulations prevailing in many countries further reduced this operational range; in particular, the “within visual line of sight” rule. This study presents a new system for image acquisition and high-quality photogrammetry of large scale areas (>10 km²). It was developed by upscaling the UAS paradigm, i.e., low-cost sensors and controllers, little (or no) on-board active stabilization, and adequate structure from motion photogrammetry, to an ULA platform. Because the system is low-cost (good quality-price ratio of UAS technologies), multi-sensors (large variety of available UAS sensors) and versatile (high ULA operational flexibility and more lenient regulation than for other platforms), the possible applications are numerous in miscellaneous research domains. The system was described in detail and illustrated from the flight and images acquisition to the photogrammetric routine. The system was successfully used to acquire high resolution and high quality RGB and multispectral images, and produced precisely georeferenced digital elevation model (DEM) and orthophotomosaics for a forested area of 1200 ha. The system can potentially carry any type of sensors. The system compatibility with any sensor can be tested, in terms of image quality and flight plan, with the proposed method. This study also highlighted a major technical limitation of the low-cost thermal infrared cameras: the too high integration time with respect to the flight speed of most UASs and ULAs. By providing the complete information required for reproducing the system, the authors seek to encourage its implementation in different geographical locations and scientific contexts, as well as, its combination with other sensors, in particular, laser imaging detection and ranging (LiDAR) and hyperspectral.

1. Introduction

Aerial survey (the collection of information conducted from airborne vehicles) and aerial photogrammetry (the process of making measurements and maps through the use of aerial photographs) were primarily developed and used by the military. Later, several applications were developed in diverse civil domains, such as archaeology [1], environment [2], urban planning [3] or mineral exploration and mining [4], using a broad range of aerial vehicles, generally being classified according to their maximum take-off weight (MTOW).
With a MTOW of 5.670 kg [5], light aircrafts are the most used manned vehicle for aerial photogrammetry [1,6,7,8,9,10,11]. Due to their technical characteristics, especially high autonomy and payload, heavy high-resolution cameras with a stabilization mechanism and a powerful processor [10] can be embarked. To a lesser extent, manned helicopters can also be used for aerial photogrammetry [10,12,13,14]. Their much higher manoeuvrability is a real advantage, useful for vertical inspection [15] or complex deployment [16,17]. In addition, helicopters can perform low flight at very low ground speed [17]. However, their use is very expensive and their flight autonomy is limited.
Worldwide, the legal framework related to aircrafts and helicopters is generally very strict from pilot training to platform maintenance. Technical certifications are relevant to any part becoming constitutive of the aircraft from the design to even sit’s rivet. Certification is also mandatory for image acquisition systems (sensors, pod, antenna, etc.) hampering the use of external payloads. This restrictive regulation partly explains the important cost in the use and maintenance, and has enabled the emergence of manned ultralight aircrafts (ULAs were also named microlight aircrafts) due to a much more flexible regulation [18,19]. ULA are nationally regulated but with a common definition: two-seater aircraft with a MTOW of 450 kg and stall speed of maximum 65km/h. In comparison to light aircrafts, ULAs have a higher maneuverability and can fly at a lower speed and altitude. ULAs consume car engine gasoline (MOGAS), which is much less expensive than light aircraft fuel (AVGAS 100LL) [19]. Furthermore, ULAs can take off and land outside conventional aerodromes (equipped with proper take-off runways). The use of ULAs is thus frequent in remote areas where conventional aerodromes are rare and aircraft fuel is difficult to procure.
Nowadays, unmanned aircraft systems (UASs), also named unmanned aircraft vehicles (UAVs), have become widely used for aerial photography and photogrammetry [20]. Gupta S. et al. (2013) [21] proposed a classification of UASs (Table 1) according to their weight, operational capabilities and flight radius. The ‘Mini’ category is the most used for civil applications. Furthermore, because of their higher flight radius, fixed-wing UASs can cover a larger area than rotary-wing UASs [21,22,23,24,25,26,27].
The undeniable UAS attraction led to the development of open-source or low-cost, user-friendly and miniaturized flight controllers, such as Pixhawk [28] or NAVIO2 [29]. In addition to flight operation, electronic parts with processing capabilities [25,26,30] allow one to control various devices such as servo-motors, and passive and active sensors [31]. Passive sensors (i.e., cameras) record radiation reflected from the earth’s surface, while active sensors require the energy source to come from within the sensor (e.g., radar). Nowadays, a large panel of cameras are available for UASs: multispectral [27], hyperspectral [27,32] and thermal [27]. More recently, active sensors with LiDAR (Laser imaging Detection And Ranging) technology are also increasingly used by the UAS community [33,34].
The use of UASs for aerial photogrammetry is possible thanks to the structure from motion (SfM) technique [35,36,37,38]. SfM solves the camera pose and scene geometry simultaneously and automatically by the use of computer vision algorithms, such as the scale-invariant feature transform (SIFT). It allows for the building of accurate 3D mapping products (e.g., orthophotomosaic and digital elevation model), using highly overlapping images from consumer-grade digital cameras [39]. The development of processing chains based on SfM allowed deriving highly redundant but rather low quality UAS images onto accurate 3D mapping products [40]. Furthermore, SfM does not require stabilized sensors. To the contrary, the multi-view angles resulting from low-frequency movements increase the robustness of 3D reconstruction [41]. Rotary-wing UASs are frequently equipped with 3-axis gimbal, but most fixed-wing UASs are not equipped with a stabilization mechanism, except anti-vibration rubbers or damping balls.
Although very promising, UAS photogrammetry paradigm is scale limited by rather low power capacity, payload and autonomy, as well as security and regulation issues. In many countries, UAS flights must be operated within the visual line of sight and following restrictive scenarios in terms of MTOW and flight altitude. Matese et al. (2015) [8] compared the costs of images acquisition and processing of UASs, light aircrafts, and satellites. UASs are the most cost-effective solution for areas of at most 20 ha. Although this extent can be considered as satisfying for precision agriculture, it is not the case for many other environmental applications.
In this context, upscaling UAS photogrammetry paradigm to ULAs is particularly interesting in order to cover a much larger area at a rather low cost. ULA regulation is less strict, allowing various payloads without technical certification and easier access to restrictive airspaces. Furthermore, UAS sensors and control devices can easily be installed on ULAs (without any technical certification).
Nowadays, available sensors were mostly developed either for light aircrafts or UASs, and thus not specifically for ULAs. In the scientific literature, ULAs are frequently used for the aerial survey of broad scopes, ranging from coyote control [42] to aerosol profiling [43,44]. However, contrary to UASs, most of these studies are not focused on aerial photography and even less on photogrammetry. Aerial surveys are often operated visually by human eyes. When images are acquired, off-the-shelf RGB cameras are generally used [45]. At our knowledge, only one author (Mozgeris, G. et al. [46,47,48]) used a specific ULA system for aerial photogrammetry, commercialized by MosaicMill [49] (50k-100k€).
The aims of this paper are: 1) to describe a new aerial photogrammetry system combining the strengths of a ULA platform (large covered area, versatility and less restrictive regulations) with UAS sensors and controller (good quality-price ratio and diversity of sensors), and 2) to illustrate the use of this system, from the flight and images acquisition to the photogrammetric routine and production of orthophotomosaics, for a forested landscape of 1200 ha in southern Belgium. The system is polyvalent and can potentially carry any type of sensors. A specific method was developed to verify the compatibility of sensors specifications with ULA flight capabilities.

2. Materials and Methods

2.1. System Configuration: Sensors Requirements and Flight Plan

One of the major challenges in remote sensing is the observation of static target from a mobile flying system. In our case, the system is composed of a flying platform, a ULA, and several UAS sensors carried by this platform. Our main goal is thus to configure the whole system for optimizing the photogrammetry process (i.e., the extraction of three-dimensional measurements from aerial images) while fulfilling flight and sensor requirements.
In order to assess if a given camera is compatible with a given flight plan, or inversely, several key parameters must be considered (Table 2). Some of these parameters are associated with the technical properties of cameras and directly affect the image quality. Sensor size ( SSz ), image dimension ( ImD ), focal length ( F L ) and burst rate ( B R ) are constant. B R is the maximum number of frames (images) per second that can be saved safely by the camera. Aperture ( A p t r ) , sensor sensitivity ( I S O ) and integration time ( I n T ) are adjustable depending on the weather conditions during the shooting. I n T is the time taken by the camera diaphragm to open and close (full cycle). I n T m i n is the minimum value of I n T possible by the camera. Another group of parameters is only related to the flight plan: ground speed ( G S p ) and above ground level altitude ( A G A ). The last parameters (Table 2) depend on the combination of camera and flight parameters: image ground spatial resolution ( I m S R ) and image overlap. The overlap corresponds to the proportion of common ground of one image with the other nearest images. The front overlap ( Front L ) is the overlap of successive images in the same flight line. The side overlap ( Side L ) is the overlap of images of neighboring flight lines.
For optimal aerial photogrammetry, camera specifications and flight plan have to respect some rules, in particular, high values for Front L and Side L are required [50]. For the use of UAS sensors without active stabilization and with the purpose of 3D modelling: Front L ≥ 80% and Side L ≥ 60–75% [51]. Furthermore, for a given system configuration, it is necessary to ensure that the values of key parameters are realistic and fully compatible.
The following steps describe how to assess if camera technical specifications ( B R and InT ) are adapted to a predetermined flight plan ( A G A and G S p ), but the method could be done reversely. Important parameters which need to be computed and the following equations were based on [52] and derived from the intercept theorem. The camera is oriented in landscape mode along the flight line.
Firstly, the burst rate required for the given configuration ( B R c o n f i g ) is computed using Equations (1) and (2). If B R c o n f i g < B R , the triggering frequency required by the flight plan can technically be supported by the camera. Data storage should also be adapted in accordance to the flight duration.
B R c o n f i g = G S p G S w H × ( 1 Front L )
G S w H = SSz H × A G A F L
Secondly, the integration time required for the given configuration ( I n T c o n f i g ) is computed using Equation 3 [52]. In this equation, the division by 2 was added as a conservative measure for having more latitude in case of platform unexpected movements (turning, slight turbulence, etc.). If I n T c o n f i g < I n T m i n , blur effect may appear in images [52]. I n T m i n is the minimum integration time possible for the considered camera. Blurred images deeply affect the photogrammetry routine, in particular, tie points detection, and decrease the alignment success and 3D reconstruction accuracy significantly [53].
I n T c o n f i g = G S w H 2 × ImD H × GSp
If B R c o n f i g and I n T c o n f i g values are compatible with the camera specifications, the image ground spatial resolution ( I m S R ) is computed (Equation (4)).
ImSR = G S w H ImD H
In reality, ground speed ( G S p ) varies during the flight, mainly influenced by changing wind speed and direction. If camera triggering is configured using the constant time lap, the distance between successive images ( D B I m ) and the front overlap ( Front L ) may significantly vary. If camera triggering is configured using constant distance, the burst rate ( B R ) or integration time ( I n T m i n ) could be exceeded. The potential variations in G S p and, as well as, in flight altitude ( A G A ) have to therefore be considered.

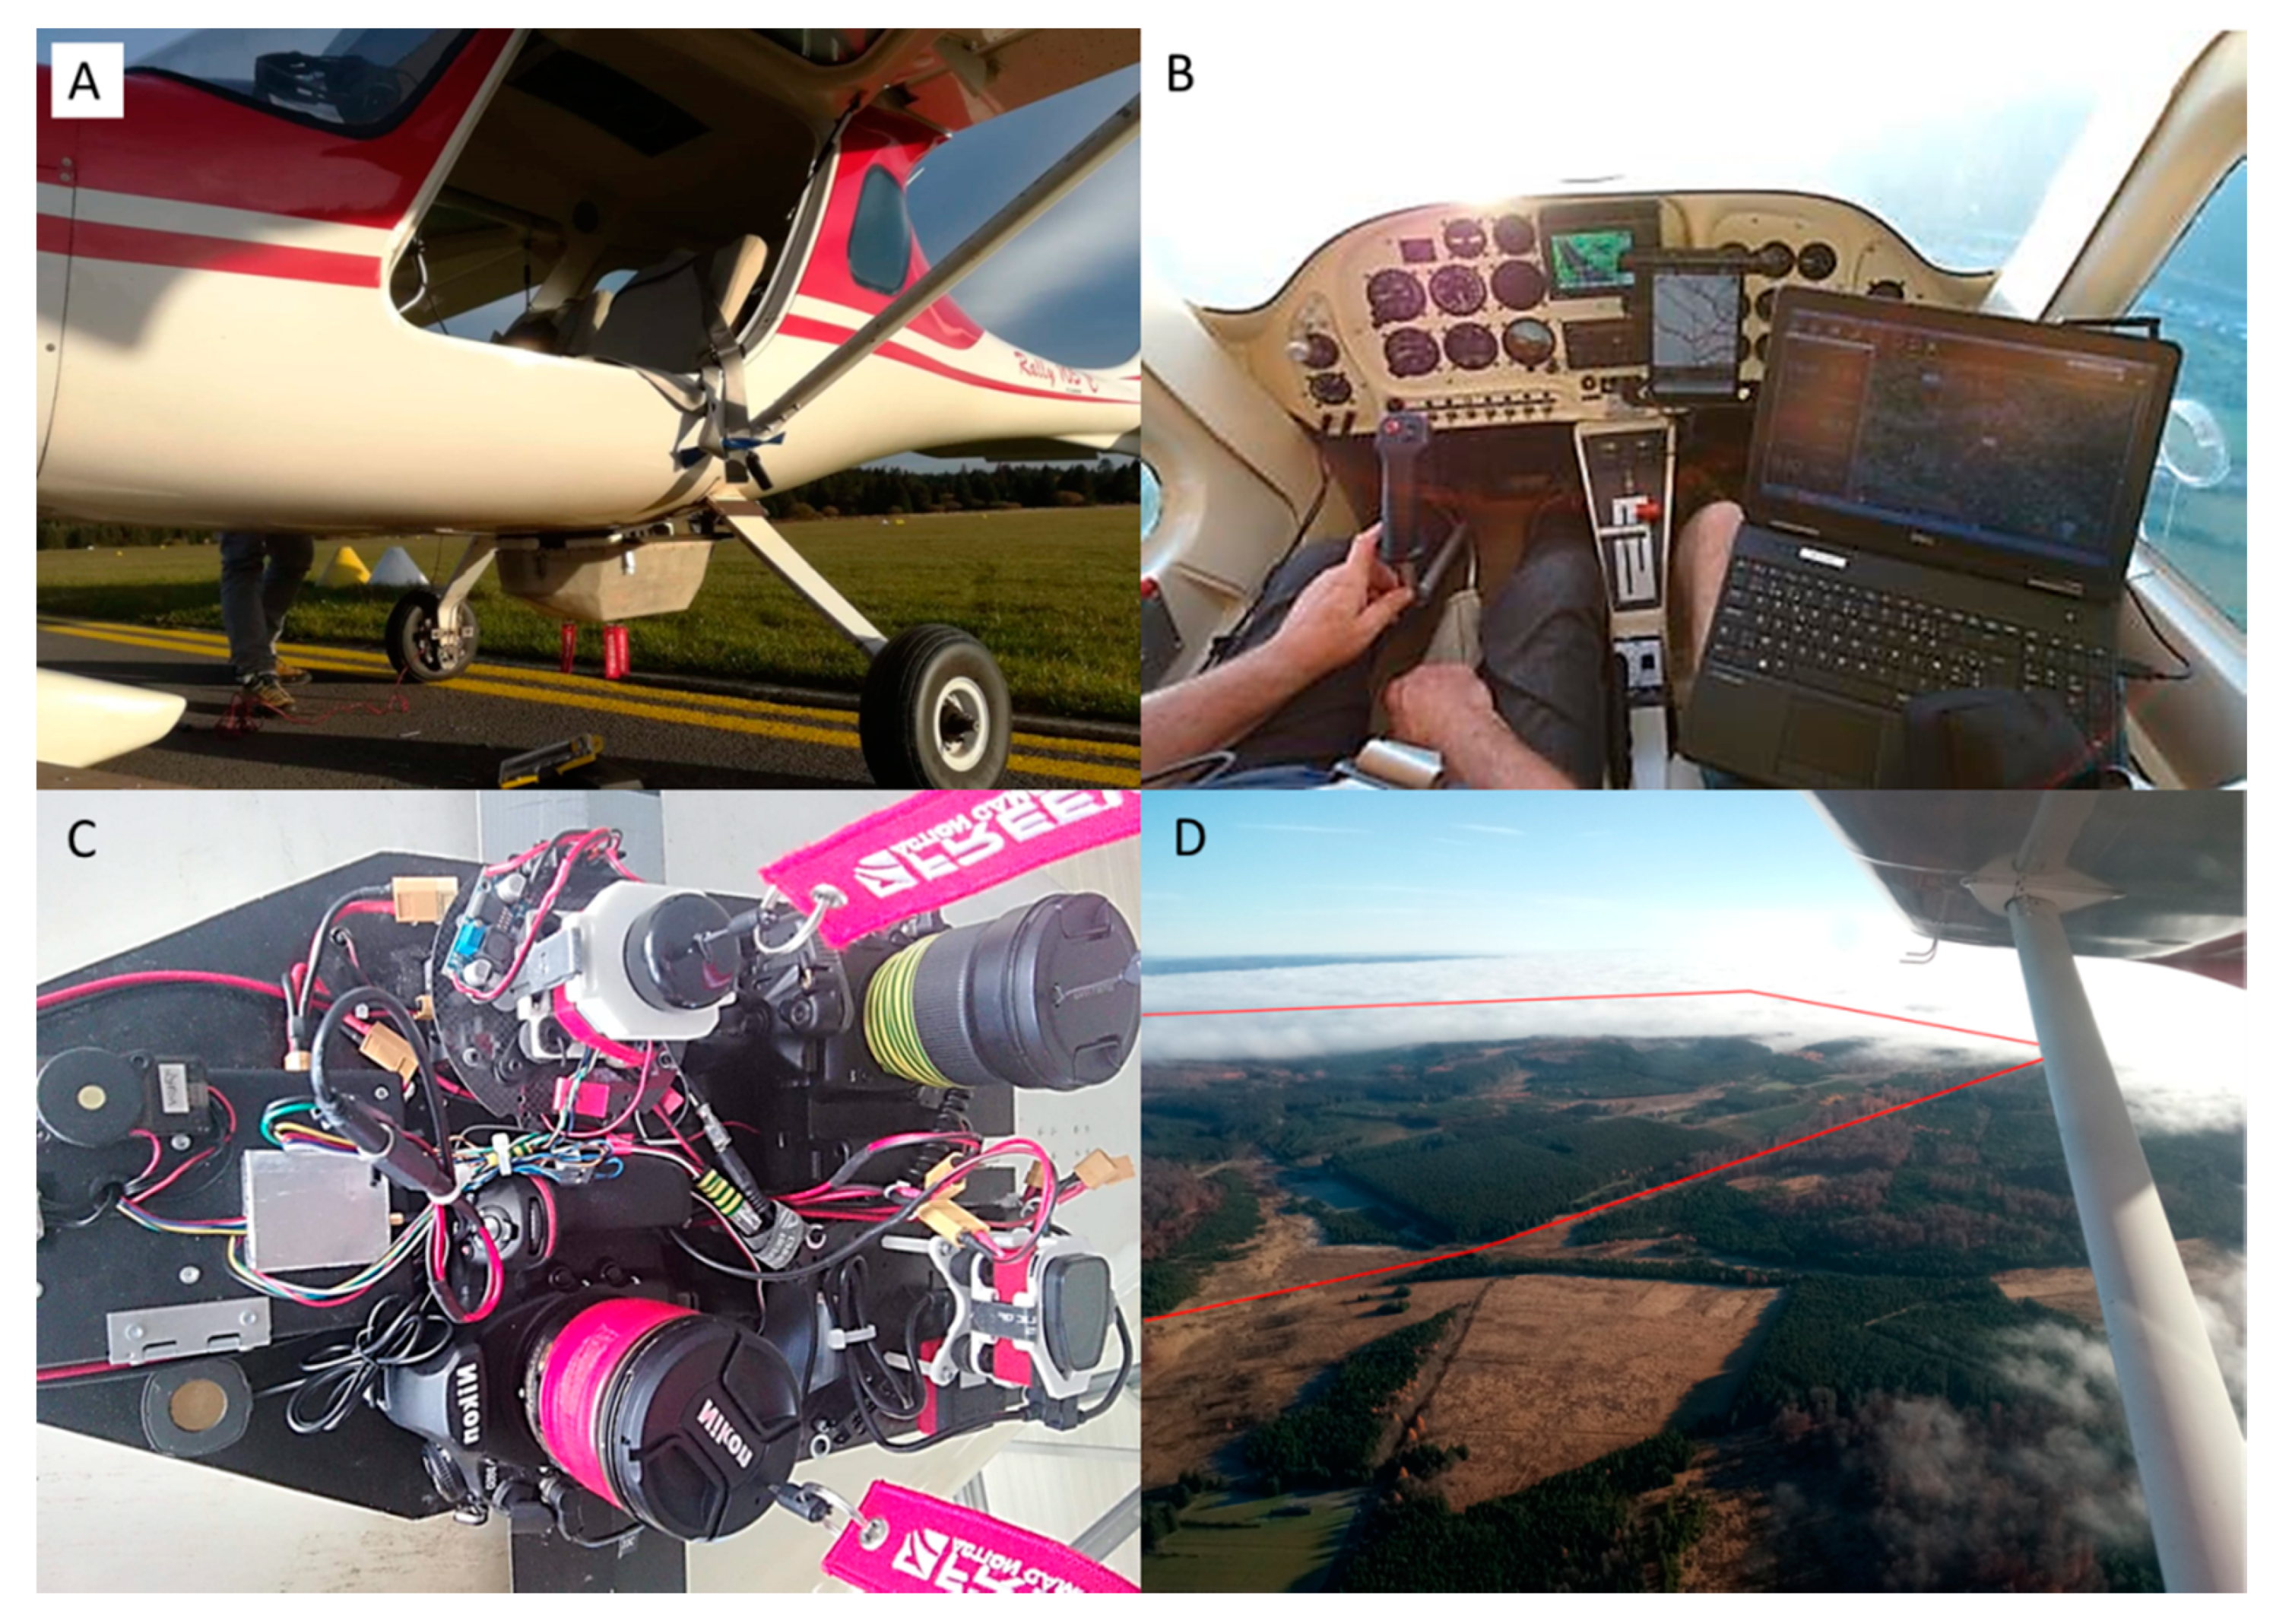
2.2. System Design: ULA Platform, Navigation Station and Sensors Pod

The selected ULA model is the Storm Rally 105 (Table 3) (Figure 1A). With a stalk speed of 65 km/h (without flaps, at MTOW and engine at idling [5]), the pilot can safely perform flight at low speed with enough airspeed margin.
The navigation station is installed in the fully enclosed ULA cockpit (Figure 1B). The navigator, sitting next to the pilot, receives information from the sensor pod on a laptop. If the flight route is not respected, the navigator can warn the pilot. Flight information is received through a radio antenna (433 MHz) of 3DR (https://3dr.com/) and displayed on screen by the ‘Mission planner’ software (v1.3.59) (www.ardupilot.org/planner/). The laptop is powered by its own battery and an external lithium ion battery (6900 mAh 19 V).
The sensors pod (Figure 1C) is self-powering and composed of three units (Figure 2): flight, sensing and power. These units are attached on an aluminum plate and protected by a fiberglass box. The sensors pod was fixed under the fuselage between the gears of the ULA (Figure 1A). A pair of anti-vibration rubbers was set up to limit high frequency vibrations and movements.
The flight unit is composed of the open-hardware Pixhawk flight controller (v1.0) [54] and the open-source autopilot software ARDUPILOT (v3.9.2) [55]. This choice results from our UAS experience and was also based on the study of Zhaolin Y. et al. (2016) [31]. As GNSS (Global Navigation Satellite System), the UBlox GPS and Compass of 3DR were used for real time localization (5Hz update rate). This unit sends information to the navigation station trough another 3DR radio antenna.
The sensing unit is composed of the selected sensors connected to the Pixhawk flight controller. Serial ports of such controllers use PWM (pulse width modulation), which is the common radio command (RC) signal protocol for UASs and cameras. Generally, sensor constructors provide PWM values and their actions (triggering, focus, power switch, etc.) However, as this information is not systematically (or easily) available, the #MAP-X translator of Seagull UAV (https://www.seagulluav.com) was used.
The power unit is composed of a high capacity 6S LiHV battery (10000 mAh, 22.8V), two converters (5 and 9V depending on the devices), and two battery monitors (current and voltage are displayed on the laptop in Mission planer).

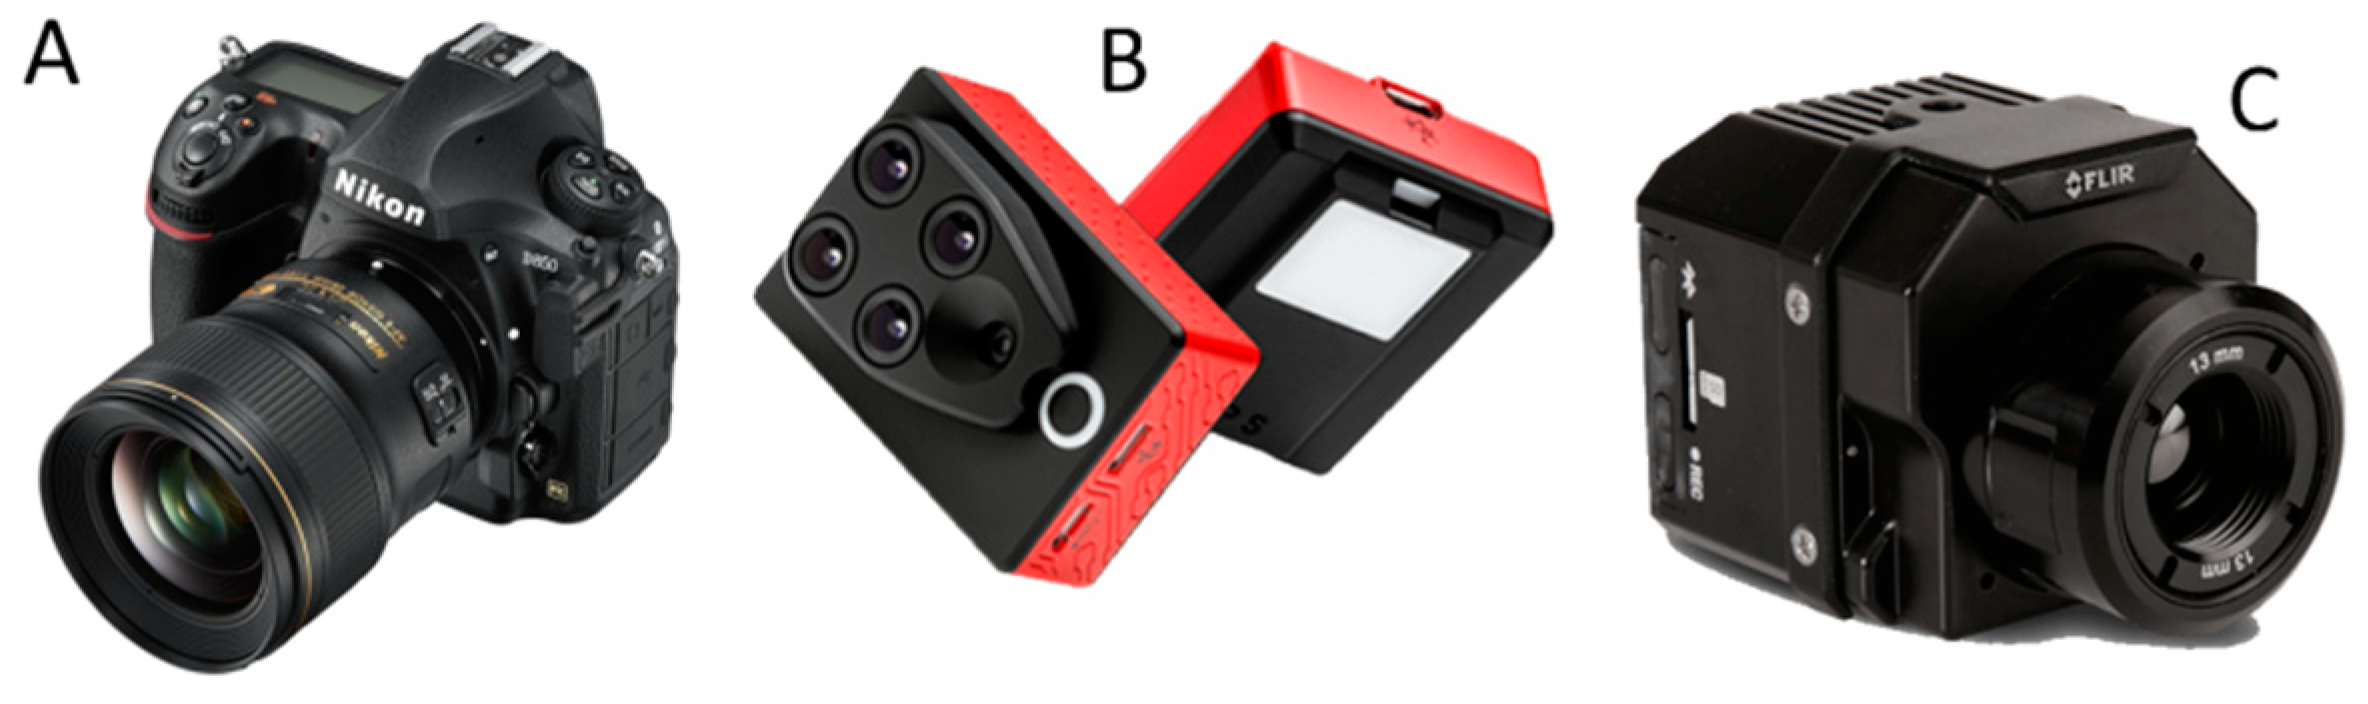
2.3. System Acquisition: Study Area, Selected Sensors and Flight Plan

The photogrammetry system was used to acquire high quality images over a forested area of 1200 ha located in southern Belgium at an (above sea level) altitude, varying from 385 to 588 m (Figure 3) (Figure 1D).
Three cameras, commonly used in UAS aerial survey and photogrammetry [26], were selected (Figure 4) (Table 4): Nikon D850 (visible domain: red, green and blue), Parrot Sequoia (multispectral: green, red, red edge and nir) and Flir vue pro R 640 (thermal infrared). Thermal imagery was acquired with the objective of highlighting hot spots in the study area (thermal contrasts), not measuring temperature. The downwelling light sensor of the Parrot Sequoia was not integrated in the system, owing to a technical limitation: the energy loss, induced by the wire extension from the pod to the ULA top, was too high (too long wire length). However, this issue was related to the Parrot Sequoia. For instance, it would have been possible with the MicaSense RedEdge 3 (personal communication with the technical department of MicaSense).
As previously discussed, the camera integration time ( InT ) can strongly constrain ULA flight altitude ( AGA ) and ground speed ( GSp ). Using equations 2 and 3 with InT config =   InT m i n (Table 4) allow one to illustrate the compatibilities of camera and flight key parameters (Figure 5). For each camera (3 different colors), parameters values are optimal (high quality images with no blur effect) above the corresponding curve. In all cases, InT of the thermal infrared camera is too high for ULA (light grey rectangle) but also for UAS typical operational ranges (black and dark grey rectangles). Being aware of this limitation, the thermal camera was still used in order to assess the loss of image quality and its repercussions on photogrammetry.
The flight was planned considering the principles and photogrammetric recommendations of Pepe et al. (2018) [50], using the mission planner software. The flight plan (Table 5) (vertical black line in Figure 5) aimed primordially at very high spatial resolution ( I m S R ) and sufficient overlaps for optimal photogrammetry. The planning was based on the most restrictive footprint (Flir Vue Pro 640). Minimum values of front overlap ( Front L ) and side overlap ( Side L ) were set to 66% and 50%, respectively. These values were reached only for a limited portion (<5 %) of the covered area (ridge and peak). Flight above mean see level altitude ( A S A ) was set to 762 m, with an above ground altitude ( A G A ) varying from 173 to 377 m. The mean ground speed was set to 140 km/h, to be compatible with the burst rate of the three cameras. The route bearing was set to 146°. These flight parameters limit the number of turns during the flight. The flight distance was estimated to be 191 km divided into 49 lines (Figure 3). The flight duration was estimated to be 3h 27min (1h 49 min for lines and 1h 38 min for turns). At the end of the flight plan, a few supplementary crossing lines were performed at higher altitude to improve the photogrammetric routine, as recommended by previous studies [50,56].

2.4. Photogrammetric Routine

After the acquisition, images were processed in Agisoft PhotoScan Professional (V1.4.3). This software is commonly used in UAS studies [25,57,58]. The processing was done through a network of 2 computers with 64 Gb of RAM, 20 cores at 3.1 GHz and a GTX1080 NVIDIA graphic card. GPU processing was enabled.
Three Photoscan projects were created independently for Nikon D850 (RGB), Parrot Sequoia (multispectral) and Flir vue pro R 640 (thermal infrared). The same photogrammetric process was applied (Figure 6). The sparse cloud (alignment) was produced using the native image resolution (accuracy: high), with standard key and tie point limit number. Sixteen ground control points (GCPs) (Figure 3), precisely located in the field were added. The optimization process was performed to refine the following camera parameters: focal length ( F L ), principal point positions (cx and cy), three radial distortion coefficients (k1, k2 and k3) and two tangential distortion coefficients (p1 and p2). The optimization strategy was set to default (no adaptive camera model fitting), as recommended by [59] to reduce the risk of overfitting. The following steps: dense cloud (aggressive depth filtering and medium accuracy), digital elevation model, and RGB, multispectral and thermal infrared orthophotomosaics were done with default settings (Figure 6). The coarsest spatial resolution (Table 5) was set for the different photogrammetric outputs. These resolutions corresponded to the highest above ground flight altitude.
The network of GCPs was based on existing characteristic objects (pedestrian crossing strip, gutter plate or tree stump) or wooden plates painted (checkerboard pattern). The GCP positions were collected with a RTK GPS Emlid Reach RS (RMSE = 3.78 cm) (http://emlid.com/reach/). The geometrical errors of the three orthophotomosaics were estimated using a repeated k-fold cross-validation approach (k=5, 50 iterations). For each iteration, GCPs were randomly divided into five folds and five optimizations (i.e., bundle block adjustments) were run. For each optimization, four of the five folds were used as a training set and the last fold was used as a test set (error estimation). After 50 iterations, the global error of each orthophotomosaic was then estimated as the mean ± standard deviation of the XYZ errors associated to the 16 GCPs of the test sets. No spectral calibration was performed, as our system did not embark a downwelling light sensor (electrical limitation of the Parrot Sequoia).

3. Results

3.1. Flight and Images Acquisitions

The flight (Figure 7) was performed the 15th November 2018 and lasted 3h 39 (1h 43 for lines and 1h 56 for turns). The flight parameters (Table 5) were respected. However, the route bearing had to be adjusted to 184° (instead of 146°), due to cloud cover on the eastern part of the study site (Figure 1D). The flight route followed 58 lines (instead of 49) for a total of 193 km (instead of 191). After 1h 44 of flight, a break was done to rest the crew, control if the system worked as expected and to change memory sticks. At the end of flight, 6 cross lines were done at higher altitude ( ASA from 680 to 915m) for enhancing photogrammetric reconstruction. The number of images taken by the Nikon D850, Parrot Sequoia and the Flir Vue Pro were 10,343, 43,472 and 14,169, respectively. According to the pilot, the sensors pod did not change the ULA behaviors during take-off, landing and cruise.

3.2. Image Quality

The flight plan was compatible with key camera parameters of Nikon D850 and Parrot Sequoia but not of Flir Vue Pro 640, for which the minimum integration time was too high (Figure 5). Blur effects were thus expected and effectively observed on the thermal images (Figure 8). This effect was not found on RGB and multispectral images. However, some RGB images were slightly overexposed (too bright). With an altitude variation of about 200 m and a ground speed of 140 km/h, the camera could not always correctly process the ISO computation (values between 900 and 6400).

3.3. DEM and Orthophotomosaics

The total processing time of the photogrammetric routine (Figure 6) for the three photogrammetric projects (RGB, multispectral and thermal infrared) was approximately 44 hours. The geometrical accuracies (mean ± standard deviation) were 0.84 ± 0.7 m, 0.86 ± 0.6 m, and 4.9 ± 3.4 m, respectively. The much lower accuracy of the thermal infrared project can be linked to blur effect, as well as to the lower overlaps. The resulting low quality of 3D photogrammetric reconstruction induces an important misalignment (Figure 9).
One digital elevation model (DEM) and three orthophotomosaics, RGB (Nikon D850), multispectral (Parrot Sequoia) and thermal infrared (Flir Vue Pro 640), were produced (Figure 10). The DEM was produced from the RGB project. The spatial resolutions of these 4 layers were 23.3, 5.8, 36.1 and 48.1 cm, respectively.

4. Discussion

This study presented an aerial photogrammetry system combining an ultralight aircraft (ULA) platform with UAS sensors and controller. This system can acquire high-resolution RGB, multispectral and thermal infrared images over a large area with a high operational versatility. The UAS paradigm, i.e. low-cost sensors and controller, little (or no) on-board active stabilization and adequate structure from motion photogrammetry, was successfully upscaled to ULA. Other type of active and passive sensors can be installed in the system pod. A specific method was proposed to verify if the considered sensor is compatible with ULA (or UAS) flight capabilities (Equations 1—3 and Figure 5).
The system was described in detail and illustrated from the flight and images acquisition to the photogrammetric routine. The system was successfully used to acquire high resolution and high quality RGB and multispectral images, and produced precisely georeferenced DEM and orthophotomosaics for a forested area of 1200 ha. The system has much wider operational range, in terms of flight speed and altitude, than UASs (Figure 5). In many countries, the use of UASs can be further reduced by stricter flight regulations.
Although many studies used ULAs, most of them focused on aerial survey or photography. Our system focuses on aerial photogrammetry, thus one step further, with the purpose of building accurate 3D mapping products (orthophotomosaics and DEMs). To our knowledge, only one author (Mozgeris, G. et al. [46,47,48]) used a similar system with a ULA platform, commercialized by MosaicMill [49] for 50-100k€. This price includes the EnsoMOSAIC software suite for processing photogrammetry. As our system is composed of low-cost and open-source UASs devices (one controller and three cameras), the cost of the fully equipped pod is less than 10k€. Agisoft PhotoScan Professional cost about 500€ for one educational license and about 3200 € for one standard license.
Because the system is low-cost (good quality-price ratio of UAS technologies), polyvalent (large variety of available UAS sensors) and versatile (high ULA operational flexibility and more lenient regulation than for other platforms), the possible applications are numerous in miscellaneous research domains, such as environmental studies, mineral exploration and mining, civil infrastructure, archeologically, etc. ULAs are already widely used for aerial survey and monitoring, but most of the time operated by human eyes or using off-the-shelf RGB cameras (e.g., [42,43,44,45] ). The proposed system goes one step further, focusing on high quality imagery and high precision photogrammetry. Besides individual images, the photogrammetric outputs (DEM and orthophotomosaics) and a large diversity of derived maps could significantly improve management of large remote and/or protected areas. In most cases, ULA and pilot are already available. Contrary to light aircrafts, the use of ULAs does not require conventional aerodromes with proper take-off runways. Furthermore, ULAs consume car engine gasoline, which is easy to procure and much less expensive than light aircraft fuel [19].
The radiometric quality provided by the multispectral camera could be improved using a spectral calibration protocol specific to ULA. As for UASs, a picture of a greyed target could be taken before and/or after the flight. However, this protocol is being criticized by many authors [60], because of the shadows generated by the UAS and the operator holding it. At the moment, no other commonly accepted procedure is yet available [51]. Moreover, for minimizing the shadows, it would imply unplugging the multispectral camera from the system. A new UAS method without the need of the greyed target is available [61] and could be implemented for ULAs.
The communication between the laptop (co-pilot) and the pod could be improved through the wireless communication using WiFi or Bluetooth. When properly set up, sensor settings could be modified during the aerial survey, in particular for RGB DSLR sensors with finer tunings of image capture (e.g., exposure and ISO sensitivity) than UAS TIR and multispectral sensors.
The photogrammetric routine could be simplified and the precision of outputs (DEM and orthophotomosaics) could be improved by integrating a precise global navigation satellite system (GNSS). Recently available, low-cost RTK/PPK GNSS solutions (<1000€) could be fully implementable in the system. The required number of GCPs could be strongly reduced. This is a particularly important point, as GCP network set up is time-consuming and complicated at such scale and in remote areas.
Finally, as illustrated in Figure 5, this study highlighted an important issue concerning the acquisition of thermal infrared imagery with ULAs (light grey rectangle) and fixed-wing UAS (dark grey rectangle), but also, to some extent, with rotary-wing UASs (black rectangle). Values of integration time ( InT min ) of the Flir Vue Pro 640 (Table 4) is too high for many flight plan configurations, expressed in terms of flight altitude and speed. Flight plans below the red curve may result in blurred images. The Optris PI450 8mm, another thermal infrared camera regularly used in UAS environmental studies [38], would probably also be inclined to blur the effect. The use of low-cost thermal infrared sensors, mainly developed for rotary-wing UASs, onto higher speed platforms is thus limited. While the lower consideration for the integration time in UAS studies was already reported [51,62], potential users should be particularly cautious when using TIR cameras, because their integration time is much higher than for other cameras (e.g., multispectral or consumer grade RGB). As shown in Figure 9, blur effects in images can strongly impact the quality of photogrammetric reconstructions. Photogrammetry based on thermal imagery is poorly documented, but even with adequate integration time, the geometric accuracy of associated 3D products is known to be lower [54].

5. Conclusions

By upscaling UAS paradigm to ULA, a low-cost, multi-sensors and versatile system was developed for the high quality photogrammetry of large-scale areas. A method to test the compatibility of the system with any sensor, in terms of image quality and flight plan, was proposed. Furthermore, a major technical limitation of the low-cost thermal infrared cameras was highlighted: the too high integration time with respect to flight speed of most UASs and ULAs.
By providing the complete information required for reproducing the system, the authors seek to encourage its implementation in different geographical locations and scientific contexts, as well as its combination with other sensors, in particular, LiDAR and hyperspectral.

Author Contributions

Conceptualization, P.G. and P.L.; Methodology, P.G. and A.M.; Validation, C.B. and N.L.; Writing—Original Draft Preparation, N.L., P.G. and C.B.; Writing—Review and Editing, N.L. and A.M.; Supervision, P.L and A.M. All authors have read and agreed to the published version of the manuscript.

Funding

This research was funded by the Forest Administration of the Walloon Region as part of a five-year forest research and training plan (“Accord-Cadre de Recherche et Vulgarisation Forestières”).

Acknowledgments

The authors thank the Forest Administration of the Walloon Region for providing financial support. The authors express their deep gratitude to Eric Navaux, the ULA pilot who helps in many ways. The authors also warmly thank Cédric Geerts for setting up the network of ground control points, as well as Hadiy Lahcen (Hassan) and Samuel Quevauvillers for their support in building the system.

Conflicts of Interest

The authors declare no conflict of interest

References

  1. Gerster, G. The Past from Above: Aerial Photographs of Archaeological Sites; Getty Publications: Los Angeles, CA, USA, 2005; ISBN 0-89236-875-6. [Google Scholar]
  2. Holdridge, L.R.; Grenke, W.C. Forest environments in tropical life zones: A pilot study. In Forest Environments in Tropical Life Zones: A Pilot Study; Pergamon Press: Oxford, UK, 1971. [Google Scholar]
  3. Fairchild Aerial Camera Corporation. Aerial Survey; Fairchild Aerial Camera Corporation: New York City, NY, USA, 1921. [Google Scholar]
  4. Sayab, M.; Aerden, D.; Paananen, M.; Saarela, P. Virtual Structural Analysis of Jokisivu Open Pit Using ‘Structure-from-Motion’ Unmanned Aerial Vehicles (UAV) Photogrammetry: Implications for Structurally-Controlled Gold Deposits in Southwest Finland. Remote Sens. 2018, 10, 1296. [Google Scholar] [CrossRef] [Green Version]
  5. Gunston, B.; Gunston, B. The Cambridge Aerospace Dictionary; Cambridge University Press: Cambridge, UK, 2009; ISBN 0-521-19165-3. [Google Scholar]
  6. Lillesand, T.; Kiefer, R.W.; Chipman, J. Remote Sensing and Image Interpretation; John Wiley & Sons: New York, NY, USA, 2014; ISBN 1-118-34328-X. [Google Scholar]
  7. Hueni, A.; Damm, A.; Kneubuehler, M.; Schlapfer, D.; Schaepman, M.E. Field and Airborne Spectroscopy Cross Validation—Some Considerations. IEEE J. Sel. Top. Appl. Earth Obs. Remote Sens. 2017, 10, 1117–1135. [Google Scholar] [CrossRef]
  8. Matese, A.; Toscano, P.; Di Gennaro, S.; Genesio, L.; Vaccari, F.; Primicerio, J.; Belli, C.; Zaldei, A.; Bianconi, R.; Gioli, B. Intercomparison of UAV, Aircraft and Satellite Remote Sensing Platforms for Precision Viticulture. Remote Sens. 2015, 7, 2971–2990. [Google Scholar] [CrossRef] [Green Version]
  9. Newhall, B. Airborne Camera: The World from the Air and Outer Space; Hasting House: New York, NY, USA, 1969. [Google Scholar]
  10. Morgan, D.; Falkner, E. Aerial Mapping: Methods and Applications; CRC Press: Boca Raton, FL, USA, 2001; ISBN 1-4200-3244-5. [Google Scholar]
  11. Asner, G.P.; Knapp, D.E.; Boardman, J.; Green, R.O.; Kennedy-Bowdoin, T.; Eastwood, M.; Martin, R.E.; Anderson, C.; Field, C.B. Carnegie Airborne Observatory-2: Increasing science data dimensionality via high-fidelity multi-sensor fusion. Remote Sens. Environ. 2012, 124, 454–465. [Google Scholar] [CrossRef]
  12. Sørensen, K.I.; Auken, E. SkyTEM—A new high-resolution helicopter transient electromagnetic system. Explor. Geophys. 2004, 35, 194–202. [Google Scholar] [CrossRef]
  13. Torgersen, C.E.; Faux, R.N.; McIntosh, B.A.; Poage, N.J.; Norton, D.J. Airborne thermal remote sensing for water temperature assessment in rivers and streams. Remote Sens. Environ. 2001, 76, 386–398. [Google Scholar] [CrossRef]
  14. Siemon, B.; Christiansen, A.V.; Auken, E. A review of helicopter-borne electromagnetic methods for groundwater exploration. Near Surf. Geophys. 2009, 7, 629–646. [Google Scholar] [CrossRef] [Green Version]
  15. Zhang, L.; Jiang, H.; Meng, L. Research of the observation suspended bin for helicopter power line inspection. In Proceedings of the 2009 International Conference on Mechatronics and Automation, Changchun, China, 9–12 August 2009; IEEE: Changchun, China, 2009; pp. 1689–1694. [Google Scholar]
  16. Skaloud, J.; Vallet, J. High Accuracy Handheld Mapping System for Fast Helicopter Deployment. In Proceedings of the Joint International Symposium on Geospatial Theory, Processing and Applications, ISPRS IV, Ottawa, ON, Canada, 9–12 July 2002. [Google Scholar]
  17. Desmond, G. Measuring and mapping the topography of the Florida Everglades for ecosystem restoration. US Geol. Surv. Fact Sheet 021-03. 2003. [Google Scholar]
  18. General Aviation Manufacturers Association (GAMA). Annual Report; GAMA: Washington, DC, USA, 2018; p. 62. [Google Scholar]
  19. European Commission. DG Mobility and Transport; Statistical Data, Data Analysis and Recommendation on Collection of Data in the Field of General Aviation in Europe, Final Report; European Commission: Brussels, Belgium, 2015. [Google Scholar]
  20. Manfreda, S.; McCabe, F.M.; Miller, E.P.; Lucas, R.; Pajuelo Madrigal, V.; Mallinis, G.; Ben Dor, E.; Helman, D.; Estes, L.; Ciraolo, G.; et al. On the Use of Unmanned Aerial Systems for Environmental Monitoring. Remote Sens. 2018, 10, 641. [Google Scholar] [CrossRef] [Green Version]
  21. Gupta, S.G.; Ghonge, M.M.; Jawandhiya, P.M. Review of unmanned aircraft system (UAS). Int. J. Adv. Res. Comput. Eng. Technol. 2013, 2, 1646–1658. [Google Scholar] [CrossRef]
  22. Boon, M.A.; Drijfhout, A.P.; Tesfamichael, S. Comparison of a fixed-wing and multi-rotor uav for environmental mapping applications: a case study. ISPRS Int. Arch. Photogramm. Remote Sens. Spat. Inf. Sci. 2017, XLII-2/W6, 47–54. [Google Scholar] [CrossRef] [Green Version]
  23. Tahar, K.N.; Ahmad, A. An Evaluation on Fixed Wing and Multi-Rotor UAV Images Using Photogrammetric Image Processing. Int. J. Comput. Inf. Eng. 2013, 7, 5. [Google Scholar]
  24. Nex, F.; Remondino, F. UAV for 3D mapping applications: A review. Appl. Geomat. 2014, 6, 1–15. [Google Scholar] [CrossRef]
  25. Linchant, J.; Lisein, J.; Semeki, J.; Lejeune, P.; Vermeulen, C. Are unmanned aircraft systems (UAS s) the future of wildlife monitoring? A review of accomplishments and challenges. Mammal Rev. 2015, 45, 239–252. [Google Scholar] [CrossRef]
  26. Pádua, L.; Vanko, J.; Hruška, J.; Adão, T.; Sousa, J.J.; Peres, E.; Morais, R. UAS, sensors, and data processing in agroforestry: A review towards practical applications. Int. J. Remote Sens. 2017, 38, 2349–2391. [Google Scholar] [CrossRef]
  27. Colomina, I.; Molina, P. Unmanned aerial systems for photogrammetry and remote sensing: A review. ISPRS J. Photogramm. Remote Sens. 2014, 92, 79–97. [Google Scholar] [CrossRef] [Green Version]
  28. PixhawkAdmin Home Page. Available online: https://pixhawk.org/ (accessed on 23 January 2019).
  29. Emlid Navio2—Raspberry Pi autopilot HAT Powered by ArduPilot & ROS. Available online: https://emlid.com/navio/.
  30. Tristan, R.H.; Nicholas, C.; Peter, L. Unmanned aerial systems for precision forest inventory purposes: A review and case study. For. Chron. 2017, 93, 71–81. [Google Scholar]
  31. Zhaolin, Y.; Feng, L.; Chen, B.M. Survey of autopilot for multi-rotor unmanned aerial vehicles. In Proceedings of the IECON 2016—42nd Annual Conference of the IEEE Industrial Electronics Society, Florence, Italy, 24–27 October 2016; IEEE: Florence, Italy, 2016; pp. 6122–6127. [Google Scholar]
  32. Adão, T.; Hruška, J.; Pádua, L.; Bessa, J.; Peres, E.; Morais, R.; Sousa, J. Hyperspectral Imaging: A Review on UAV-Based Sensors, Data Processing and Applications for Agriculture and Forestry. Remote Sens. 2017, 9, 1110. [Google Scholar] [CrossRef] [Green Version]
  33. Su, Y.; Guo, Q.; Fry, D.L.; Collins, B.M.; Kelly, M.; Flanagan, J.P.; Battles, J.J. A Vegetation Mapping Strategy for Conifer Forests by Combining Airborne LiDAR Data and Aerial Imagery. Can. J. Remote Sens. 2016, 42, 1–15. [Google Scholar] [CrossRef] [Green Version]
  34. Yan, W.Y.; Shaker, A.; El-Ashmawy, N. Urban land cover classification using airborne LiDAR data: A review. Remote Sens. Environ. 2015, 158, 295–310. [Google Scholar] [CrossRef]
  35. Westoby, M.J.; Brasington, J.; Glasser, N.F.; Hambrey, M.J.; Reynolds, J.M. ‘Structure-from-Motion’ photogrammetry: A low-cost, effective tool for geoscience applications. Geomorphology 2012, 179, 300–314. [Google Scholar] [CrossRef] [Green Version]
  36. Lowe, D.G. Distinctive Image Features from Scale-Invariant Keypoints. Int. J. Comput. Vis. 2004, 60, 91–110. [Google Scholar] [CrossRef]
  37. Seitz, S.M.; Curless, B.; Diebel, J.; Scharstein, D.; Szeliski, R. A Comparison and Evaluation of Multi-View Stereo Reconstruction Algorithms. In Proceedings of the 2006 IEEE Computer Society Conference on Computer Vision and Pattern Recognition (CVPR’06), New York, NY, USA, 17–22 June 2006; Volume 1, pp. 519–528. [Google Scholar]
  38. Snavely, N.; Seitz, S.M.; Szeliski, R. Skeletal graphs for efficient structure from motion. In Proceedings of the 2008 IEEE Conference on Computer Vision and Pattern Recognition, Anchorage, AK, USA, 23–28 June 2008; pp. 1–8. [Google Scholar]
  39. Turner, D.; Lucieer, A.; Watson, C. An Automated Technique for Generating Georectified Mosaics from Ultra-High Resolution Unmanned Aerial Vehicle (UAV) Imagery, Based on Structure from Motion (SfM) Point Clouds. Remote Sens. 2012, 4, 1392–1410. [Google Scholar] [CrossRef] [Green Version]
  40. James, M.R.; Robson, S. Mitigating systematic error in topographic models derived from UAV and ground-based image networks. Earth Surf. Process. Landf. 2014, 39, 1413–1420. [Google Scholar] [CrossRef] [Green Version]
  41. Meinen, B.U.; Robinson, D.T. Mapping erosion and deposition in an agricultural landscape: Optimization of UAV image acquisition schemes for SfM-MVS. Remote Sens. Environ. 2020, 239, 111666. [Google Scholar] [CrossRef]
  42. Knight, J.E.; Foster, C.L.; Howard, V.W.; Schickedanz, J.G. A Pilot Test of Ultralight Aircraft for Control of Coyotes. Wildl. Soc. Bull. (1973–2006) 1986, 14, 174–177. [Google Scholar]
  43. Chazette, P.; Totems, J. Mini N2-Raman Lidar Onboard Ultra-Light Aircraft for Aerosol Measurements: Demonstration and Extrapolation. Remote Sens. 2017, 9, 1226. [Google Scholar] [CrossRef] [Green Version]
  44. Junkermann, W. An Ultralight Aircraft as Platform for Research in the Lower Troposphere: System Performance and First Results from Radiation Transfer Studies in Stratiform Aerosol Layers and Broken Cloud Conditions. J. Atmos. Ocean. Technol. 2001, 18, 934–946. [Google Scholar] [CrossRef]
  45. Lebourgeois, V.; Bégué, A.; Labbé, S.; Houlès, M.; Martiné, J.F. A light-weight multi-spectral aerial imaging system for nitrogen crop monitoring. Precis. Agric. 2012, 13, 525–541. [Google Scholar] [CrossRef]
  46. Mozgeris, G.; Gadal, S.; Jonikavičius, D.; Straigytė, L.; Ouerghemmi, W.; Juodkienė, V. Hyperspectral and color-infrared imaging from ultralight aircraft: Potential to recognize tree species in urban environments. In Proceedings of the 2016 8th Workshop on Hyperspectral Image and Signal Processing: Evolution in Remote Sensing (WHISPERS), Los Angeles, CA, USA, 21–24 August 2016; pp. 1–5. [Google Scholar]
  47. Mozgeris, G.; Juodkienė, V.; Jonikavičius, D.; Straigytė, L.; Gadal, S.; Ouerghemmi, W. Ultra-Light Aircraft-Based Hyperspectral and Colour-Infrared Imaging to Identify Deciduous Tree Species in an Urban Environment. Remote Sens. 2018, 10, 1668. [Google Scholar] [CrossRef] [Green Version]
  48. Mozgeris, G.; Jonikavičius, D.; Jovarauskas, D.; Zinkevičius, R.; Petkevičius, S.; Steponavičius, D. Imaging from manned ultra-light and unmanned aerial vehicles for estimating properties of spring wheat. Precis. Agric. 2018, 19, 876–894. [Google Scholar] [CrossRef]
  49. EnsoMOSAIC Aerial Mapping System—Overview. Available online: http://www.mosaicmill.com/cessna_system/em_system.html (accessed on 27 February 2019).
  50. Pepe, M.; Fregonese, L.; Scaioni, M. Planning airborne photogrammetry and remote-sensing missions with modern platforms and sensors. Eur. J. Remote Sens. 2018, 51, 412–435. [Google Scholar] [CrossRef]
  51. Tmušić, G.; Manfreda, S.; Aasen, H.; James, R.M.; Gonçalves, G.; Ben-Dor, E.; Brook, A.; Polinova, M.; Arranz, J.J.; Mészáros, J.; et al. Current Practices in UAS-based Environmental Monitoring. Remote Sens. 2020, 12, 1001. [Google Scholar] [CrossRef] [Green Version]
  52. O’Connor, J.; Smith, M.J.; James, M.R. Cameras and settings for aerial surveys in the geosciences: Optimising image data. Prog. Phys. Geogr. Earth Environ. 2017, 41, 325–344. [Google Scholar] [CrossRef] [Green Version]
  53. Sieberth, T.; Wackrow, R.; Chandler, J.H. UAV image blur—its influence and ways to correct it. ISPRS Int. Arch. Photogramm. Remote Sens. Spat. Inf. Sci. 2015, 40, 33–39. [Google Scholar] [CrossRef] [Green Version]
  54. mRo Pixhawk PX4 User Guide. Available online: https://docs.px4.io/en/flight_controller/mro_pixhawk.html (accessed on 28 January 2019).
  55. ArduPilot Open Source Autopilot. Available online: http://ardupilot.org/ (accessed on 28 January 2019).
  56. Gerke, M.; Przybilla, H.-J. Accuracy Analysis of Photogrammetric UAV Image Blocks: Influence of Onboard RTK-GNSS and Cross Flight Patterns. Photogramm. Fernerkund. Geoinf. 2016, 2016, 17–30. [Google Scholar] [CrossRef] [Green Version]
  57. Dandois, J.P.; Ellis, E.C. Remote sensing of vegetation structure using computer vision. Remote Sens. 2010, 2, 1157–1176. [Google Scholar] [CrossRef] [Green Version]
  58. Barry, P.; Coakley, R. Field accuracy test of RPAS photogrammetry. Int. Arch. Photogramm. Remote Sens. Spat. Inf. Sci. 2013, 27–31. [Google Scholar] [CrossRef] [Green Version]
  59. James, M.R.; Robson, S.; d’Oleire-Oltmanns, S.; Niethammer, U. Optimising UAV topographic surveys processed with structure-from-motion: Ground control quality, quantity and bundle adjustment. Geomorphology 2017, 280, 51–66. [Google Scholar] [CrossRef] [Green Version]
  60. Aasen, H.; Honkavaara, E.; Lucieer, A.; Zarco-Tejada, J.P. Quantitative Remote Sensing at Ultra-High Resolution with UAV Spectroscopy: A Review of Sensor Technology, Measurement Procedures, and Data Correction Workflows. Remote Sens. 2018, 10, 1091. [Google Scholar] [CrossRef] [Green Version]
  61. Schneider-Zapp, K.; Cubero-Castan, M.; Shi, D.; Strecha, C. A new method to determine multi-angular reflectance factor from lightweight multispectral cameras with sky sensor in a target-less workflow applicable to UAV. Remote Sens. Environ. 2019, 229, 60–68. [Google Scholar] [CrossRef] [Green Version]
  62. Roth, L.; Hund, A.; Aasen, H. PhenoFly Planning Tool: Flight planning for high-resolution optical remote sensing with unmanned areal systems. Plant Methods 2018, 14, 116. [Google Scholar] [CrossRef] [PubMed] [Green Version]
Figure 1. Pictures of the system. A: the ULA platform with the sensors pod under the fuselage. B: the navigation station inside the ULA cockpit. C: the sensors pod fully equipped. D: the study site (seen from the ULA), partly covered by clouds.
Remotesensing 12 01265 g001
Figure 2. Sensors pod design. GNSS: Global Navigation Satellite System.
Remotesensing 12 01265 g002
Figure 3. Study area. Left, Digital Surface Model (DSM) with the 16 Ground Control Points (GCPs), used for photogrammetry and accuracy assessment. Right, intended flight plan.
Remotesensing 12 01265 g003
Figure 4. Selected sensors: A: Nikon D850 (RGB). B: Parrot Sequoia (multispectral). C: Flir Vue Pro 640 (thermal infrared).
Remotesensing 12 01265 g004
Figure 5. Compatibilities of the key parameters of the three selected cameras (Table 4) and the selected ULA (Table 3). Left Y-axis, logarithmic scale of above ground altitude ( AGA ). Right Y-axis, logarithmic scales of image spatial resolution ( ImSR ) of each camera. X-axis, ground speed ( GSp ). Blue, yellow and red colors correspond to Nikon D850, Parrot Sequoia and Flir Vue Pro 640, respectively. The light grey rectangle indicates the ULA operational range (Table 3) (regulation not included). The vertical black line indicates the ULA flight plan (altitude from 173 to 377 m and ground speed of 140 km/h). The dark grey rectangle indicates the typical operational range of fixed-wing unmanned aerial systems (UASs) (Talon of Aeromao). The black rectangle indicates the typical operational range of rotary-wing UASs (GX8 of Robotics Industry).
Remotesensing 12 01265 g005
Figure 6. Flow charts of the photogrammetric process for the production of a digital elevation model (DEM) and three orthophotomosaics (RGB, multispectral and thermal infrared) using PhotoScan. The DEM was produced from the RGB dataset.
Remotesensing 12 01265 g006
Figure 7. Effective flight plan (15th November 2018). The points locate the centers of the RGB images (Nikon D850). Red points indicate cross flight at higher altitude.
Remotesensing 12 01265 g007
Figure 8. Examples of blurred thermal infrared images.
Remotesensing 12 01265 g008
Figure 9. Zoom on a crossroad to highlight the misalignment of thermal infrared orthophotomosaic. A: RGB orthophotomosaic. B: RGB (top) and multispectral (bottom) orthophotomosaics. C: RGB (top) and thermal infrared (bottom) orthophotomosaics. D: multispectral (top) and thermal infrared (bottom) orthophotomosaics.
Remotesensing 12 01265 g009
Figure 10. A: digital elevation model (DEM). B: RGB orthophotomosaic. C: multispectral orthophotomosaic (false color). D: thermal infrared orthophotomosaic.
Remotesensing 12 01265 g010
Table 1. UAS classification in accordance with the European regulation adapted from Gupta S. et al. (2013) [21].
CategoryMTOWAGL AltitudeFlight Radius
Micro<2 kgUp to 60 mUp to 5 km
Mini2–20 kgUp to 900 mUp to 25 km
Small20–150 kgUp to 1500 mUp to 50 km
MTOW: Maximum Take-Off Weight; AGL: Above Ground Level
Table 2. System configuration: camera and flight key parameters. CCD: Charge Coupled Device.
NamesSymbolUnitsCameraFlight
CCD sensor size SSz W × SSz H Meters (width × height)x
Image dimension ImD W × ImD H Number of pixels (width × height)x
Focal length F L Metersx
Burst rate B R Frames per secondx
Aperture A p t r /x
Sensor sensitivity I S O /x
Integration time I n T Secondsx
Ground Speed G S p Meters per second x
Above ground level altitude A G A Meters x
Image ground spatial resolution I m S R Metersxx
Front overlap Front L /xx
Distance between successive images D B I m Metersxx
Side overlap Side L /xx
Distance between lines D B L n Metersxx
Ground swath (image footprint) G S w w × G S w H Meters (width × height)xx
Table 3. Ultralight airways (ULA) technical specifications.
Model AircraftStorm Rally 105
EngineRotax 912 ULS (100 hp)
Fuel capacity130 l
Normal operating velocity (maximum speed cruse)210 km/h; 58.3 m/s
Stall Speed 1165 km/h; 18.1 m/s
Stall Speed 2257 km/h; 15.8 m/s
Endurance1520 km / 7.2 hours
Plafond3658 m
Maximum Take-Off Weight598 kg
Standard empty weight345 kg
Maximum useful load253 kg
1 at MTOW, without flaps at engine idling
2 at MTOW, with full flaps at engine idling
Table 4. Specifications of the selected sensors. See Table 2 for specifications description.
SpecificationNikon D850Parrot SequoiaFlir Vue Pro 640
SSz W × SSz H 35.9 × 23.9 mm4.8 × 3.6 mm10.88 × 8.7 mm
ImD W × ImD H 8256 × 5504 px1280 × 960 px640 × 512 px
F L 28 mm3.98 mm13 mm
I n T m i n 1 8000 s 1 500 s 1 30 s
B R 5 f p s 2 f p s 1 f p s
Spectral rangevisible0.53–0.81 μm7.5–13.5 μm
Number of bands341
Weight1238 g133 g134 g
Table 5. Values of key parameters of the three selected cameras for minimum and maximum flight above ground altitudes ( AGA ). See Table 2 for specifications description.
ParametersNikon D850Parrot SequoiaFlir Vue Pro 640
A G A 173 m377 m173 m 377 m173 m 377 m
GSw w ×   GSw H 222 × 148 m483 × 322 m209 × 157 m455 × 341 m145 × 116 m315 × 252 m
Front L 70 %86 %70 %86 %66 %84 %
Side L 67 %85 %65 %84 %50 %77 %
BR 0.880.830.99
InT c o n f i g 1 2902 s 1 1329 s 1 477 s 1 218 s 1 343 s 1 157 s
ImSR 2.7 cm5.8 cm16.3 cm35.43 cm22.6 cm49.3 cm

