Quantifying the Sensitivity of NDVI-Based C Factor Estimation and Potential Soil Erosion Prediction using Spaceborne Earth Observation Data


Abstract

1. Introduction
2. Materials and Methods
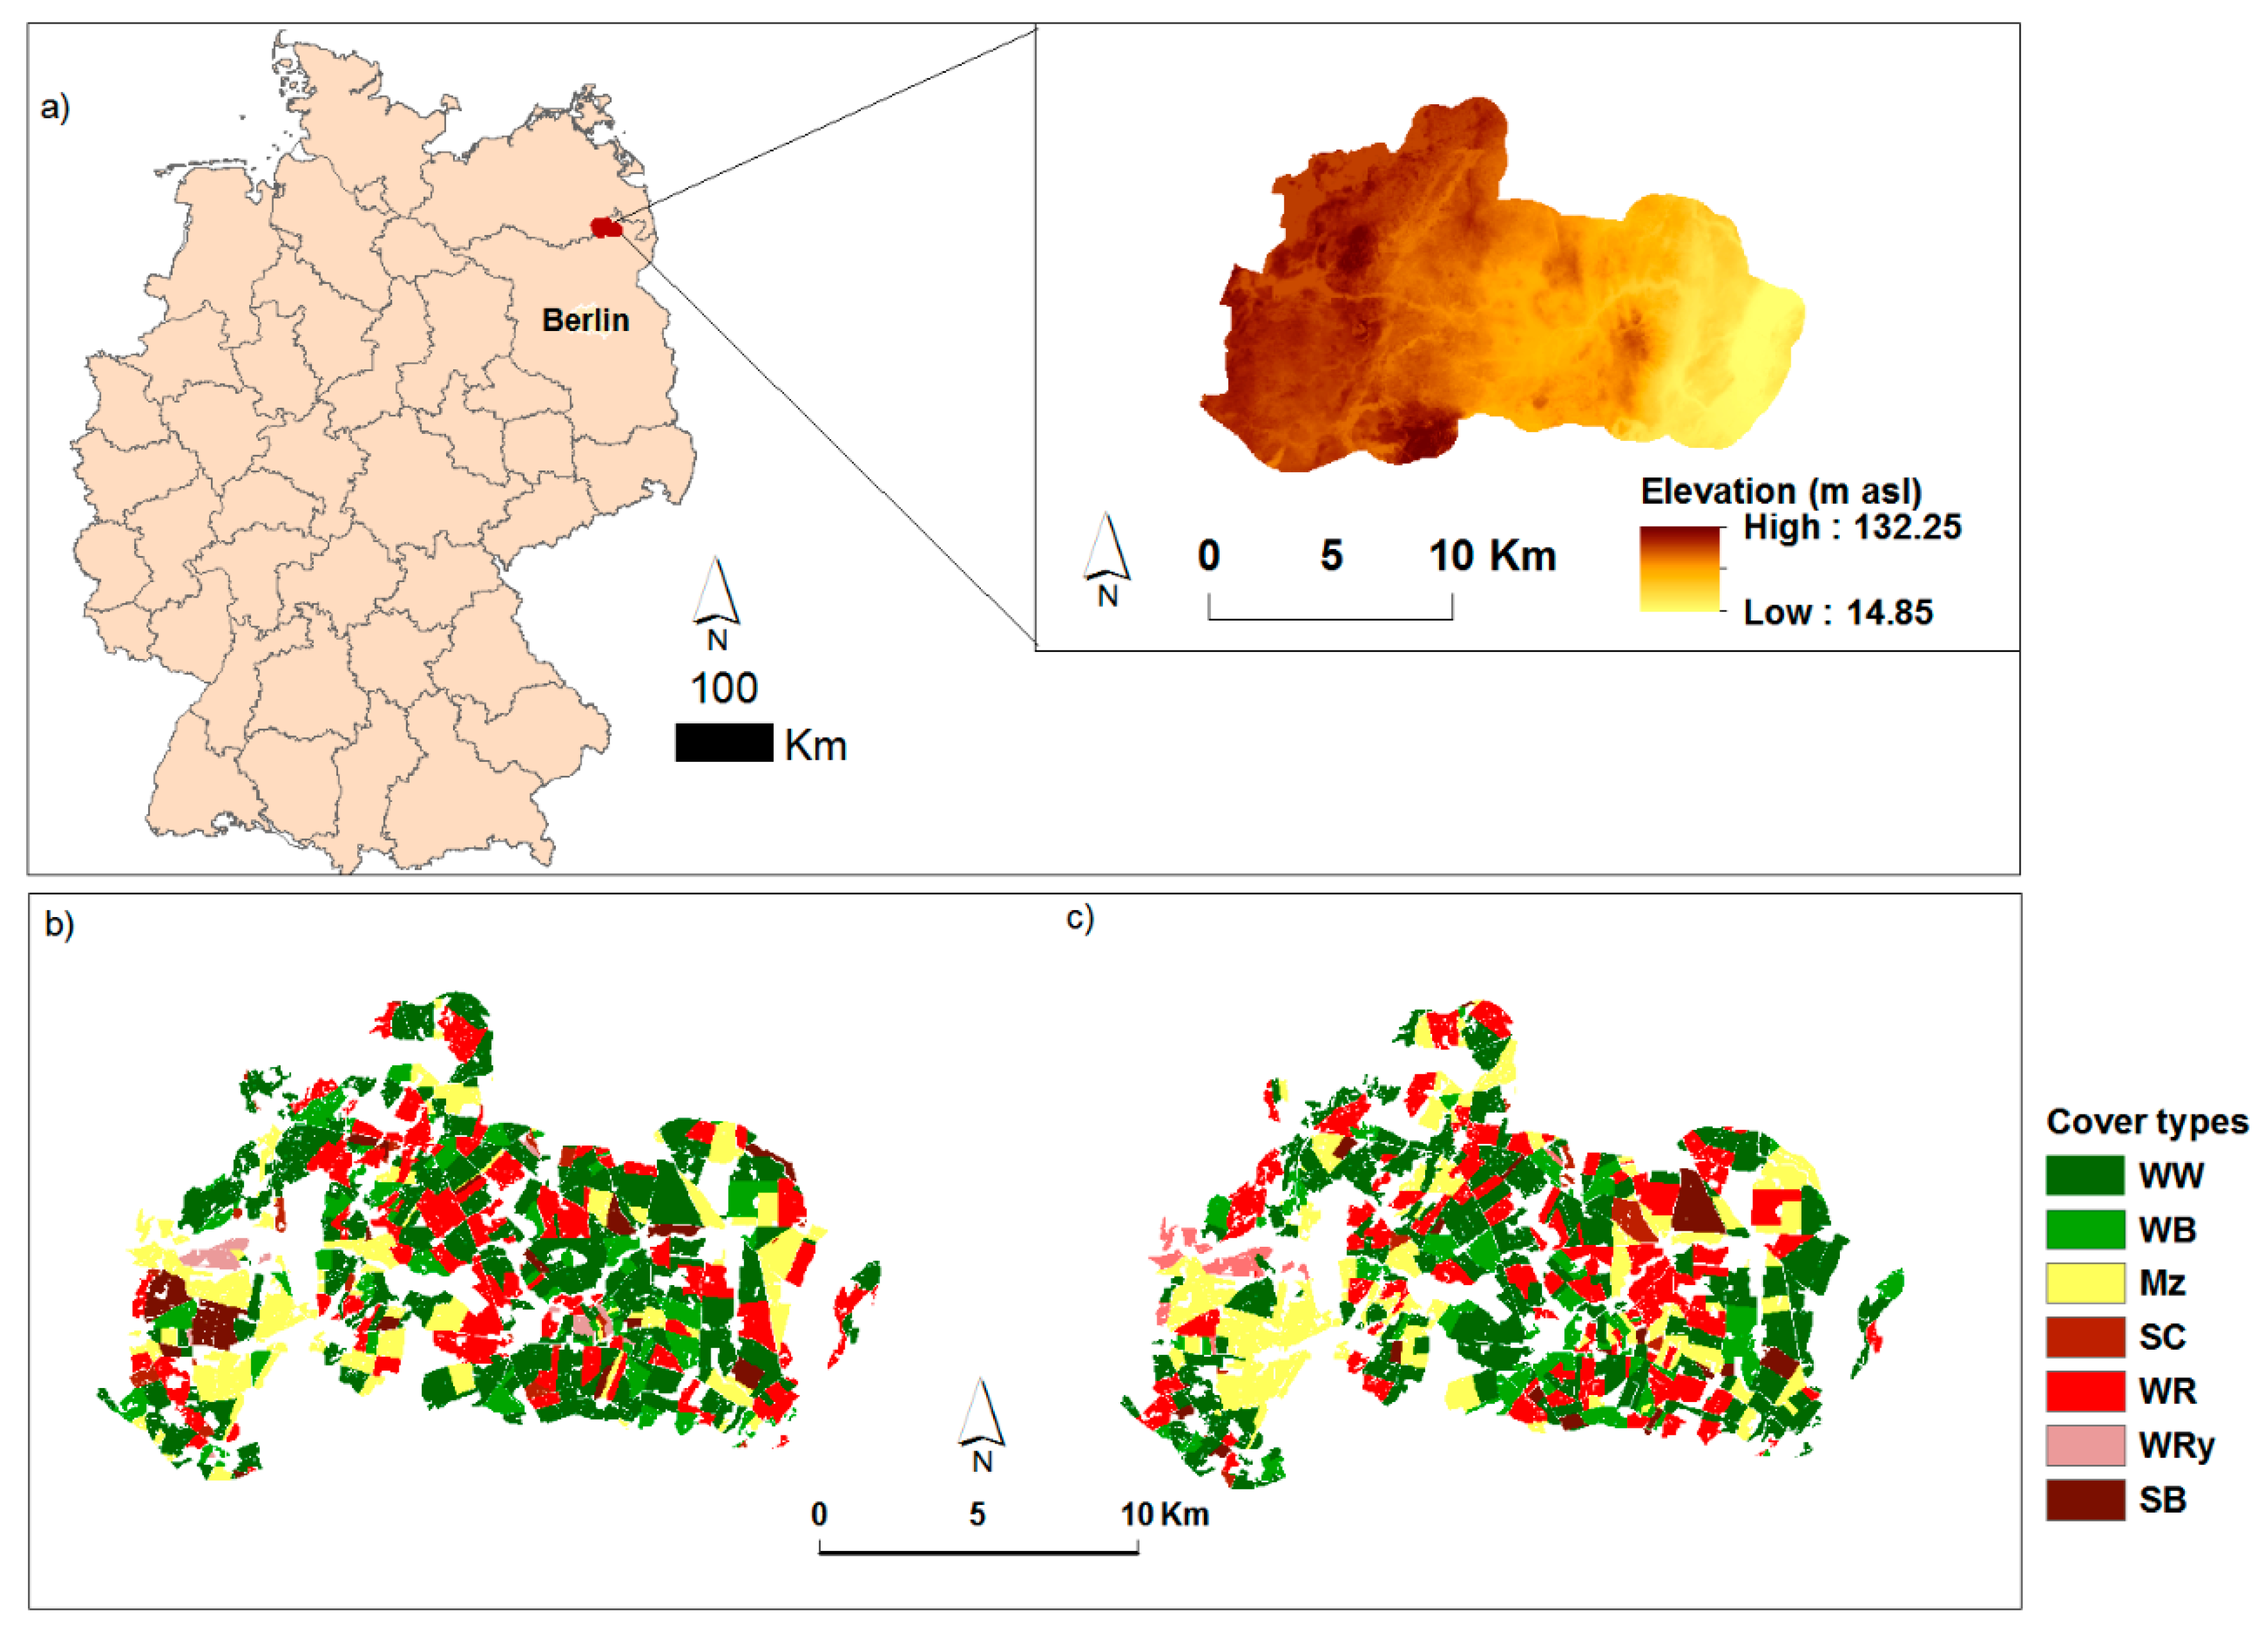
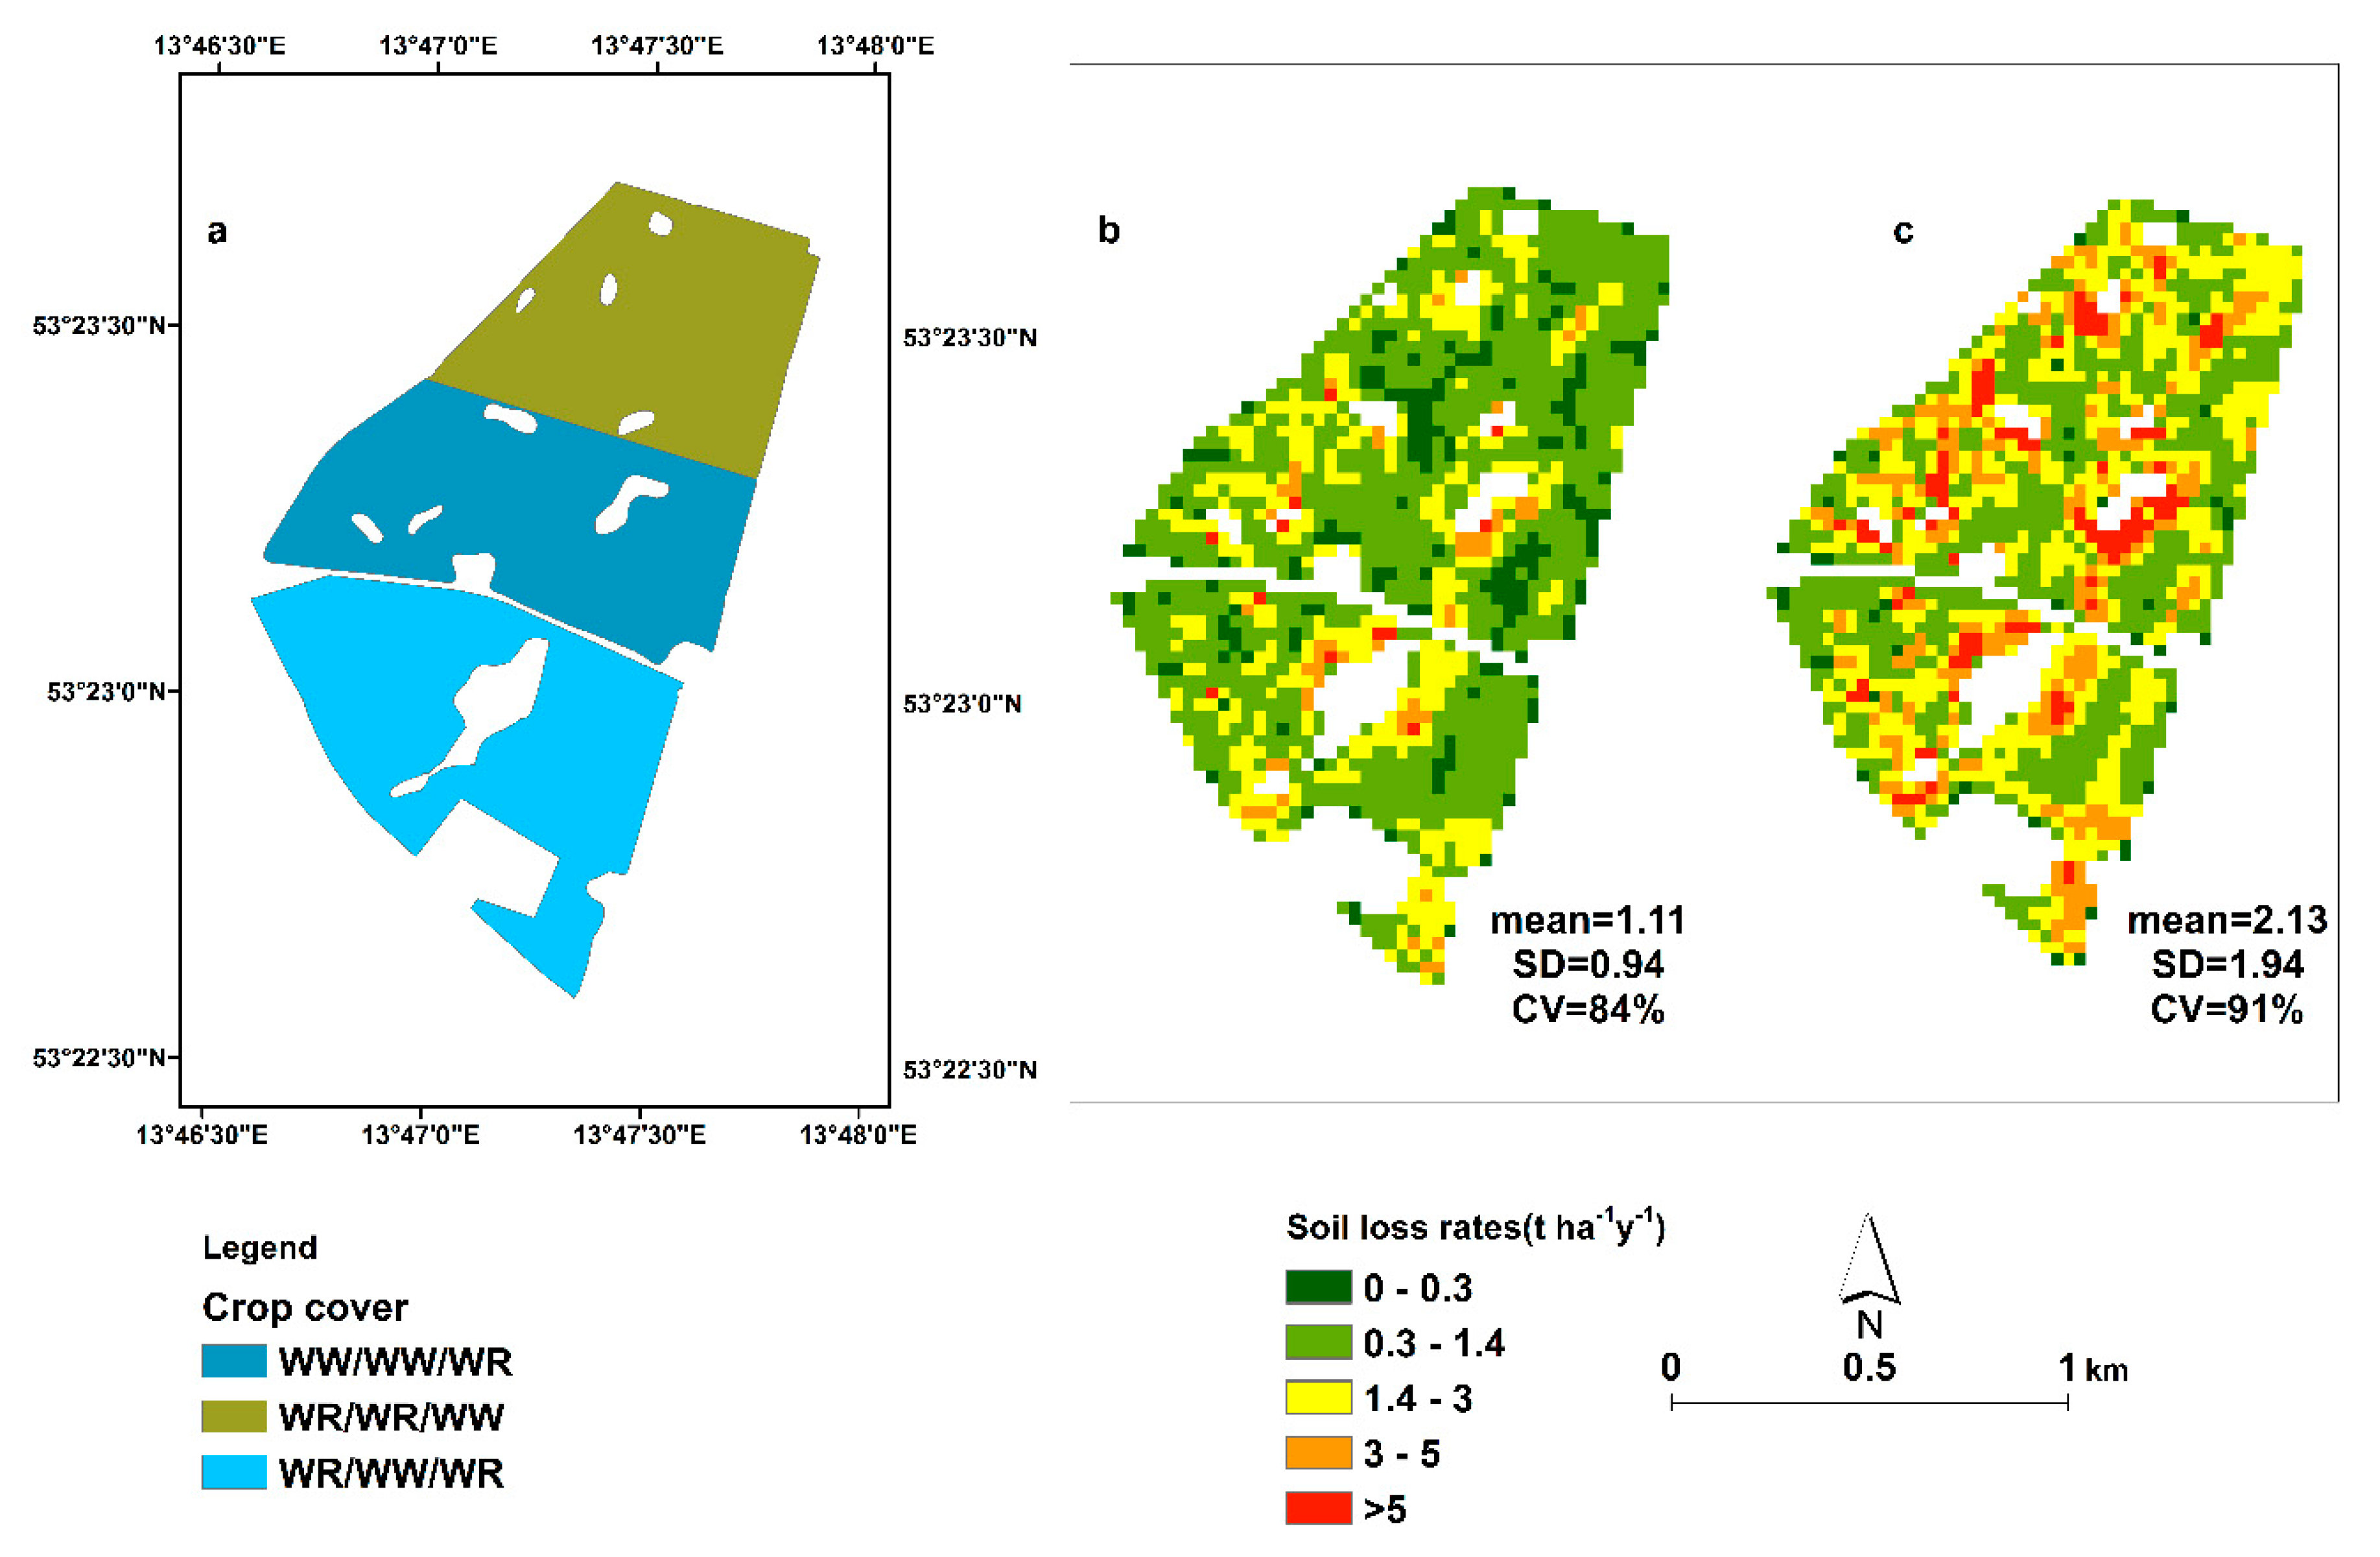
2.1. Study Area
2.2. Dataset and Processing
2.2.1. Satellite Imagery
2.2.2. Land Use/Land Cover Data
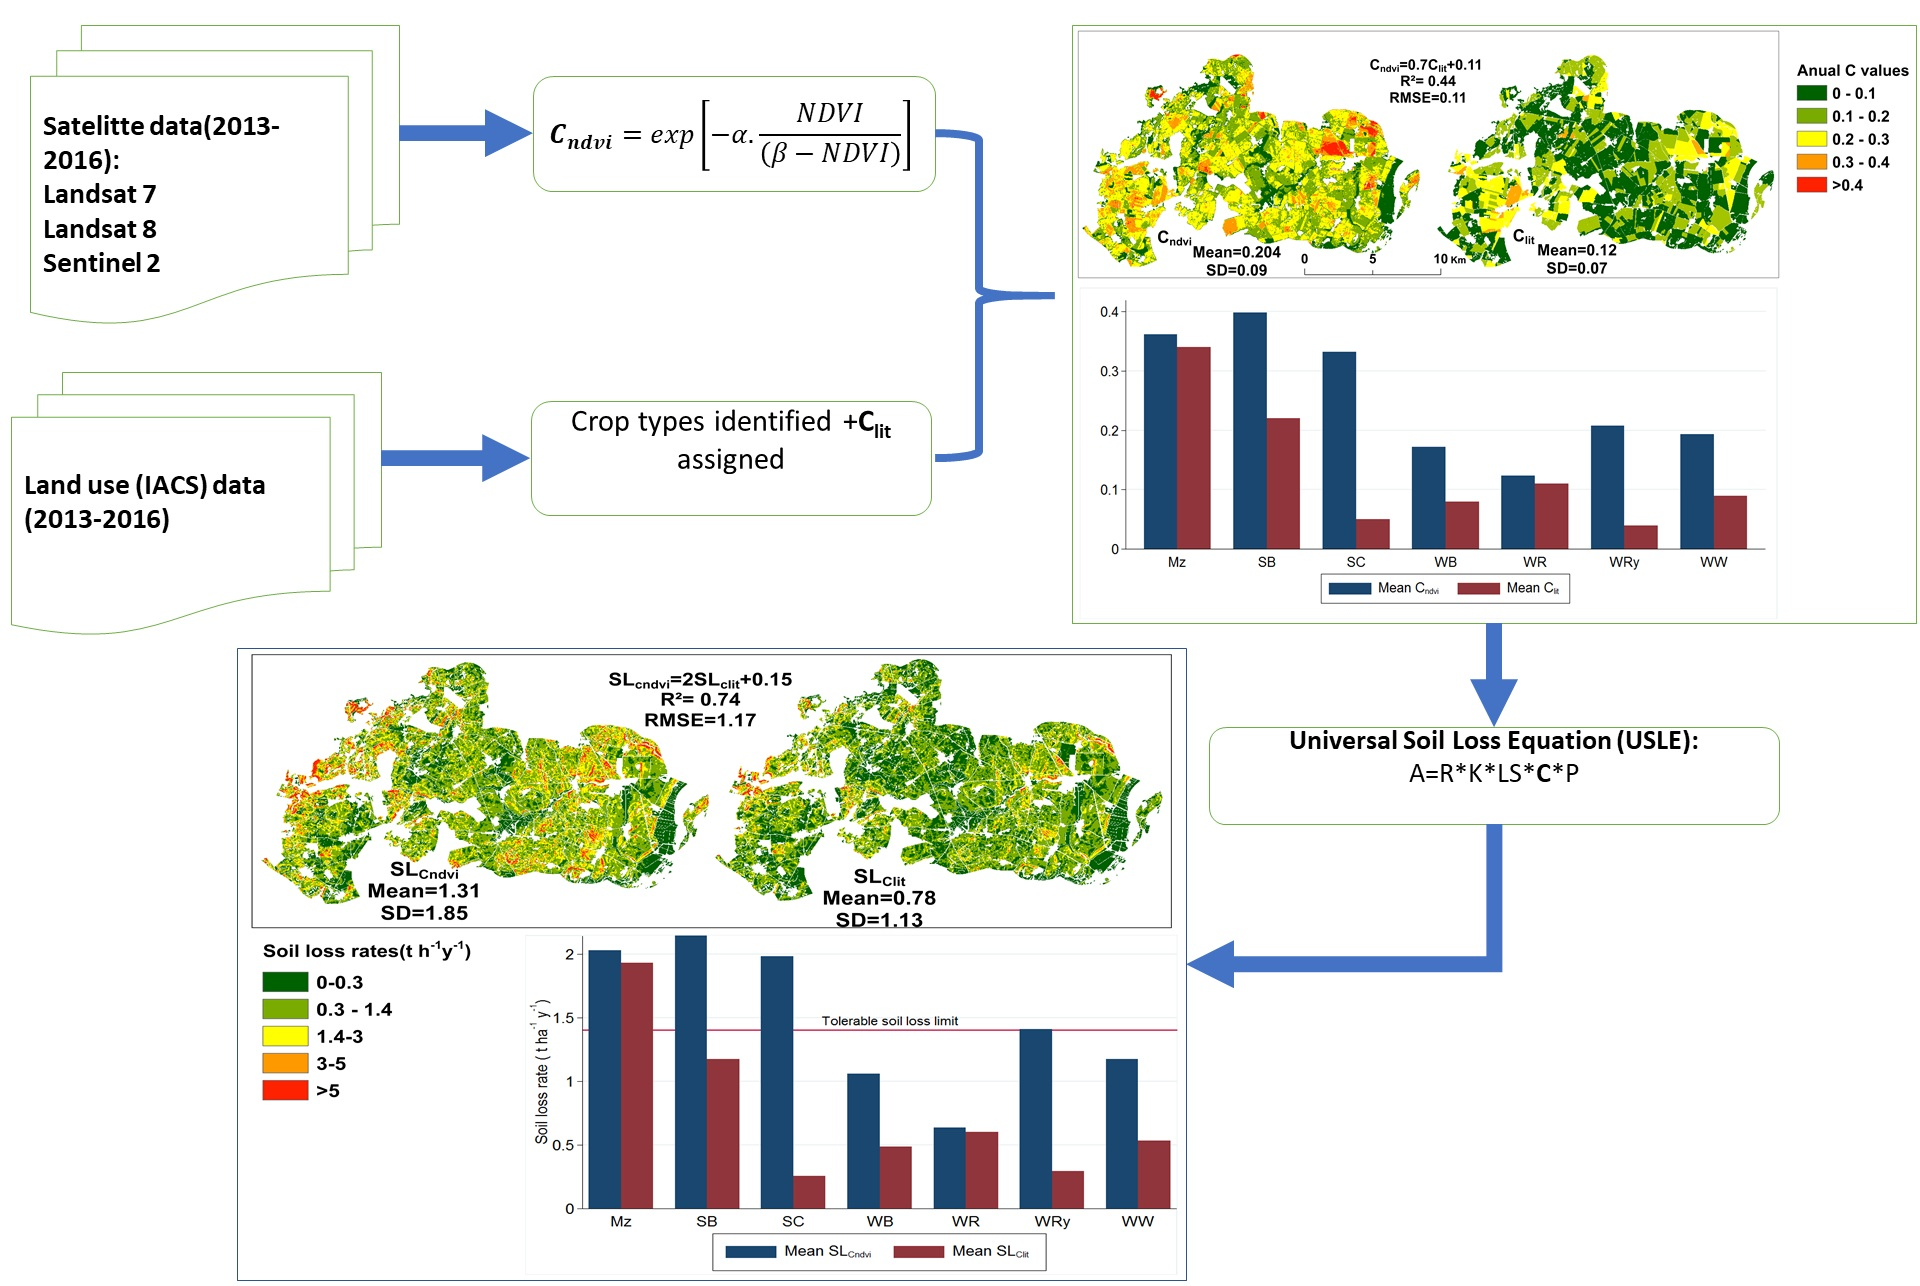
2.3. C Factor Value Estimation
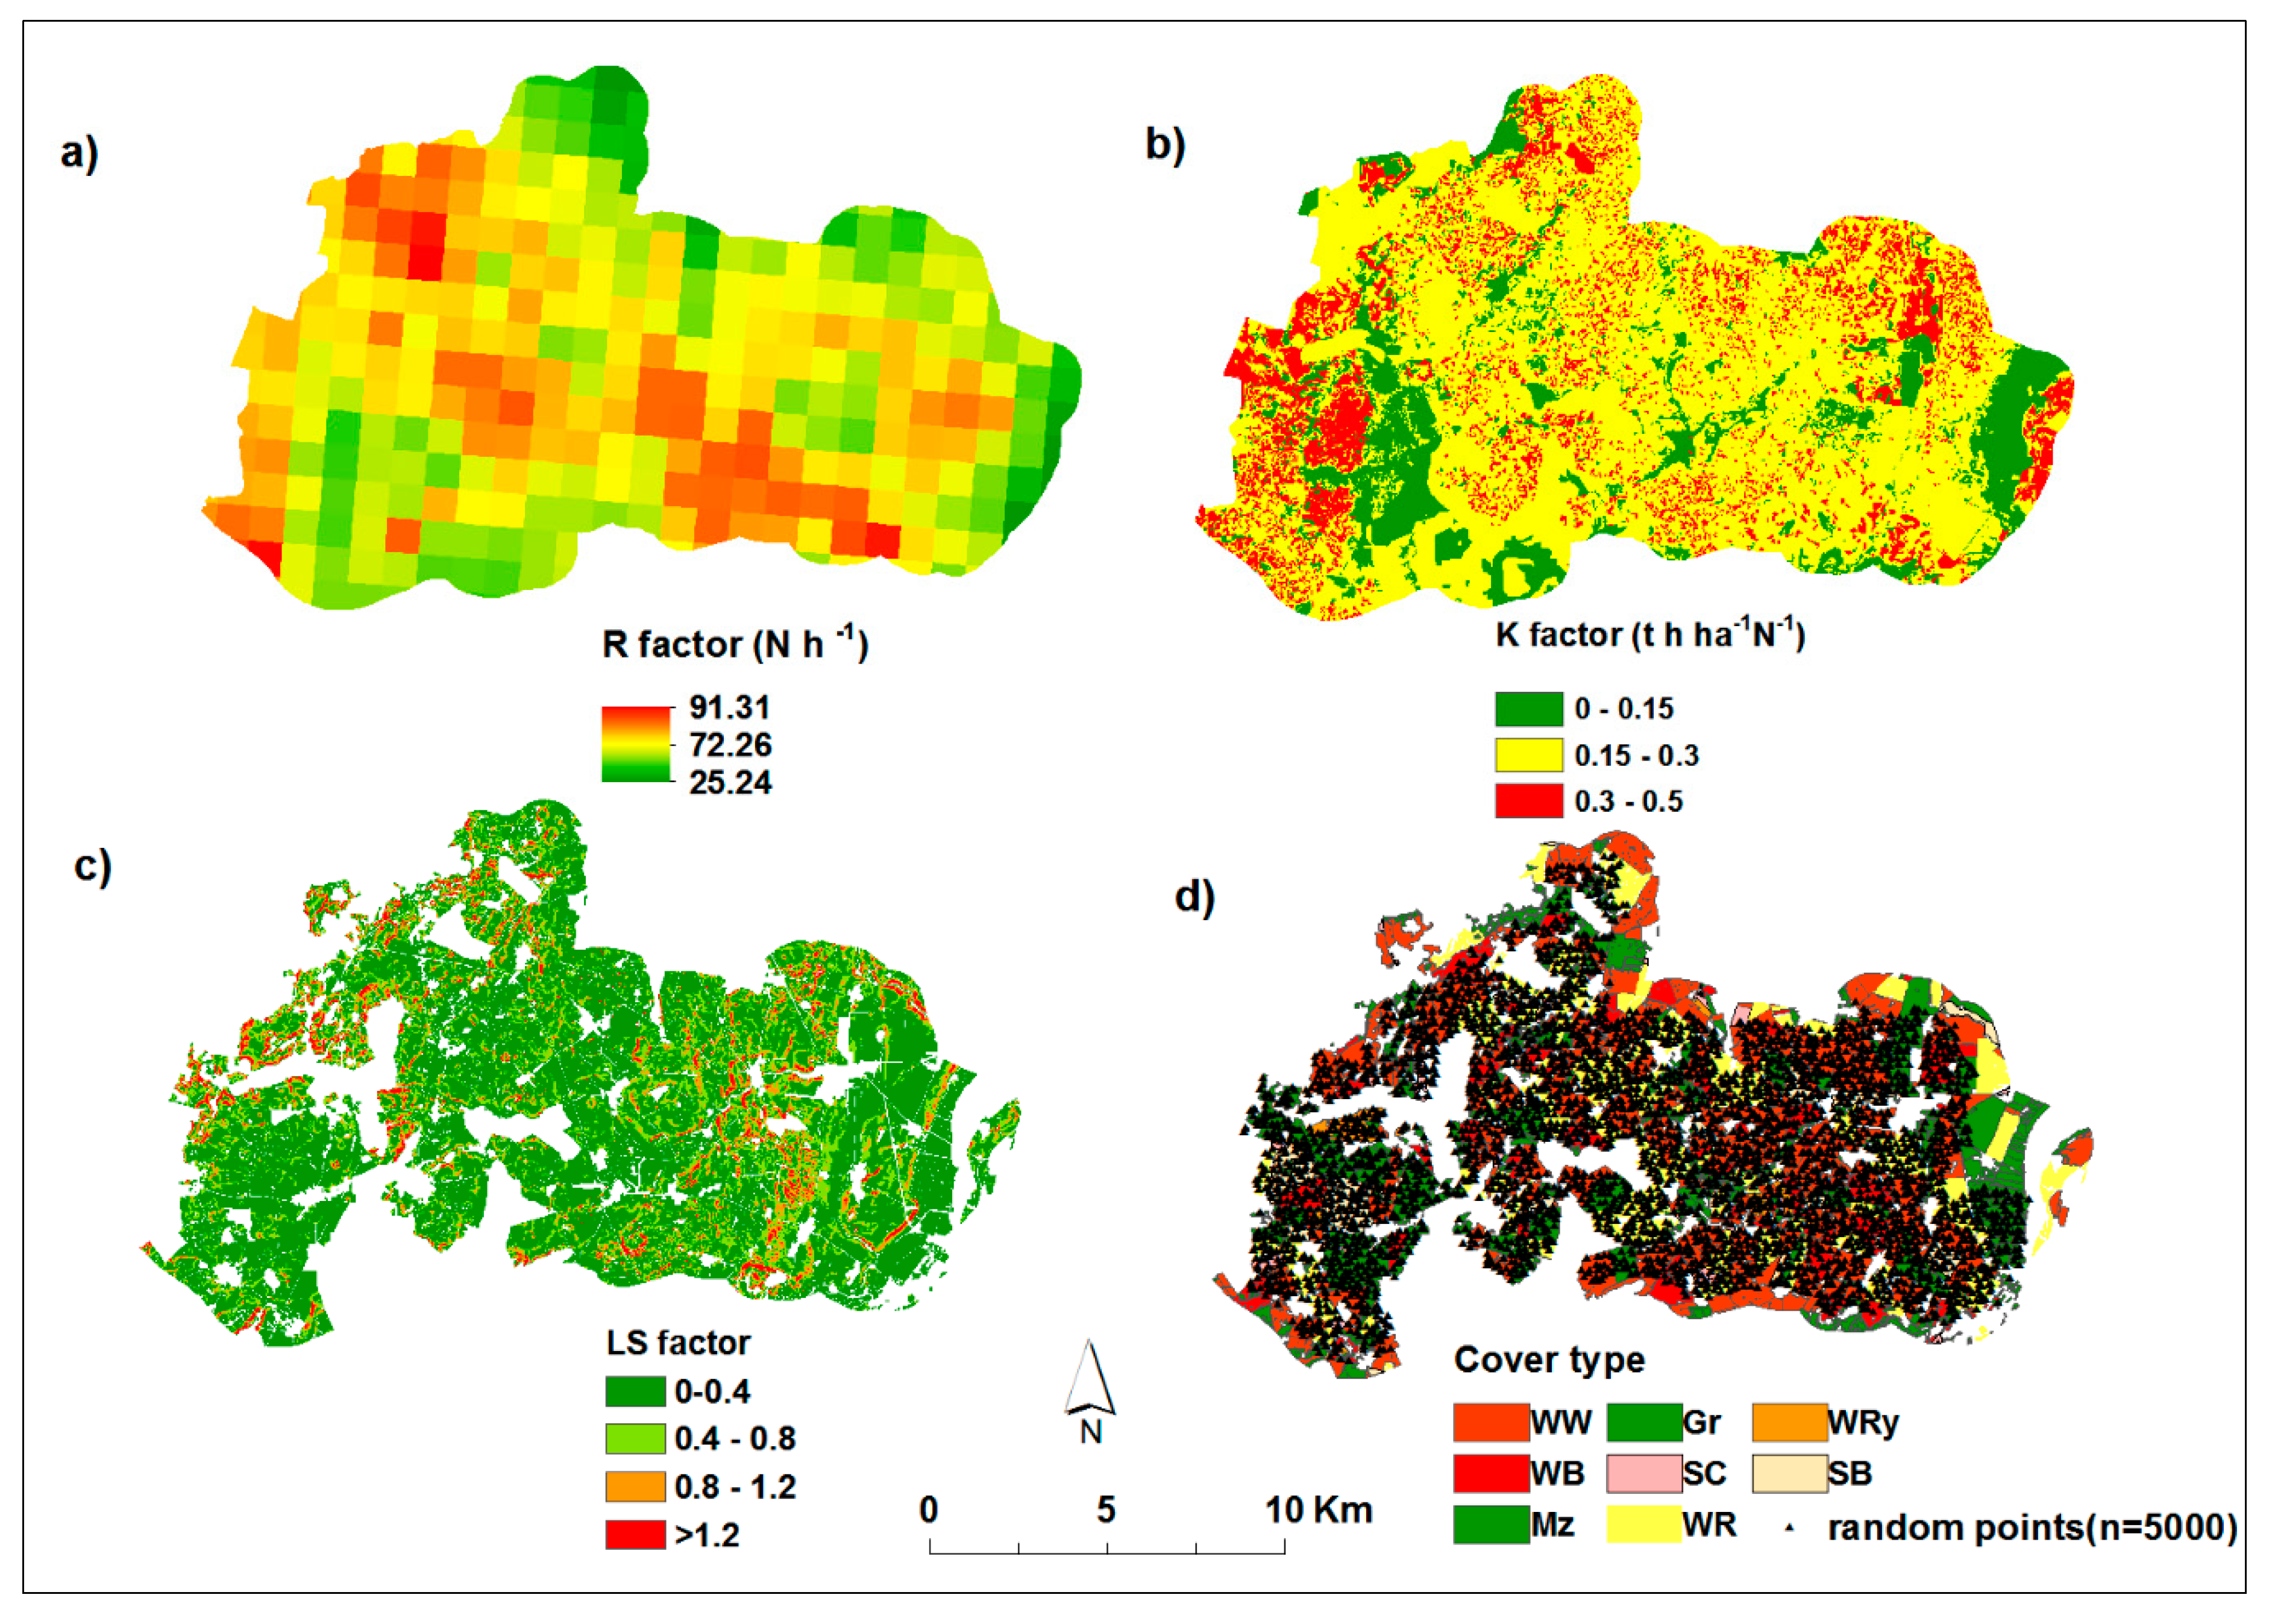
2.4. Soil Erosion Prediction
2.5. Statistical Analysis
3. Results and Discussion
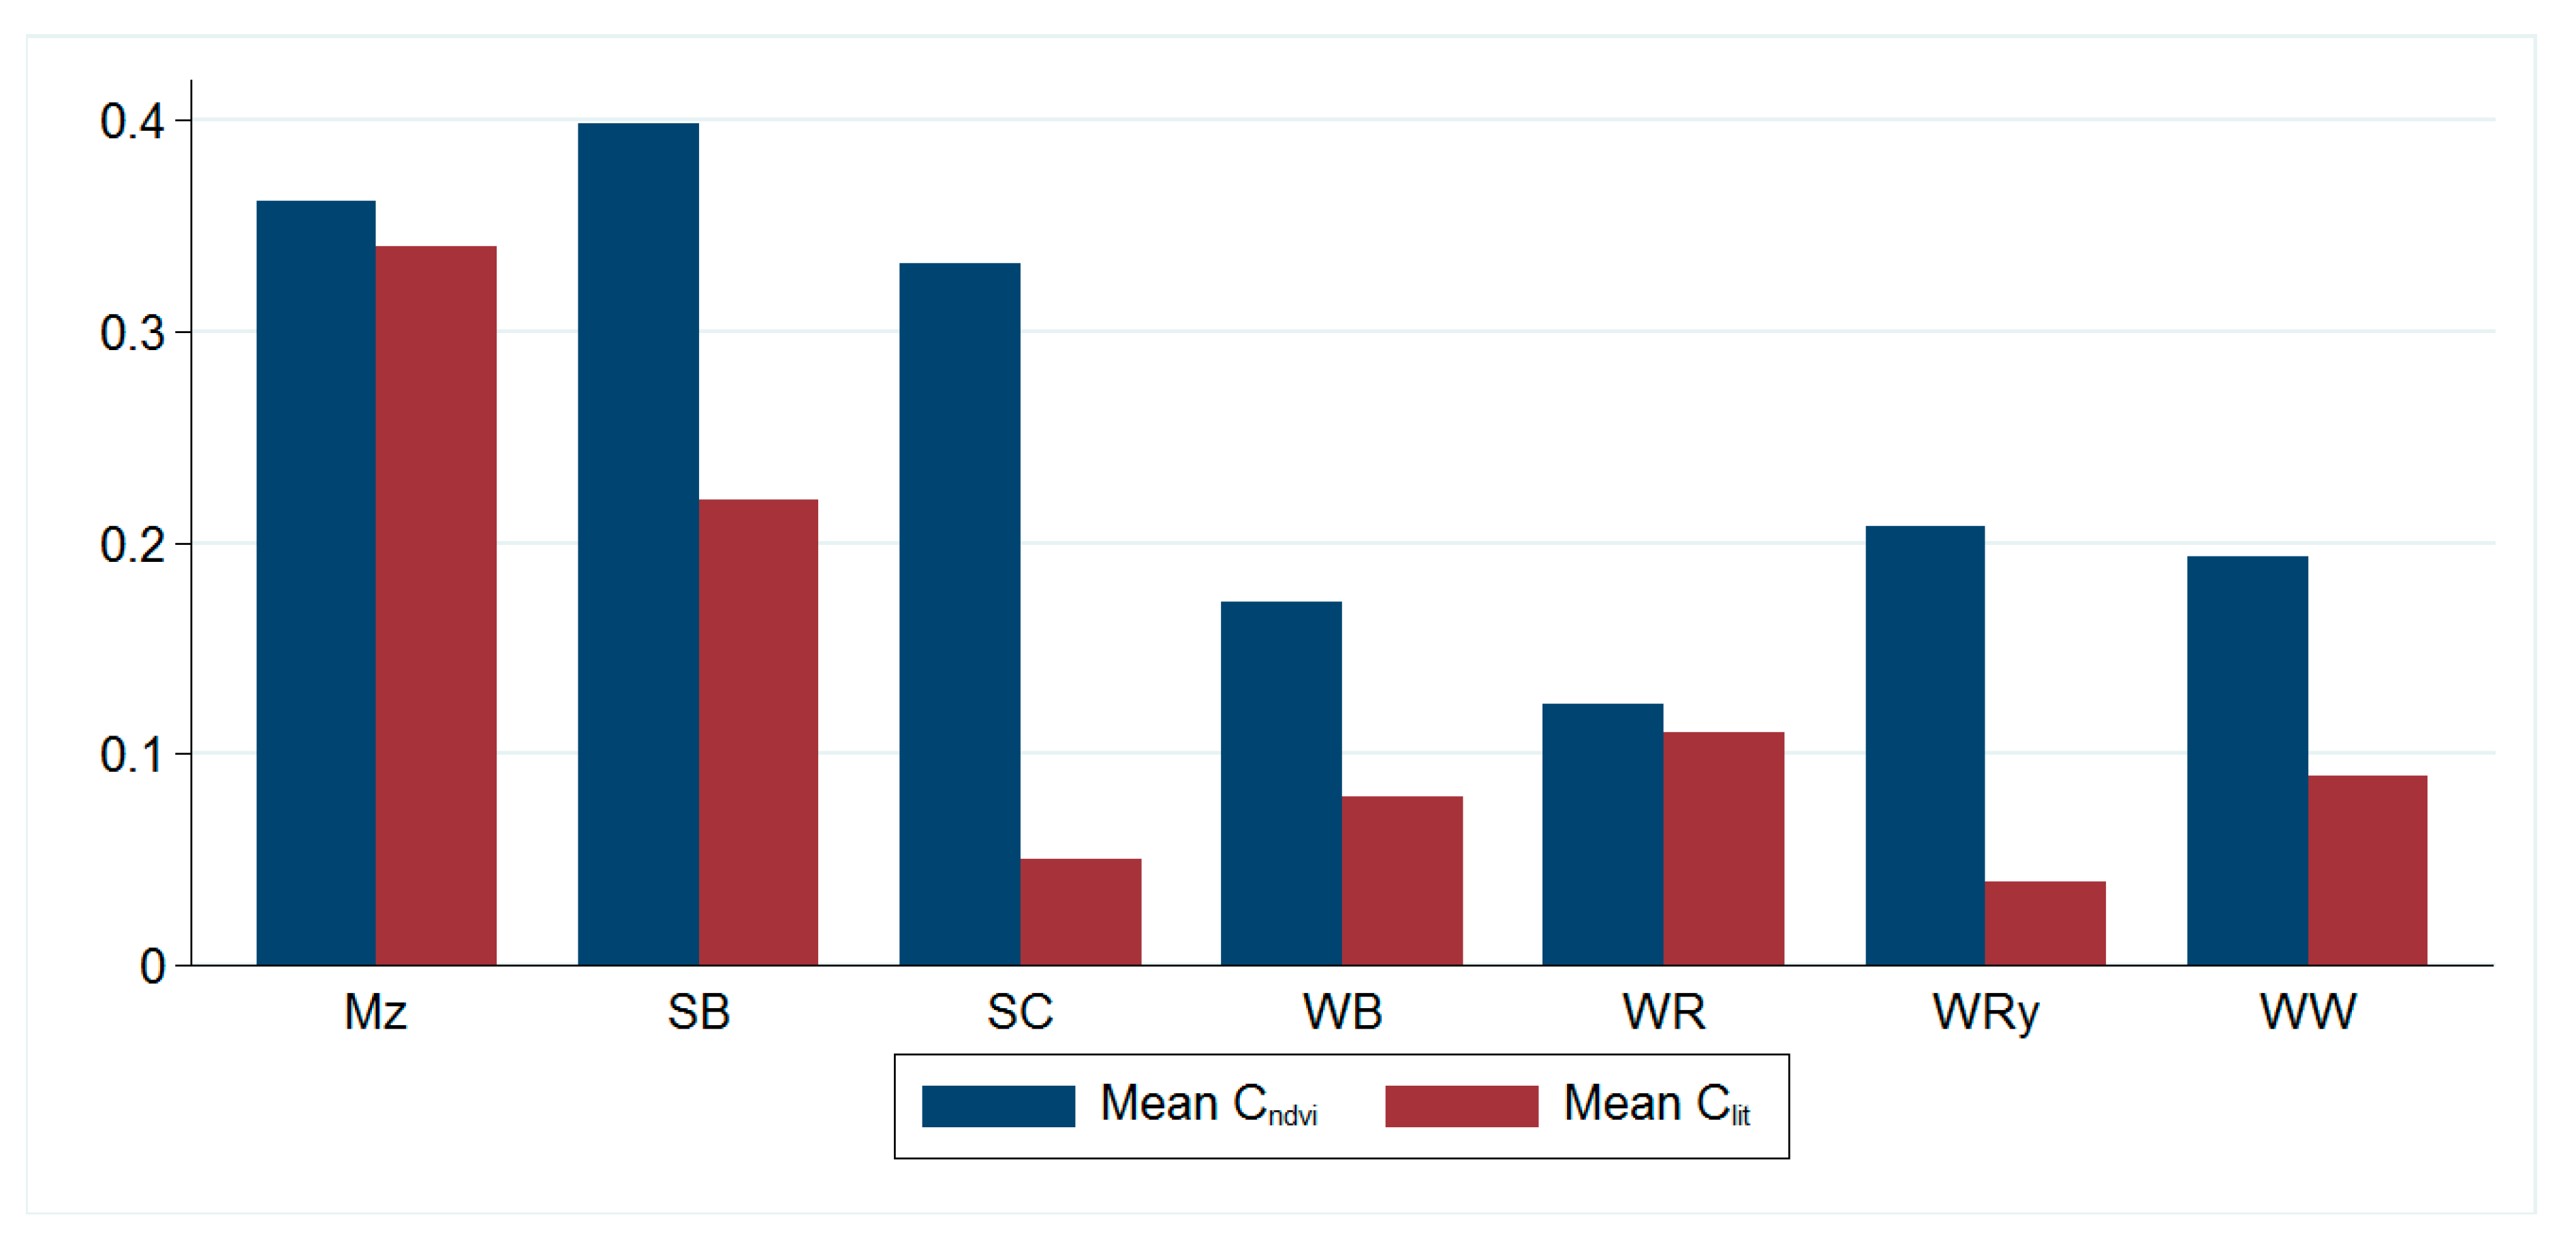
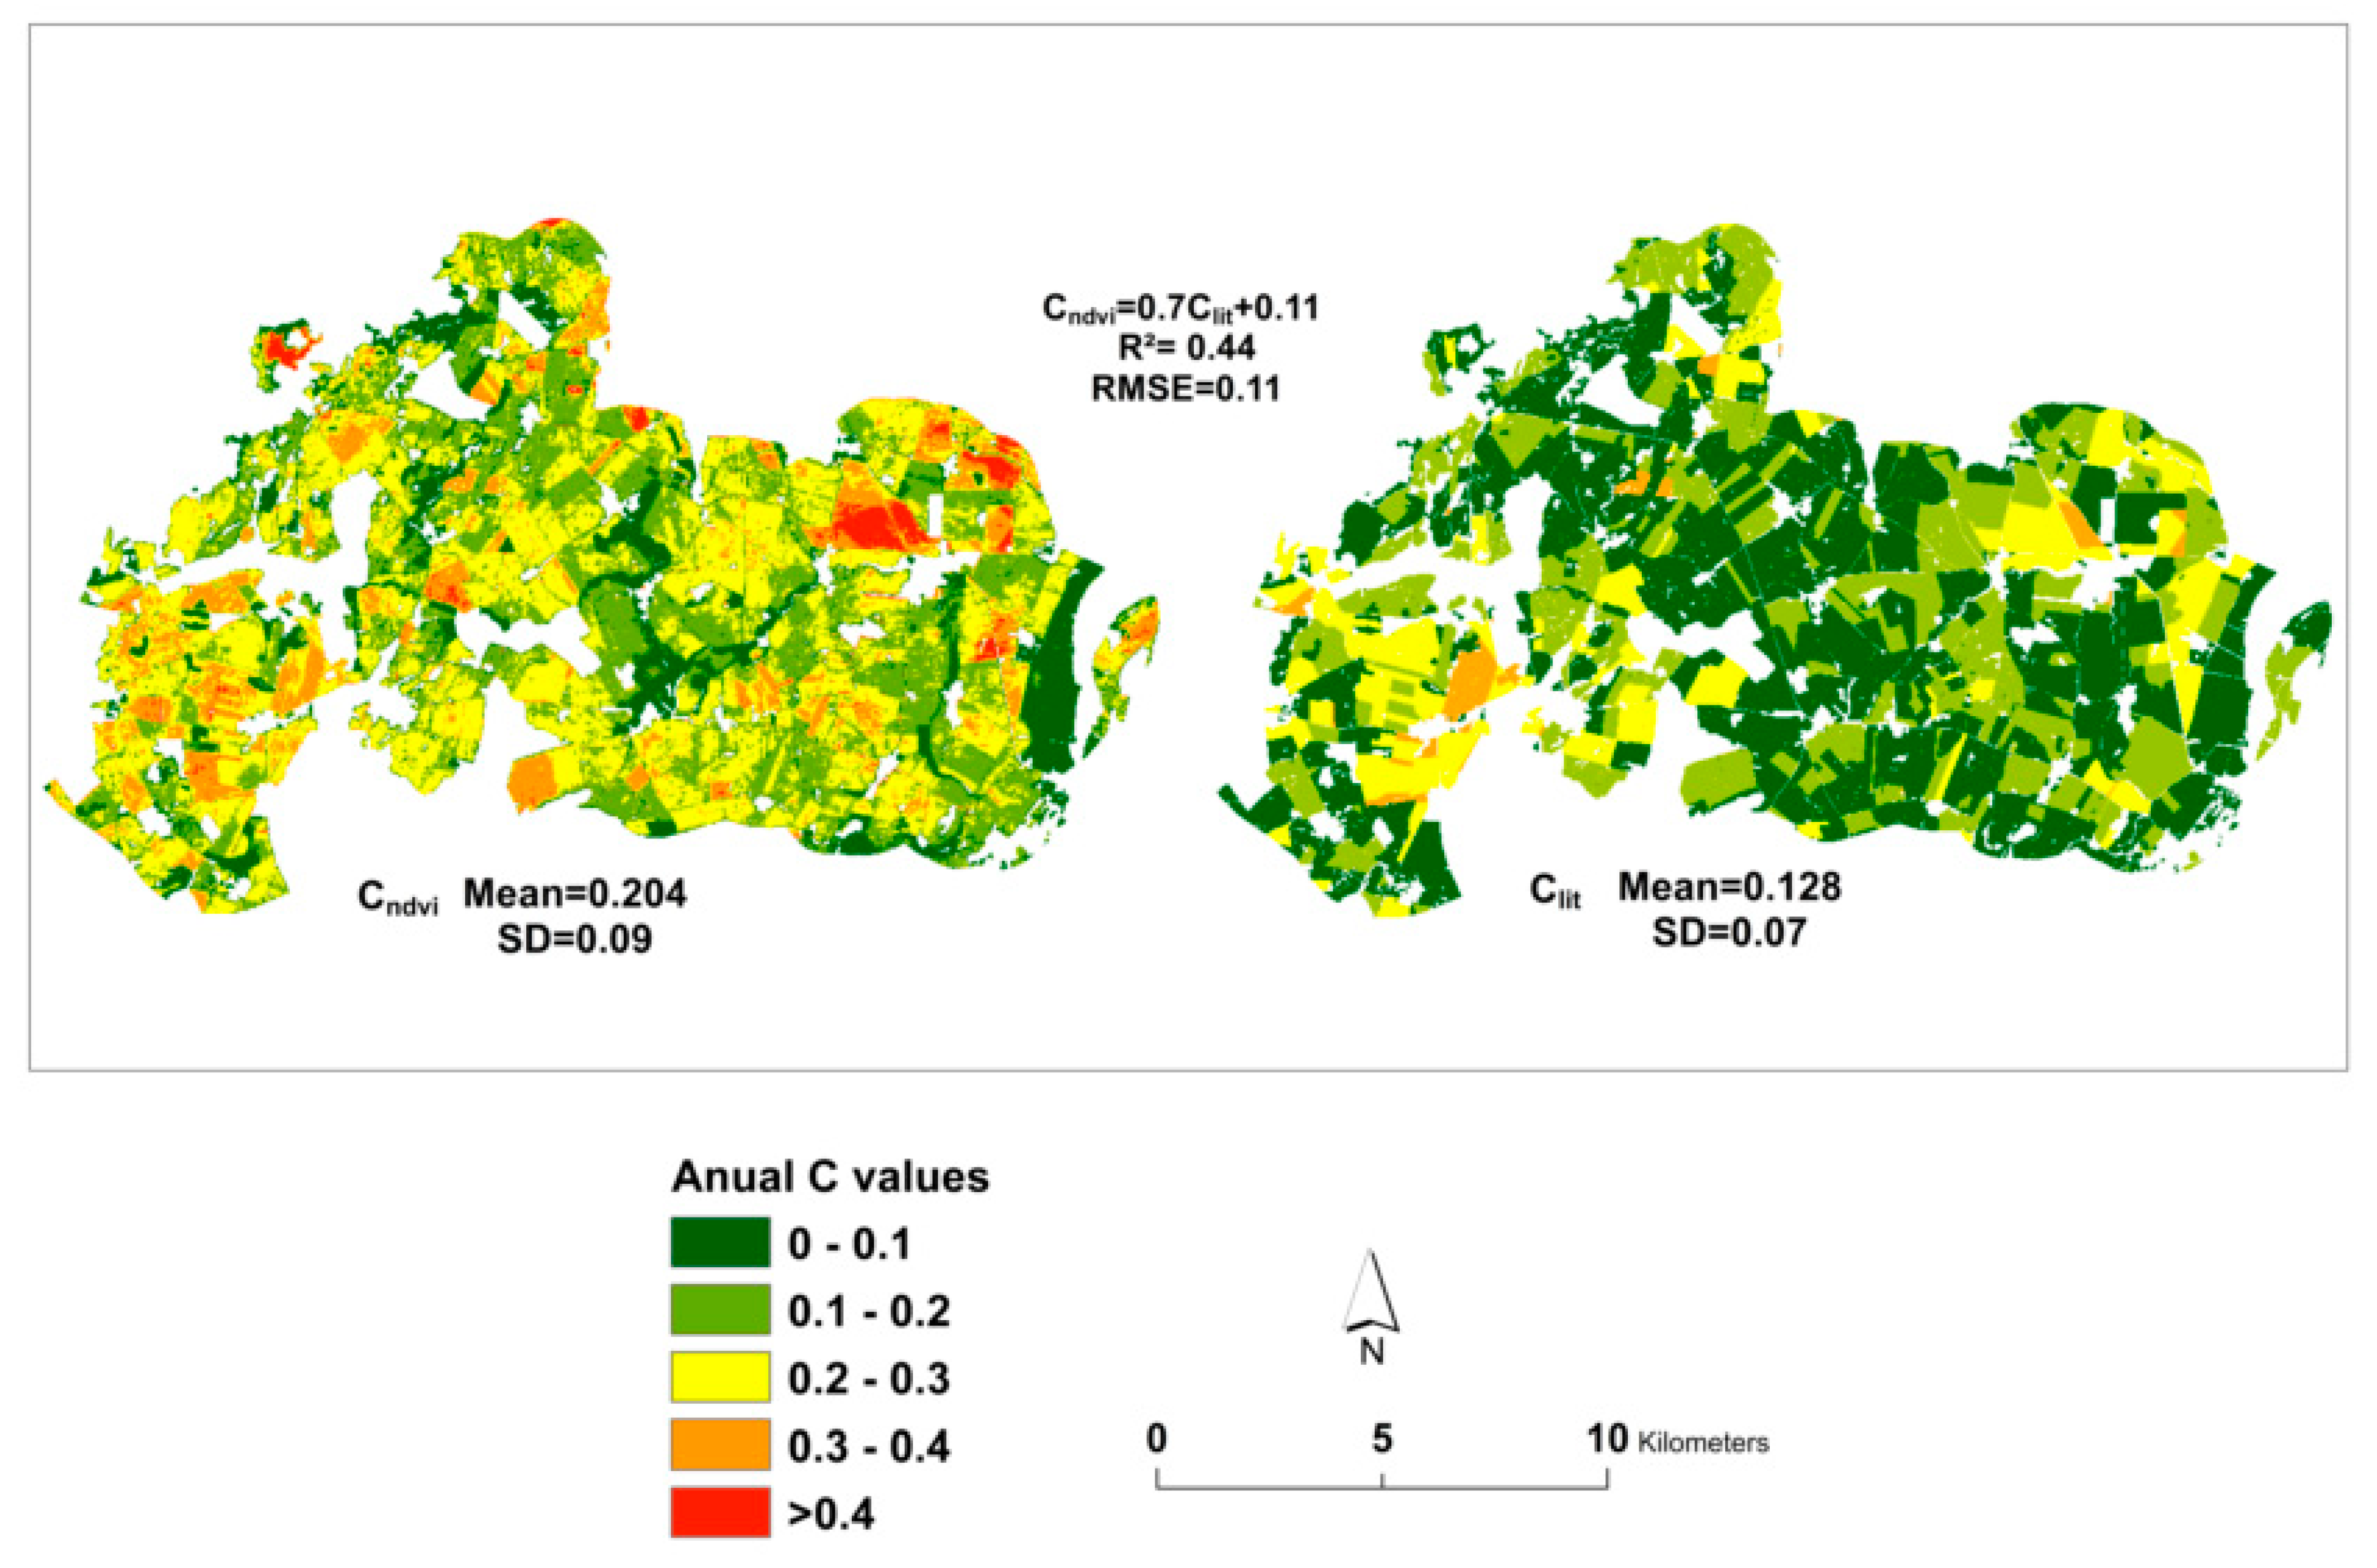
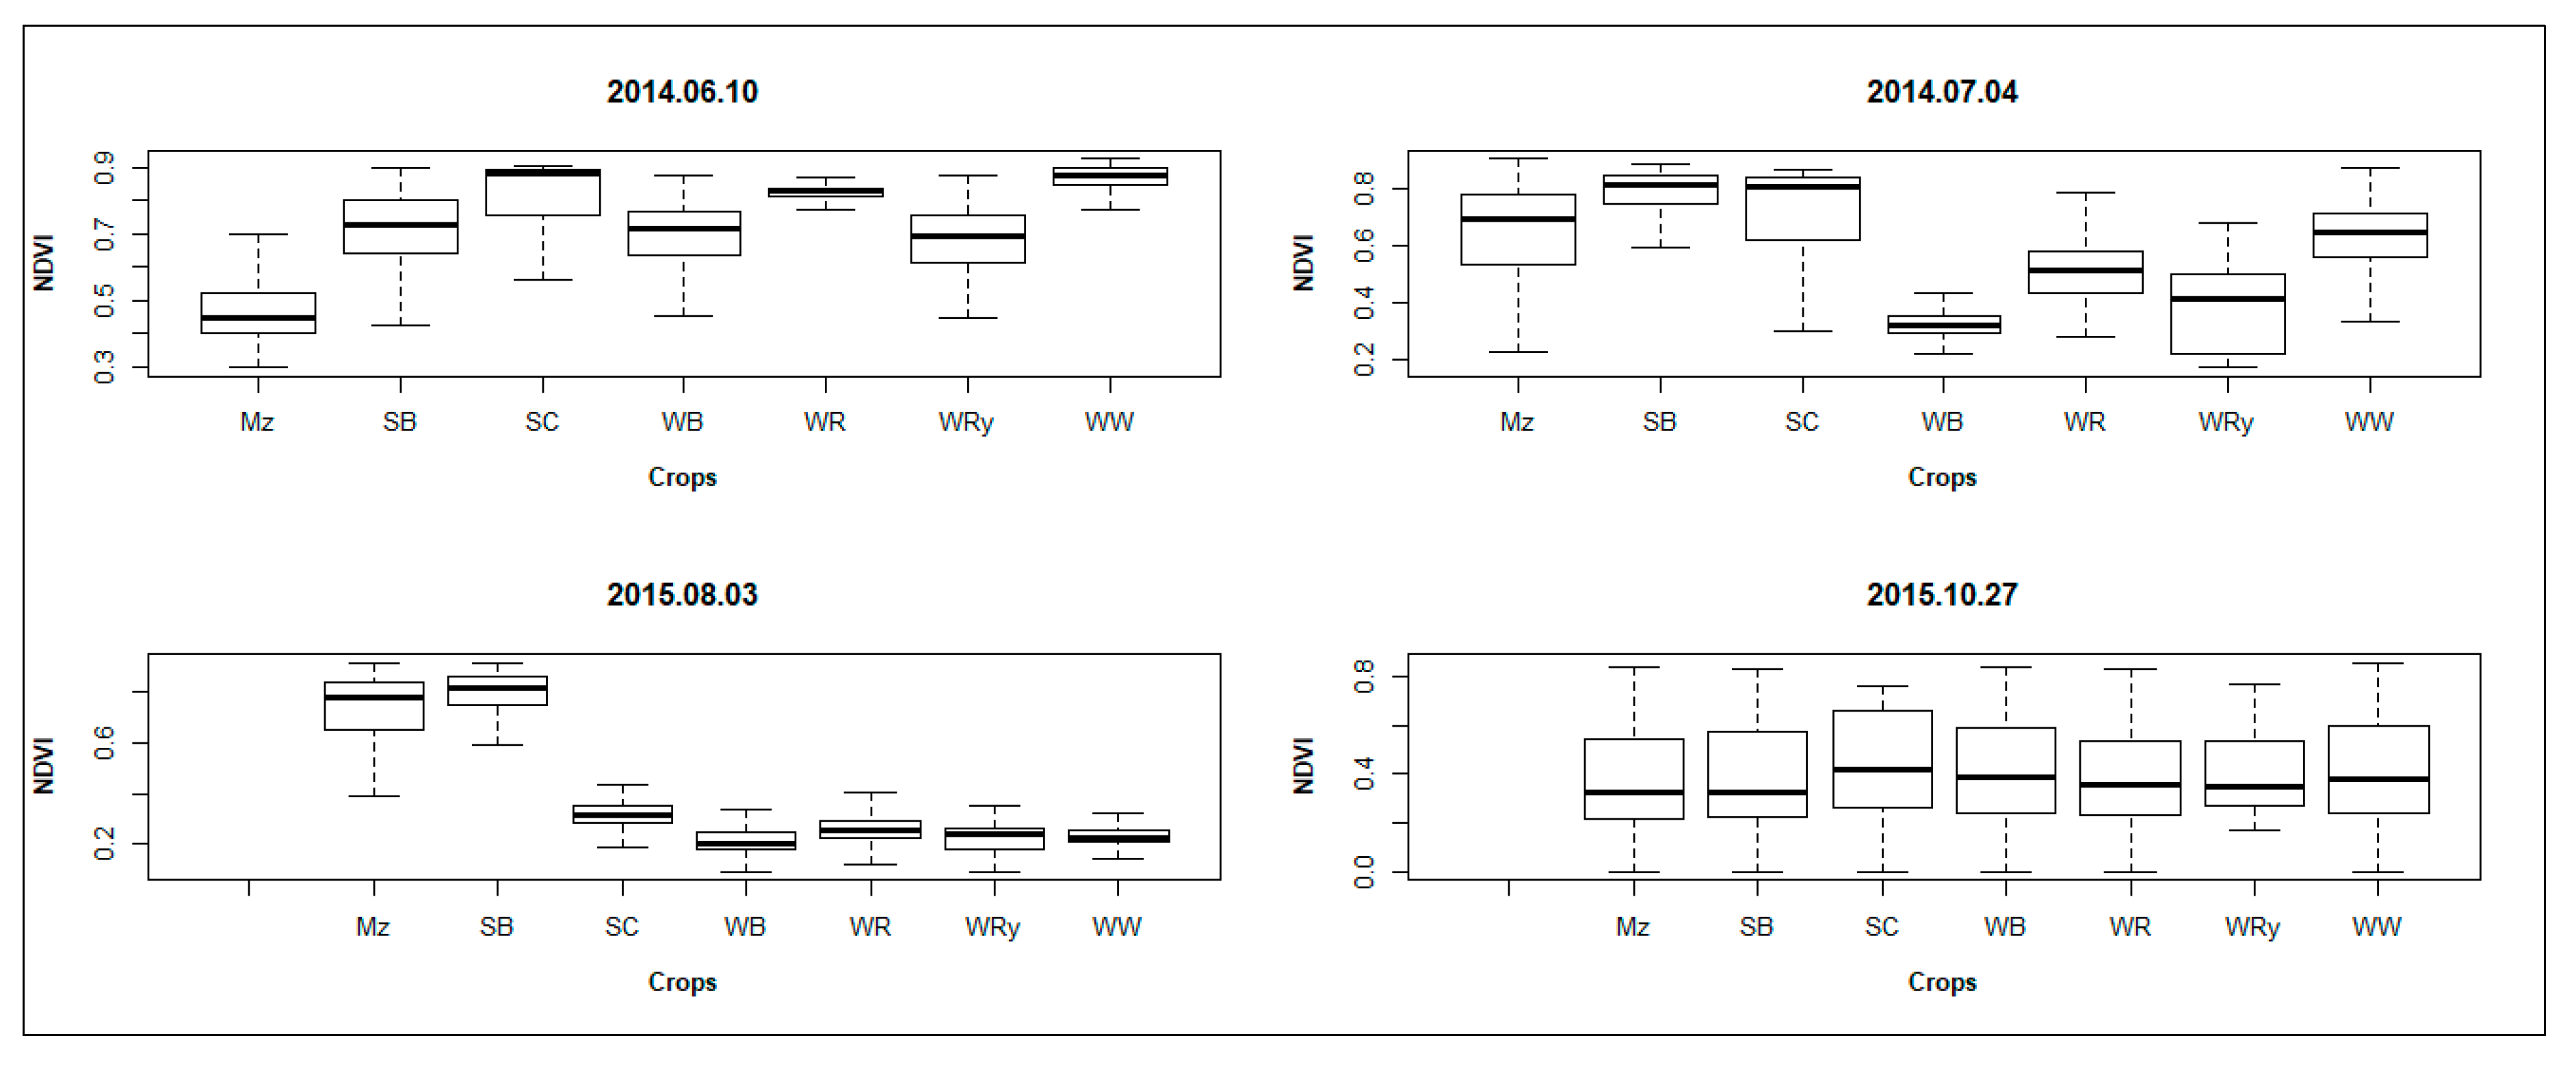
3.1. Comparisons between Cndvi and Clit Estimation
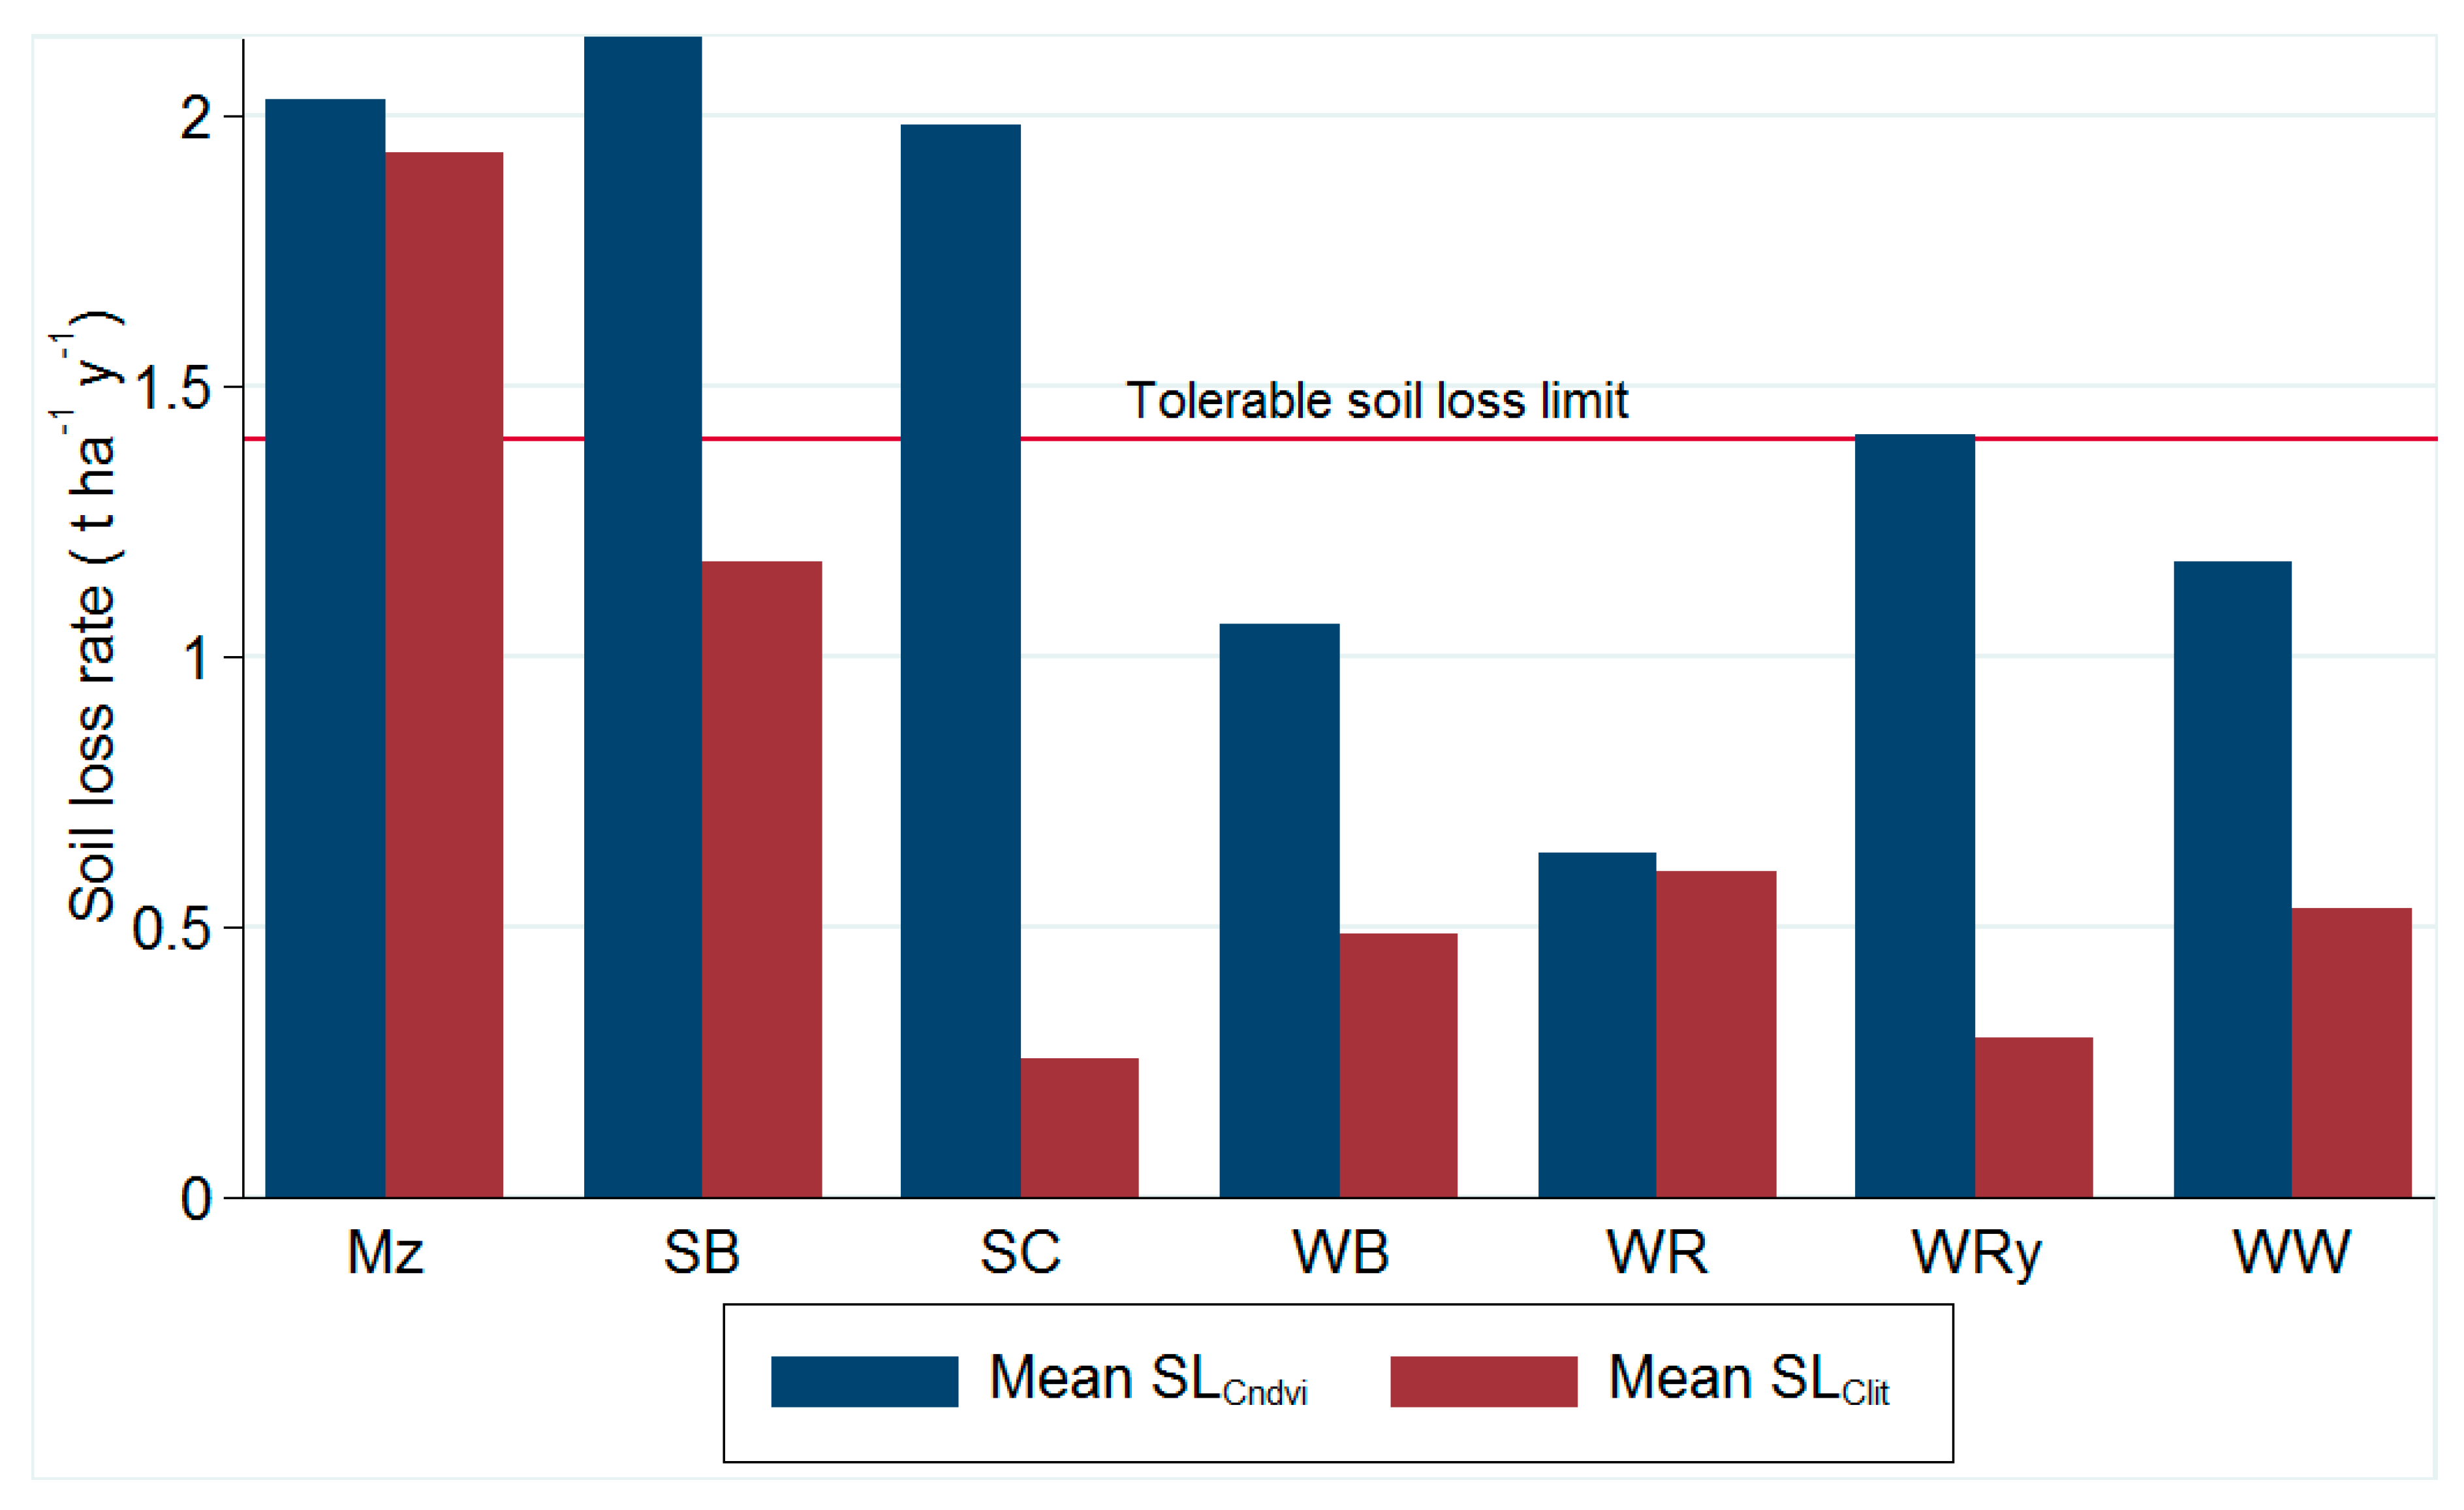
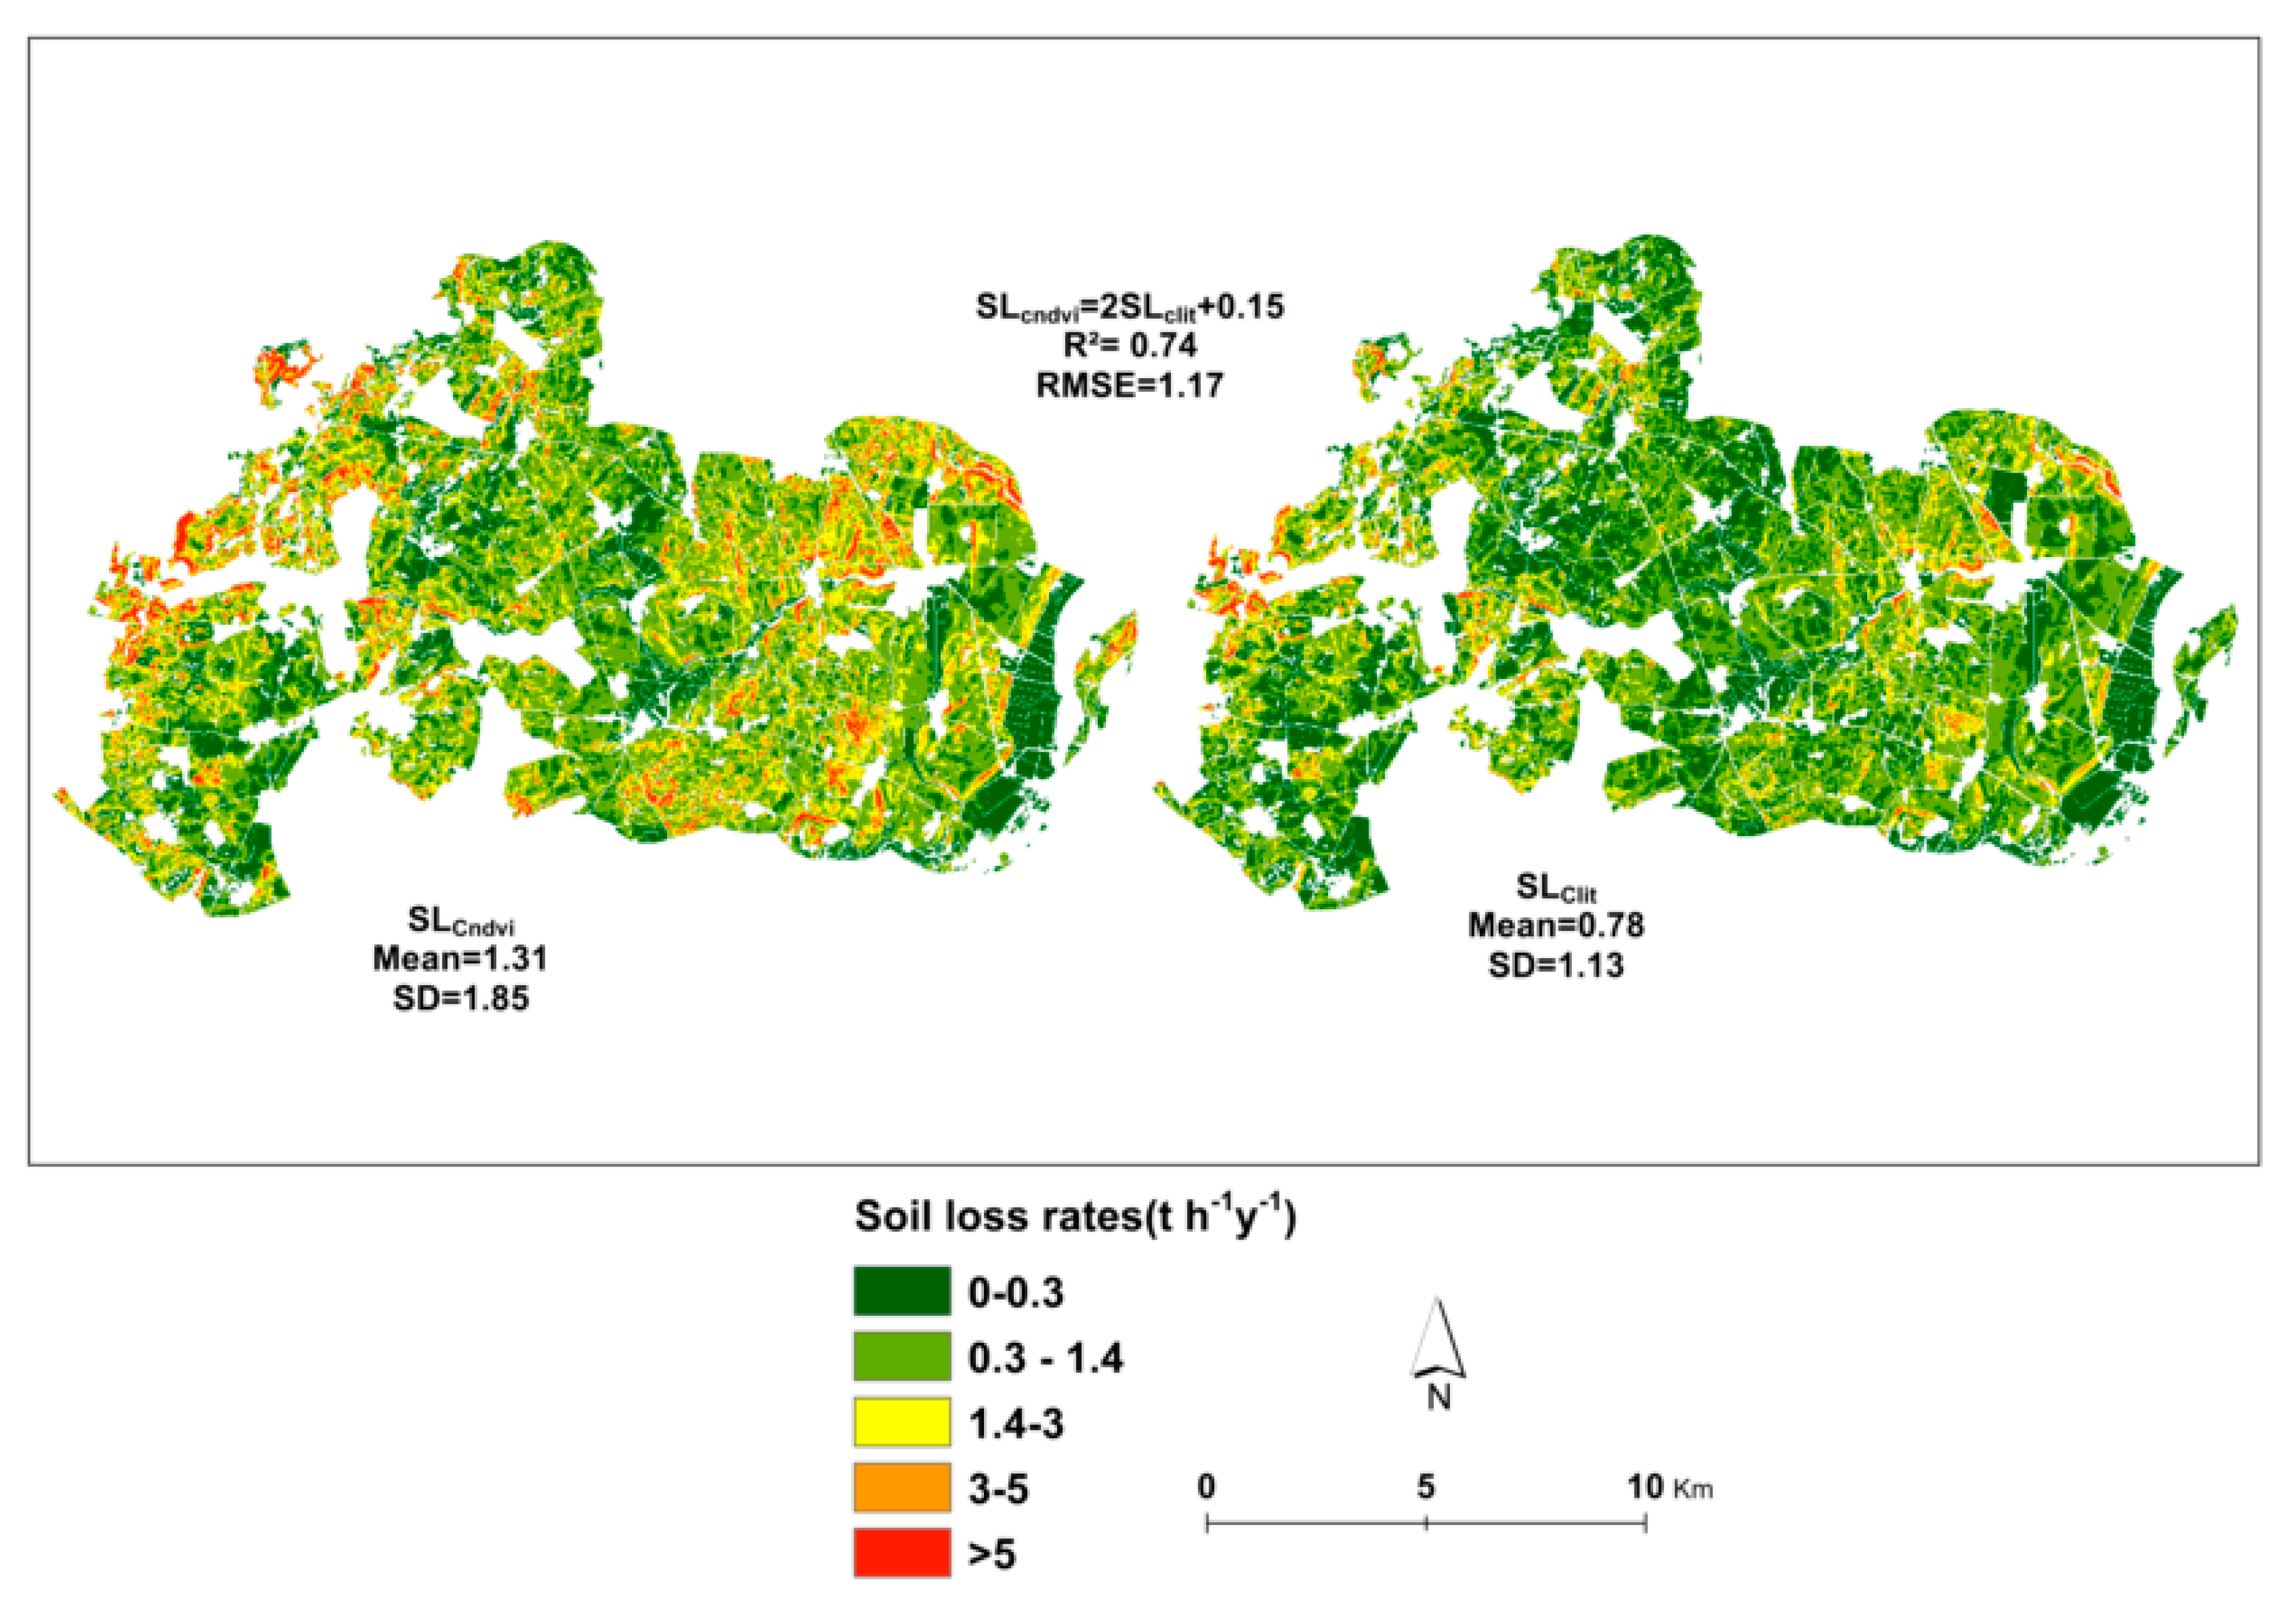
3.2. Potential Soil Erosion Risk Prediction Using the Two C Estimation Methods
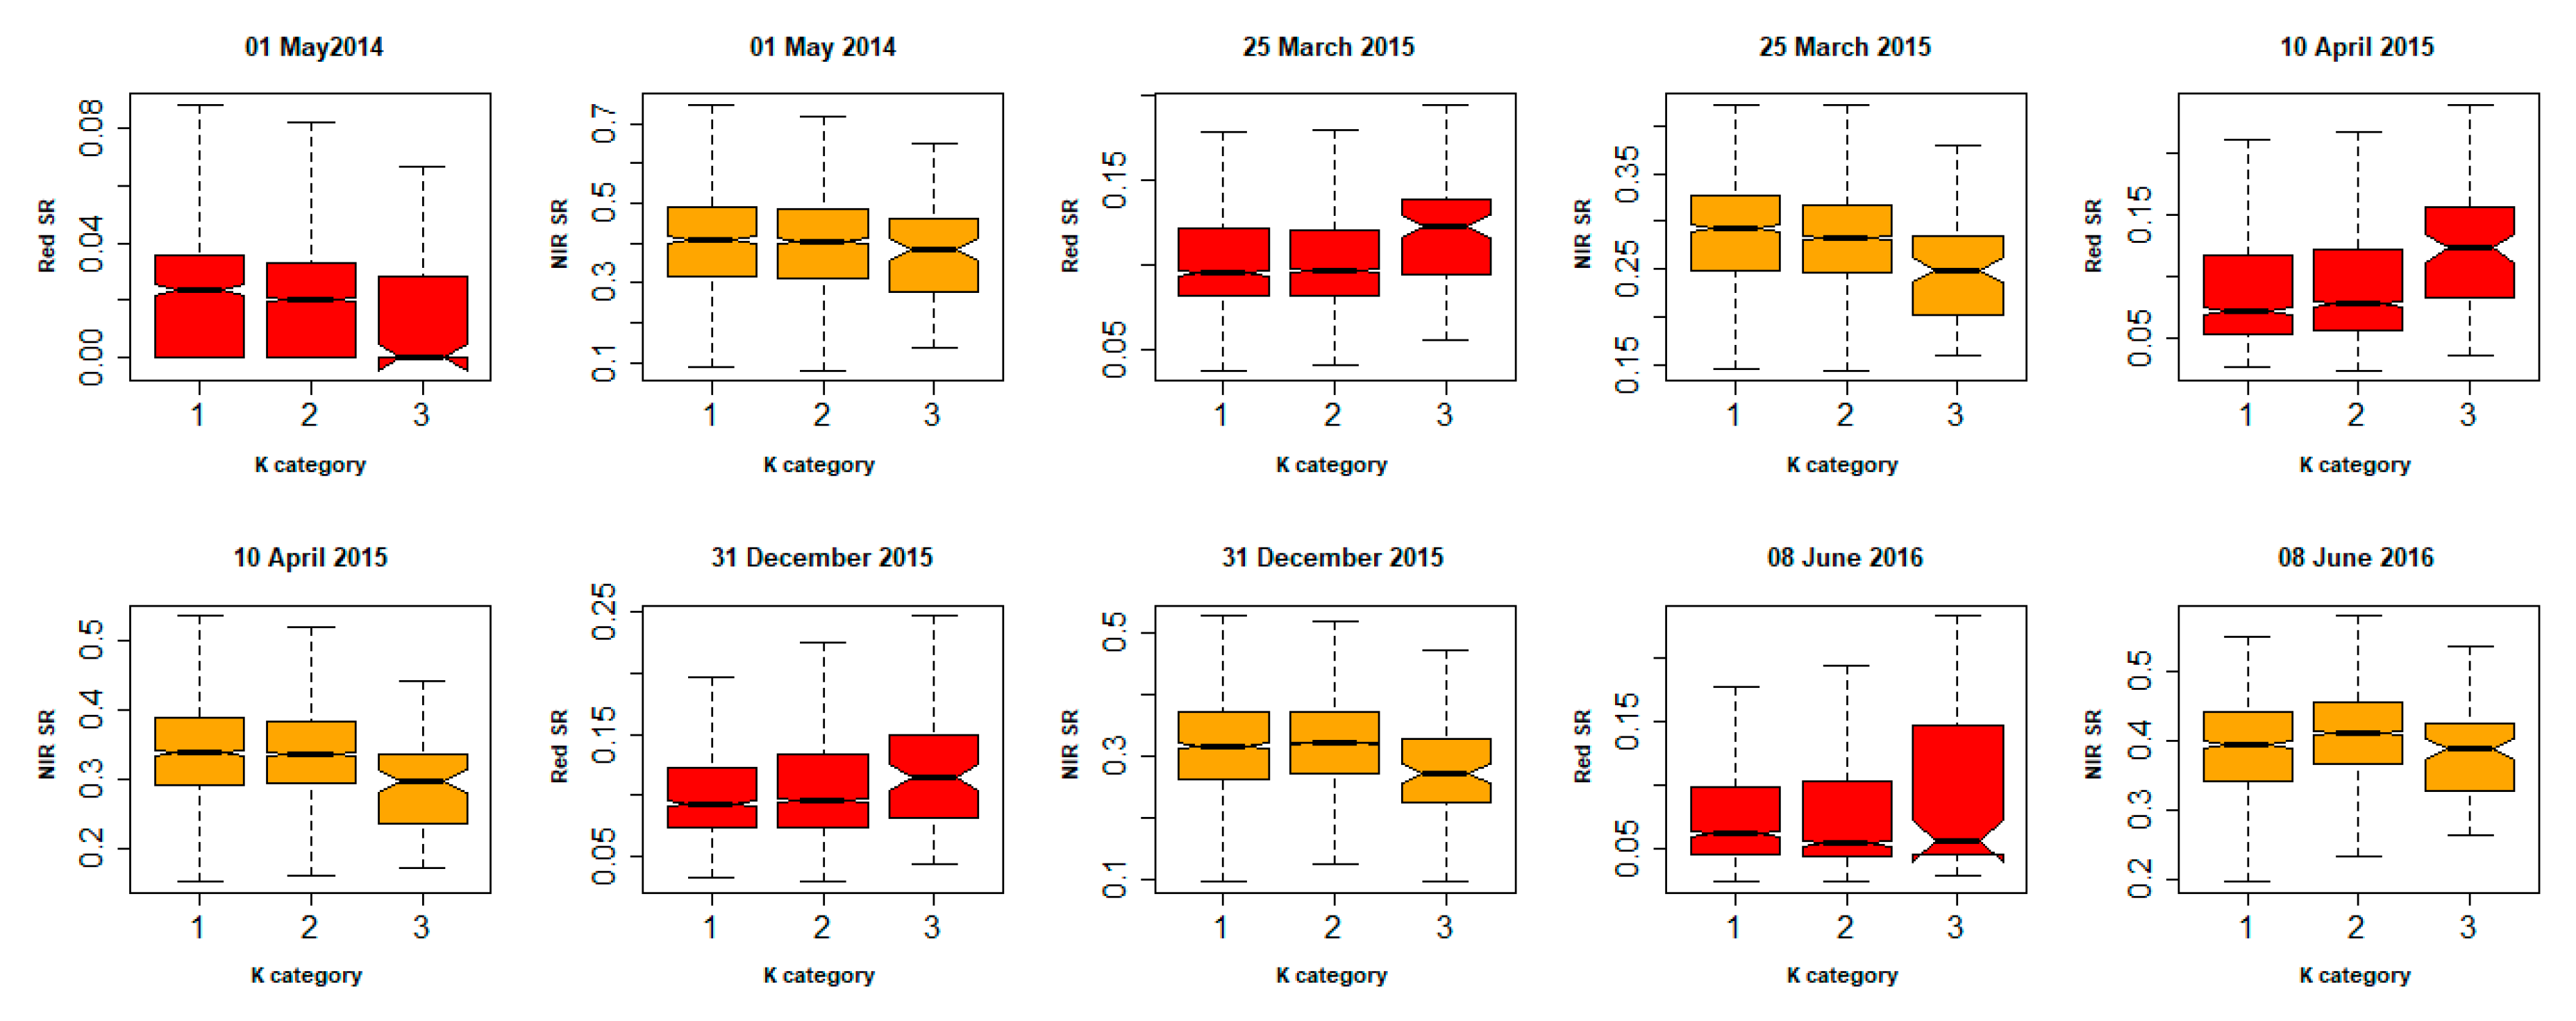
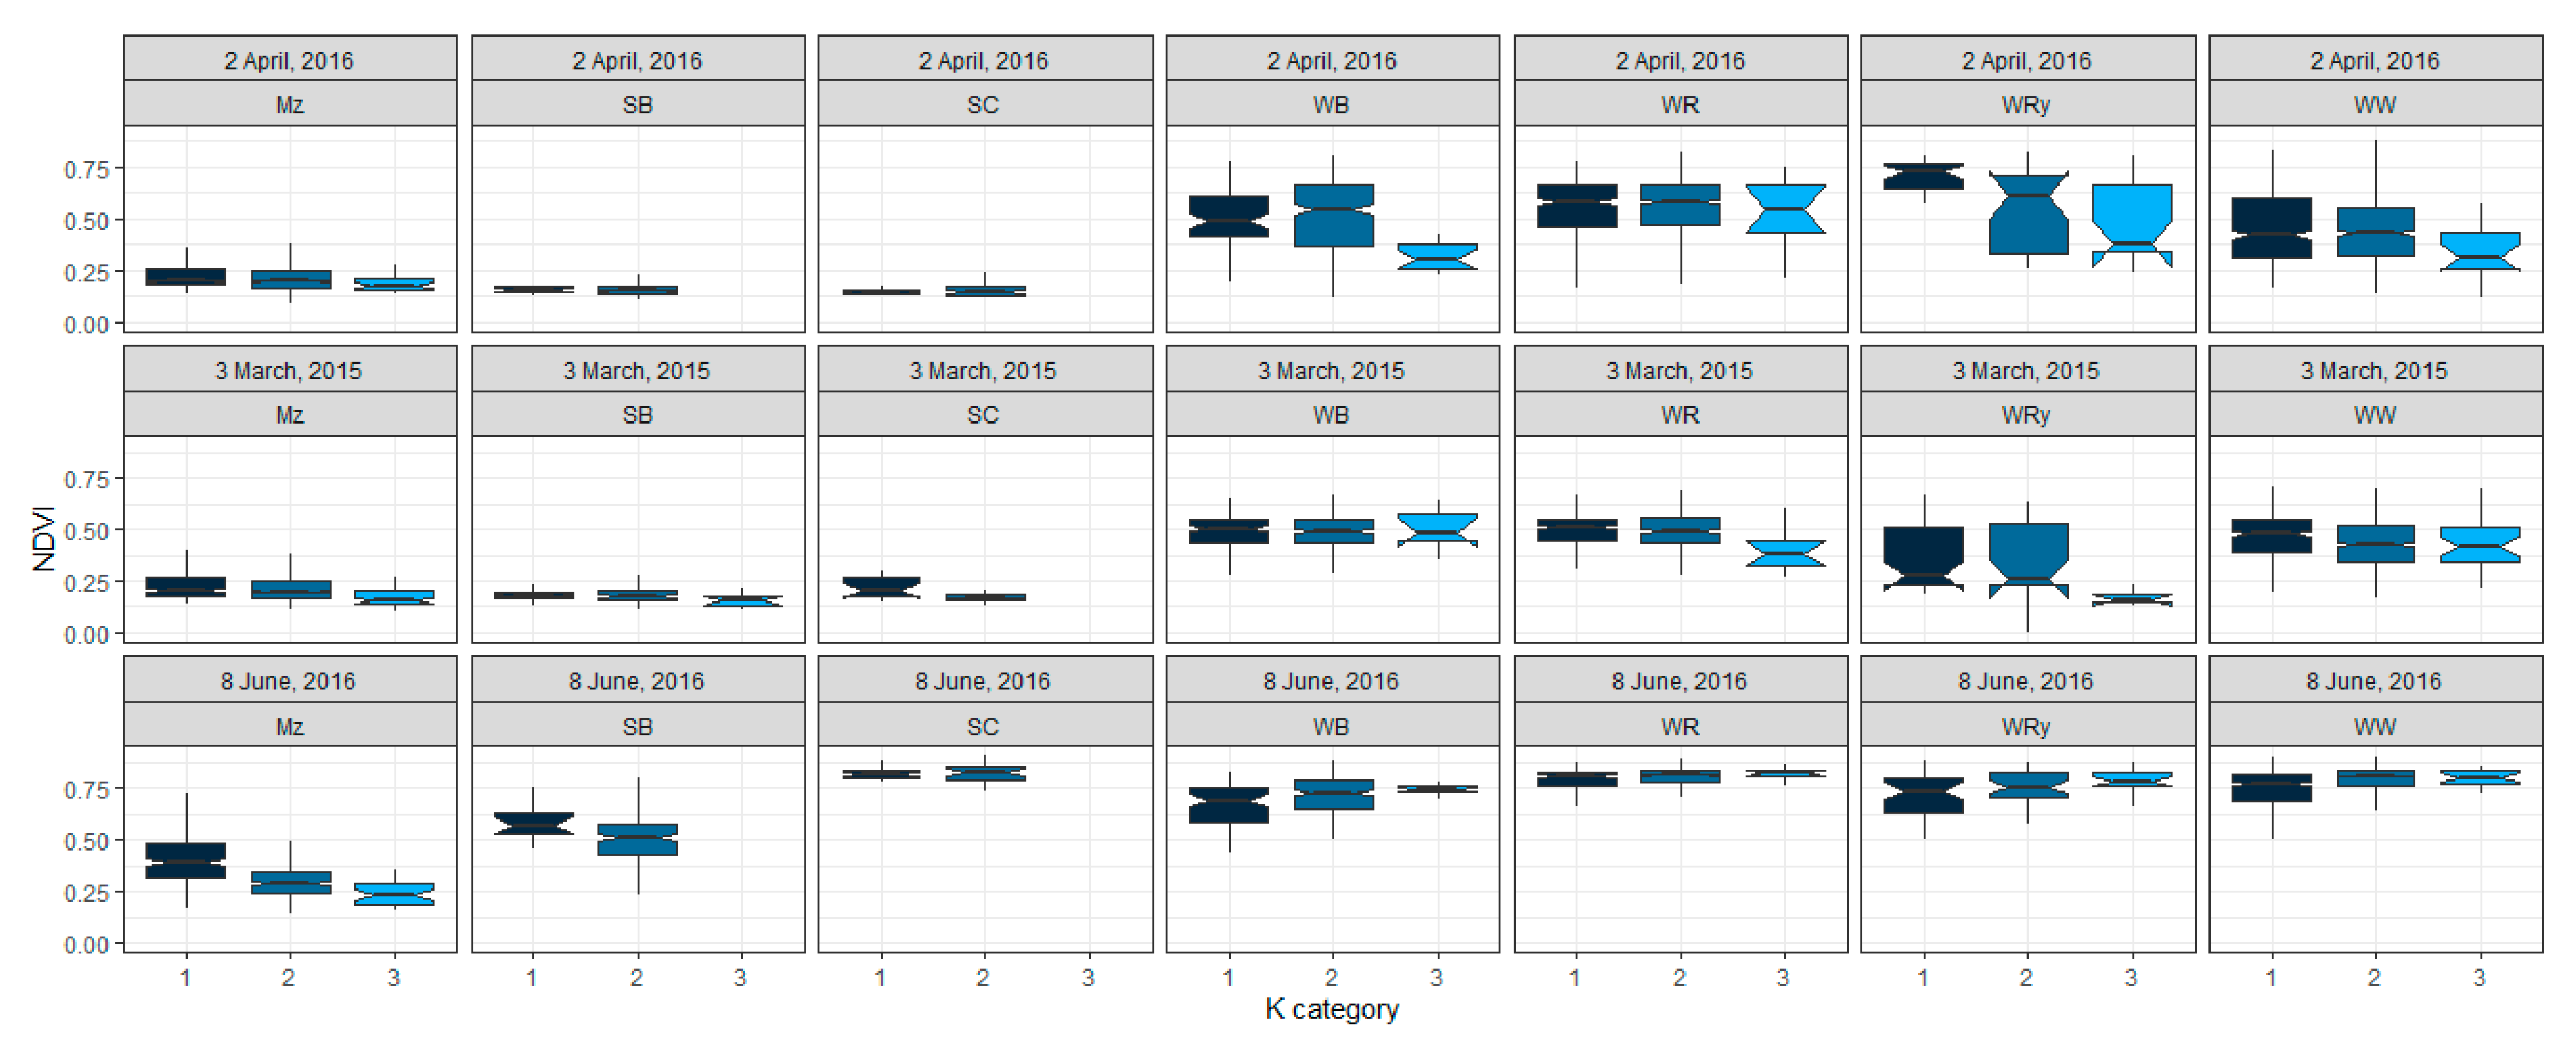
3.3. Influence of Soil Heterogeneity on Cndvi
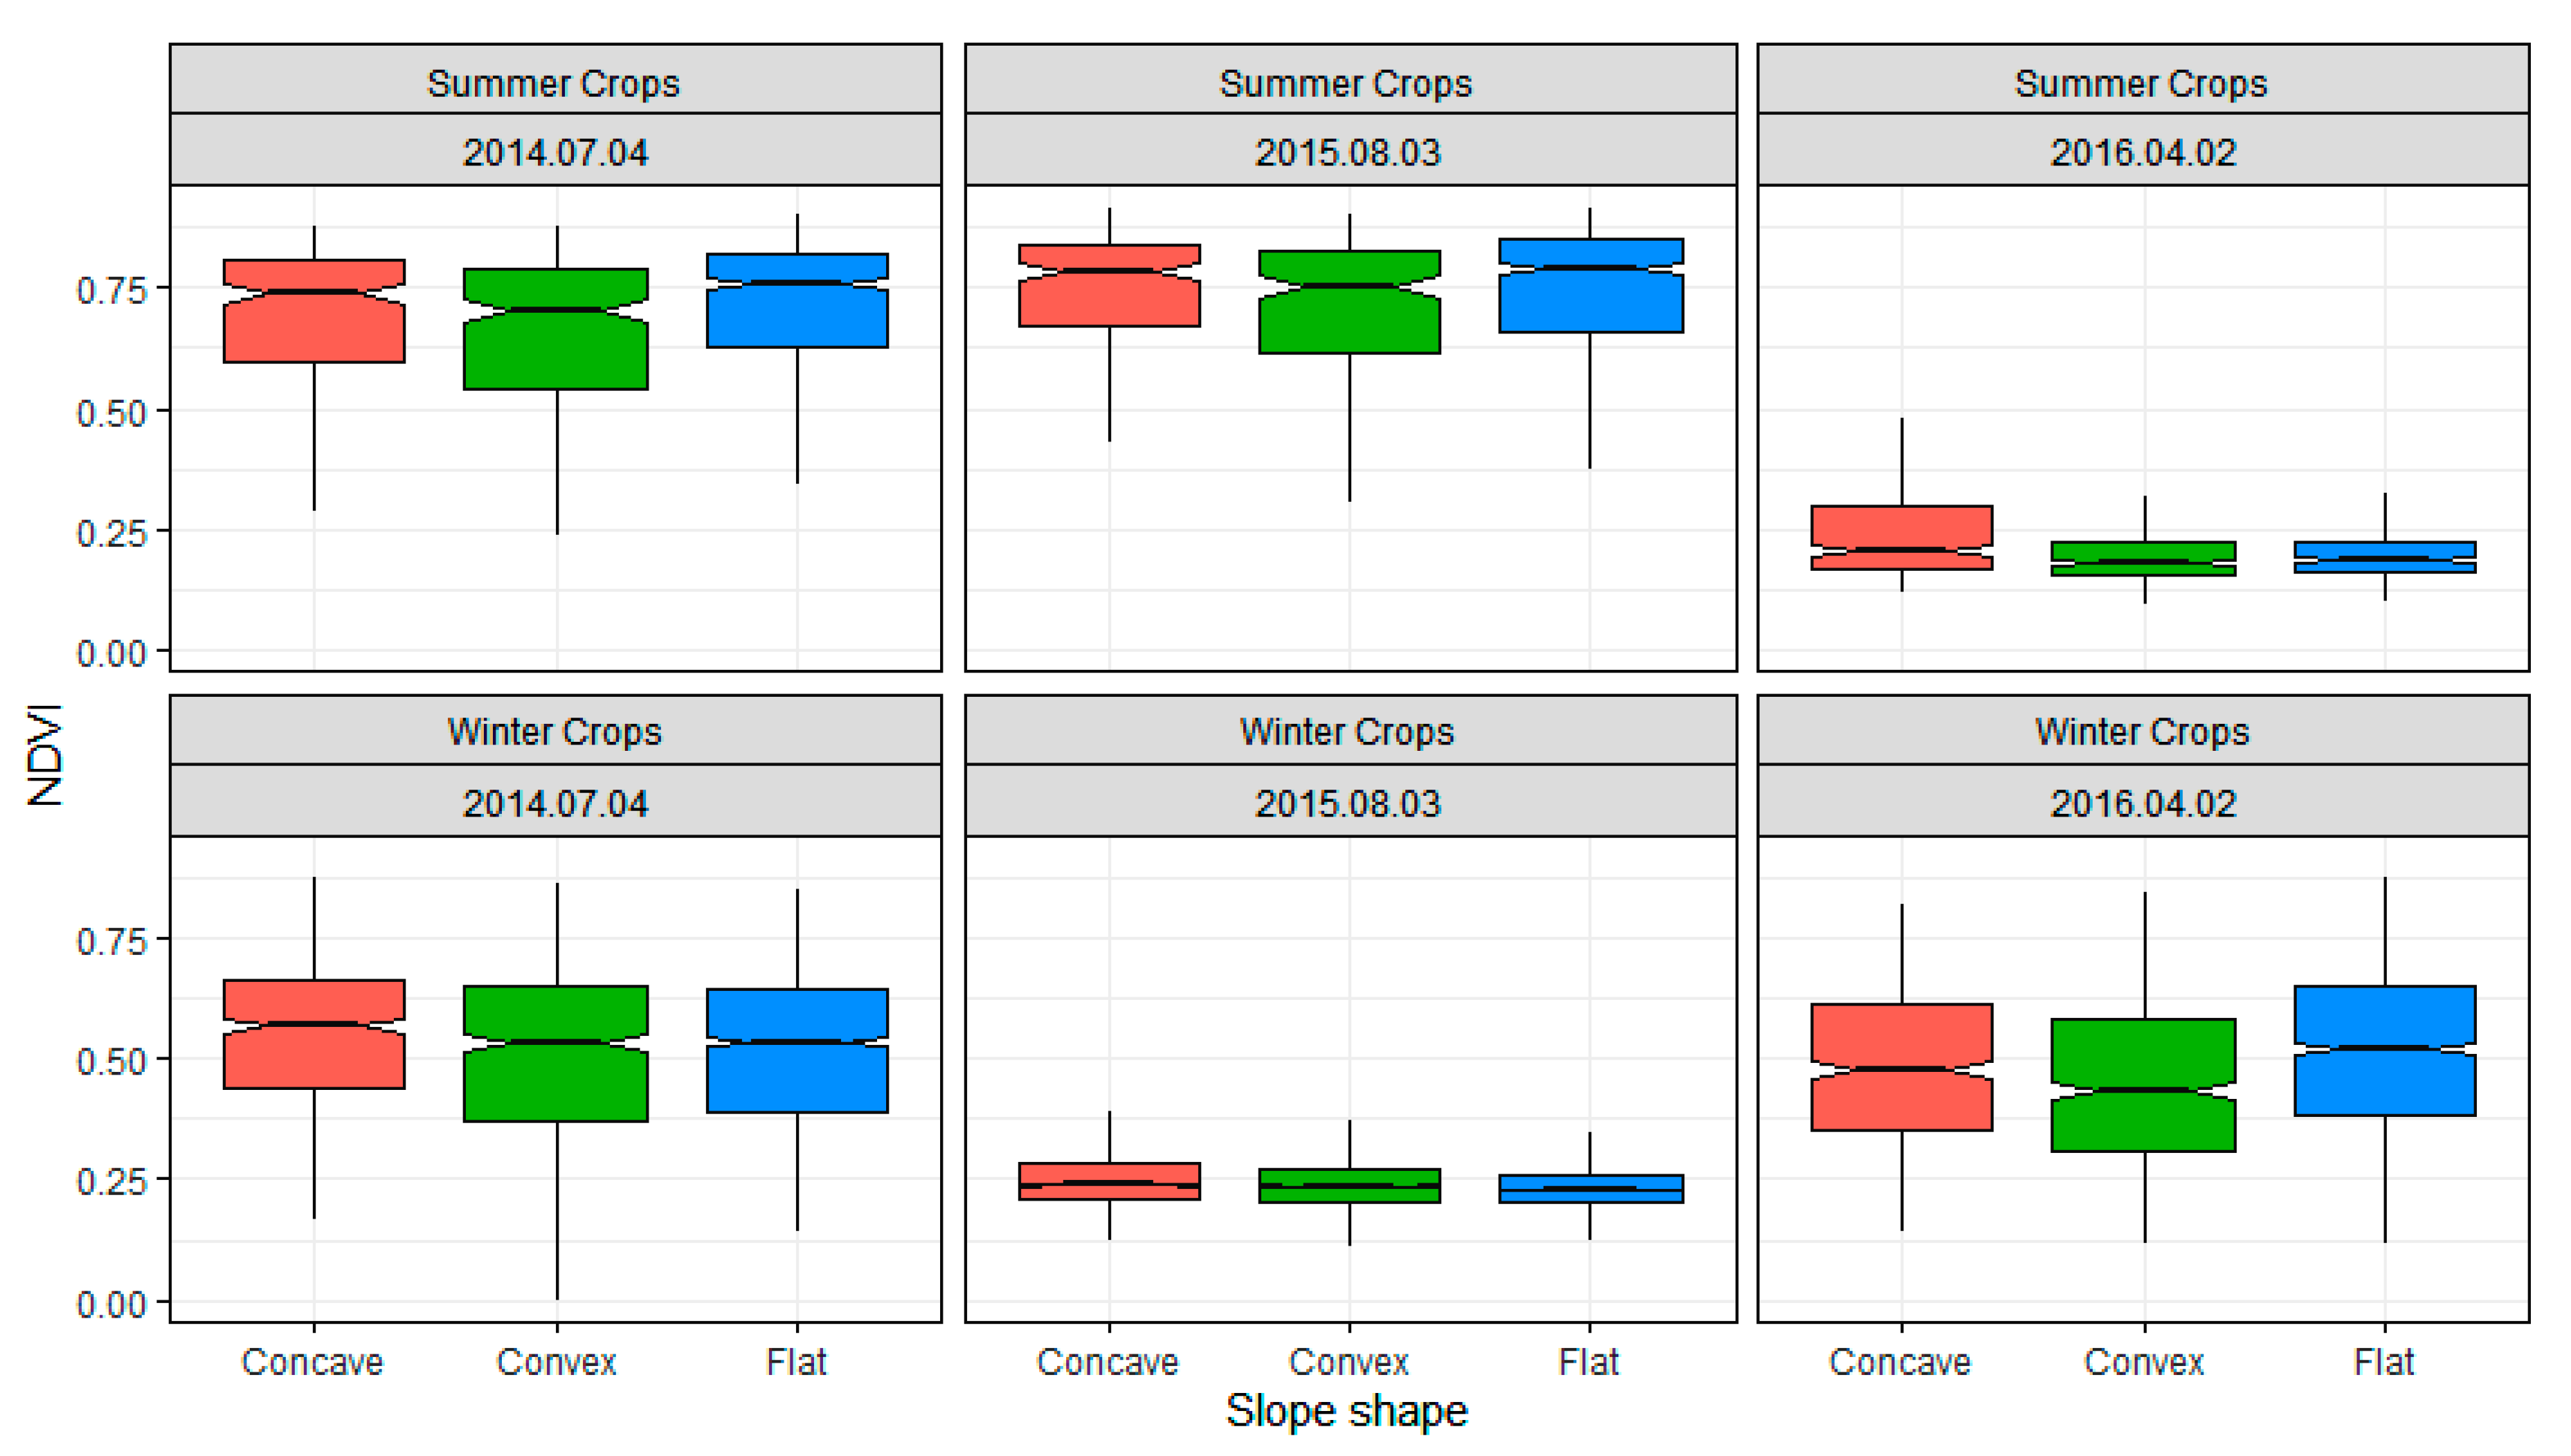
3.4. Influence of Topographic Features on Cndvi
4. Conclusions
Author Contributions
Funding
Acknowledgments
Conflicts of Interest
Appendix A


Appendix B

| Variables | Mean | Standard Deviation | ||
|---|---|---|---|---|
| Sample (n = 5000) | Population | Sample (n = 5000) | Population | |
| Slope | 2.52 | 2.58 | 1.95 | 2.14 |
| K value | 0.2 | 0.19 | 0.07 | 0.07 |
| LS factor | 0.36 | 0.37 | 0.38 | 0.40 |
| Cndvi by scene dates | ||||
| 29 October 2013 | 0.21 | 0.19 | 0.21 | 0.21 |
| 10 February 2014 | 0.26 | 0.25 | 0.20 | 0.19 |
| 30 March 2014 | 0.14 | 0.13 | 0.21 | 0.20 |
| 1 May 2014 | 0.17 | 0.14 | 0.25 | 0.23 |
| 18 June 2014 | 0.07 | 0.07 | 0.12 | 0.11 |
| 4 July 2014 | 0.12 | 0.11 | 0.15 | 0.15 |
| 13 August 2014 | 0.25 | 0.24 | 0.24 | 0.24 |
| 6 September 2014 | 0.32 | 0.31 | 0.27 | 0.27 |
| 8 October 2014 | 0.24 | 0.23 | 0.23 | 0.23 |
| 17 March 2015 | 0.29 | 0.29 | 0.21 | 0.20 |
| 25 March 2015 | 0.22 | 0.21 | 0.19 | 0.18 |
| 10 April 2015 | 0.16 | 0.15 | 0.22 | 0.21 |
| 5 June 2015 | 0.12 | 0.10 | 0.23 | 0.21 |
| 13 June 2015 | 0.09 | 0.08 | 0.17 | 0.16 |
| 4 July 2015 | 0.11 | 0.11 | 0.14 | 0.14 |
| 7 July 2015 | 0.12 | 0.11 | 0.14 | 0.14 |
| 3 August 2015 | 0.38 | 0.37 | 0.25 | 0.25 |
| 3 October 2015 | 0.30 | 0.29 | 0.25 | 0.25 |
| 27 October 2015 | 0.28 | 0.27 | 0.24 | 0.24 |
| 31 December 2015 | 0.21 | 0.2 | 0.22 | 0.22 |
| 2 April 2015 | 0.28 | 0.26 | 0.25 | 0.24 |
| 22 April 2015 | 0.21 | 0.18 | 0.26 | 0.25 |
| 2 May 2015 | 0.22 | 0.17 | 0.30 | 0.28 |
| 9 May 2015 | 0.21 | 0.16 | 0.30 | 0.28 |
| 12 May 2015 | 0.20 | 0.16 | 0.28 | 0.26 |
| 8 June 2015 | 0.09 | 0.08 | 0.17 | 0.17 |
| 23 June 2015 | 0.06 | 0.06 | 0.11 | 0.11 |
References
- Pimentel, D.; Burgess, M. Soil erosion threatens food production. Agriculture 2013, 3, 443–463. [Google Scholar] [CrossRef]
- Šarapatka, B.; Bednář, M. Assessment of potential soil degradation on agricultural land in the Czech Republic. J. Environ. Qual. 2015, 44, 154–161. [Google Scholar] [CrossRef] [PubMed]
- Borrelli, P.; Robinson, D.A.; Fleischer, L.R.; Lugato, E.; Ballabio, C.; Alewell, C.; Meusburger, K.; Modugno, S.; Schütt, B.; Ferro, V.; et al. An assessment of the global impact of 21st century land use change on soil erosion. Nat. Commun. 2017, 8, 2013. [Google Scholar] [CrossRef] [PubMed]
- Alexandridis, T.K.; Sotiropoulou, A.M.; Bilas, G.; Karapetsas, N.; Silleos, N.G. The effects of seasonality in estimating the C-Factor of soil erosion studies. Land. Degrad. Dev. 2015, 26, 596–603. [Google Scholar] [CrossRef]
- Schönbrodt, S.; Saumer, P.; Behrens, T.; Seeber, C.; Scholten, T. Assessing the USLE crop and management factor C for soil erosion modeling in a large mountainous watershed in Central China. J. Earth Sci. 2010, 21, 835–845. [Google Scholar] [CrossRef]
- Wischmeier, W.H.; Smith, D.D. Predicting Rainfall Erosion Losses—A Guide to Conservation Planning; U.S. Department of Agriculture: Washington, WA, USA, 1978.
- Feng, Q.; Zhao, W.; Ding, J.; Fang, X.; Zhang, X. Estimation of the cover and management factor based on stratified coverage and remote sensing indices: A case study in the Loess Plateau of China. J. Soils Sediments 2018, 18, 775–790. [Google Scholar] [CrossRef]
- Gyssels, G.; Poesen, J.; Bochet, E.; Li, Y. Impact of plant roots on the resistance of soils to erosion by water: A review. Prog. Phys. Geogr. 2005, 29, 189–217. [Google Scholar] [CrossRef]
- Arnold, J.G.; Srinivasan, R.; Muttiah, R.S.; Williams, J.R. Large area hydrologic modeling and assessment Part I: Model development. J. Am. Water. Resour. Assoc. 1998, 34, 73–89. [Google Scholar] [CrossRef]
- Neitsch, S.L.; Arnold, J.G.; Kiniry, J.R.; Williams, J.R. Soil and Water Assessment Tool Theoretical Documentation; Version 2005; 2005; Available online: https://swat.tamu.edu/media/1292/SWAT2005theory.pdf (accessed on 27 November 2019).
- Young, R.A.; Onstad, C.A.; Bosch, D.D.; Anderson, W.P. AGNPS—A nonpoint-source pollution model for evaluating agricultural watersheds. J. Soil Water Conserv. 1989, 44, 168–173. [Google Scholar]
- Zhao, W.; Fu, B.; Qiu, Y. An upscaling method for cover-management factor and its application in the loess Plateau of China. Int. J. Environ. Res. Public Health 2013, 10, 4752–4766. [Google Scholar] [CrossRef]
- Morgan, R.P.C. Soil Erosion and Conservation, 3rd ed.; Blackwell Publishing: Oxford, UK, 2005; ISBN 1-4051-1781-8. [Google Scholar]
- Panagos, P.; Borrelli, P.; Meusburger, K.; Alewell, C.; Lugato, E.; Montanarella, L. Estimating the soil erosion cover-management factor at the European scale. Land Use Policy 2015, 48, 38–50. [Google Scholar] [CrossRef]
- Ali, S.A.; Hagos, H. Estimation of soil erosion using USLE and GIS in Awassa Catchment, Rift valley, Central Ethiopia. Geoderma Reg. 2016, 7, 159–166. [Google Scholar] [CrossRef]
- Ganasri, B.P.; Ramesh, H. Assessment of soil erosion by RUSLE model using remote sensing and GIS—A case study of Nethravathi Basin. Geosci. Front. 2016, 7, 953–961. [Google Scholar] [CrossRef]
- Pechanec, V.; Mráz, A.; Benc, A.; Cudlín, P. Analysis of spatiotemporal variability of C-factor derived from remote sensing data. J. Appl. Remote Sens. 2018, 12, 1. [Google Scholar] [CrossRef]
- Schmidt, S.; Alewell, C.; Meusburger, K. Mapping spatio-temporal dynamics of the cover and management factor (C-factor) for grasslands in Switzerland. Remote Sens. Environ. 2018, 211, 89–104. [Google Scholar] [CrossRef]
- Matsushita, B.; Yang, W.; Chen, J.; Onda, Y.; Qiu, G. Sensitivity of the Enhanced Vegetation Index (EVI) and Normalized Difference Vegetation Index (NDVI) to topographic effects: A case study in high-density cypress forest. Sensors 2007, 7, 2636–2651. [Google Scholar] [CrossRef]
- De Jong, S.M. Derivation of vegetative variables from a Landsat TM image for modelling soil erosion. Earth Surf. Process. Landf. 1994, 19, 165–178. [Google Scholar] [CrossRef]
- Montandon, L.M.; Small, E.E. The impact of soil reflectance on the quantification of the green vegetation fraction from NDVI. Remote Sens. Environ. 2008, 112, 1835–1845. [Google Scholar] [CrossRef]
- Vrieling, A. Satellite remote sensing for water erosion assessment: A review. CATENA 2006, 65, 2–18. [Google Scholar] [CrossRef]
- De Asis, A.M.; Omasa, K. Estimation of vegetation parameter for modeling soil erosion using linear Spectral Mixture Analysis of Landsat ETM data. ISPRS J. Photogramm. Remote Sens. 2007, 62, 309–324. [Google Scholar] [CrossRef]
- Wang, G.; Wente, S.; Gertner, G.Z.; Anderson, A. Improvement in mapping vegetation cover factor for the universal soil loss equation by geostatistical methods with Landsat Thematic Mapper images. Int. J. Remote Sens. 2002, 23, 3649–3667. [Google Scholar] [CrossRef]
- Deng, Y.; Chen, X.; Chuvieco, E.; Warner, T.; Wilson, J.P. Multi-scale linkages between topographic attributes and vegetation indices in a mountainous landscape. Remote Sens. Environ. 2007, 111, 122–134. [Google Scholar] [CrossRef]
- Ding, Y.; Zhao, K.; Zheng, X.; Jiang, T. Temporal dynamics of spatial heterogeneity over cropland quantified by time-series NDVI, near infrared and red reflectance of Landsat 8 OLI imagery. Int. J. Appl. Earth Obs. 2014, 30, 139–145. [Google Scholar] [CrossRef]
- Borrelli, P.; Meusburger, K.; Ballabio, C.; Panagos, P.; Alewell, C. Object-oriented soil erosion modelling: A possible paradigm shift from potential to actual risk assessments in agricultural environments. Land Degrad. Dev. 2018, 29, 1270–1281. [Google Scholar] [CrossRef]
- Gitelson, A.A.; Kaufman, Y.J.; Stark, R.; Rundquist, D. Novel algorithms for remote estimation of vegetation fraction. Remote Sens. Environ. 2002, 80, 76–87. [Google Scholar] [CrossRef]
- Jackson, R.D.; Pinter, P.J. Spectral response of architecturally different wheat canopies. Remote Sens. Environ. 1986, 20, 43–56. [Google Scholar] [CrossRef]
- Lischeid, G.; Kalettka, T.; Merz, C.; Steidl, J. Monitoring the phase space of ecosystems: Concept and examples from the Quillow catchment, Uckermark. Ecol. Indic. 2016, 65, 55–65. [Google Scholar] [CrossRef]
- Deumlich, D.; Schmidt, R.; Sommer, M. A multiscale soil-landform relationship in the glacial-drift area based on digital terrain analysis and soil attributes. J. Plant Nutr. Soil Sci. 2010, 173, 843–851. [Google Scholar] [CrossRef]
- Wulf, M.; Jahn, U.; Meier, K. Land cover composition determinants in the Uckermark (NE Germany) over a 220-year period. Reg. Environ. Chang. 2016, 16, 1793–1805. [Google Scholar] [CrossRef]
- WRB-IUSS. World Reference Base for Soil Resources 2014, Udate 2015. International Soil Classification System for Naming Soils and Creating Legends for Soil Maps; World Soil Resources Report 106; WRB-IUSS; FAO: Rome, Italy, 2014. [Google Scholar]
- Vogel, E.; Deumlich, D.; Kaupenjohann, M. Bioenergy maize and soil erosion—Risk assessment and erosion control concepts. Geoderma 2016, 261, 80–92. [Google Scholar] [CrossRef]
- Wetter Online. Climate in the Uckermark Region. Available online: https://www.wetteronline.de/?pcid=pc_rueckblick_climate&gid=10291&iid=10289&pid=p_rueckblick_climatecalculator&sid=Default&var=NS&analysis=annual&startyear=1992&endyear=2016&iid=10289 (accessed on 30 November 2019).
- Deumlich, D.; Mioduszewski, W.; Kocmit, A. Analysis of sediment and nutrient loads due to soil erosion in rivers in the Odra catchment. In Agricultural Effects on Ground and Surface Waters: Research at the Edge of Science and Society, Proceedings of the Symposium Held at Wageningen, Wageningen, The Netherlands, October 2000; Joop, S., Frans, C., Jaap, W., Eds.; IAHS Press, Center for Ecology and Hydrology: Wallingford, UK, 2002; pp. 279–286. ISBN 0144-7815. [Google Scholar]
- Nicola, L.-J.; Dietmar, S.; Annette, O. Analysing data of the Integrated Administration and Control System (IACS) to detect patterns of agricultural land-use change at municipality level. Landsc. Online 2016, 48, 1–24. [Google Scholar] [CrossRef]
- Steinmann, H.-H.; Dobers, E.S. Spatio-temporal analysis of crop rotations and crop sequence patterns in Northern Germany: Potential implications on plant health and crop protection. J. Plant Dis. Protect. 2013, 120, 85–94. [Google Scholar] [CrossRef]
- Bodenbeschaffenheit—Ermittlung der Erosionsgefährdung von Böden durch Wasser mit Hilfe der ABAG. Soil Quality—Determination of Soil Erosion Risk of Soils by Water Using ABAG; DIN 19708; Deutsches Institut für Normung e.V.: Berlin, Germany, 2005. (In German)
- Deumlich, D. Erosive niederschläge und ihre eintrittswahrscheinlichkeit im nordosten deutschlands. Meteorol. Z. 1999, 8, 155–161. [Google Scholar] [CrossRef]
- Tucker, C.J. Red and photographic infrared linear combinations for monitoring vegetation. Remote Sens. Environ. 1979, 8, 127–150. [Google Scholar] [CrossRef]
- Van der Knijff, J.M.; Jones, R.J.A.; Montanarella, L. Soil Erosion Risk Assessment in Italy; EUR 19022 EN.; European Soil Bureau, Joint Research Center of the European Commission: Ispra, Italy, 1999. [Google Scholar]
- Durigon, V.L.; Carvalho, D.F.; Antunes, M.A.H.; Oliveira, P.T.S.; Fernandes, M.M. NDVI time series for monitoring RUSLE cover management factor in a tropical watershed. Int. J. Remote Sens. 2014, 35, 441–453. [Google Scholar] [CrossRef]
- Gupta, S.; Kumar, S. Simulating climate change impact on soil erosion using RUSLE model—A case study in a watershed of mid-Himalayan landscape. J. Earth Syst. Sci. 2017, 126, 255. [Google Scholar] [CrossRef]
- Vatandaşlar, C.; Yavuz, M. Modeling cover management factor of RUSLE using very high-resolution satellite imagery in a semiarid watershed. Environ. Earth Sci. 2017, 76, 267. [Google Scholar] [CrossRef]
- Vijith, H.; Seling, L.W.; Dodge-Wan, D. Effect of cover management factor in quantification of soil loss: Case study of Sungai Akah subwatershed, Baram River basin Sarawak, Malaysia. Geocarto Int. 2018, 33, 505–521. [Google Scholar] [CrossRef]
- Gutzler, C.; Helming, K.; Balla, D.; Dannowski, R.; Deumlich, D.; Glemnitz, M.; Knierim, A.; Mirschel, W.; Nendel, C.; Paul, C.; et al. Agricultural land use changes—A scenario-based sustainability impact assessment for Brandenburg, Germany. Ecol. Indic. 2015, 48, 505–517. [Google Scholar] [CrossRef]
- Deumlich, D.; Mioduszewski, W.; Kajewski, I.; Tippl, M.; Dannowski, R. GIS-based risk assessment for identifying source areas of non-point nutrient emissions by water erosion (Odra Basin and sub catchment Uecker). Arch. Agron. Soil Sci. 2005, 51, 447–458. [Google Scholar] [CrossRef]
- Fischer, F.; Hauck, J.; Brandhuber, R.; Weigl, E.; Maier, H.; Auerswald, K. Spatio-temporal variability of erosivity estimated from highly resolved and adjusted radar rain data (RADOLAN). Agric. For. Meteorol. 2016, 223, 72–80. [Google Scholar] [CrossRef]
- Hickey, R. Slope angle and slope length solutions for GIS. Cartography 2000, 29, 1–8. [Google Scholar] [CrossRef]
- Nearing, M.A. A Single, continuous function for slope steepness influence on soil loss. Soil Sci. Soc. Am. J. 1997, 61, 917–919. [Google Scholar] [CrossRef]
- R Core Team. R: A language and Environment for Statistical Computing; R Foundation for Statistical Computing: Vienna, Austria, 2019. [Google Scholar]
- Wang, G.; Gertner, G.; Fang, S.; Anderson, A.B. Mapping multiple variables for predicting soil loss by geostatistical methods with TM images and a slope map. Photogramm. Eng. Remote Sens. 2003, 69, 889–898. [Google Scholar] [CrossRef]
- Stata User’s Guide. Available online: https://www.stata.com/manuals13/u.pdf (accessed on 7 June 2018).
- Deumlich, D.; Ellerbrock, R.H.; Frielinghaus, M. Estimating carbon stocks in young moraine soils affected by erosion. CATENA 2018, 162, 51–60. [Google Scholar] [CrossRef]
- Almagro, A.; Thomé, T.C.; Colman, C.B.; Pereira, R.B.; Marcato Junior, J.; Rodrigues, D.B.B.; Oliveira, P.T.S. Improving cover and management factor (C-factor) estimation using remote sensing approaches for tropical regions. Int. Soil Water Conserv. Res. 2019, 7, 325–334. [Google Scholar] [CrossRef]
- Bargiel, D.; Herrmann, S.; Jadczyszyn, J. Using high-resolution radar images to determine vegetation cover for soil erosion assessments. J. Environ. Manag. 2013, 124, 82–90. [Google Scholar] [CrossRef]
- Truckenbrodt, S.C.; Schmullius, C.C. Seasonal evolution of soil and plant parameters on the agricultural Gebesee test site: A database for the set-up and validation of EO-LDAS and satellite-aided retrieval models. Earth Syst. Sci. Data 2018, 10, 525–548. [Google Scholar] [CrossRef]
- Verheijen, F.G.A.; Jones, R.J.A.; Rickson, R.J.; Smith, C.J. Tolerable versus actual soil erosion rates in Europe. Earth Sci. Rev. 2009, 94, 23–38. [Google Scholar] [CrossRef]
- Glemnitz, M.; Wurbs, A.; Roth, R. Derivation of regional crop sequences as an indicator for potential GMO dispersal on large spatial scales. Ecol. Indic. 2011, 11, 964–973. [Google Scholar] [CrossRef]
- Gericke, A.; Kiesel, J.; Deumlich, D.; Venohr, M. Recent and future changes in rainfall erosivity and implications for the soil erosion risk in Brandenburg, NE Germany. Water 2019, 11, 904. [Google Scholar] [CrossRef]
- Huete, A.R.; Jackson, R.D.; Post, D.F. Spectral response of a plant canopy with different soil backgrounds. Remote Sens. Environ. 1985, 17, 37–53. [Google Scholar] [CrossRef]
- Huete, A.R.; Didan, K.; Miura, T.; Rodriguez, E.; Gao, X.; Ferreira, L. Overview of the radiometric and biophysical performance of the MODIS vegetation indices. Remote Sens. Environ. 2002, 83, 195–213. [Google Scholar] [CrossRef]
- Rieke-Zapp, D.H.; Nearing, M.A. Slope shape effects on erosion. Soil Sci. Soc. Am. J. 2005, 69, 1463. [Google Scholar] [CrossRef]
- Sensoy, H.; Kara, O. Slope shape effect on runoff and soil erosion under natural rainfall conditions. iForest 2014, 7, 110–114. [Google Scholar] [CrossRef]


| Crop Type | Cropping Stages | Annual C Factor * | |||||||||||
|---|---|---|---|---|---|---|---|---|---|---|---|---|---|
| Tillage (S1) | Seedbed (S2) | 10% Cover (S3) | 50% Cover (S4) | 75% Cover (S5) | Harvest (S6) | ||||||||
| Dates | SLR | Dates | SLR | Dates | SLR | Dates | SLR | Dates | SLR | Dates | SLR | ||
| WW | 09/20 | 0.32 | 09/22 | 0.46 | 10/20 | 0.38 | 04/01 | 0.03 | 04/15 | 0.01 | 08/05 | 0.02 | 0.09 |
| WB | 08/30 | 0.32 | 09/09 | 0.46 | 09/23 | 0.38 | 10/30 | 0.03 | 04/01 | 0.01 | 07/16 | 0.02 | 0.08 |
| WRy | 08/05 | 0.32 | 08/16 | 0.46 | 09/01 | 0.38 | 09/20 | 0.03 | 10/20 | 0.01 | 07/29 | 0.02 | 0.04 |
| WR | 08/10 | 0.32 | 08/20 | 0.46 | 09/01 | 0.38 | 09/20 | 0.03 | 10/10 | 0.01 | 08/05 | 0.02 | 0.11 |
| Mz | 10/20 | 0.32 | 04/15 | 0.94 | 05/20 | 0.45 | 06/05 | 0.12 | 06/20 | 0.09 | 09/15 | 0.44 | 0.34 |
| SC | 10/01 | 0.32 | 03/03 | 0.46 | 04/10 | 0.38 | 05/02 | 0.03 | 05/15 | 0.01 | 08/03 | 0.02 | 0.05 |
| SB | 10/01 | 0.32 | 04/05 | 0.85 | 05/18 | 0.45 | 06/05 | 0.05 | 06/15 | 0.03 | 10/01 | 0.44 | 0.22 |
| Scene dates a | 29 October 2013 2 | 10 February 2014 1 | 30 March 2014 1 | 1 May 2014 1 | 10 June 2014 2; 18 June 2014 1 | 4 July 2014 1 | 13 August 2014 2 | 6 September 2014 1b | 8 October 2014 1 | 17 March 2015 1; 25 March 2015 2 | 10 April 2015 2 | 5 June 2015 1; 13 June 2015 2 | 4 July 2015 3 | 3 August 2015 3 | 15 September 2015 3b | 3 October 2015 2 | 27 October 2015 1 | 31 December 2015 3 | 2 April 2016 3 | 22 April 2016 3 | 2 May 3; 9 May 3; 12 May 2016 3 | 8 June 2; 11 June 2016 3 | 23 June 2016 1; 21 July 2016 3 |
| Monthly R proportion | 0.03 | 0.05 | 0.05 | 0.1 | 0.17 | 0.2 | 0.14 | 0.11 | 0.03 | 0.05 | 0.02 | 0.17 | 0.2 | 0.14 | 0.11 | 0.03 | 0.03 | 0.05 | 0.02 | 0.02 | 0.1 | 0.17 | 0.17 |
| Landcover data used | 2014 IACS data | 2015 IACS data | 2016 IACS data | ||||||||||||||||||||
| Crop types | Expected cropping stages of the respective crops | ||||||||||||||||||||||
| WW | S3 | S3 | S4 | S5 | S5 | S5 | S6 | S6 | S2 | S3 | S4 | S5 | S5 | S6 | S1 | S2 | S3 | S3 | S4 | S5 | S5 | S5 | S5 |
| WB | S3 | S4 | S5 | S5 | S5 | S5 | S6 | S1 | S3 | S4 | S5 | S5 | S5 | S6 | S2 | S3 | S4 | S4 | S5 | S5 | S5 | S5 | S5 |
| WRy | S5 | S5 | S5 | S5 | S5 | S5 | S1 | S2 | S4 | S4 | S5 | S5 | S5 | S6 | S3 | S4 | S5 | S5 | S5 | S5 | S5 | S5 | S5 |
| WR | S5 | S5 | S5 | S5 | S5 | S5 | S1 | S2 | S4 | S5 | S5 | S5 | S5 | S6 | S3 | S4 | S5 | S5 | S5 | S5 | S5 | S5 | S5 |
| SC | S2 | S2 | S3 | S4 | S5 | S5 | S6 | S6 | S1 | S2 | S3 | S5 | S5 | S6 | S6 | S1 | S1 | S1 | S2 | S3 | S4 | S5 | S5 |
| Mz | S1 | S1 | S1 | S2 | S4 | S5 | S5 | S5 | S1 | S2 | S2 | S4 | S5 | S5 | S6 | S6 | S1 | S1 | S2 | S2 | S3 | S4 | S5 |
| SB | S1 | S1 | S1 | S3 | S4 | S5 | S5 | S5 | S1 | S1 | S2 | S4 | S5 | S5 | S5 | S6 | S1 | S1 | S1 | S2 | S3 | S4 | S5 |
| Variables | Description | Data Type |
|---|---|---|
| Dependent variable | ||
| Cndvi | Cover management factor derived from satellite images (Equation (3)) | Continuous |
| Biophysical variables | ||
| Soil | Soil erodibility (K value) (Equation (6)) | Continuous |
| Slope | Slope steepness (degree) calculated from 5 m DEM using ArcMap 10.2.2 | Continuous |
| Aspect | Measure of north - south facing slopes | Continuous |
| Slope positions | Calculated based on topographic position indexing [31]. | Categorical (coded 1 as summit (reference); 2 is upper slope; 4, flat slope; 5, lower slope; 6, depression or valley) |
| Slope shapes | Measure of land undulation [31]. | Categorical (coded 0 as flat (reference); 1 as convex; 2 as concave) |
| Crop types | Type of Crops grown at a given data point (identified using IACS data) | Categorical (1 is WW (reference); 2 is WB; 3 is Mz;4 is SC; 5 is WR; 6 is WRy; 7 is SB) |
| Scene Dates | Monthly Mean | |||
|---|---|---|---|---|
| CndviM | ClitM | Correlation Coefficients (r) | RMSE | |
| 10 October 2013 | 0.205 | 0.010 | 0.53 | 0.185 |
| 2 February 2014 | 0.252 | 0.010 | 0.70 | 0.144 |
| 3 March 2014 | 0.147 | 0.005 | 0.89 | 0.098 |
| 1 May 2014 | 0.158 | 0.013 | 0.88 | 0.119 |
| 10 June 2014 | 0.040 | 0.004 | 0.80 | 0.050 |
| 18 June 2014 | 0.066 | 0.004 | 0.67 | 0.084 |
| 4 July 2014 | 0.100 | 0.005 | −0.05 | 0.136 |
| 8 August 2014 | 0.240 | 0.006 | 0.08 | 0.241 |
| 6 September 2014 | 0.312 | 0.011 | 0.42 | 0.251 |
| 8 October 2014 | 0.237 | 0.007 | 0.36 | 0.216 |
| 17 March 2015 | 0.284 | 0.004 | 0.74 | 0.144 |
| 25 March 2015 | 0.216 | 0.004 | 0.79 | 0.118 |
| 10 April 2015 | 0.159 | 0.003 | 0.80 | 0.132 |
| 5 June 2015 | 0.112 | 0.005 | 0.90 | 0.095 |
| 13 June 2015 | 0.083 | 0.005 | 0.88 | 0.076 |
| 4 July 2015 | 0.113 | 0.005 | 0.40 | 0.125 |
| 3 August 2015 | 0.381 | 0.004 | −0.58 | 0.202 |
| 15 September 2015 | 0.350 | 0.020 | −0.32 | 0.422 |
| 3 October 2015 | 0.295 | 0.008 | 0.39 | 0.229 |
| 27 October 2015 | 0.276 | 0.006 | 0.55 | 0.199 |
| 31 December 2015 | 0.205 | 0.008 | 0.56 | 0.186 |
| 2 April 2016 | 0.277 | 0.002 | 0.71 | 0.175 |
| 22 April 2016 | 0.166 | 0.004 | 0.74 | 0.167 |
| 2 May 2016 | 0.186 | 0.016 | 0.89 | 0.133 |
| 9 May 2016 | 0.177 | 0.016 | 0.93 | 0.107 |
| 12 May 2016 | 0.171 | 0.016 | 0.91 | 0.114 |
| 8 June 2016 | 0.092 | 0.005 | 0.84 | 0.094 |
| 11 June 2016 | 0.059 | 0.005 | 0.66 | 0.096 |
| 23 June 2016 | 0.058 | 0.007 | −0.02 | 0.110 |
| Scene Dates | Biophysical Variables | |||||||||||||||||
|---|---|---|---|---|---|---|---|---|---|---|---|---|---|---|---|---|---|---|
| Slope Positions | Slope Shapes | Crop Types (with Reference to WW) | ||||||||||||||||
| K Factor | Slope | Aspect | LS Factor | Upper Slope | Flat Slope | Lower Slope | Valley | Convex | Concave | WB | Mz | SC | WR | WRy | SB | Constant | ||
| R2 | Coef. | Coef. | Coef. | Coef. | Coef. | Coef. | Coef. | Coef. | Coef. | Coef. | Coef. | Coef. | Coef. | Coef. | Coef. | Coef. | Coef. | |
| 29 October 2013 | 0.4 | 0.06 | 0.00 | 0.00 | 0.00 | 0.01 | 0.00 | 0.00 | 0.01 | 0.00 | −0.12 | −0.11 * | 0.03 * | 0.14 * | −0.24 * | −0.02 | 0.21 * | 0.25 * |
| 10 February 2014 | 0.6 | 0.08 | 0.00 | 0.00 | 0.00 | 0.02 | 0.00 | 0.01 | 0.01 | 0.01 * | 0.01 | −0.10 * | 0.23 * | 0.25 * | −0.17 * | −0.13* | 0.29 * | 0.22 * |
| 30 March 2014 | 0.8 | 0.05 | 0.00 | 0.00 | 0.01 | 0.00 | 0.00 | 0.00 | 0.00 | 0.01 * | 0.01 | −0.03 * | 0.40 * | 0.35 * | −0.05 * | −0.03 * | 0.47 * | 0.04 * |
| 1 May 2014 | 0.8 | 0.16 * | −0.00 | 0.00 | 0.01 | 0.00 | −0.00 | −0.01 | 0.01 | 0.00 | 0.00 | −0.02 * | 0.49 * | 0.02 | 0.06 * | −0.01 | 0.55 * | −0.01 |
| 10 June 2014 | 0.7 | 0.11 * | 0.00 | 0.00 | 0.00 | 0.00 | 0.00 | 0.00 | 0.00 | 0.01 * | 0.00 | 0.02 * | 0.19 * | 0.01 | −0.00 | 0.02 * | 0.02 * | −0.02 * |
| 4 July 2014 | 0.5 | 0.09 * | −0.00 | 0.00 | 0.01 | −0.00 | −0.01 | −0.02 | 0.01 | 0.01 | −0.02 * | 0.31 * | 0.01 | −0.01 | 0.08 * | 0.26 * | −0.06 * | 0.05 * |
| 13 August 2014 | 0.6 | 0.07 | −0.00 | 0.00 | 0.04 * | −0.00 | 0.00 | 0.00 | 0.01 | 0.02 | −0.01 | −0.03 * | −0.45 * | −0.30 * | −0.25 * | −0.11 * | −0.45 * | 0.42 * |
| 6 September 2014 | 0.7 | 0.08 | 0.00 | 0.00 | 0.01 | −0.01 | −0.01 | 0.00 | 0.01 | 0.04 * | 0.00 | 0.04 * | −0.43 * | −0.21 * | 0.12 * | 0.13 * | −0.41 * | 0.40 * |
| 08 October 2014 | 0.4 | 0.02 | −0.00 * | 0.00 | 0.01 | −0.01 | −0.01 | −0.02 | −0.02 | 0.01 | −0.01 | 0.00 | −0.17 * | −0.27 * | −0.32 * | −0.17 * | −0.19 * | 0.38 * |
| 25 March 2015 | 0.7 | 0.17 * | 0.00 | 0.00 | 0.01 | 0.01 | −0.01 | −0.00 | 0.01 | 0.02 * | 0.01 | −0.06 * | 0.33 * | 0.36 * | −0.06 * | 0.17 * | 0.39 * | 0.10 * |
| 10 April 2015 | 0.8 | 0.16 * | 0.00 | 0.00 | 0.00 | 0.00 | −0.01 | −0.00 | 0.00 | 0.01 * | 0.00 | −0.05 * | 0.44 * | 0.47 * | −0.05 * | 0.15 * | 0.51 * | 0.03 * |
| 13 June 2015 | 0.8 | 0.14 * | −0.00 | 0.00 | −0.00 | 0.00 | −0.00 | −0.01 | −0.00 | 0.01 | −0.00 | 0.03 * | 0.39 * | 0.01 | −0.00 | 0.03 * | 0.20 * | −0.02 * |
| 4 July 2015 | 0.5 | 0.09 * | 0.00 | 0.00 | 0.00 | −0.00 | −0.00 | −0.01 | −0.00 | 0.01 * | −0.01 * | 0.27 * | 0.15* | −0.02 | −0.04 * | 0.09 * | 0.00 | 0.05 * |
| 3 August 2015 | 0.8 | 0.09 * | −0.00 | 0.00 | 0.01 * | −0.01 | −0.00 | 0.00 | 0.00 | −0.01 | −0.02 * | 0.02 * | −0.50 * | −0.14 * | −0.06 * | −0.02 | −0.52 * | 0.53 * |
| 3 October 2015 | 0.4 | 0.13 | −0.01 * | 0.00 | 0.02 | −0.01 | −0.02 | −0.02 | −0.01 | 0.01 | 0.00 | 0.02 | −0.30 * | −0.24 * | −0.31 * | −0.09 * | −0.06 * | 0.46 * |
| 31 December 2015 | 0.4 | 0.28 * | 0.00 | 0.00 | 0.00 | 0.00 | −0.01 | 0.00 | 0.01 | 0.03 * | −0.01 | −0.14 * | 0.16 * | 0.41 * | −0.16 * | 0.06 * | 0.33 * | 0.14 * |
| 2 April 2016 | 0.6 | 0.16 * | 0.00 | 0.00 | 0.01 | −0.01 | −0.01 | −0.01 | 0.00 | 0.05 * | 0.01 | −0.06 * | 0.31 * | 0.42 * | −0.14 * | −0.14 * | 0.42 * | 0.19 * |
| 22 April 2016 | 0.7 | 0.15 * | 0.00 | 0.00 | −0.02 | 0.00 | 0.00 | −0.01 | 0.00 | 0.03 * | 0.00 | 0.00 | 0.49 * | 0.42 * | −0.05 * | −0.09 * | 0.54 * | 0.06 * |
| 12 May 2016 | 0.9 | 0.15 * | 0.00 | 0.00 | 0.00 | −0.01 | −0.01 | −0.01 | 0.00 | 0.01 * | 0.00 | 0.00 | 0.60 * | 0.06 * | 0.04 * | −0.03 | 0.66 * | −0.01 |
| 8 June 2016 | 0.8 | 0.21 * | 0.00 | 0.00 | 0.00 | 0.01 | 0.00 | 0.00 | 0.01 | 0.02 * | −0.01 | 0.01 * | 0.38 * | 0.00 | 0.00 | −0.01 | 0.14 * | −0.04 * |
| 23 June 2016 | 0.5 | 0.02 | 0.00 | 0.00 | 0.00 | 0.01 | 0.00 | 0.00 | 0.01 | 0.01 | −0.01 | 0.26 * | 0.04 * | −0.02 | 0.00 | 0.04 * | −0.02 | 0.01 |
© 2020 by the authors. Licensee MDPI, Basel, Switzerland. This article is an open access article distributed under the terms and conditions of the Creative Commons Attribution (CC BY) license (http://creativecommons.org/licenses/by/4.0/).
Share and Cite
Ayalew, D.A.; Deumlich, D.; Šarapatka, B.; Doktor, D. Quantifying the Sensitivity of NDVI-Based C Factor Estimation and Potential Soil Erosion Prediction using Spaceborne Earth Observation Data. Remote Sens. 2020, 12, 1136. https://doi.org/10.3390/rs12071136
Ayalew DA, Deumlich D, Šarapatka B, Doktor D. Quantifying the Sensitivity of NDVI-Based C Factor Estimation and Potential Soil Erosion Prediction using Spaceborne Earth Observation Data. Remote Sensing. 2020; 12(7):1136. https://doi.org/10.3390/rs12071136
Chicago/Turabian StyleAyalew, Dawit A., Detlef Deumlich, Bořivoj Šarapatka, and Daniel Doktor. 2020. "Quantifying the Sensitivity of NDVI-Based C Factor Estimation and Potential Soil Erosion Prediction using Spaceborne Earth Observation Data" Remote Sensing 12, no. 7: 1136. https://doi.org/10.3390/rs12071136
APA StyleAyalew, D. A., Deumlich, D., Šarapatka, B., & Doktor, D. (2020). Quantifying the Sensitivity of NDVI-Based C Factor Estimation and Potential Soil Erosion Prediction using Spaceborne Earth Observation Data. Remote Sensing, 12(7), 1136. https://doi.org/10.3390/rs12071136