An Empirical Model to Estimate Abundance of Nanophase Metallic Iron (npFe0) in Lunar Soils

 ,
,
Abstract
1. Introduction
2. Dataset
3. Method
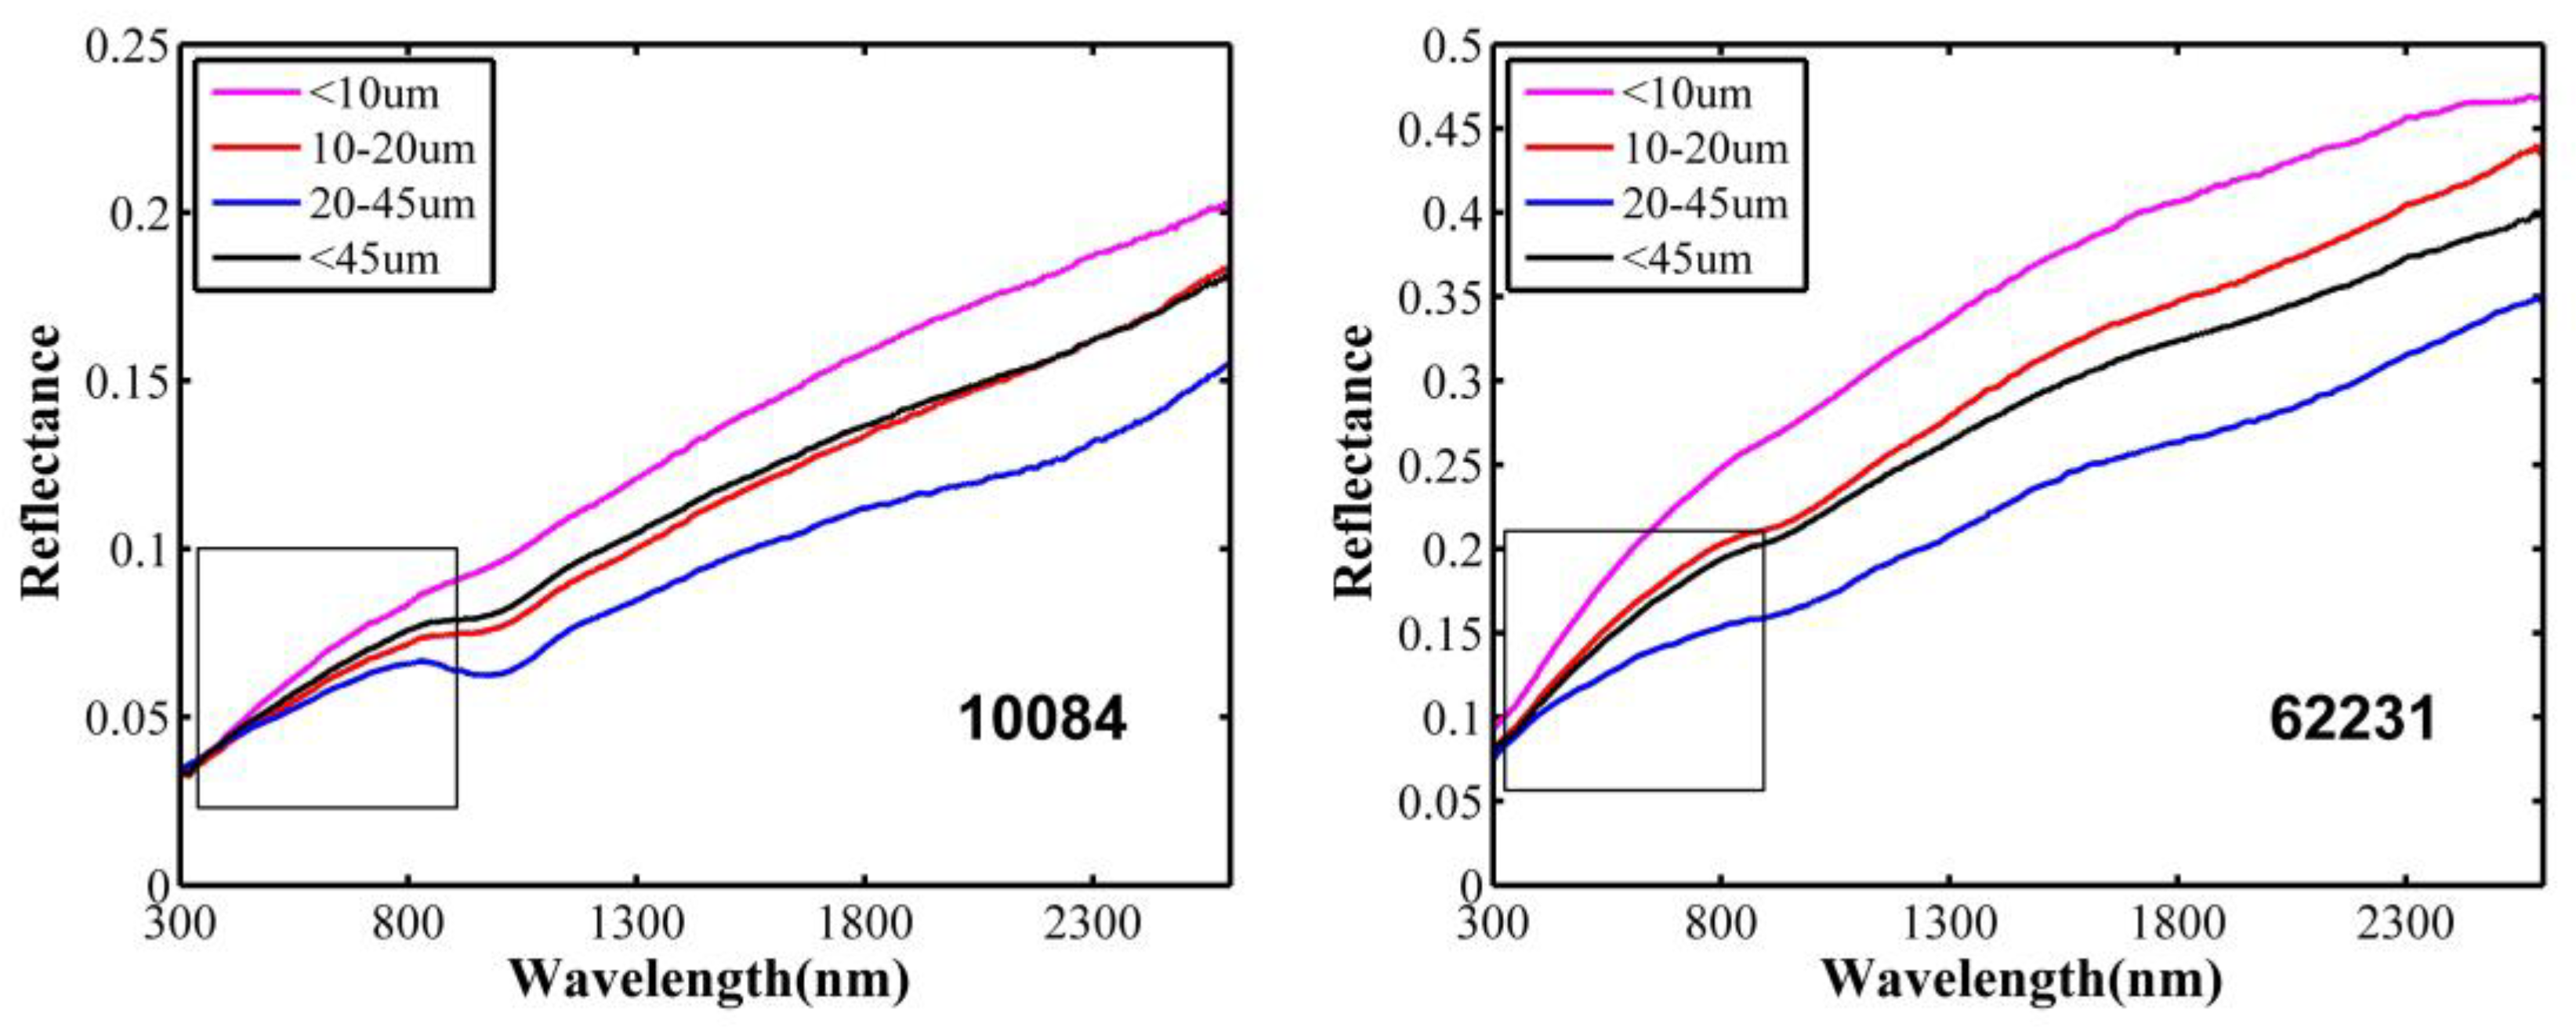
3.1. Strong Influence of npFe0 at Short Wavelengths
3.2. Estimation of npFe0 Abundance in Lunar Soils
4. Result
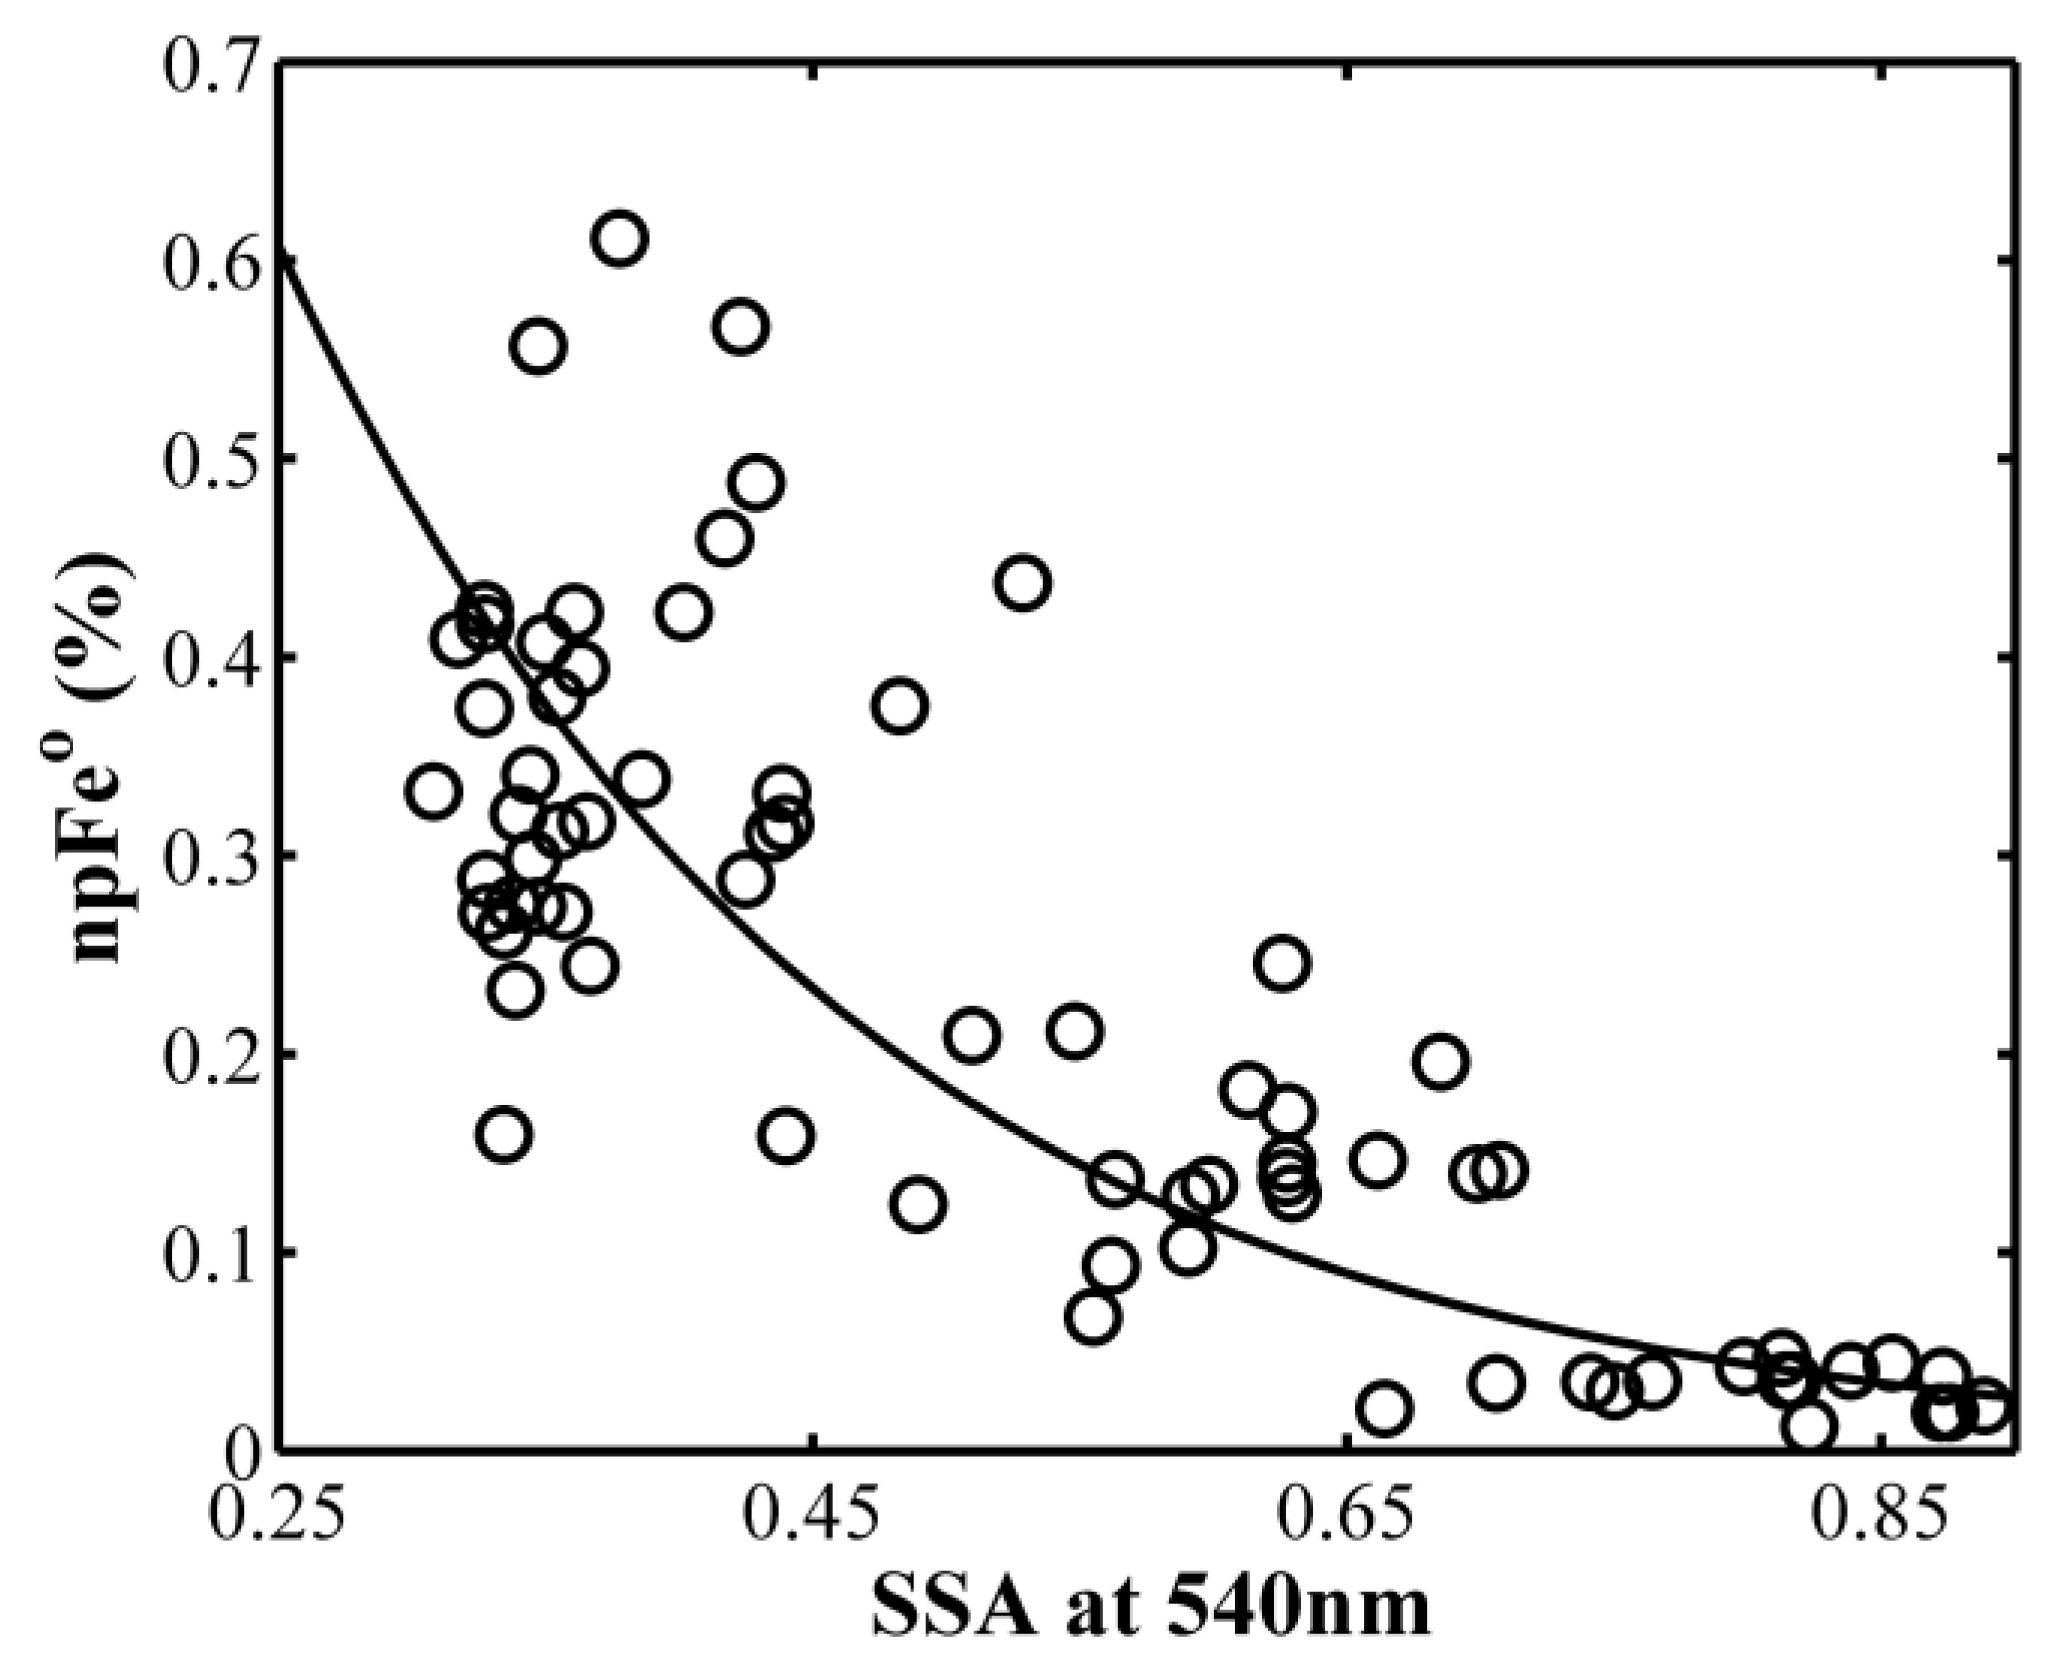
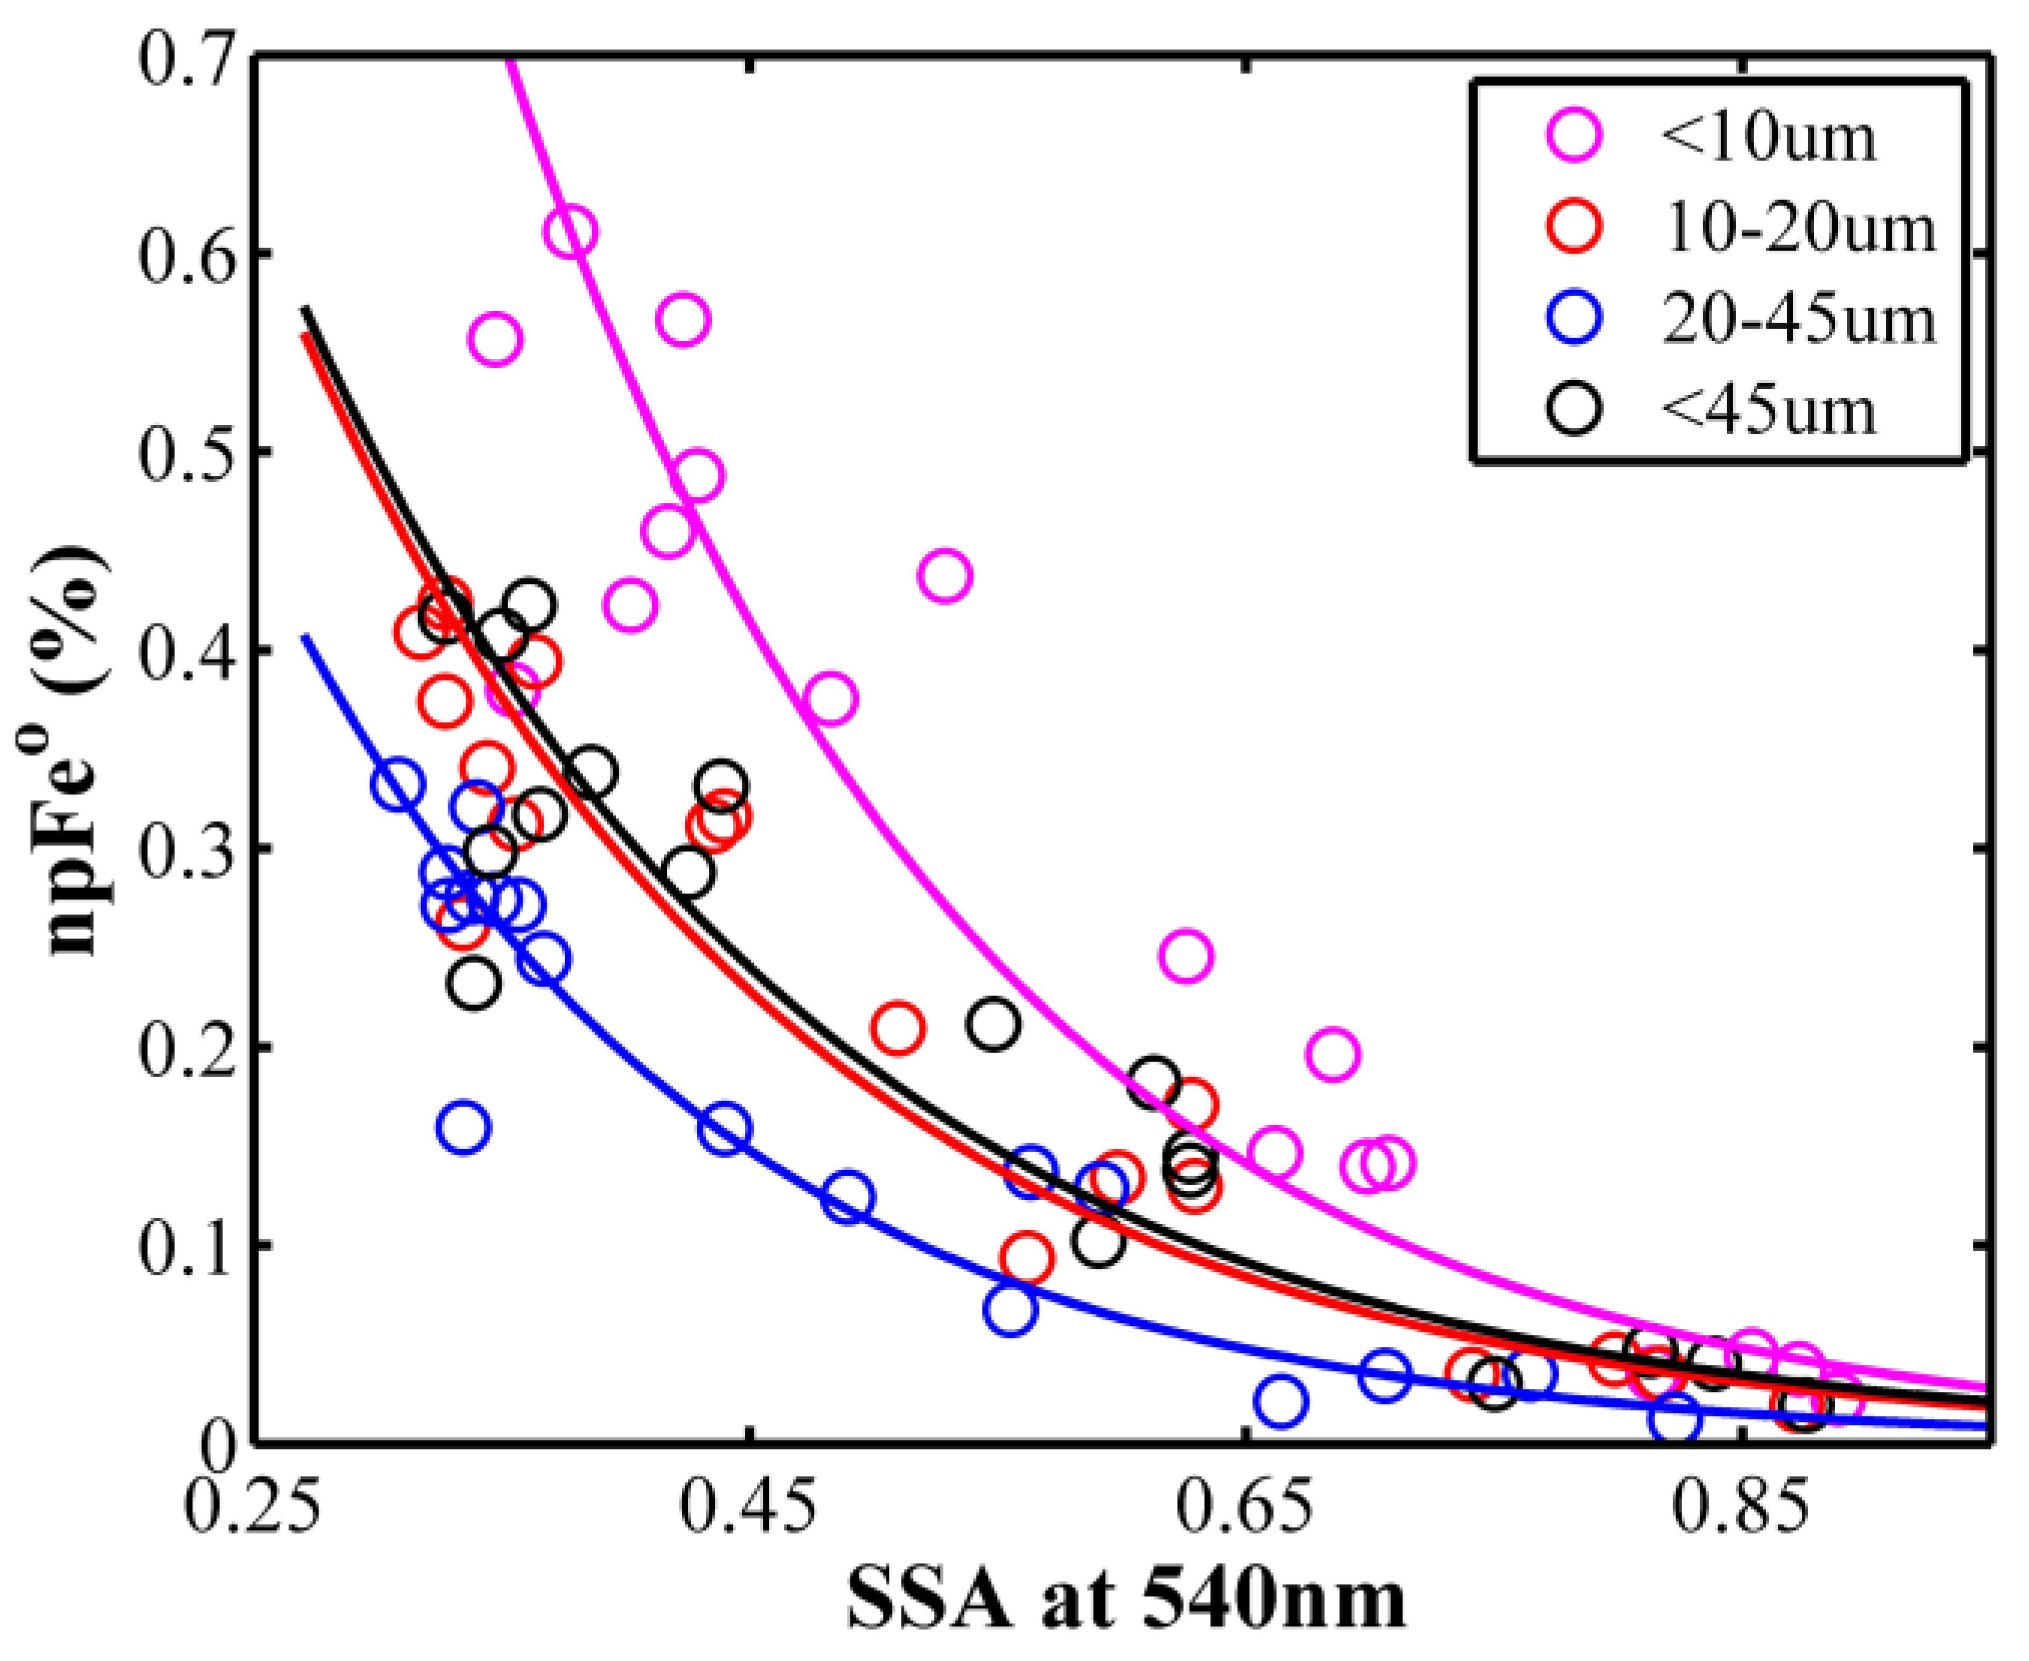
4.1. Correlation between 540 nm Single Scattering albedo (SSA) and npFe0
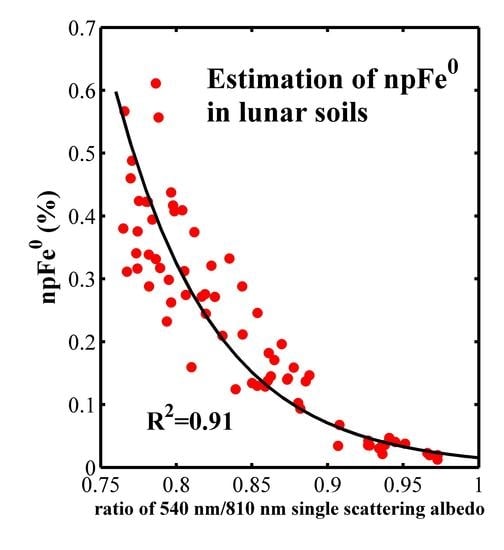
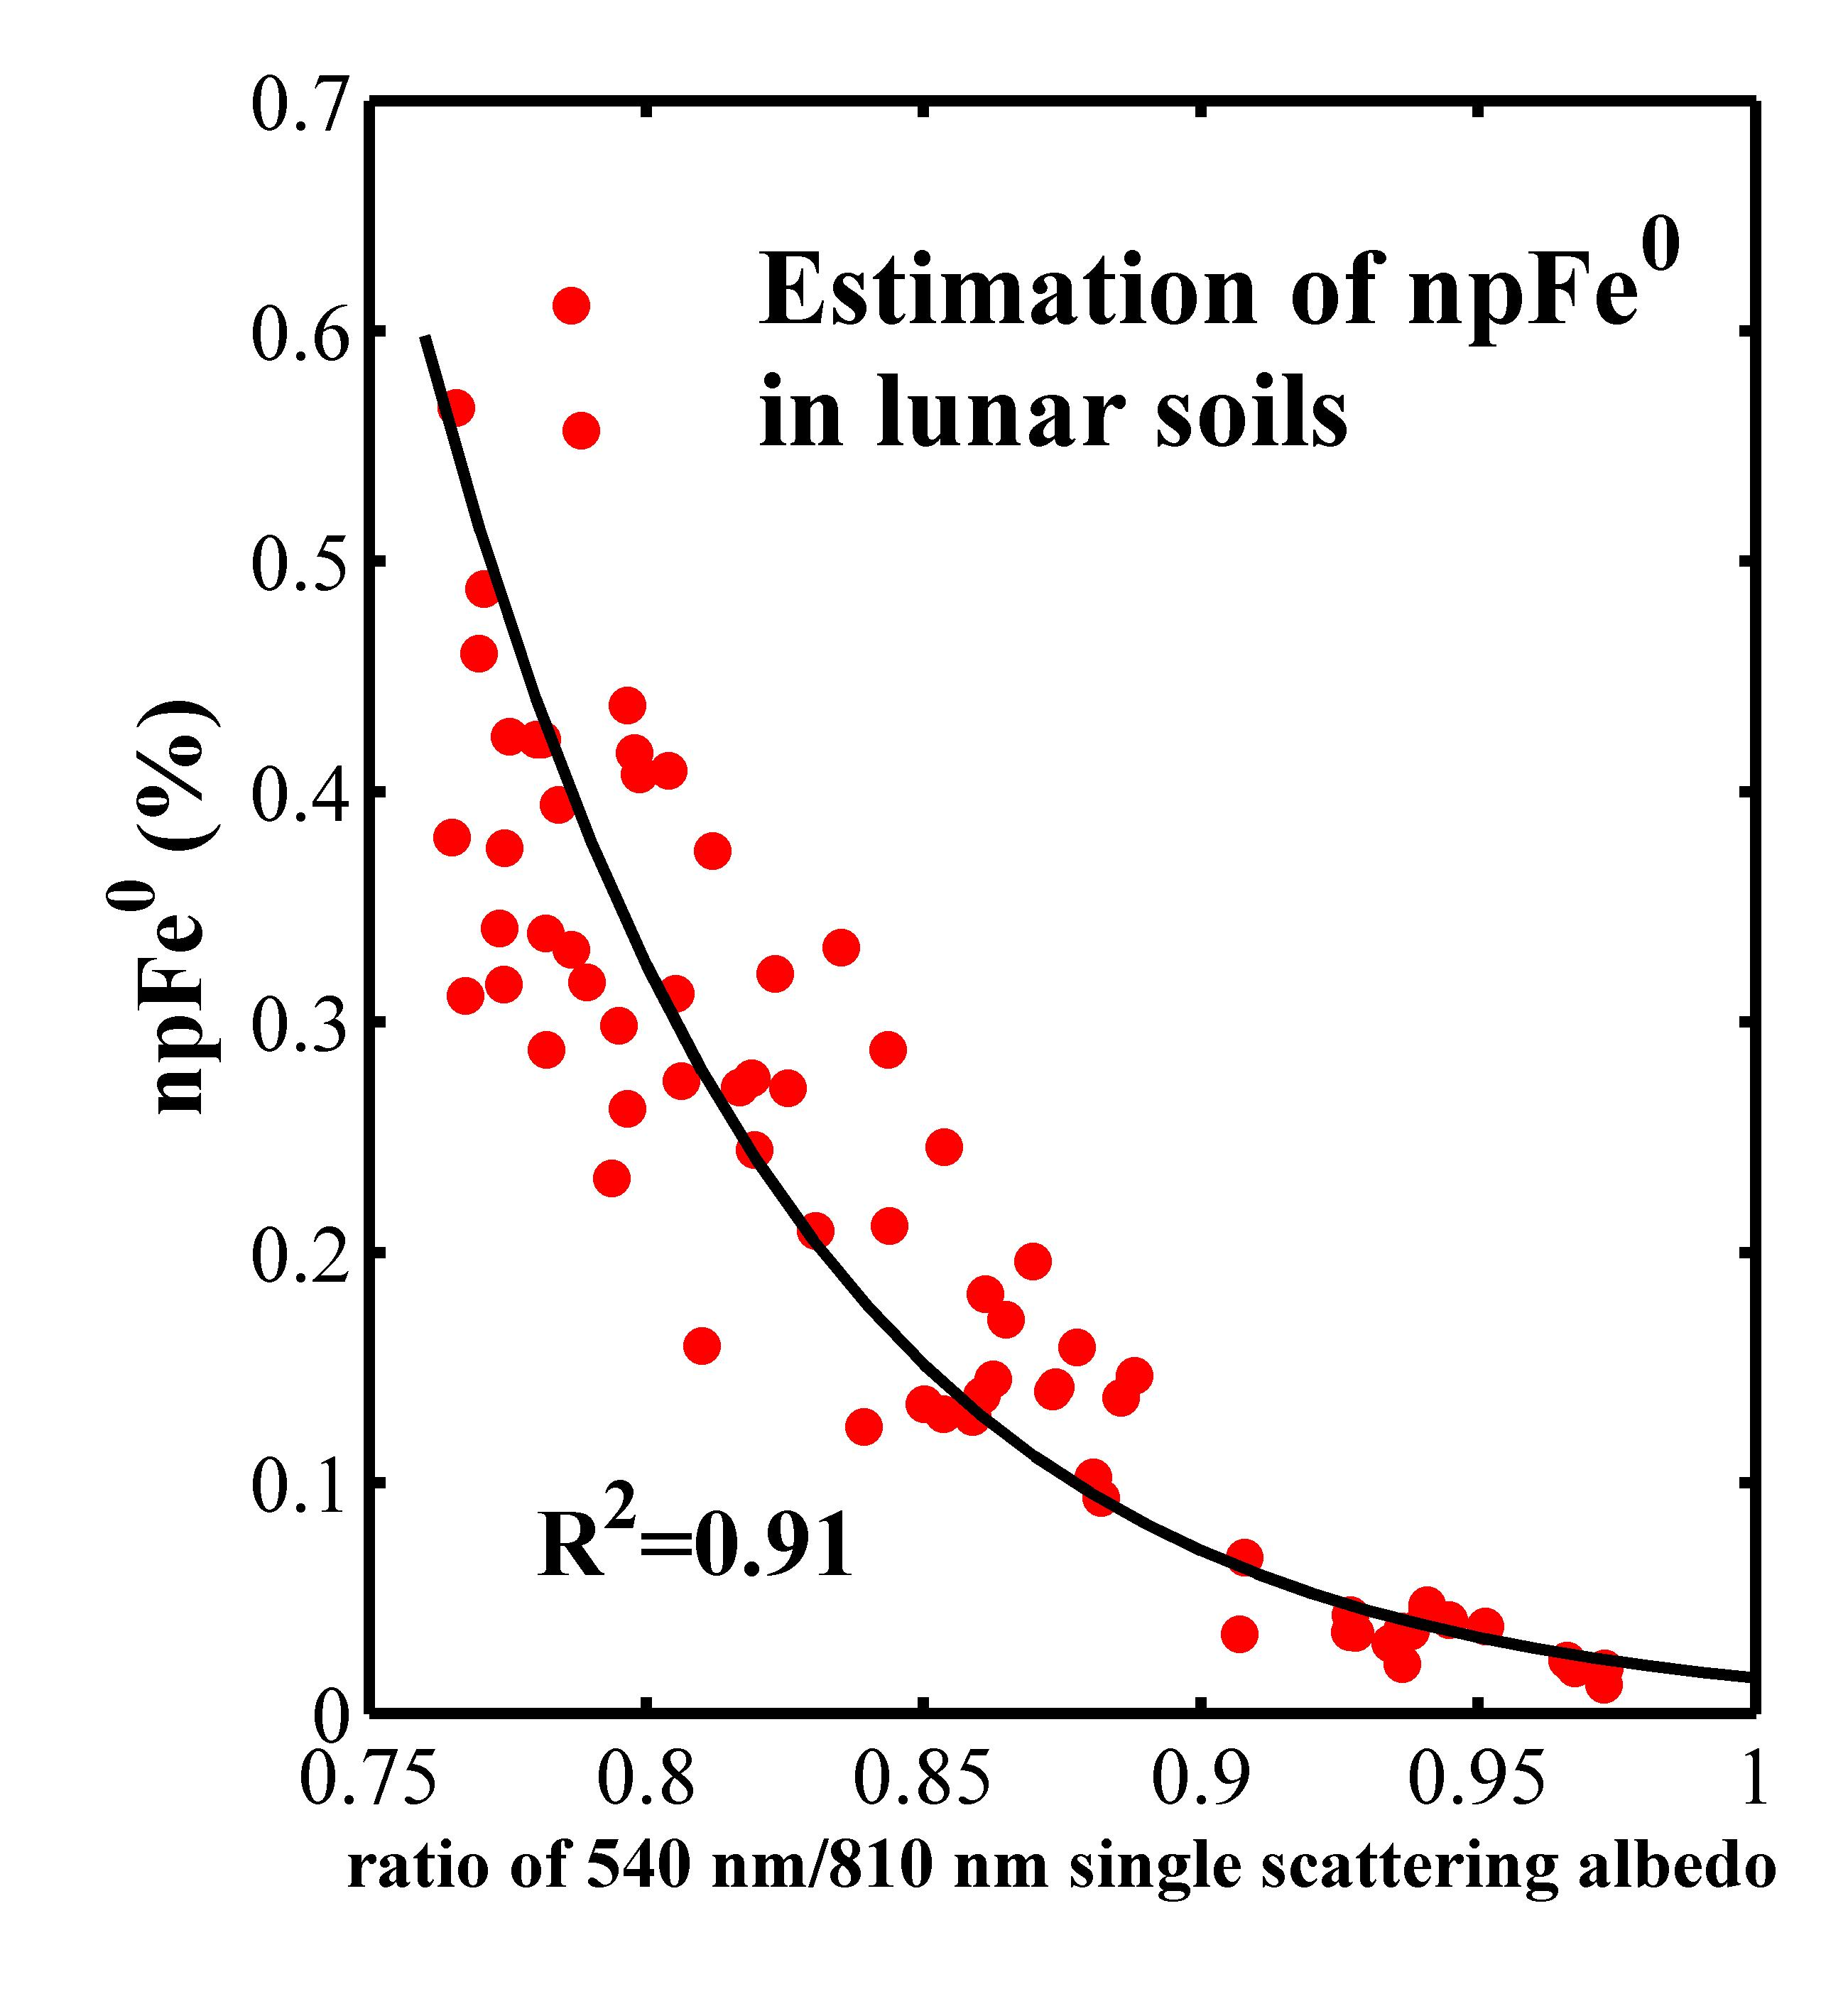
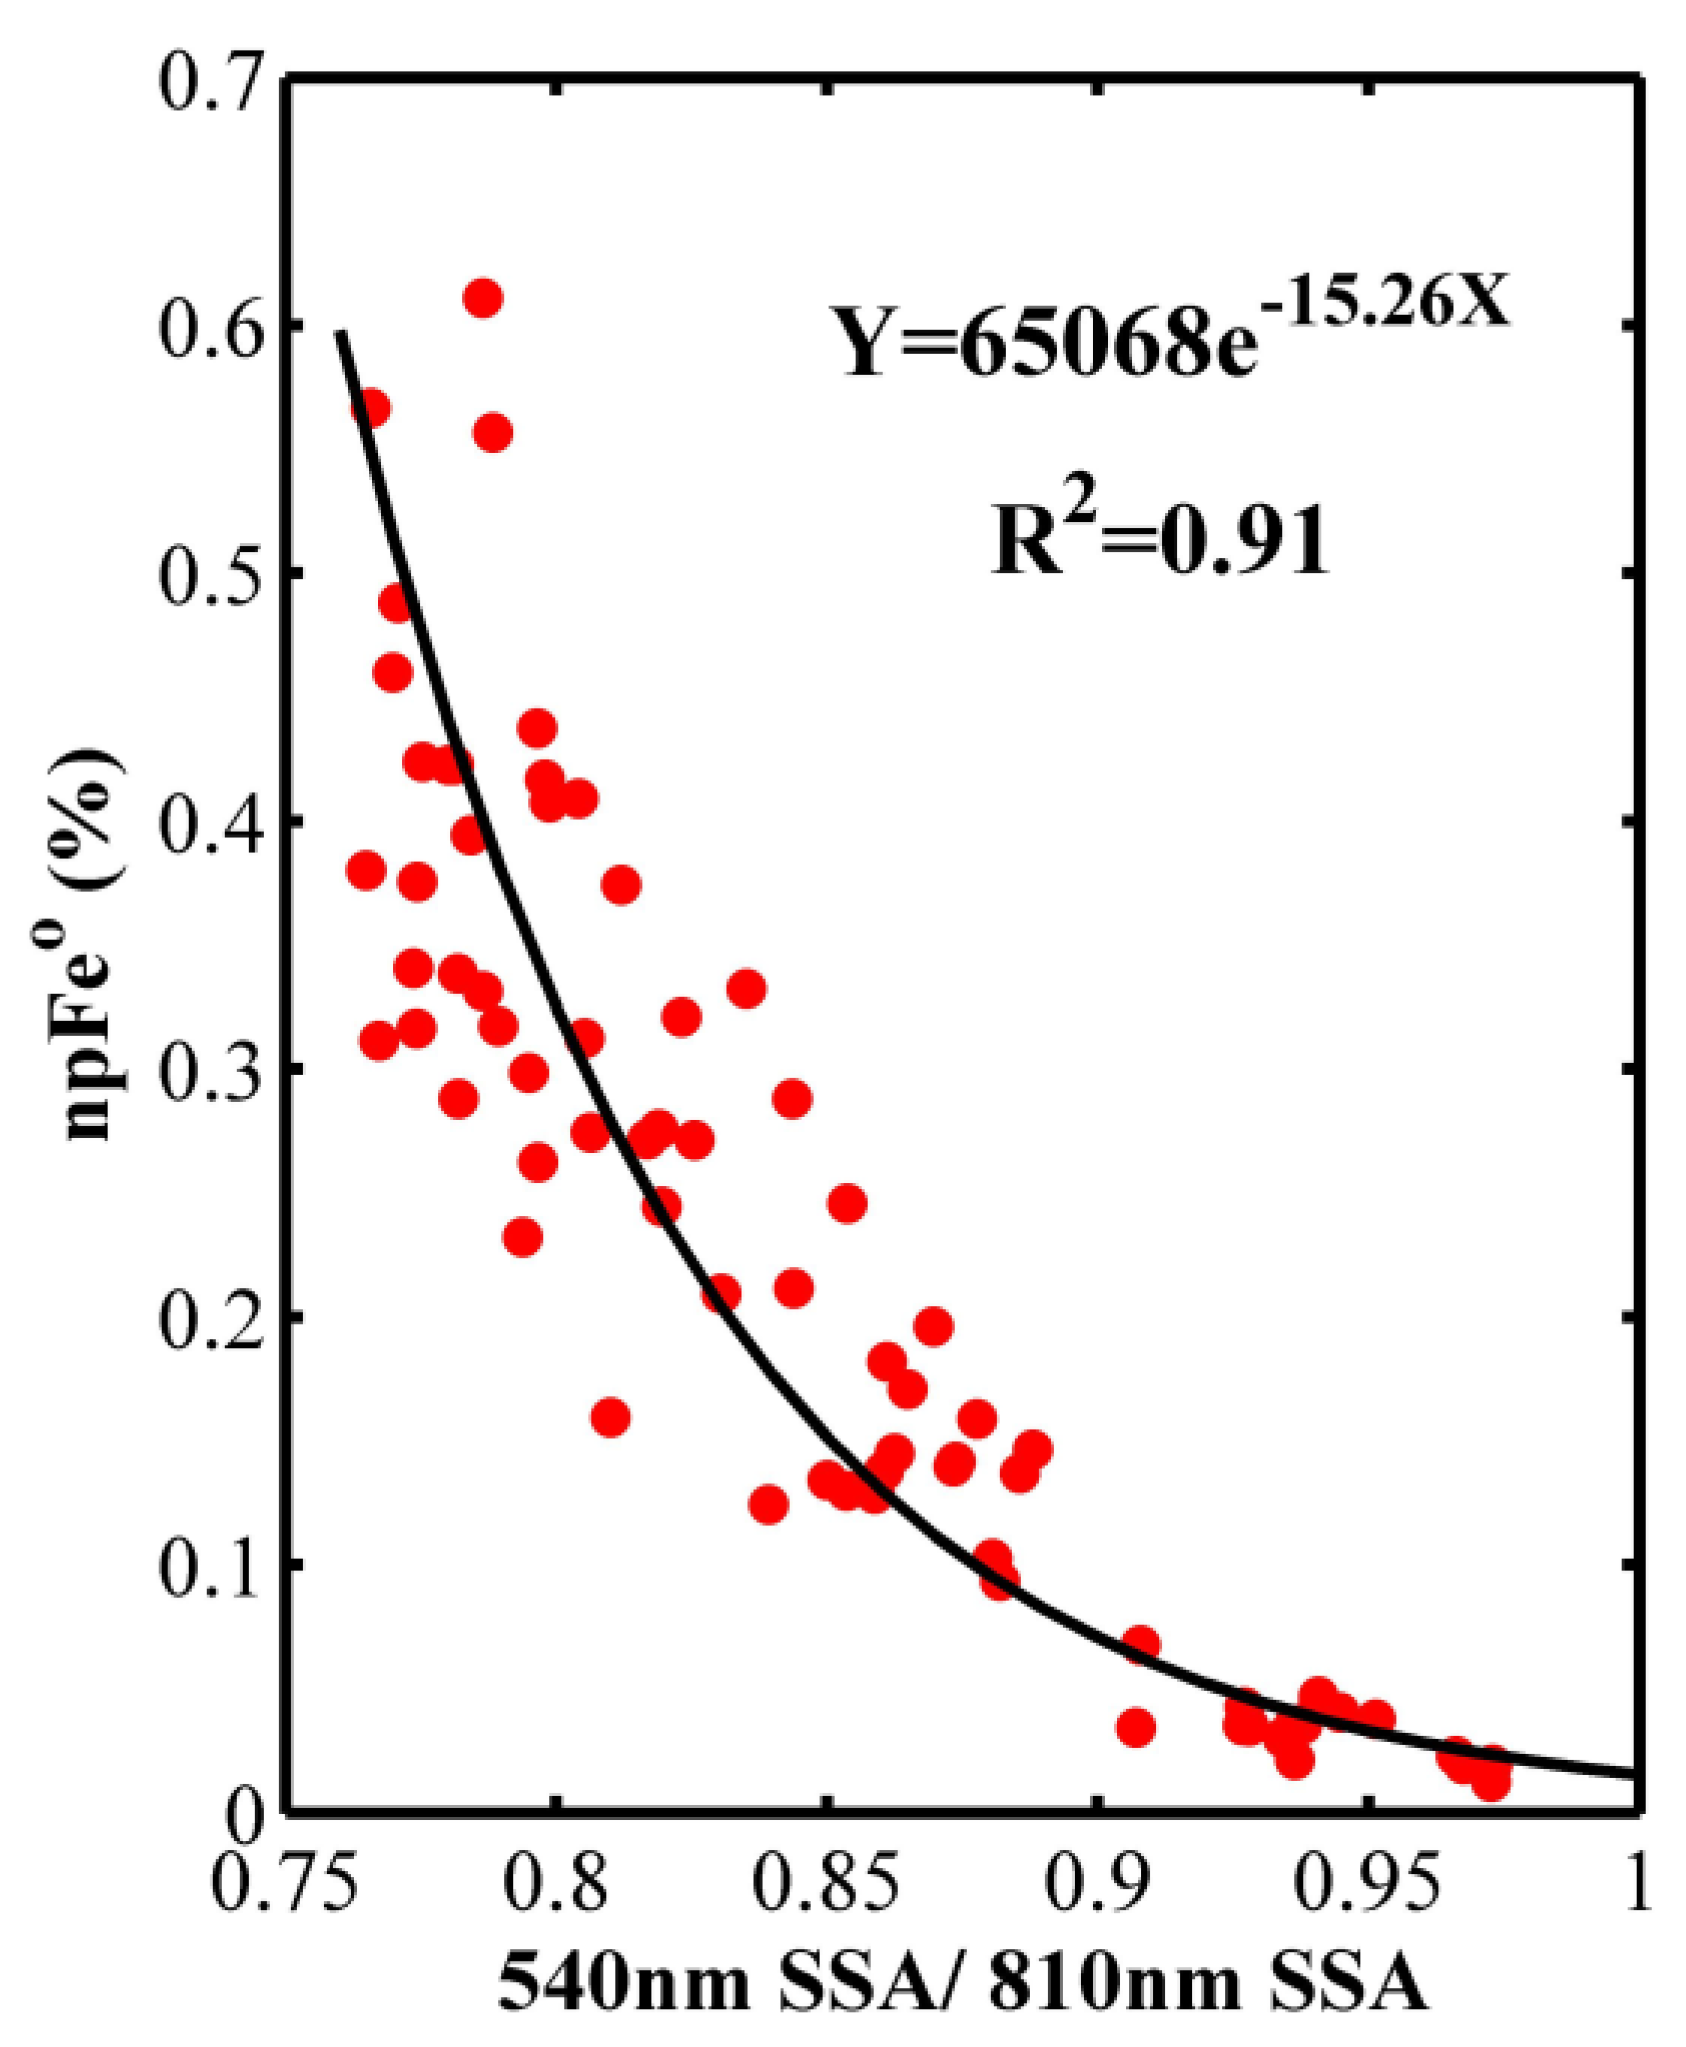
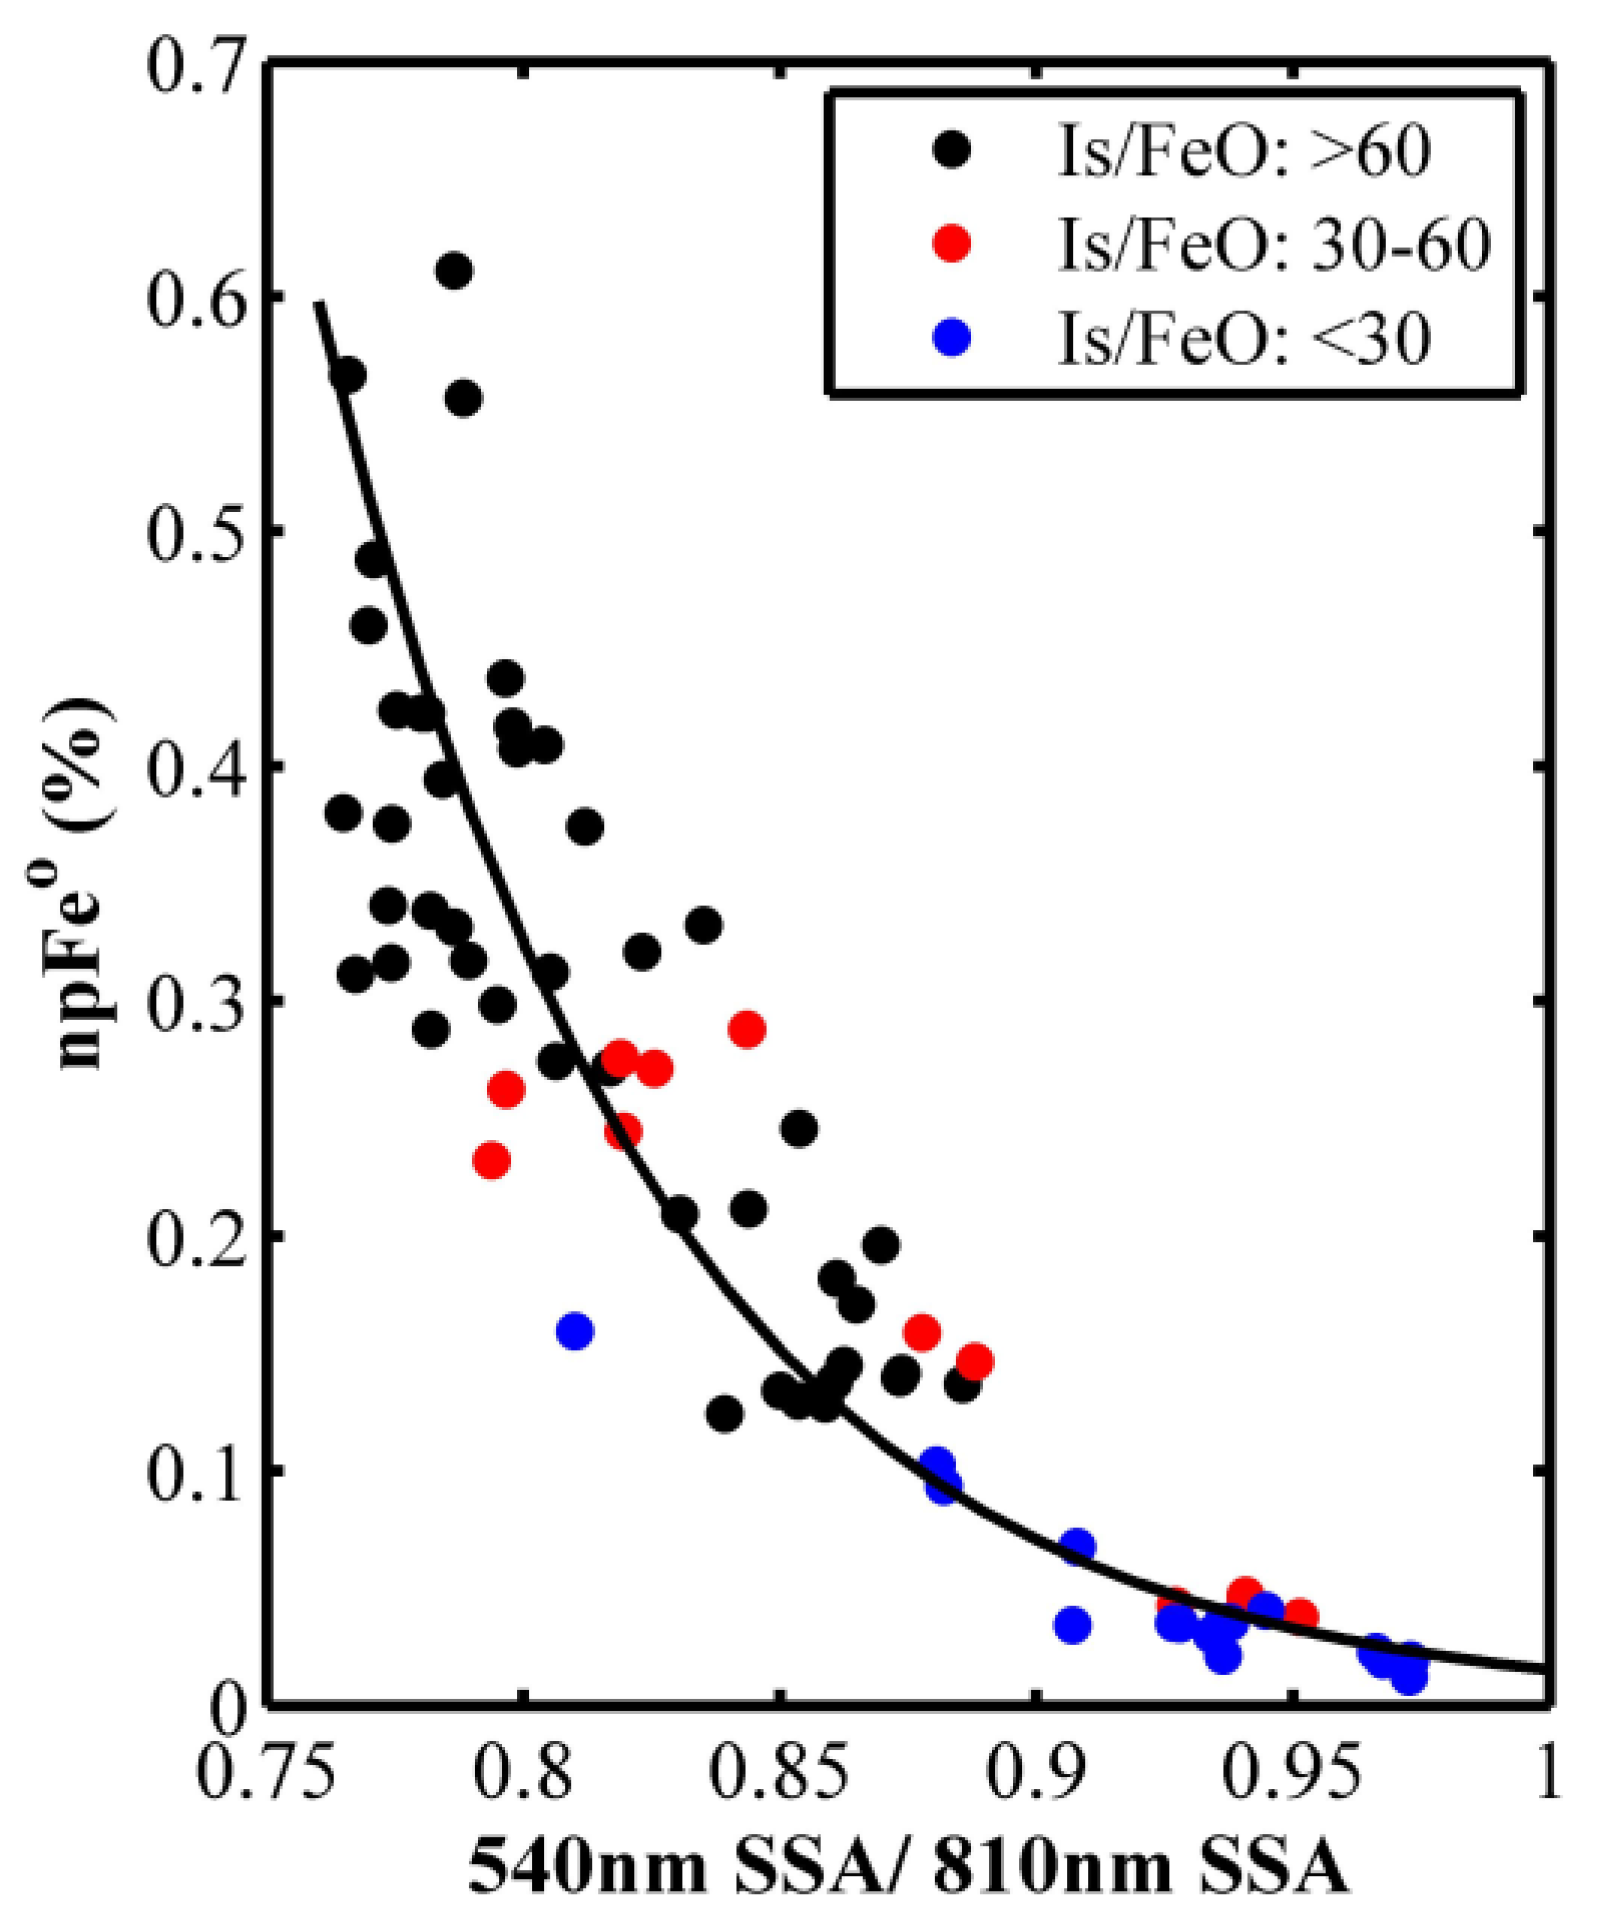
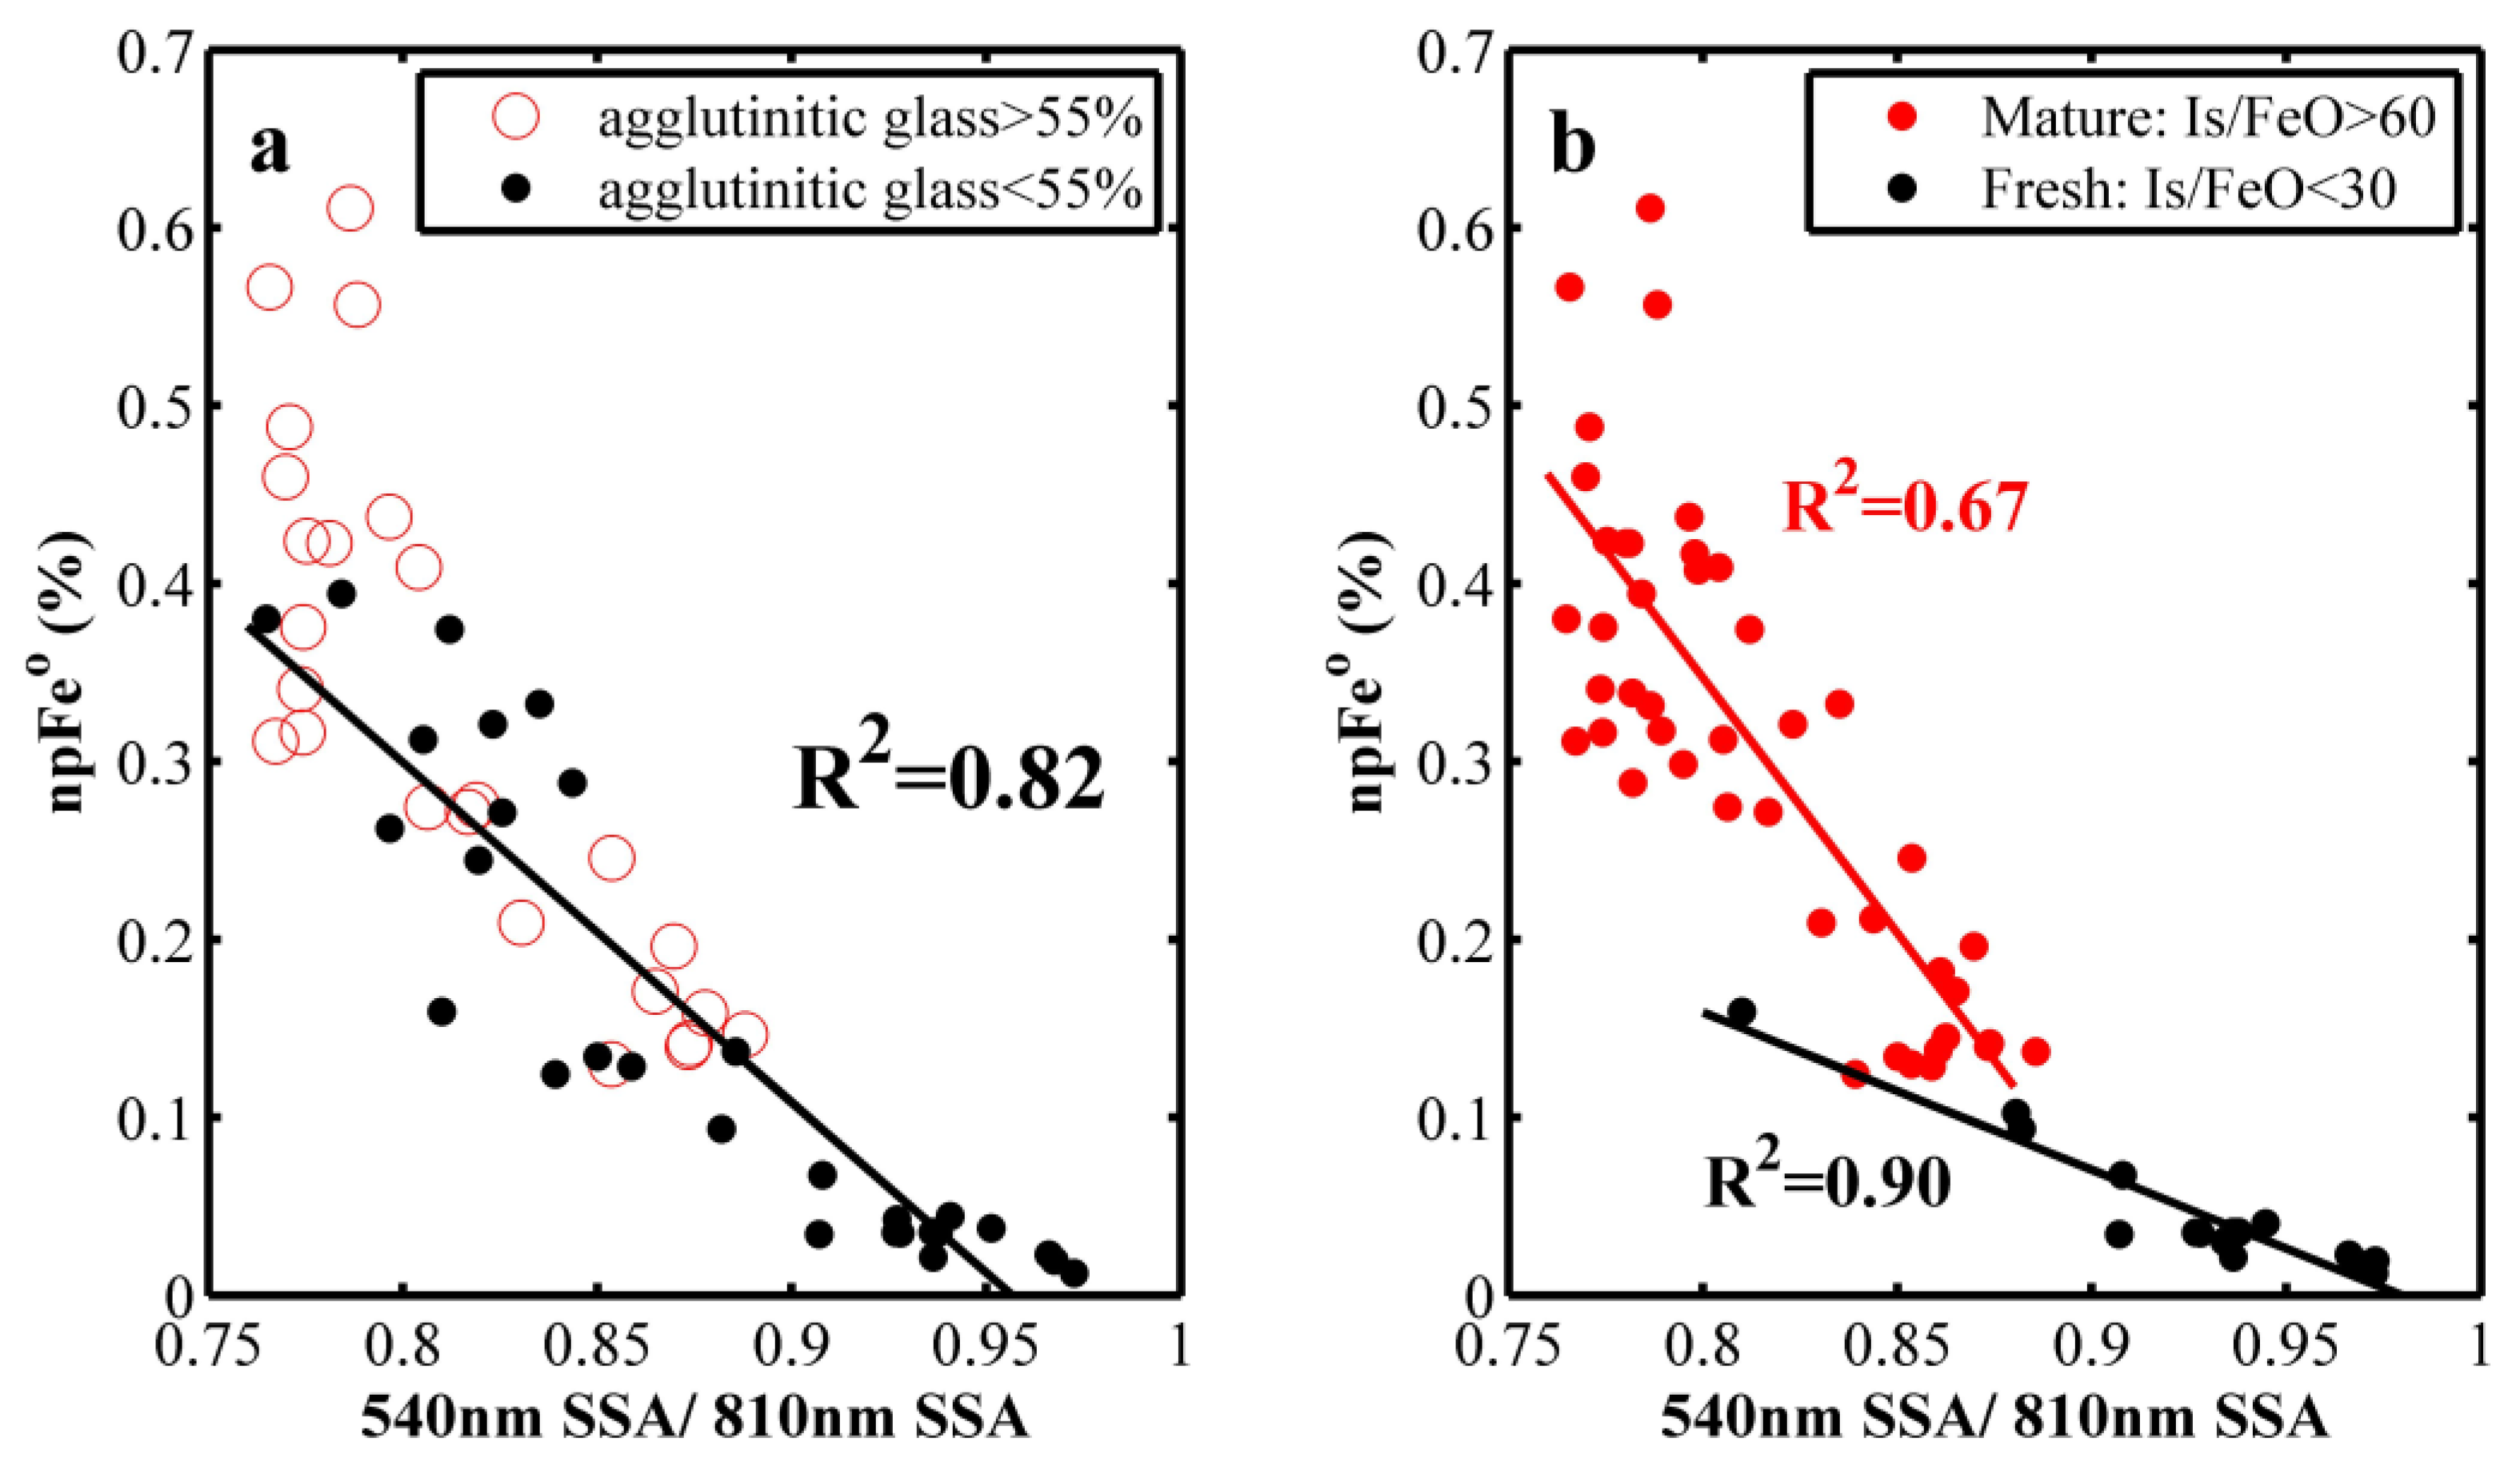
4.2. Correlation between the Ratio of 540 nm SSA/810 nm SSA and npFe0
5. Discussion
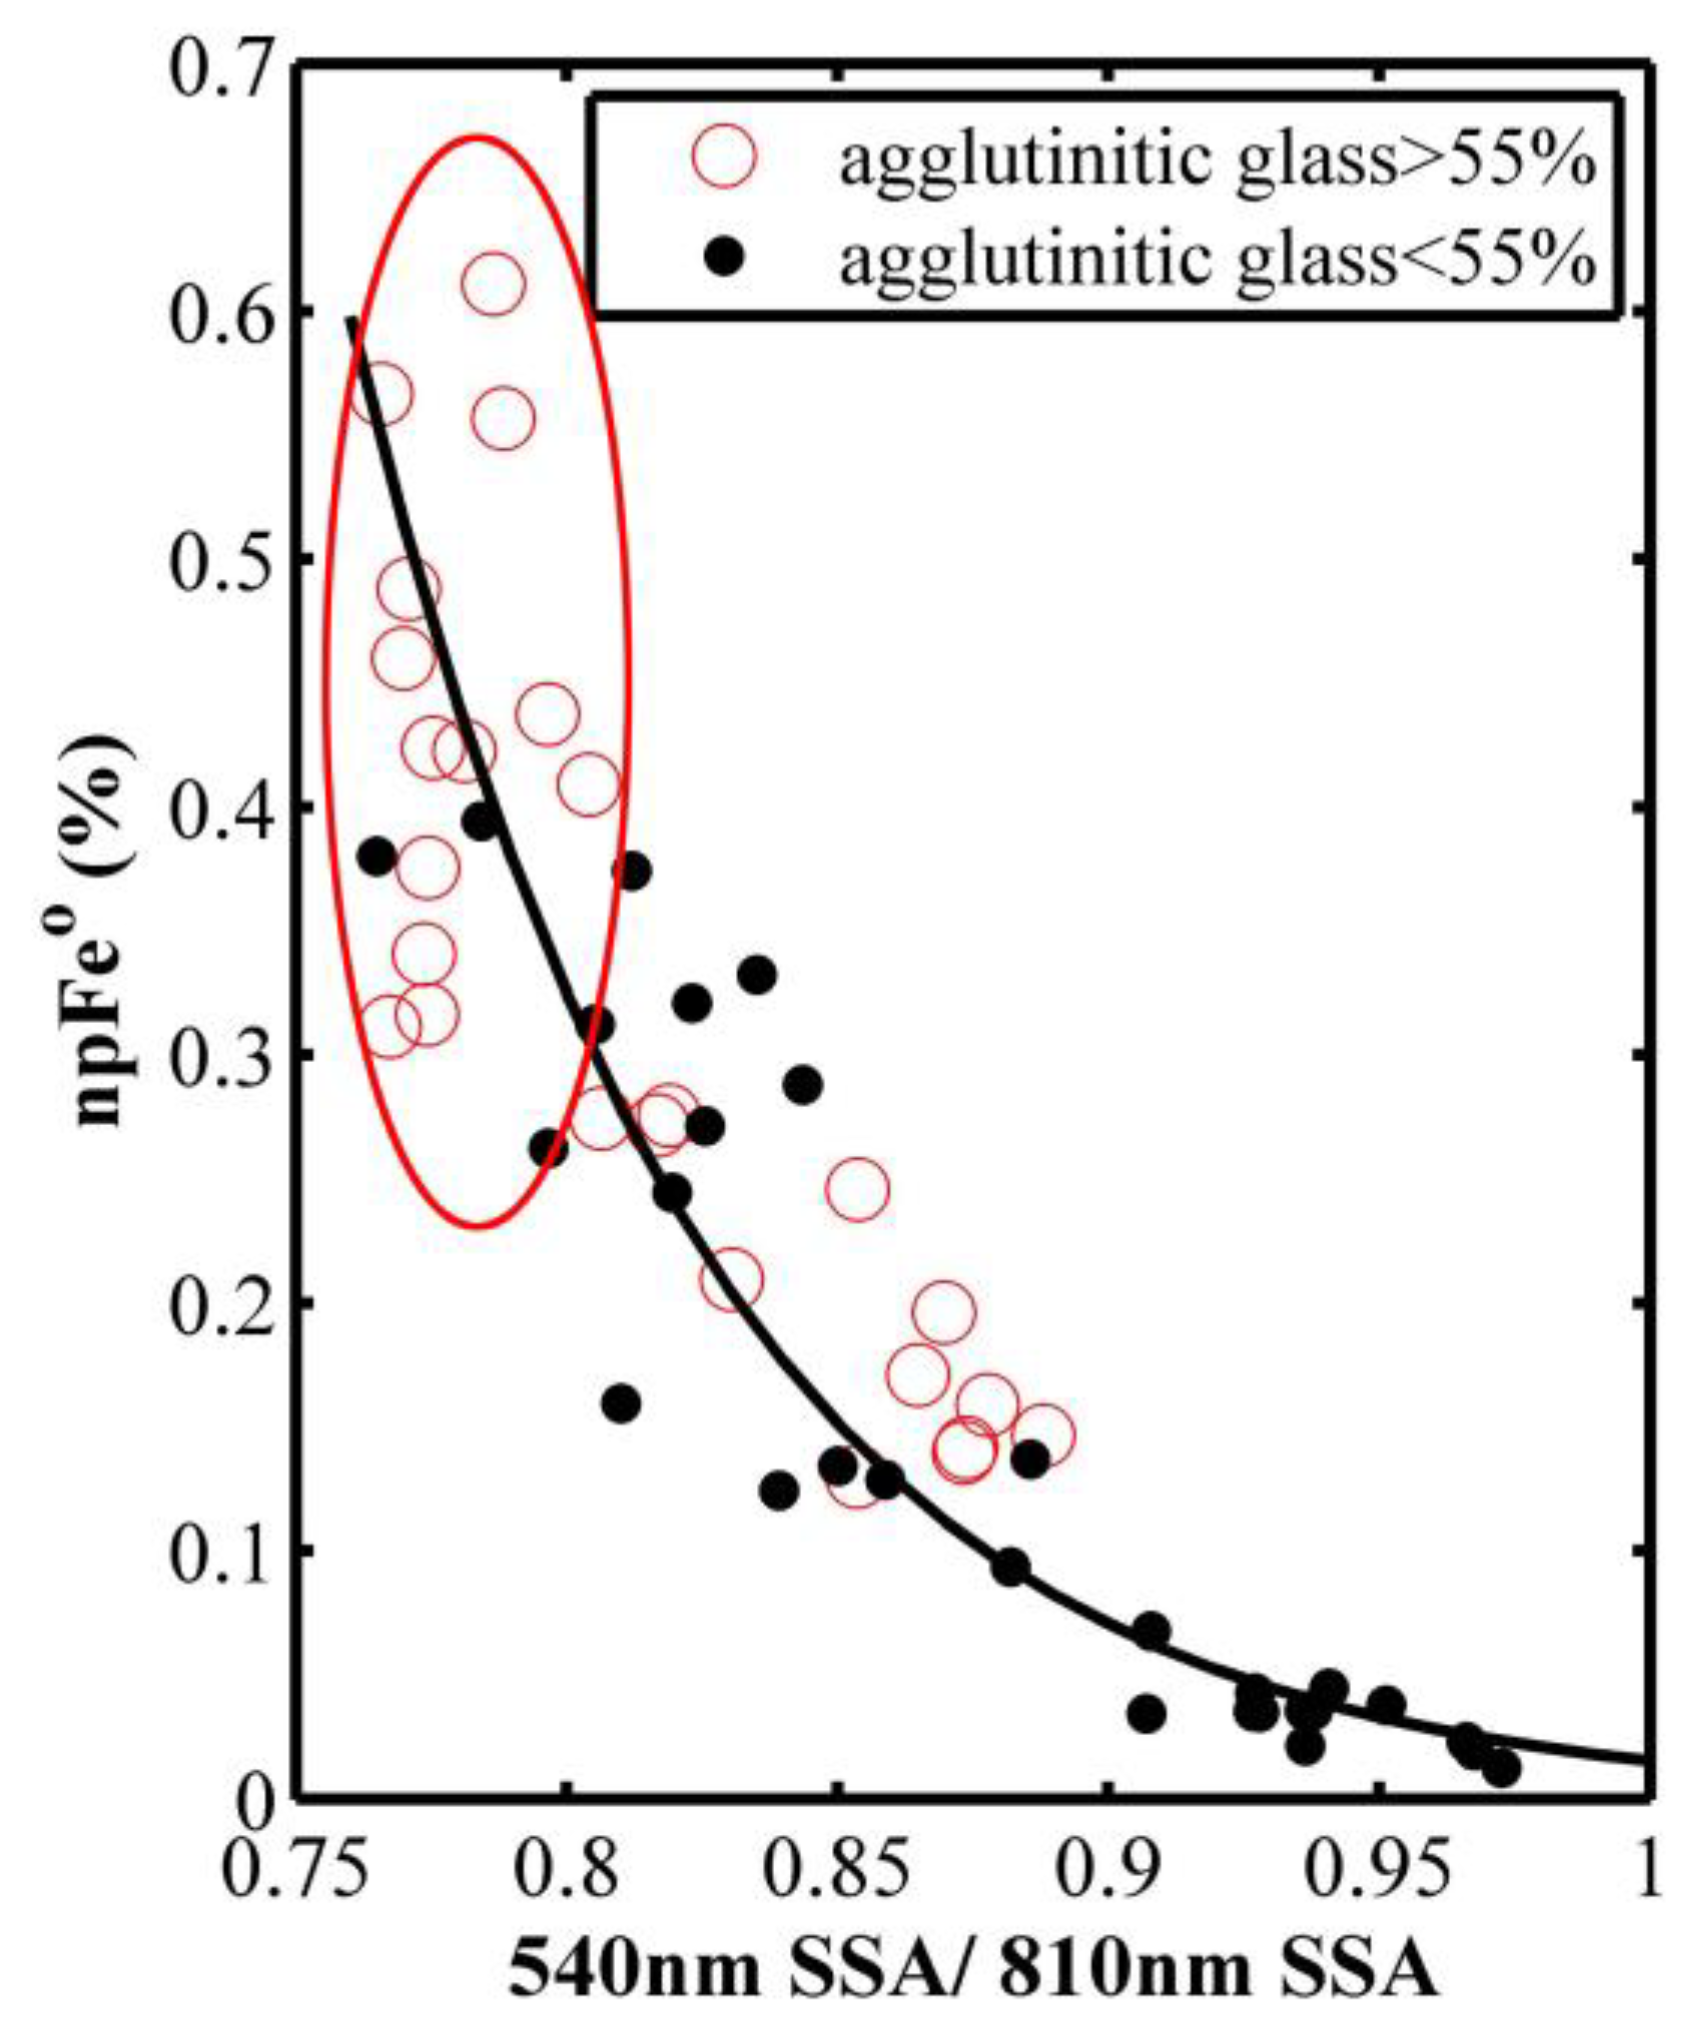
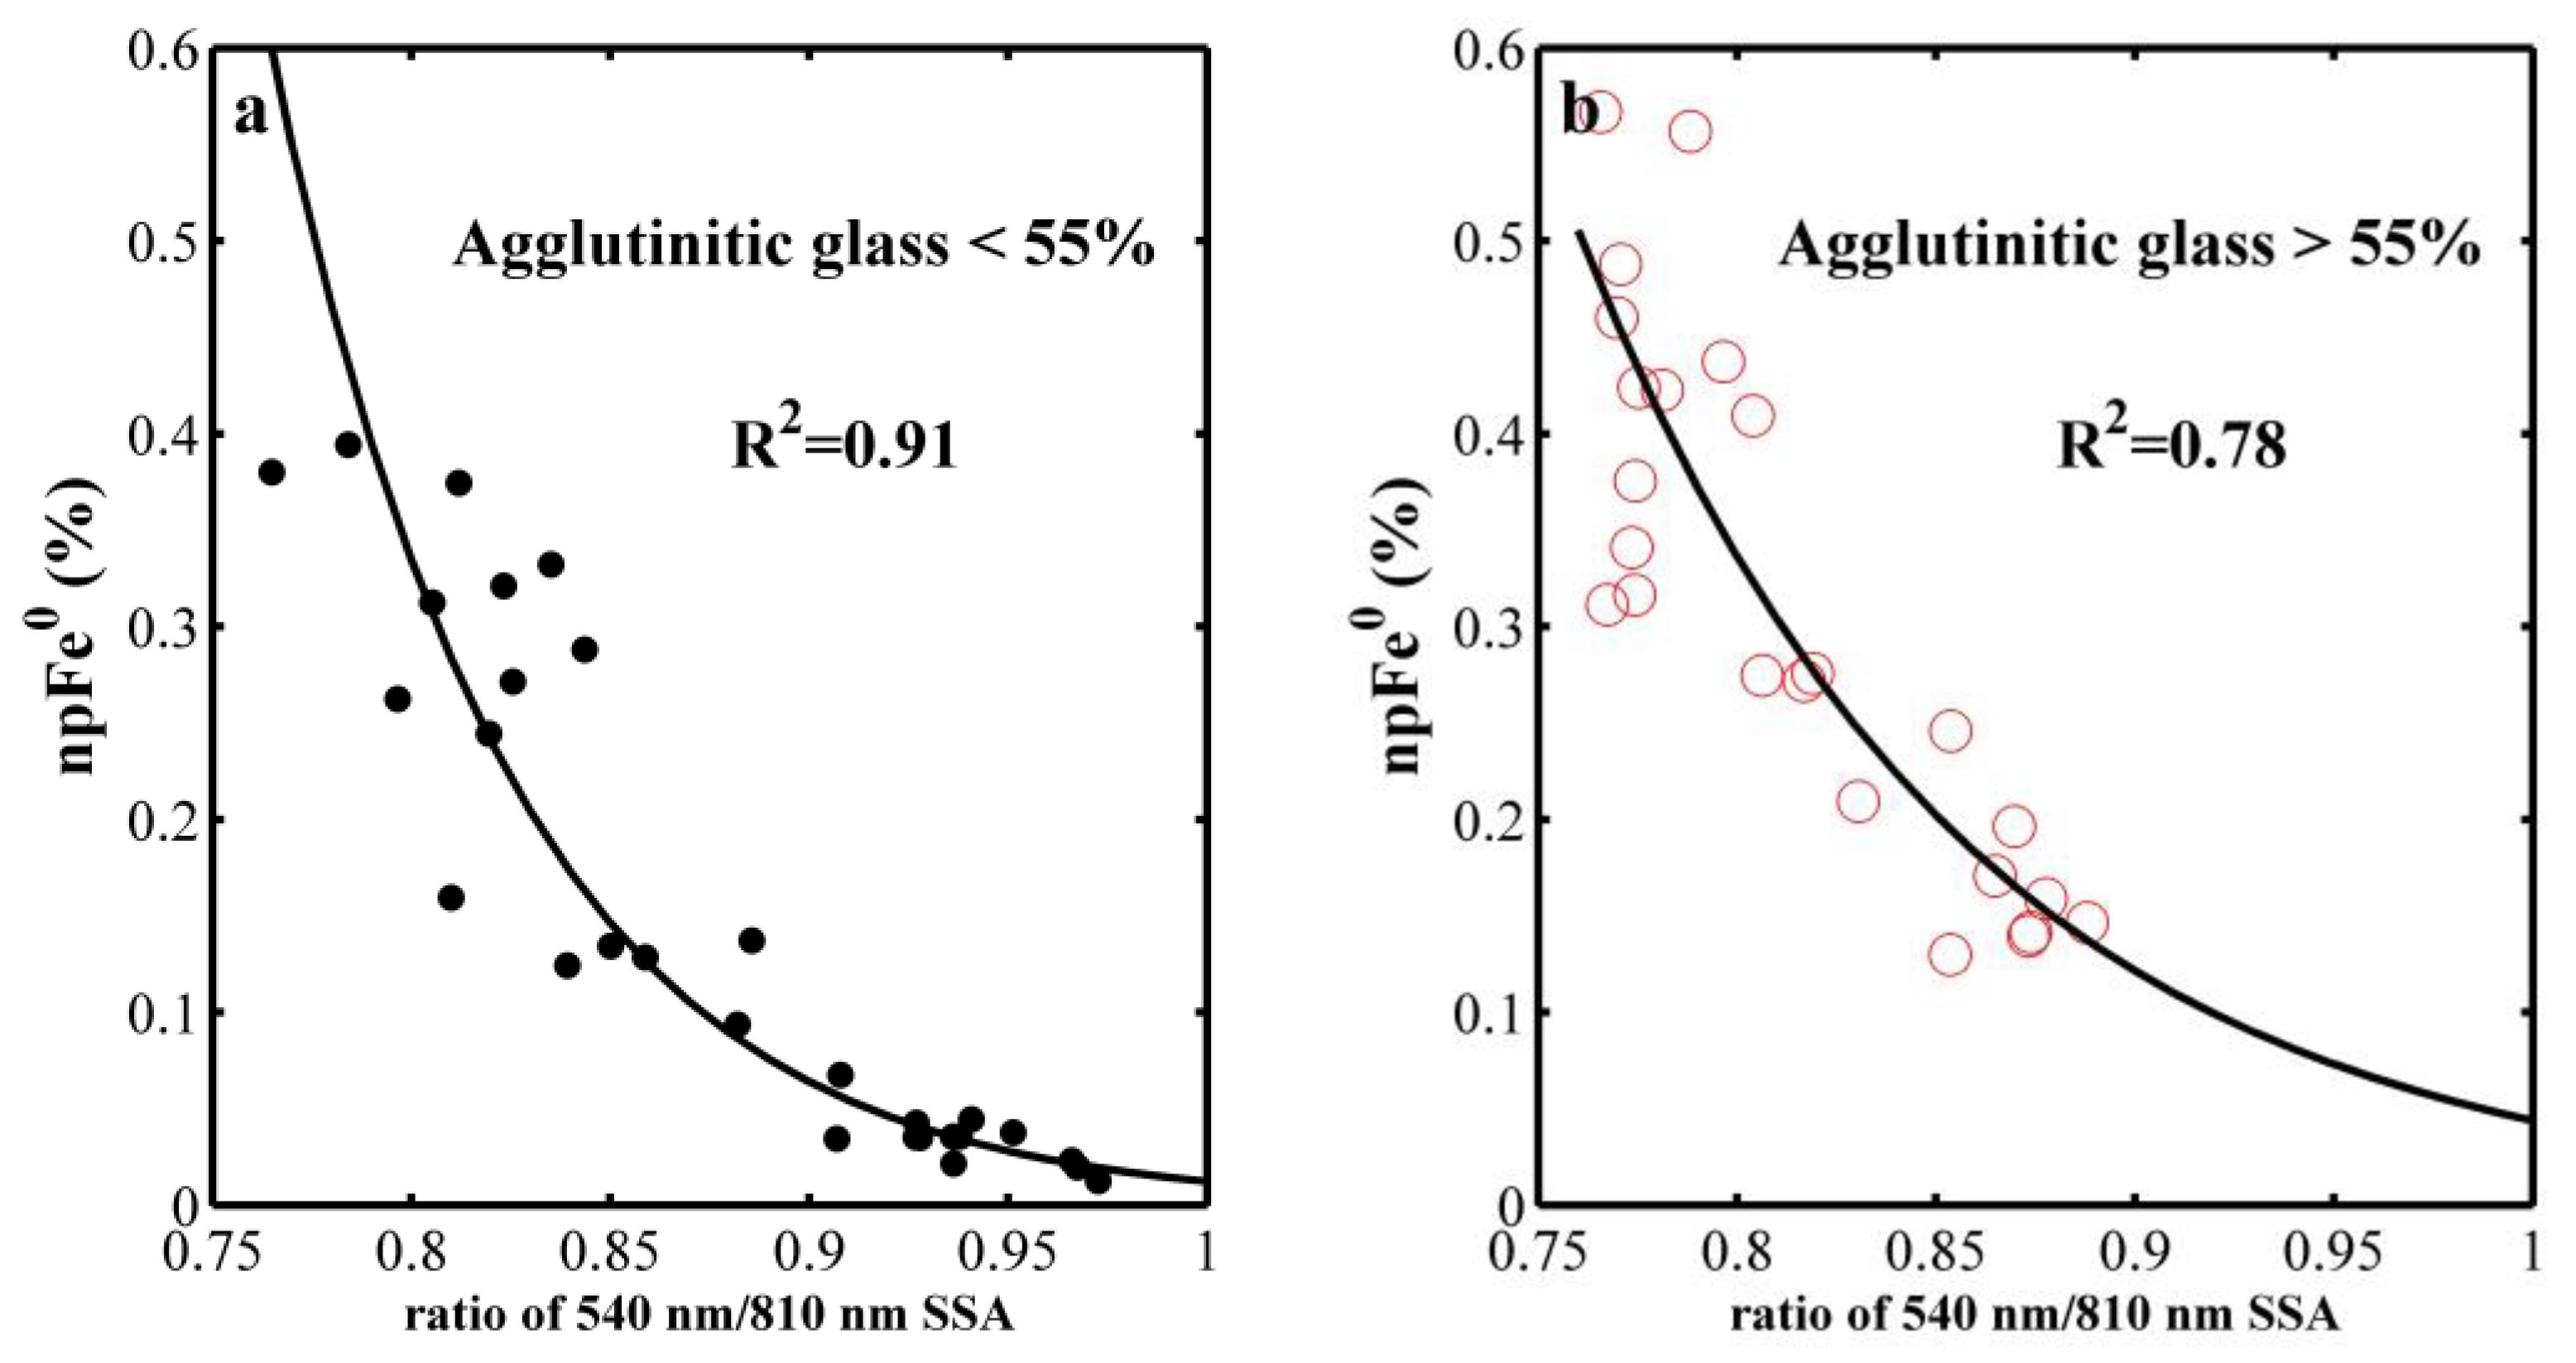
5.1. Scattering Points Analysis
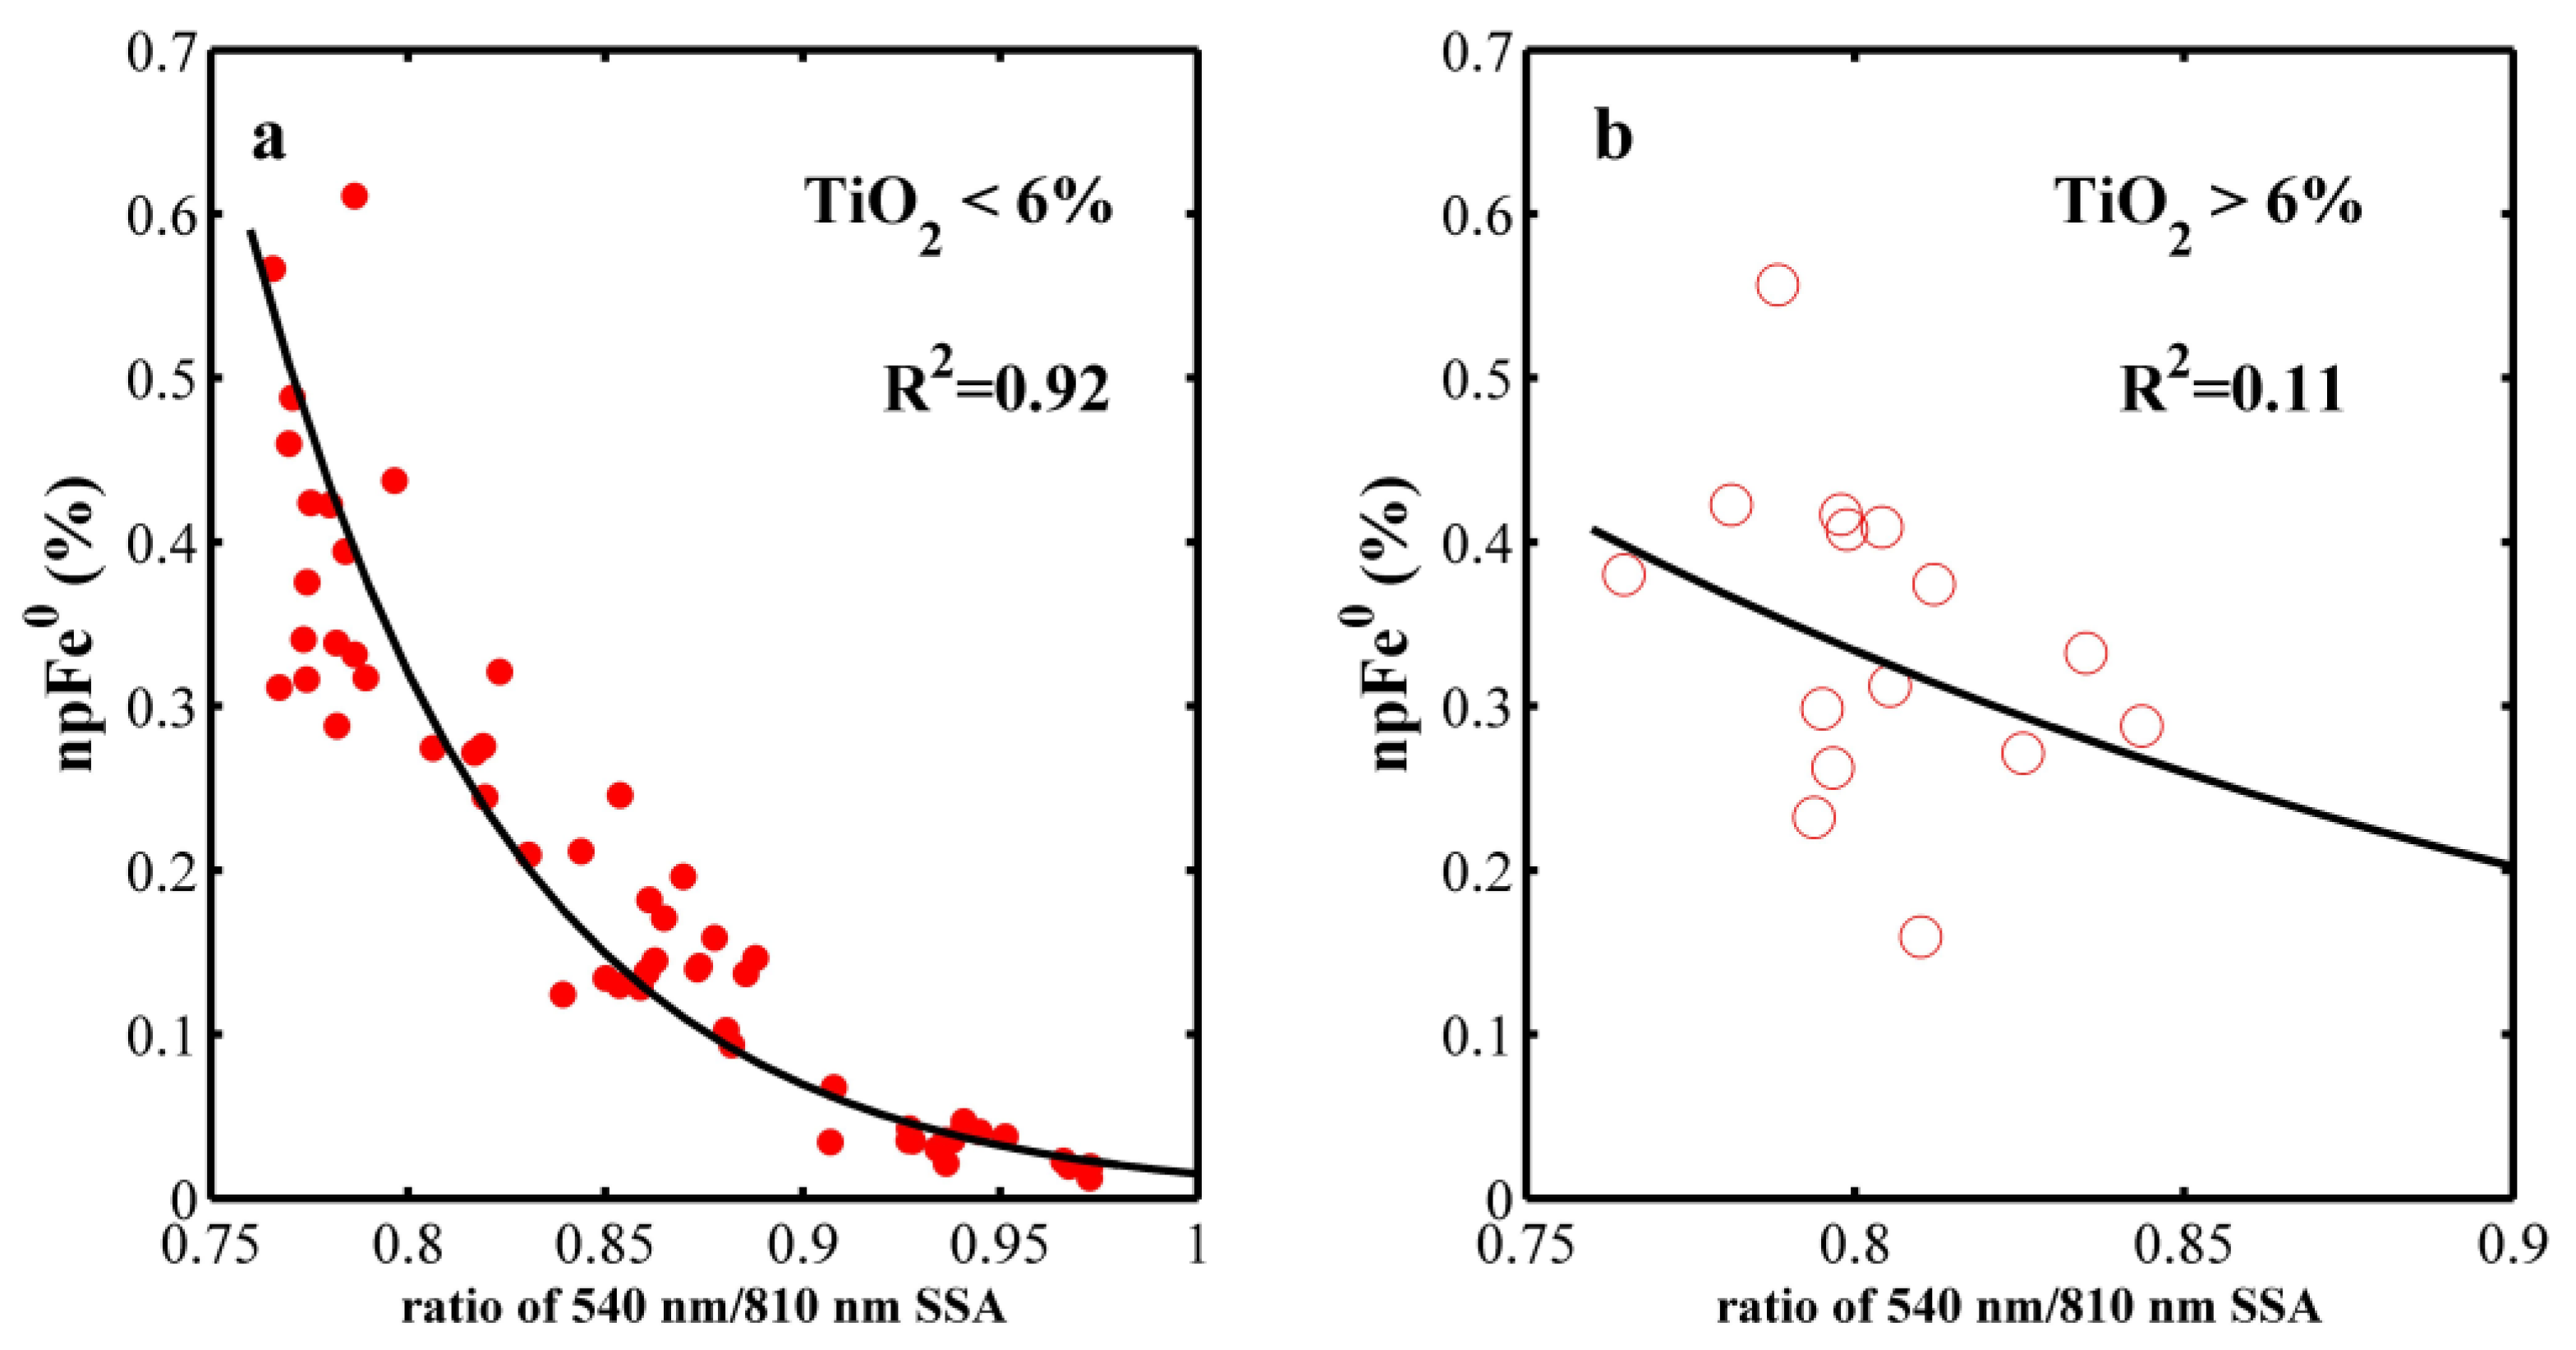
5.2. Non-linear Correlation Analysis
5.3. Case Application and Comparison
- 1)
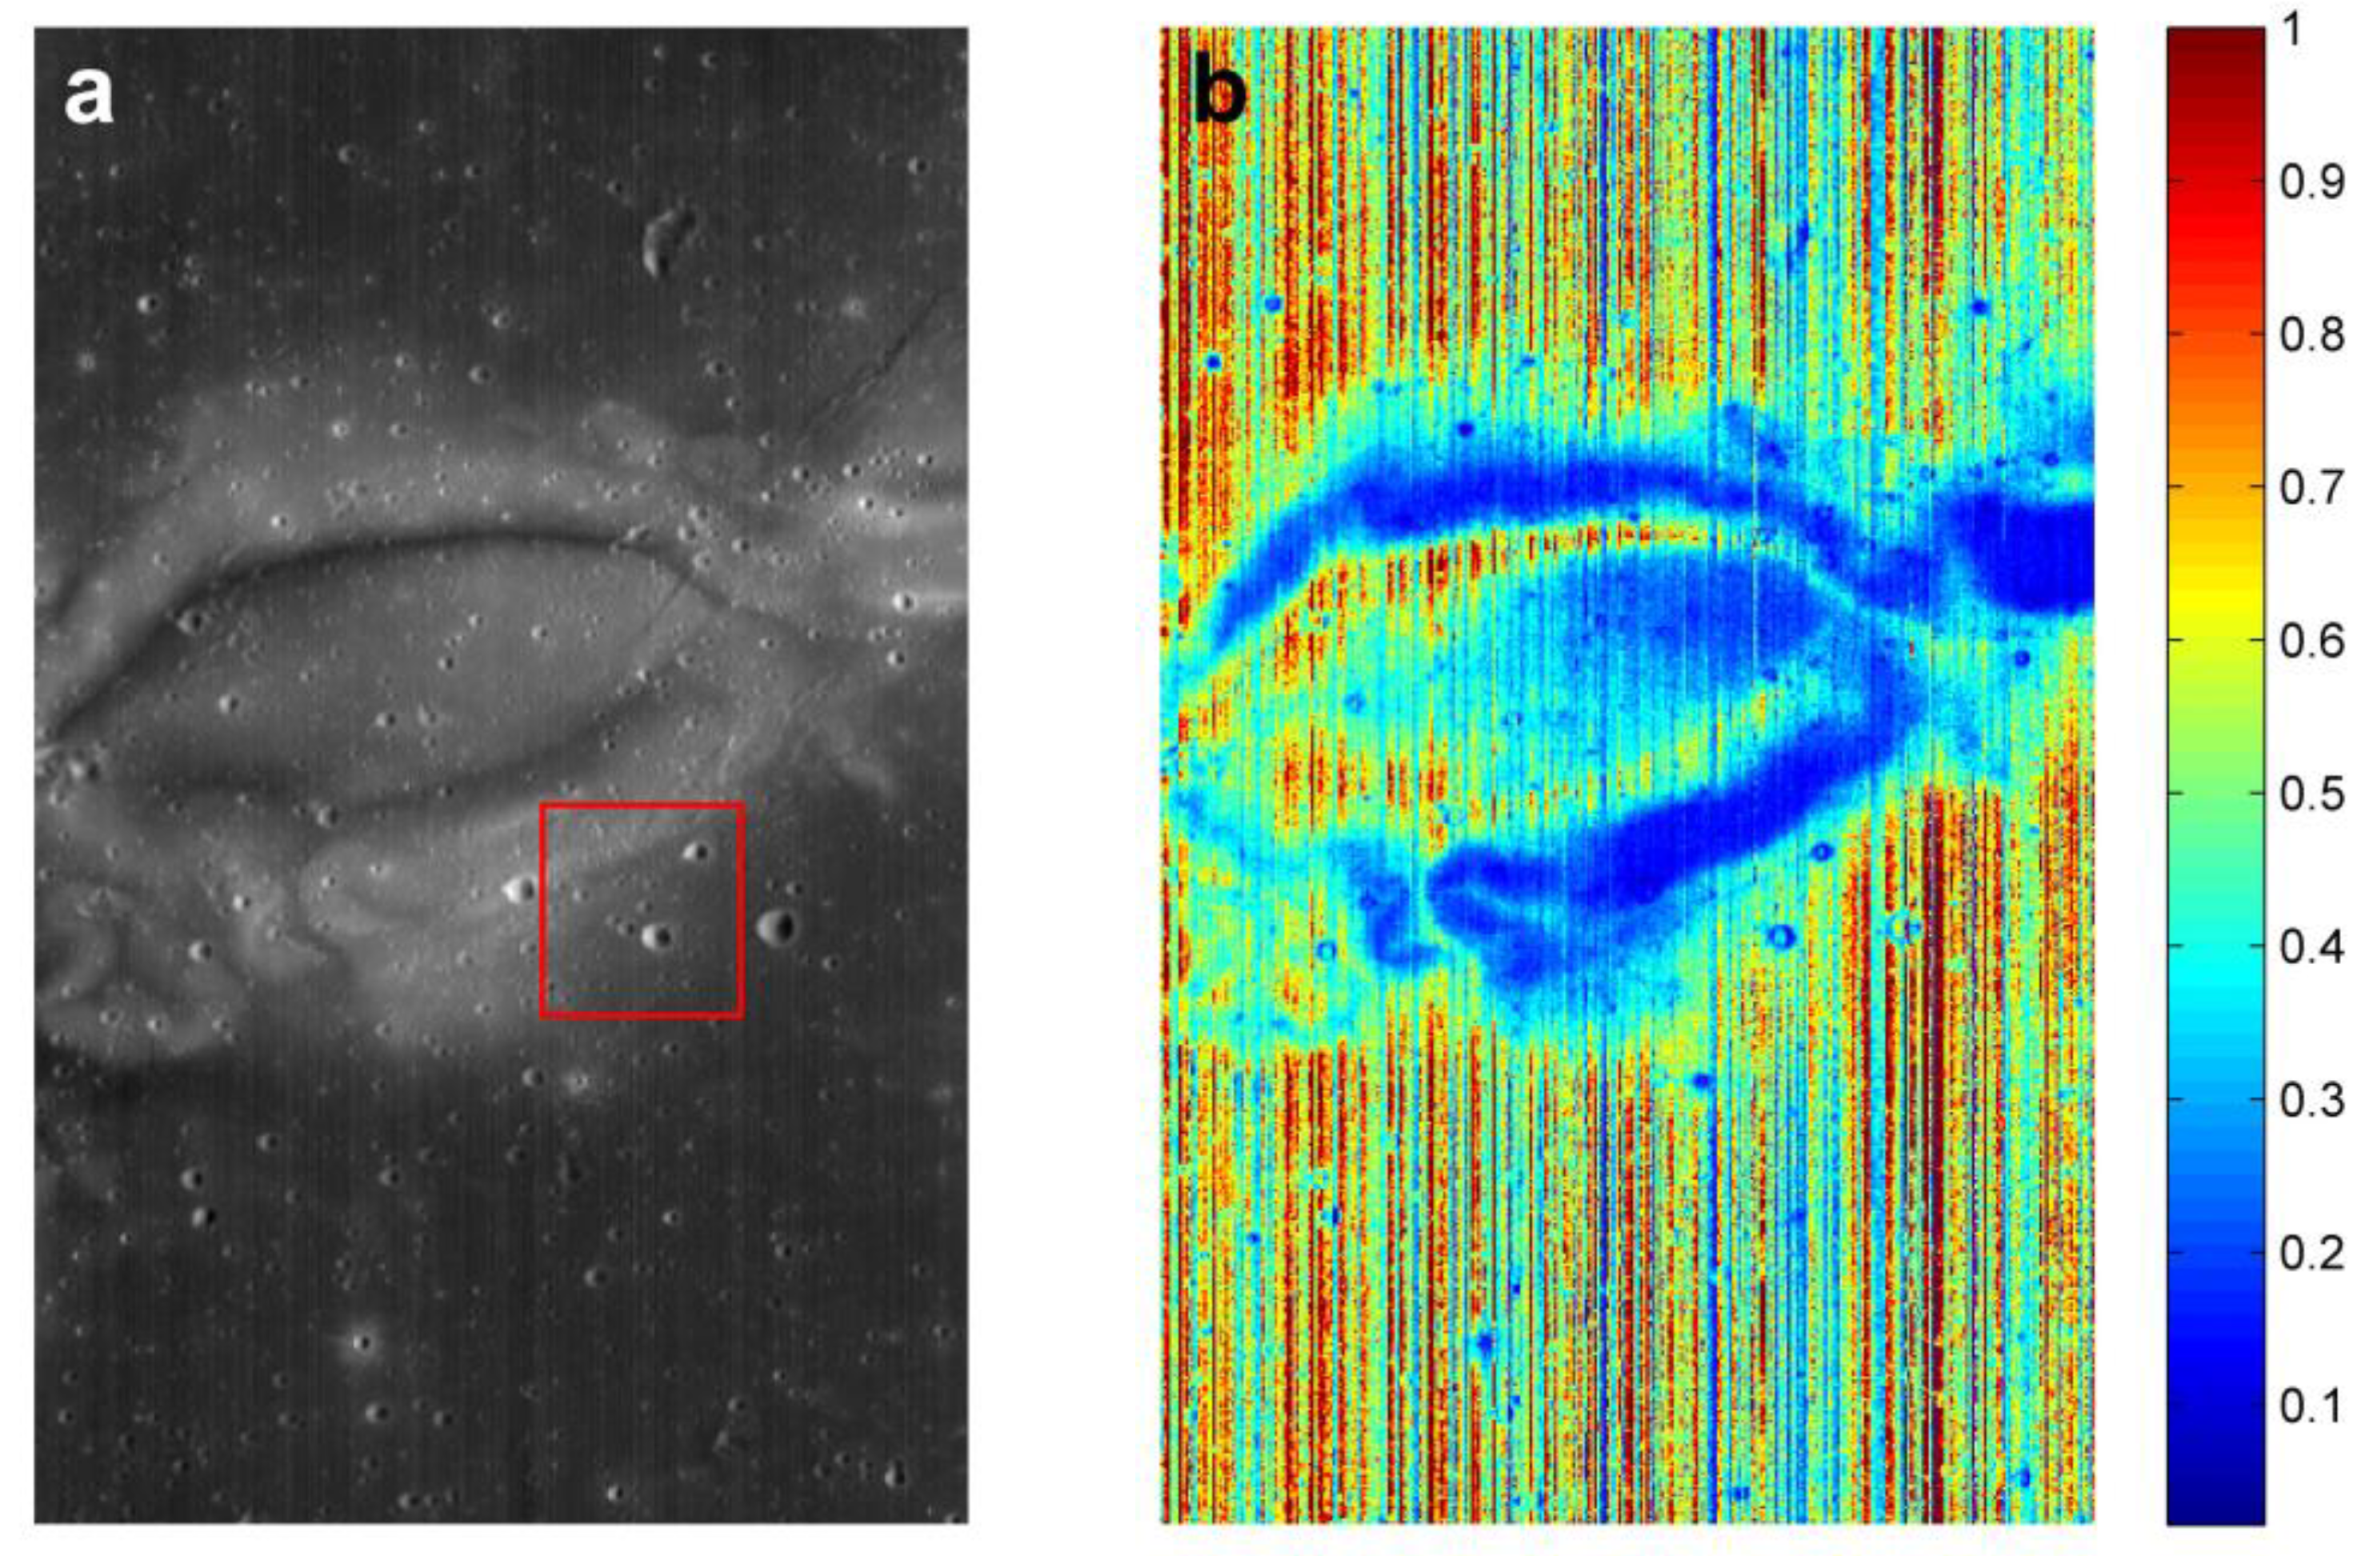
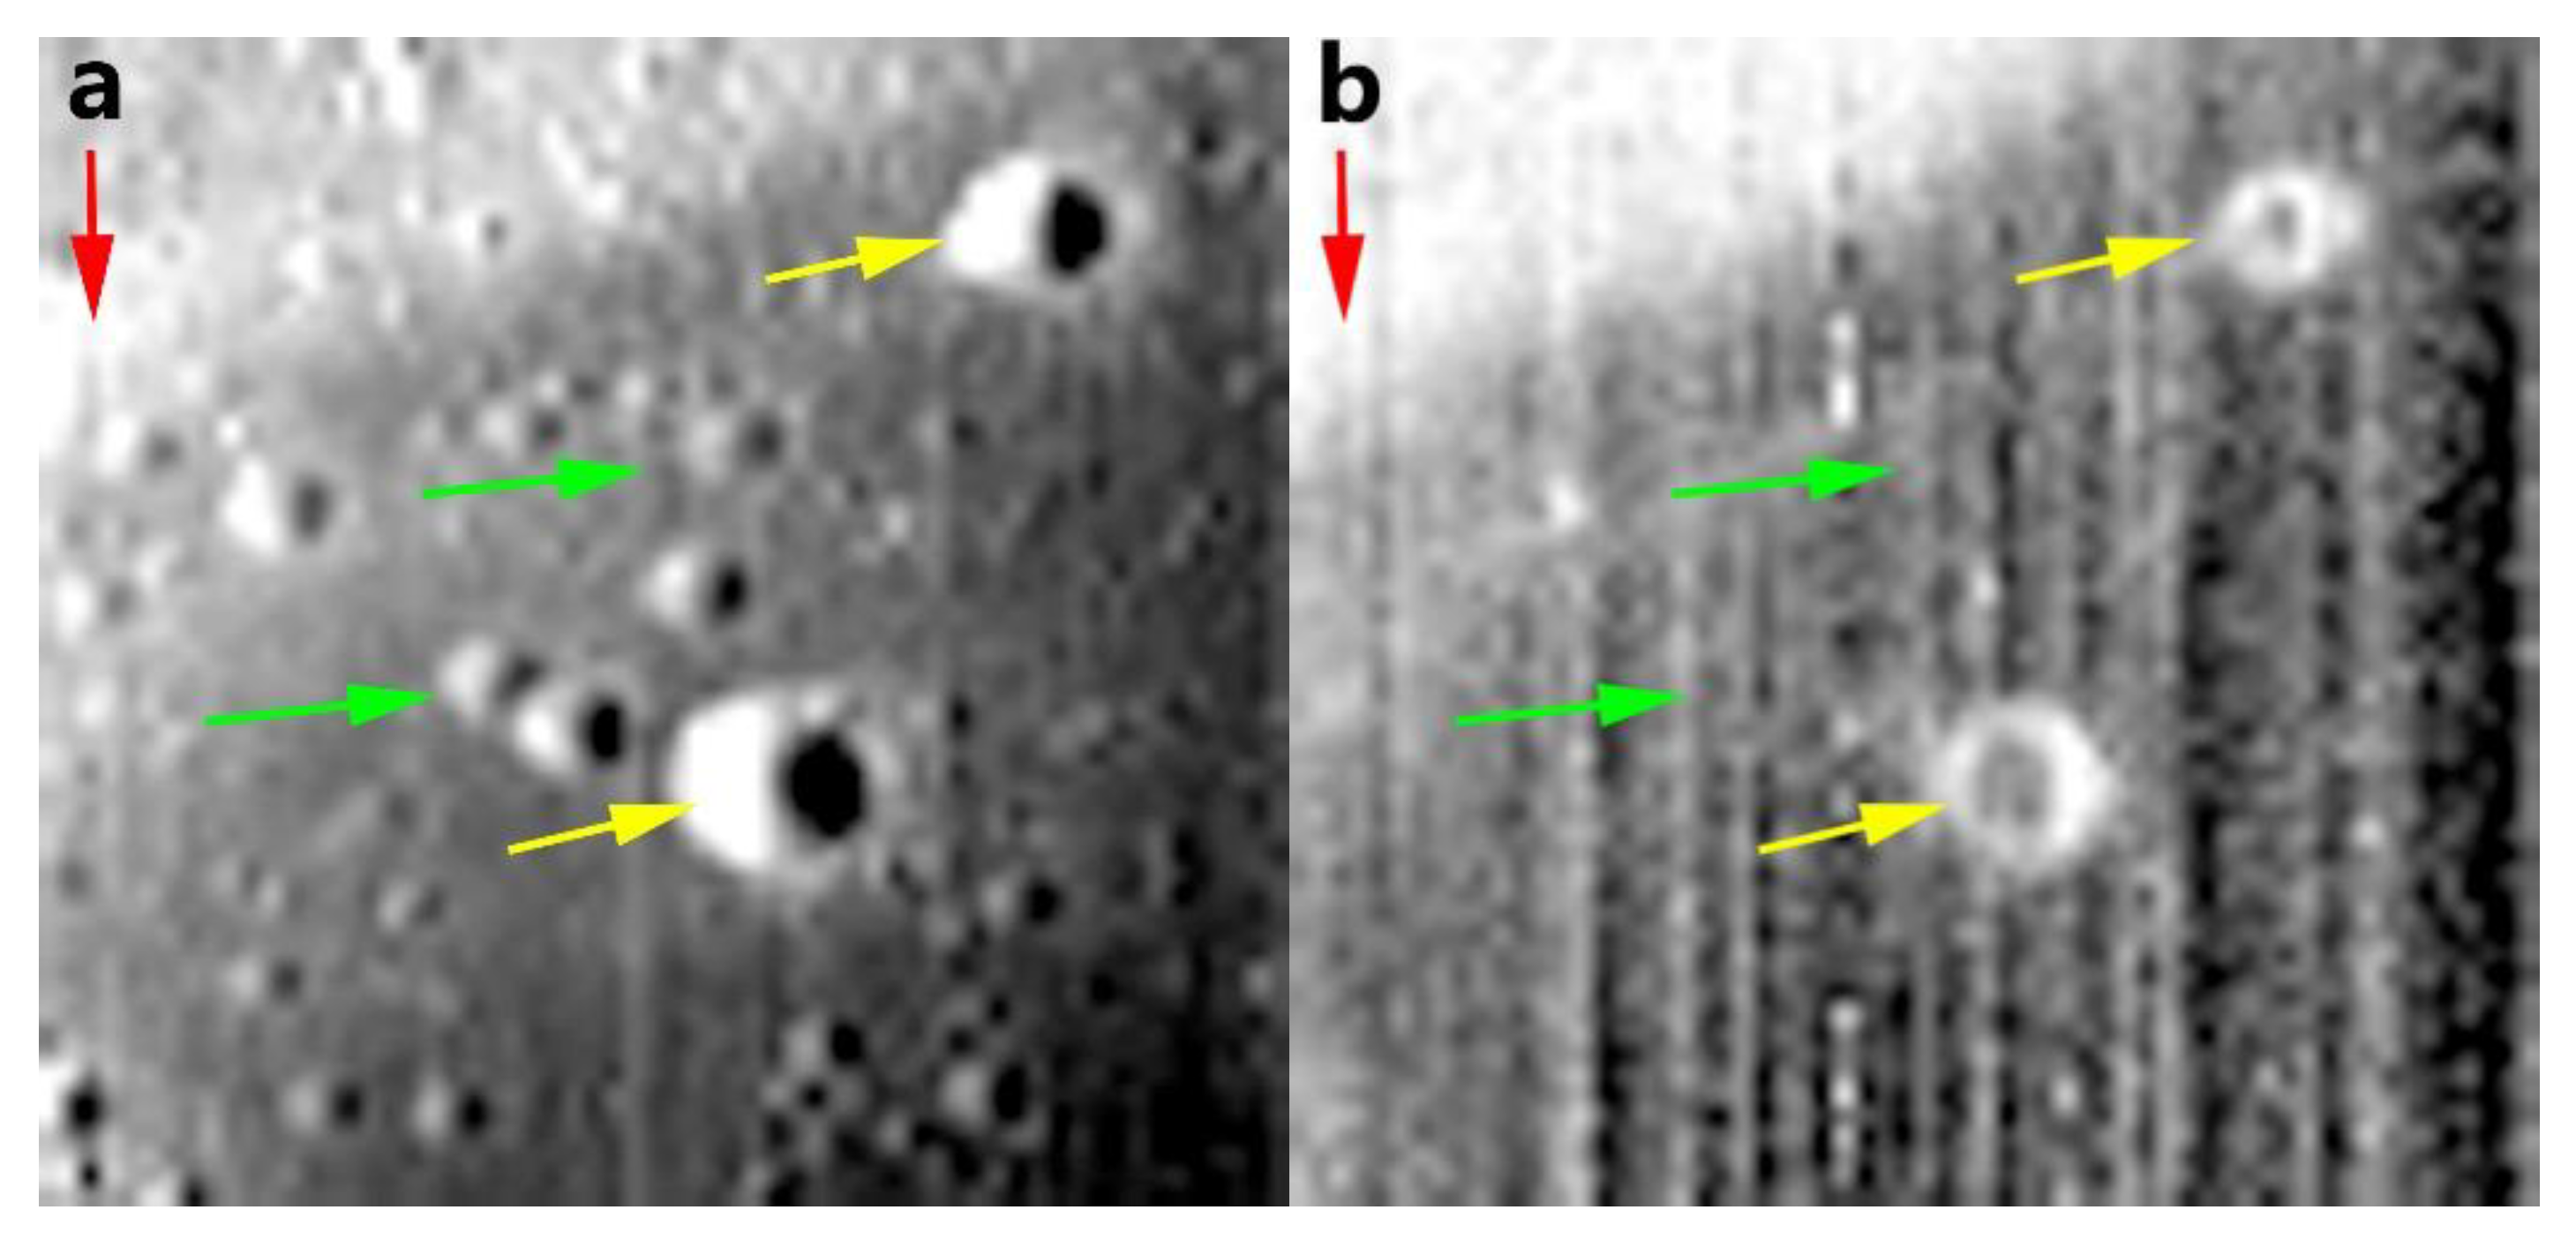
- Lunar swirls
- 2)
- Lunar maria
6. Conclusions
Author Contributions
Funding
Acknowledgments
Conflicts of Interest
Appendix A
References
- Pieters, C.M.; Fischer, E.M.; Rode, O.; Basu, A. Optical effects of space weathering-the role of the finest fraction. J. Geophys. Res. 1993, 98, 20817–20824. [Google Scholar] [CrossRef]
- Chapman, C.R. Space weathering of asteroid surfaces. Annu. Rev. Earth Planet. Sci. 2004, 32, 539–567. [Google Scholar] [CrossRef]
- Hapke, B. Interpretations of optical observations of Mercury and the moon. Phys. Earth Planet. Interi. 1977, 15, 264–274. [Google Scholar] [CrossRef]
- Hapke, B.; Cohen, A.; Cassidy, W.; Wells, E. Solar radiation effects on the optical properties of Apollo 11 lunar samples. In Proceedings of the Apollo 11 Lunar Science Conference, Houston, TX, USA, 5–8 January 1970; pp. 2199–2212. [Google Scholar]
- Noble, S.K.; Pieters, C.M. Space weathering on Mercury: Implications for remote sensing. Sol. Syst. Res. 2003, 37, 31–35. [Google Scholar] [CrossRef]
- Brunetto, R.; Vernazza, P.; Marchi, S.; Birlan, M.; Fulchignoni, M.; Orofino, V.; Strazzulla, G. Modeling asteroid surfaces from observations and irradiation experiments: The case of 832 Karin. Icarus 2006, 184, 327–337. [Google Scholar] [CrossRef]
- Pieters, C.M.; Taylor, L.A.; Noble, S.K.; Keller, L.P.; Hapke, B.; Morris, R.V.; Allen, C.C.; McKay, D.S.; Wentworth, S. Space weathering on airless bodies: Resolving a mystery with lunar samples. Meteorit. Planet. Sci. 2000, 35, 1101–1107. [Google Scholar] [CrossRef]
- McCord, T.B.; Johnson, T.V. Lunar spectral reflectivity (0.30 to 2.50 microns) and implications for remote mineralogical analysis. Science 1970, 169, 855–858. [Google Scholar] [CrossRef]
- McCord, T.B.; Adams, J.B. Progress in remote optical analysis of lunar surface composition. Moon 1973, 7, 453–474. [Google Scholar] [CrossRef]
- Hapke, B. Space weathering from Mercury to the asteroid belt. J. Geophys. Res. 2001, 106, 10039–10073. [Google Scholar] [CrossRef]
- Conel, J.; Nash, D. Spectral reflectance and albedo of Apollo 11 lunar samples: Effects of irradiation and vitrification and comparison with telescopic observations. Geochim. Cosmochim. Acta 1970, 1, 2013–2024. [Google Scholar]
- Cassidy, W.; Hapke, B. Effects of darkening processes on surfaces of airless bodies. Icarus 1975, 25, 371–383. [Google Scholar] [CrossRef]
- Keller, L.P.; Mckay, D.S. Discovery of vapor deposits in the Lunar Regolith. Science 1993, 261, 1305–1307. [Google Scholar] [CrossRef] [PubMed]
- Keller, L.P.; McKay, D.S. The nature and origin of rims on lunar soil grains. Geochim. Cosmochim. Acta 1997, 61, 2331–2341. [Google Scholar] [CrossRef]
- Taylor, L.A.; Pieters, C.M.; Keller, L.P.; Morris, R.V.; McKay, D.S. Lunar mare soils: Space weathering and the major effects of surface-correlated nanophase Fe. J. Geophys. Res. 2001, 106, 27985–27999. [Google Scholar] [CrossRef]
- Taylor, L.A.; Pieters, C.M.; Patchen, A.; Taylor, D.S.; Morris, R.V.; Keller, L.P.; Mckay, D.S. Mineralogical and chemical characterization of lunar highland soils: Insights into the space weathering of soils on airless bodies. J. Geophys. Res. 2010, 115, E02002. [Google Scholar] [CrossRef]
- Hapke, B. Effects of a simulated solar wind on the photometric properties of rocks and powders. Ann. N. Y. Acad. Sci. 1965, 123, 711–721. [Google Scholar] [CrossRef]
- Stern, A. The lunar atmosphere: History, status, current problems, and context. Rev. Geophys. 1999, 37, 453–491. [Google Scholar] [CrossRef]
- Crider, D.H.; Vondrak, R.R. Hydrogen migration to the lunar poles by solar wind bombardment of the moon. Adv. Space Res. 2002, 30, 1869–1874. [Google Scholar] [CrossRef]
- Housley, R.M. A model for chemical and isotopic fractionation in the lunar regolith by impact vaporization. In Proceedings of the Lunar and Planetary Science Conference, Houston, TX, USA, 19–23 March 1979. [Google Scholar]
- Thompson, M.S.; Zega, T.J.; Howe, J.Y. In Situ experimental formation and growth of Fe nanoparticles and vesicles in lunar soil. Meteoritics Planet. Sci. 2017, 52, 413–427. [Google Scholar] [CrossRef]
- Dukes, C.; Baragiola, R.; McFadden, L. Surface modification of olivine by H+ and He+ bombardment. J. Geophys. Res. Planets 1999, 104, 1865–1872. [Google Scholar] [CrossRef]
- Loeffler, M.; Dukes, C.; Baragiola, R. Irradiation of olivine by 4 keV He+: Simulation of space weathering by the solar wind. J. Geophys. Res. Planets 2009, 114, E03003. [Google Scholar] [CrossRef]
- Christoffersen, R.; Rahman, Z.; Keller, L. Solar ion sputter deposition in the lunar regolith: Experimental simulation using focused-ion beam techniques. In Proceedings of the Lunar and Planetary Science Conference, The Woodland, TX, USA, 19–23 March 2012; p. 2614. [Google Scholar]
- Sasaki, S.; Nakamura, K.; Hamabe, Y.; Kurahashi, E.; Hiroi, T. Production of iron nanoparticles by laser irradiation in a simulation of lunar-like space weathering. Nature 2001, 410, 555–557. [Google Scholar] [CrossRef] [PubMed]
- Sasaki, S.; Hiroi, T.; Nakamura, K.; Hamabe, Y.; Kurahashi, E.; Yamada, M. Simulation of space weathering by nanosecond pulse laser heating: Dependence on mineral composition, weathering trend of asteroids and discovery of nanophase iron particles. Adv. Sp. Res. 2002, 29, 783–788. [Google Scholar] [CrossRef]
- Gillis-Davis, J.; Gasda, P.; Bradley, J.; Ishii, H.; Bussey, D. Laser space weathering of Allende (CV2) and Murchison (CM2) carbonaceous chondrites. In Proceedings of the Lunar and Planetary Science Conference, The Woodlands, TX, USA, 16–20 March 2015; p. 1607. [Google Scholar]
- Matsuoka, M.; Nakamura, T.; Kimura, Y.; Hiroi, T.; Nakamura, R.; Okumura, S.; Sasaki, S. Pulse-laser irradiation experiments of Murchison CM2 chondrite for reproducing space weathering on C-type asteroids. Icarus 2015, 254, 135–143. [Google Scholar] [CrossRef]
- Thompson, M.S.; Zega, T.J.; Becerra, P.; Keane, J.T.; Byrne, S. The oxidation state of nanophase fe particles in lunar soil: Implications for space weathering. Meteorit. Planet. Sci. 2016, 51, 1082–1095. [Google Scholar] [CrossRef]
- Housley, R.M.; Grant, R.W.; Paton, N.E. Origin and characteristics of excess Fe metal in lunar glass welded aggregates. In Proceedings of the Lunar Science Conference, Houston, TX, USA, 5–8 March 1973; pp. 2737–2749. [Google Scholar]
- Bandfield, J.L.; Poston, M.J.; Klima, R.L.; Edwards, C.S. Widespread distribution of OH/H2O on the lunar surface inferred from spectral data. Nat. Geosci. 2018, 11, 173–177. [Google Scholar] [CrossRef]
- Hood, L.L.; Schubert, G. Lunar magnetic anomalies and surface optical properties. Science 1980, 208, 49–51. [Google Scholar] [CrossRef]
- Hood, L.L.; Williams, C.R. The lunar swirls: Distribution and possible origins. In Proceedings of the Lunar and Planetary Science Conference, Houston, TX, USA, 14–18 March 1989; pp. 99–113. [Google Scholar]
- Blewett, D.T.; Coman, E.I.; Hawke, B.R.; Gillis-Davis, J.J.; Purucker, M.E.; Hughes, C.G. Lunar swirls: Examining crustal magnetic anomalies and space weathering trends. J. Geophys. Res. 2011, 116, E02002. [Google Scholar]
- Hiroi, T.; Pieters, C.M.; Morris, R.V. New Considerations for estimating lunar soil maturity from VIS-NIR reflectance spectroscopy. In Proceedings of the Lunar and Planetary Science Conference, Houston, TX, USA, 16–20 March 1998; p. 1152. [Google Scholar]
- Mouélic, S.L.; Langevin, Y.; Erard, S. Discrimination between maturity and composition of lunar soils from integrated Clementine UV-visible/near-infrared data: Application to the Aristarchus Plateau. J. Geophys. Res. 2000, 105, 9445–9455. [Google Scholar] [CrossRef]
- Pieters, C.; Shkuratov, Y.; Kaydash, V.; Stankevich, D.; Taylor, L. Lunar soil characterization consortium analyses: Pyroxene and maturity estimates derived from Clementine image data. Icarus 2006, 184, 83–101. [Google Scholar] [CrossRef]
- Trang, D.; Lucey, P.G. Improved space weathering maps of the lunar surface through radiative transfer modeling of Kaguya multiband imager data. Icarus 2019, 321, 307–323. [Google Scholar] [CrossRef]
- Morris, R.V. Surface exposure indices of lunar rocks: A comparative FMR study. In Proceedings of the Lunar and Planetary Science Conference, Houston, TX, USA, 15–19 March 1976; pp. 315–335. [Google Scholar]
- Morris, R.V. The surface exposure (maturity) of lunar soils: Some concepts and Is/FeO compilation. In Proceedings of the Lunar and Planetary Science Conference, Houston, TX, USA, 13–17 March 1978; pp. 2278–2297. [Google Scholar]
- Morris, R.V. Origins and size distribution of metallic iron particles in the lunar regolith. In Proceedings of the Lunar and Planetary Science Conference, Houston, TX, USA, 17–21 March 1980; pp. 1697–1712. [Google Scholar]
- Heiken, G.; McKay, D.S. Petrography of Apollo 17 soils. In Proceedings of the Lunar and Planetary Science Conference, Houston, TX, USA, 18–22 March 1974; pp. 843–860. [Google Scholar]
- Noble, S.K.; Pieters, C.M.; Taylor, L.A.; Morris, R.V.; Allen, C.C.; McKay, D.S.; Keller, L.P. The optical properties of the finest fraction of lunar soil: Implications for space weathering. Meteorit. Planet. Sci. 2001, 36, 31–42. [Google Scholar] [CrossRef]
- Liu, D.; Li, L.; Zhang, Y.Z. Sensitivity analysis for Hapke’s radiative transfer model. In Proceedings of the Lunar and Planetary Science Conference, The Woodlands, TX, USA, 18–22 March 2013; p. 1290. [Google Scholar]
- Liu, D. Improvement and Use of Radiative Transfer Models to Assess Lunar Space Weathering and Mechanisms for Swirl Formation. Ph.D. Thesis, Indiana University, Indiana, IN, USA, 2015. [Google Scholar]
- Noble, S.K.; Pieters, C.M.; Keller, L.P. An experimental approach to understanding the optical effects of space weathering. Icarus 2007, 192, 629–642. [Google Scholar] [CrossRef]
- Fischer, E.M.; Pieters, C.M.; Pratt, S.F. Modeling the space weathering-induced optical alteration of lunar soils: First results. In Proceedings of the Lunar and Planetary Science Conference, Houston, TX, USA, 15–19 March 1994; pp. 371–372. [Google Scholar]
- Fischer E., M.; Pieters, C.M. A Model for lunar soil optical alteration due to space weathering. In Proceedings of the Lunar and Planetary Science Conference, Houston, TX, USA, 14–18 March 1995; pp. 395–396. [Google Scholar]
- Wohlfarth, K.S.; Wöhler, C.; Grumpe, A. Space Weathering and Lunar OH/H2O—Insights from Ab Initio Mie Modeling of Submicroscopic Iron. Astron. J. 2019, 158, 80. [Google Scholar] [CrossRef]
- Yan, B.; Wang, R.; Gan, F.; Wang, Z. Minerals mapping of the lunar surface with Clementine UVVIS/NIR data based on spectra unmixing method and Hapke model. Icarus 2010, 208, 11–19. [Google Scholar] [CrossRef]
- Adams, J.B.; Filice, A.L. Spectral reflectance 0.4 to 2.0 microns of silicate rock powders. J. Geophys. Res. 1967, 72, 5705–5715. [Google Scholar] [CrossRef]
- Pieters, C.M. Strength of mineral absorption features in the transmitted component of near-infrared reflected light: First results from RELAB. J. Geophys. Res. 1983, 88, 9534–9544. [Google Scholar] [CrossRef]
- Lucey, P.G. Radiative transfer modeling of the effect of mineralogy on some empirical methods for estimating iron concentration from multispectral imaging of the Moon. J. Geophys. Res. 2006, 111, E08003. [Google Scholar] [CrossRef]
- Hapke, B. Bidirectional reflectance spectroscopy: 1. Theory. J. Geophys. Res. 1981, 86, 3039–3054. [Google Scholar] [CrossRef]
- Lucey, P.G.; Blewett, D.T.; Hawke, B.R. Mapping the FeO and TiO2 content of the lunar surface with multispectral inagery. J. Geophys. Res. 1998, 103, 3679–3699. [Google Scholar] [CrossRef]
- Johnson, J.R.; Larson, S.M.; Singer, R.B. Remote sensing of potential lunar resources: 1. Near-Side compositional properties. J. Geophys. Res. 1991, 96, 18861–18882. [Google Scholar] [CrossRef]
- Pieters, C.M.; Noble, S.K. Space weathering on airless bodies. J. Geophys. Res. 2016, 121, 1865–1884. [Google Scholar] [CrossRef] [PubMed]
- Lucey, P.G.; Riner, M.A. The optical effects of small iron particles that darken but do not redden: Evidence of intense space weathering on Mercury. Icarus 2011, 212, 451–462. [Google Scholar] [CrossRef]
- Liu, D.; Li, L.; Sun, Y. An improved radiative transfer model for estimating mineral abundance of immature and mature lunar soils. Icarus 2015, 253, 40–50. [Google Scholar] [CrossRef]
- Schultz, P.H.; Srnka, L.J. Cometary collisions on the Moon and Mercury. Nature 1980, 284, 22–26. [Google Scholar] [CrossRef]
- Richmond, N.C.; Hood, L.L.; Mitchell, D.L.; Lin, R.P.; Acuna, M.H.; Binder, A.B. Correlations between magnetic anomalies and surface geology antipodal to lunar impact basins. J. Geophys. Res. 2005, 110, E05011. [Google Scholar] [CrossRef]
- Besse, S.; Dhingra, D.; Nettles, J.; Klima, R.; Garrick-Bethell, I.; Clark, R.N.; Combe, J.P.; Head, J.W., III; Taylor, L.A.; Pieters, C.M.; et al. M3 spectral analysis of lunar swirls and the link between optical maturation and surface hydroxyl formation at magnetic anomalies. J. Geophys. Res. 2011, 116, E9. [Google Scholar]
- Kramer, G.Y.; Combe, J.P.; Harnett, E.M.; Hawke, B.R.; Noble, S.K.; Blewett, D.T.; McCord, T.B.; Giguere, T.A. Characterization of lunar swirls at Mare Ingenii: A model for space weathering at magnetic anomalies. J. Geophys. Res. Planet 2011, 16, E04008. [Google Scholar] [CrossRef]
- Hapke, B. Theory of Reflectance and Emittance Spectroscopy; Cambridge University Press: New York, NY, USA, 2005. [Google Scholar]
- Mustard, J.F.; Pieters, C.M. Photometric phase functions of common geologic minerals and applications to quantitative analysis of mineral mixture reflectance spectra. J. Geophys. Res. Solid Earth 1989, 94, 13619–13634. [Google Scholar] [CrossRef]


| Sample | FeO (%) | Is/FeO | Ilmenite (%) | Agglutinitic Glass (%) | Grain Size | Highland/Mare |
|---|---|---|---|---|---|---|
| 10084 | 12 | 145 | 5 | 62.6 | <10 μm | Mare |
| 12001 | 12.5 | 115 | 1.6 | 61.9 | <10 μm | Mare |
| 12030 | 14.3 | 32 | 3 | 55 | <10 μm | Mare |
| 15041 | 11 | 161 | 0.7 | 70.4 | <10 μm | Mare |
| 15071 | 9.59 | 159 | 1.2 | 59.7 | <10 μm | Mare |
| 70181 | 12.7 | 104 | 3.4 | 58.3 | <10 μm | Mare |
| 71501 | 13.5 | 88 | 7.6 | 53.1 | <10 μm | Mare |
| 79221 | 11.3 | 169 | 5.2 | 61.5 | <10 μm | Mare |
| 14141 | 7.66 | 14.5 | 1.7 | 45.9 | <10 μm | Highland |
| 14163 | 8.83 | 87 | 1.1 | 66.3 | <10 μm | Highland |
| 14259 | 7.82 | 174.8 | 1.5 | 71.6 | <10 μm | Highland |
| 14260 | 8.1 | 144.9 | 1.3 | 66.5 | <10 μm | Highland |
| 61141 | 3.66 | 119.3 | 0.3 | 61.6 | <10 μm | Highland |
| 61221 | 3.64 | 19.8 | 0.9 | 41.6 | <10 μm | Highland |
| 62231 | 3.63 | 169 | 0.4 | 69.5 | <10 μm | Highland |
| 64801 | 3.84 | 115.2 | 0.2 | 63.6 | <10 μm | Highland |
| 67461 | 3.35 | 35.2 | 0.2 | 35.8 | <10 μm | Highland |
| 67481 | 3.61 | 38.5 | 0.2 | 35.2 | <10 μm | Highland |
| 10084 | 14.7 | 87 | 5.2 | 57 | 10–20 μm | Mare |
| 12001 | 15.9 | 67 | 1.8 | 56.8 | 10–20 μm | Mare |
| 12030 | 17.2 | 17 | 3.2 | 49.8 | 10–20 μm | Mare |
| 15041 | 14.4 | 92 | 0.8 | 56.7 | 10–20 μm | Mare |
| 15071 | 15.4 | 80 | 1.8 | 49.2 | 10–20 μm | Mare |
| 70181 | 15.5 | 63 | 6.7 | 51.7 | 10–20 μm | Mare |
| 71501 | 16.4 | 50 | 9.7 | 44.8 | 10–20 μm | Mare |
| 79221 | 15 | 78 | 6 | 54.3 | 10–20 μm | Mare |
| 14141 | 9.46 | 11.6 | 1.1 | 48.6 | 10–20 μm | Highland |
| 14163 | 10.1 | 64.8 | 0.9 | 58.5 | 10–20 μm | Highland |
| 14259 | 9.71 | 101.8 | 1.2 | 68.7 | 10–20 μm | Highland |
| 14260 | 9.84 | 98.9 | 1 | 65.2 | 10–20 μm | Highland |
| 61141 | 5.14 | 81.6 | 0.3 | 53.9 | 10–20 μm | Highland |
| 61221 | 4.4 | 13.89 | 0.3 | 32.6 | 10–20 μm | Highland |
| 62231 | 4.86 | 109.9 | 0.5 | 55 | 10–20 μm | Highland |
| 64801 | 4.78 | 84.9 | 0.2 | 61 | 10–20 μm | Highland |
| 67461 | 4.64 | 23.9 | 0.3 | 32.4 | 10–20 μm | Highland |
| 67481 | 4.04 | 33 | 0.2 | 28.6 | 10–20 μm | Highland |
| 10084 | 15.5 | 67 | 6.4 | 53.9 | 20–45 μm | Mare |
| 12001 | 16.9 | 51 | 2.6 | 56.2 | 20–45 μm | Mare |
| 12030 | 17.6 | 12 | 2.6 | 39.4 | 20–45 μm | Mare |
| 15041 | 15.2 | 66 | 1.2 | 51.3 | 20–45 μm | Mare |
| 15071 | 15.6 | 49 | 1.9 | 47.6 | 20–45 μm | Mare |
| 70181 | 16 | 53 | 8.9 | 43.4 | 20–45 μm | Mare |
| 71501 | 17.8 | 28 | 12.3 | 38.3 | 20–45 μm | Mare |
| 79221 | 15.8 | 57 | 7.3 | 46.5 | 20–45 μm | Mare |
| 14141 | 11.6 | 5.8 | 1.9 | 41 | 20–45 μm | Highland |
| 14163 | 11.5 | 43.2 | 0.8 | 56.4 | 20–45 μm | Highland |
| 14259 | 11 | 77.2 | 1.3 | 60.5 | 20–45 μm | Highland |
| 14260 | 10.7 | 80.2 | 0.9 | 64 | 20-45 μm | Highland |
| 61141 | 5.15 | 75.5 | 0.3 | 50.1 | 20–45 μm | Highland |
| 61221 | 4.62 | 8.4 | 0.6 | 28.9 | 20–45 μm | Highland |
| 62231 | 5.31 | 80.7 | 0.3 | 50.6 | 20–45 μm | Highland |
| 64801 | 4.82 | 83.4 | 0.3 | 53.6 | 20–45 μm | Highland |
| 67461 | 4.93 | 22.3 | 0.3 | 25.4 | 20–45 μm | Highland |
| 67481 | 5.19 | 20.7 | 0.1 | 27.6 | 20–45 μm | Highland |
| 10084 | 14.8 | 88 | <45 μm | Mare | ||
| 12001 | 16 | 62 | <45 μm | Mare | ||
| 12030 | 16 | 20 | <45 μm | Mare | ||
| 15041 | 14.2 | 93 | <45 μm | Mare | ||
| 15071 | 14.9 | 71 | <45 μm | Mare | ||
| 70181 | 15.3 | 61 | <45 μm | Mare | ||
| 71501 | 16.5 | 44 | <45 μm | Mare | ||
| 79221 | 14 | 91 | <45 μm | Mare | ||
| 14141 | 9.81 | 9.7 | <45 μm | Highland | ||
| 14163 | 9.94 | 66.5 | <45 μm | Highland | ||
| 14259 | 9.54 | 108.6 | <45 μm | Highland | ||
| 14260 | 9.65 | 93.3 | <45 μm | Highland | ||
| 61141 | 4.8 | 94.5 | <45 μm | Highland | ||
| 61221 | 4.47 | 13.6 | <45 μm | Highland | ||
| 62231 | 4.87 | 116.7 | <45 μm | Highland | ||
| 64801 | 4.68 | 92.2 | <45 μm | Highland | ||
| 67461 | 4.24 | 29.8 | <45 μm | Highland | ||
| 67481 | 4.38 | 33.5 | <45 μm | Highland |
| Grain Size | R2 | ||
|---|---|---|---|
| <10 μm | 4.6478 | 5.375 | 0.90 |
| 10–20 μm | 2.1549 | 4.991 | 0.92 |
| 20–45 μm | 1.8737 | 5.648 | 0.89 |
| <45 μm | 2.1155 | 4.836 | 0.89 |
© 2020 by the authors. Licensee MDPI, Basel, Switzerland. This article is an open access article distributed under the terms and conditions of the Creative Commons Attribution (CC BY) license (http://creativecommons.org/licenses/by/4.0/).
Share and Cite
Liu, D.; Zhang, Y.; Zhang, G.; Liu, B.; Ren, X.; Xu, R.; Li, C. An Empirical Model to Estimate Abundance of Nanophase Metallic Iron (npFe0) in Lunar Soils. Remote Sens. 2020, 12, 1047. https://doi.org/10.3390/rs12061047
Liu D, Zhang Y, Zhang G, Liu B, Ren X, Xu R, Li C. An Empirical Model to Estimate Abundance of Nanophase Metallic Iron (npFe0) in Lunar Soils. Remote Sensing. 2020; 12(6):1047. https://doi.org/10.3390/rs12061047
Chicago/Turabian StyleLiu, Dawei, Yuanzhi Zhang, Guangliang Zhang, Bin Liu, Xin Ren, Rui Xu, and Chunlai Li. 2020. "An Empirical Model to Estimate Abundance of Nanophase Metallic Iron (npFe0) in Lunar Soils" Remote Sensing 12, no. 6: 1047. https://doi.org/10.3390/rs12061047
APA StyleLiu, D., Zhang, Y., Zhang, G., Liu, B., Ren, X., Xu, R., & Li, C. (2020). An Empirical Model to Estimate Abundance of Nanophase Metallic Iron (npFe0) in Lunar Soils. Remote Sensing, 12(6), 1047. https://doi.org/10.3390/rs12061047