Review

The role of Interferometric Synthetic Aperture Radar in Detecting, Mapping, Monitoring, and Modelling the Volcanic Activity of Piton de la Fournaise, La Réunion: A Review

1
Institut de Physique du Globe de Paris, Université de Paris, CNRS, 75005 Paris, France
2
Observatoire Volcanologique du Piton de la Fournaise, Institut de physique du globe de Paris, 97418 La Plaine des Cafres, France
3
IRD, OPGC, Université Clermont Auvergne, CNRS, 63000 Clermont-Ferrand, France
*
Author to whom correspondence should be addressed.
Remote Sens. 2020, 12(6), 1019; https://doi.org/10.3390/rs12061019
Submission received: 31 December 2019 / Revised: 9 March 2020 / Accepted: 10 March 2020 / Published: 22 March 2020
(This article belongs to the Special Issue InSAR for Earth Observation)

Abstract

:
Synthetic Aperture Radar (SAR) remote sensing plays a significant role in volcano monitoring despite the measurements’ non real-time nature. The technique’s capability of imaging the spatial extent of ground motion has especially helped to shed light on the location, shape, and dynamics of subsurface magmatic storage and transport as well as the overall state of activity of volcanoes worldwide. A variety of different deformation phenomena are observed at exceptionally active and frequently erupting volcanoes, like Piton de la Fournaise on La Réunion Island. Those offer a powerful means of investigating related geophysical source processes and offer new insights into an active volcano’s edifice architecture, stability, and eruptive behavior. Since 1998, Interferometric Synthetic Aperture Radar (InSAR) has been playing an increasingly important role in developing our present understanding of the Piton de la Fournaise volcanic system. We here collect the most significant scientific results, identify limitations, and summarize the lessons learned from exploring the rich Piton de la Fournaise SAR data archive over the past ~20 years. For instance, the technique has delivered first evidence of the previously long suspected mobility of the volcano’s unsupported eastern flank, and it is especially useful for detecting displacements related to eruptions that occur far away from the central cone, where Global Navigation Satellite System (GNSS) stations are sparse. However, superimposed deformation processes, dense vegetation along the volcano’s lower eastern flank, and turbulent atmospheric phase contributions make Piton de la Fournaise a challenging target for applying InSAR. Multitemporal InSAR approaches that have the potential to overcome some of these limitations suffer from frequent eruptions that cause the replacement of scatterers. With increasing data acquisition rates, multisensor complementarity, and advanced processing techniques that resourcefully handle large data repositories, InSAR is progressively evolving into a near-real-time, complementary, operational volcano monitoring tool. We therefore emphasize the importance of InSAR at highly active and well-monitored volcanoes such as Mount Etna, Italy, Kīlauea Volcano, Hawai’i, and Piton de la Fournaise, La Réunion.

Graphical Abstract

1. Introduction

Magma movement through volcanic edifices is usually accompanied by measurable indicators of volcanic unrest, the most reliable of which are seismicity, gas emissions, and surface deformation. Characterizing and better understanding the subsurface processes in terms of their spatio-temporal dynamics therefore requires natural study sites that are (a) highly active and (b) well-monitored over long time periods by a dense network of instrumentation. Frequently erupting and closely monitored volcanic systems serve as natural laboratories for studying subsurface magmatic transport and storage systems, identifying and better understanding long-term and short-term eruption precursors, and constraining related volcanic hazards.
With one eruption every eight months on average over a ~50 year period [1,2], and operational monitoring employed since late 1979, Piton de la Fournaise, La Réunion, is undoubtedly one of the most active and best-studied basaltic hot-spot ocean island volcanoes on Earth [3]. Compared to other volcanic settings, Piton de la Fournaise seems a fairly intelligible volcanic system. The volcano formed on the eastern flank of its larger neighbor Piton des Neiges (3069 m), a piggyback set-up that gives direction of gravitational spreading of the Piton de la Fournaise volcanic edifice towards the unsupported eastern flank [4]. Measurable surface deformation and/or (sometimes catastrophic) topographic changes in the volcano’s past provide evidence of internal structural adjustments that occur as a result of the edifice’s growth.
The most characteristic topographic feature of Piton de la Fournaise volcano is a prominent east-facing, u-shaped, and steep Enclos Grand Brûlé collapse structure (extending ~8 km N–S and ~13 km W–E, cf. Figure 1), the upper part of which is referred to as the Enclos Fouqué caldera, while the steep upper slopes are known as the Grandes Pentes, and the lower slopes as the Grand Brûlé (Figure 1). While the true origin of the collapsed structure remains controversial, the Enclos Fouqué seems to at least partially result from vertical collapse(s), while the Grandes Pentes and the Grand Brûlé have been affected by lateral flank failure that occurred about 4500 years ago [5,6,7,8,9,10,11,12,13,14,15]. The Enclos Fouqué caldera hosts the currently active volcanic center, a 400-m-high central cone with its two deep summit craters, Bory and Dolomieu. The volcano’s interior has been imaged down to a depth of about 10 km by means of geophysical data (Figure 1), and it can be roughly described as a pile of poorly consolidated eruption deposits that host a shallow plumbing system consisting of several intermittently connected magma reservoirs, the shallowest of which is located at ~2–2.5 km depth below the summit craters [1,16]. This is the central magmatic storage from which most of the laterally propagating dikes feeding recent eruptions are initiating or passing through. Three major rift zones are radiating North–East (NE), South–East (SE), and in 120° from the central cone, and function as preferred zones of magmatic intrusions (Figure 1 and Figure 2) [3]. Seismicity related to volcanic activity at Piton de la Fournaise is generally small in magnitude (below magnitude 3, cf. Figure 1) [17]. Underneath the eastern flank of the volcano, seismic events are sparse compared to the number of volcano tectonic (VT) events recorded below the central cone, and they occur in a few seismic clusters (Figure 1). Several tectonic structures have been identified from seismicity and deformation [13,18,19], but not much structural evidence of compression exists along the volcano’s spreading flank [3].
The volcano has erupted frequently throughout the past 20 years. Following a rest period of more than five years, the eruptive activity of Piton de la Fournaise resumed on 9 March 1998 [20]. From then until 2007 continuous refilling of the plumbing system had been observed, and short-term eruptive cycles pre-dominated the volcano’s eruptive pattern and culminated in more important distal eruptions. During the major 30 March to 1 May 2007 distal eruption that excelled common Piton de la Fournaise eruptions by an order of magnitude in terms of lava flow volume, the Dolomieu summit crater collapsed. This event destroyed the upper reservoir and distribution system and changed the eruptive behavior of the volcano. Between 2008 and 2010 only low-volume summit or near-summit eruptions and many intrusions occurred. This was followed by a rest period of 41 months between 2011 and June 2014 before another phase of nearly continuous refilling and high activity began [21], which is ongoing as of 31 December 2019.
Deformation monitoring at Piton de la Fournaise started in 1980 with the installation of (initially only a few) permanent tiltmeters and extensometers, as well as a frequently measured levelling network, all of which were employed and are operated by the Institut de Physique du Globe de Paris (IPGP) through the Piton de la Fournaise Volcanological Observatory (OVPF). The monitoring network had been progressively improved in order to sample the volcano’s deformation field thoroughly in time and space. In 2004 a first telemetered Global Navigation Satellite System (GNSS) network was employed, and in 2007 the deformation monitoring network at Piton de la Fournaise included 8 continuous tiltmeters, 4 continuous extensometers, and 12 continuous GPS stations [22]. As of the time of writing, ground deformation is measured by 21 permanent GNSS stations (in fact, 24 including three stations that are not shown on the map: “REUN”, which is located about 15.5 km northwest of the central volcanic cone, “TRCG”, and “FEUG” that are also located outside of the caldera) in addition to 9 tiltmeters (plus one additional tiltmeter “RER” that is located about 8 km northeast of the summit cone and is not shown on the map), 3 extensometers, and a network of 75 stainless steel benchmarks that are surveyed by GNSS campaigns immediately after eruptions (Figure 2). While permanently installed ground-based instrumentation delivers point-wise, highly precise, and continuous records of surface displacements in real-time and 3D, Interferometric Synthetic Aperture Radar (InSAR) sheds light on the spatial extent of ground movements over large areas and at a high measurement point density throughout a volcano’s eruption cycle.
The first SAR image acquired of Piton de la Fournaise volcano dates back to 1996 [23], and since the beginning of systematic ASAR acquisitions in 2003, SAR satellite data are routinely collected in the framework of the Indian Ocean InSAR Observatory (OI2), an Observation Service of the French National Service of Volcanological Observation (INSU/CNRS), and processed at the Observatoire de Physique du Globe at Clermont-Ferrand (OPGC). In addition, since late-2017, OVPF has operational InSAR and multitemporal InSAR (MT-InSAR) processing capacities on site, and processing is done with a focus on the long-term assessment of the volcano’s eastern flank stability. All SAR data cover the entire Enclos Grand Brûlé collapse structure, except for COSMO-SkyMed (CSK) and TerraSAR-X (TSX) SpotLight (SPT) data (the spatial coverages of which are indicated by orange and light green frames in Figure 2, respectively). Details on available SAR data and archives are provided in the following Section 2. The combination of both InSAR and the permanent ground monitoring network with additional extensive geodetic benchmark campaigns has been essential to constrain models and improve our understanding of the inner architecture and long-term eruptive behavior of Piton de la Fournaise volcano (Section 3).

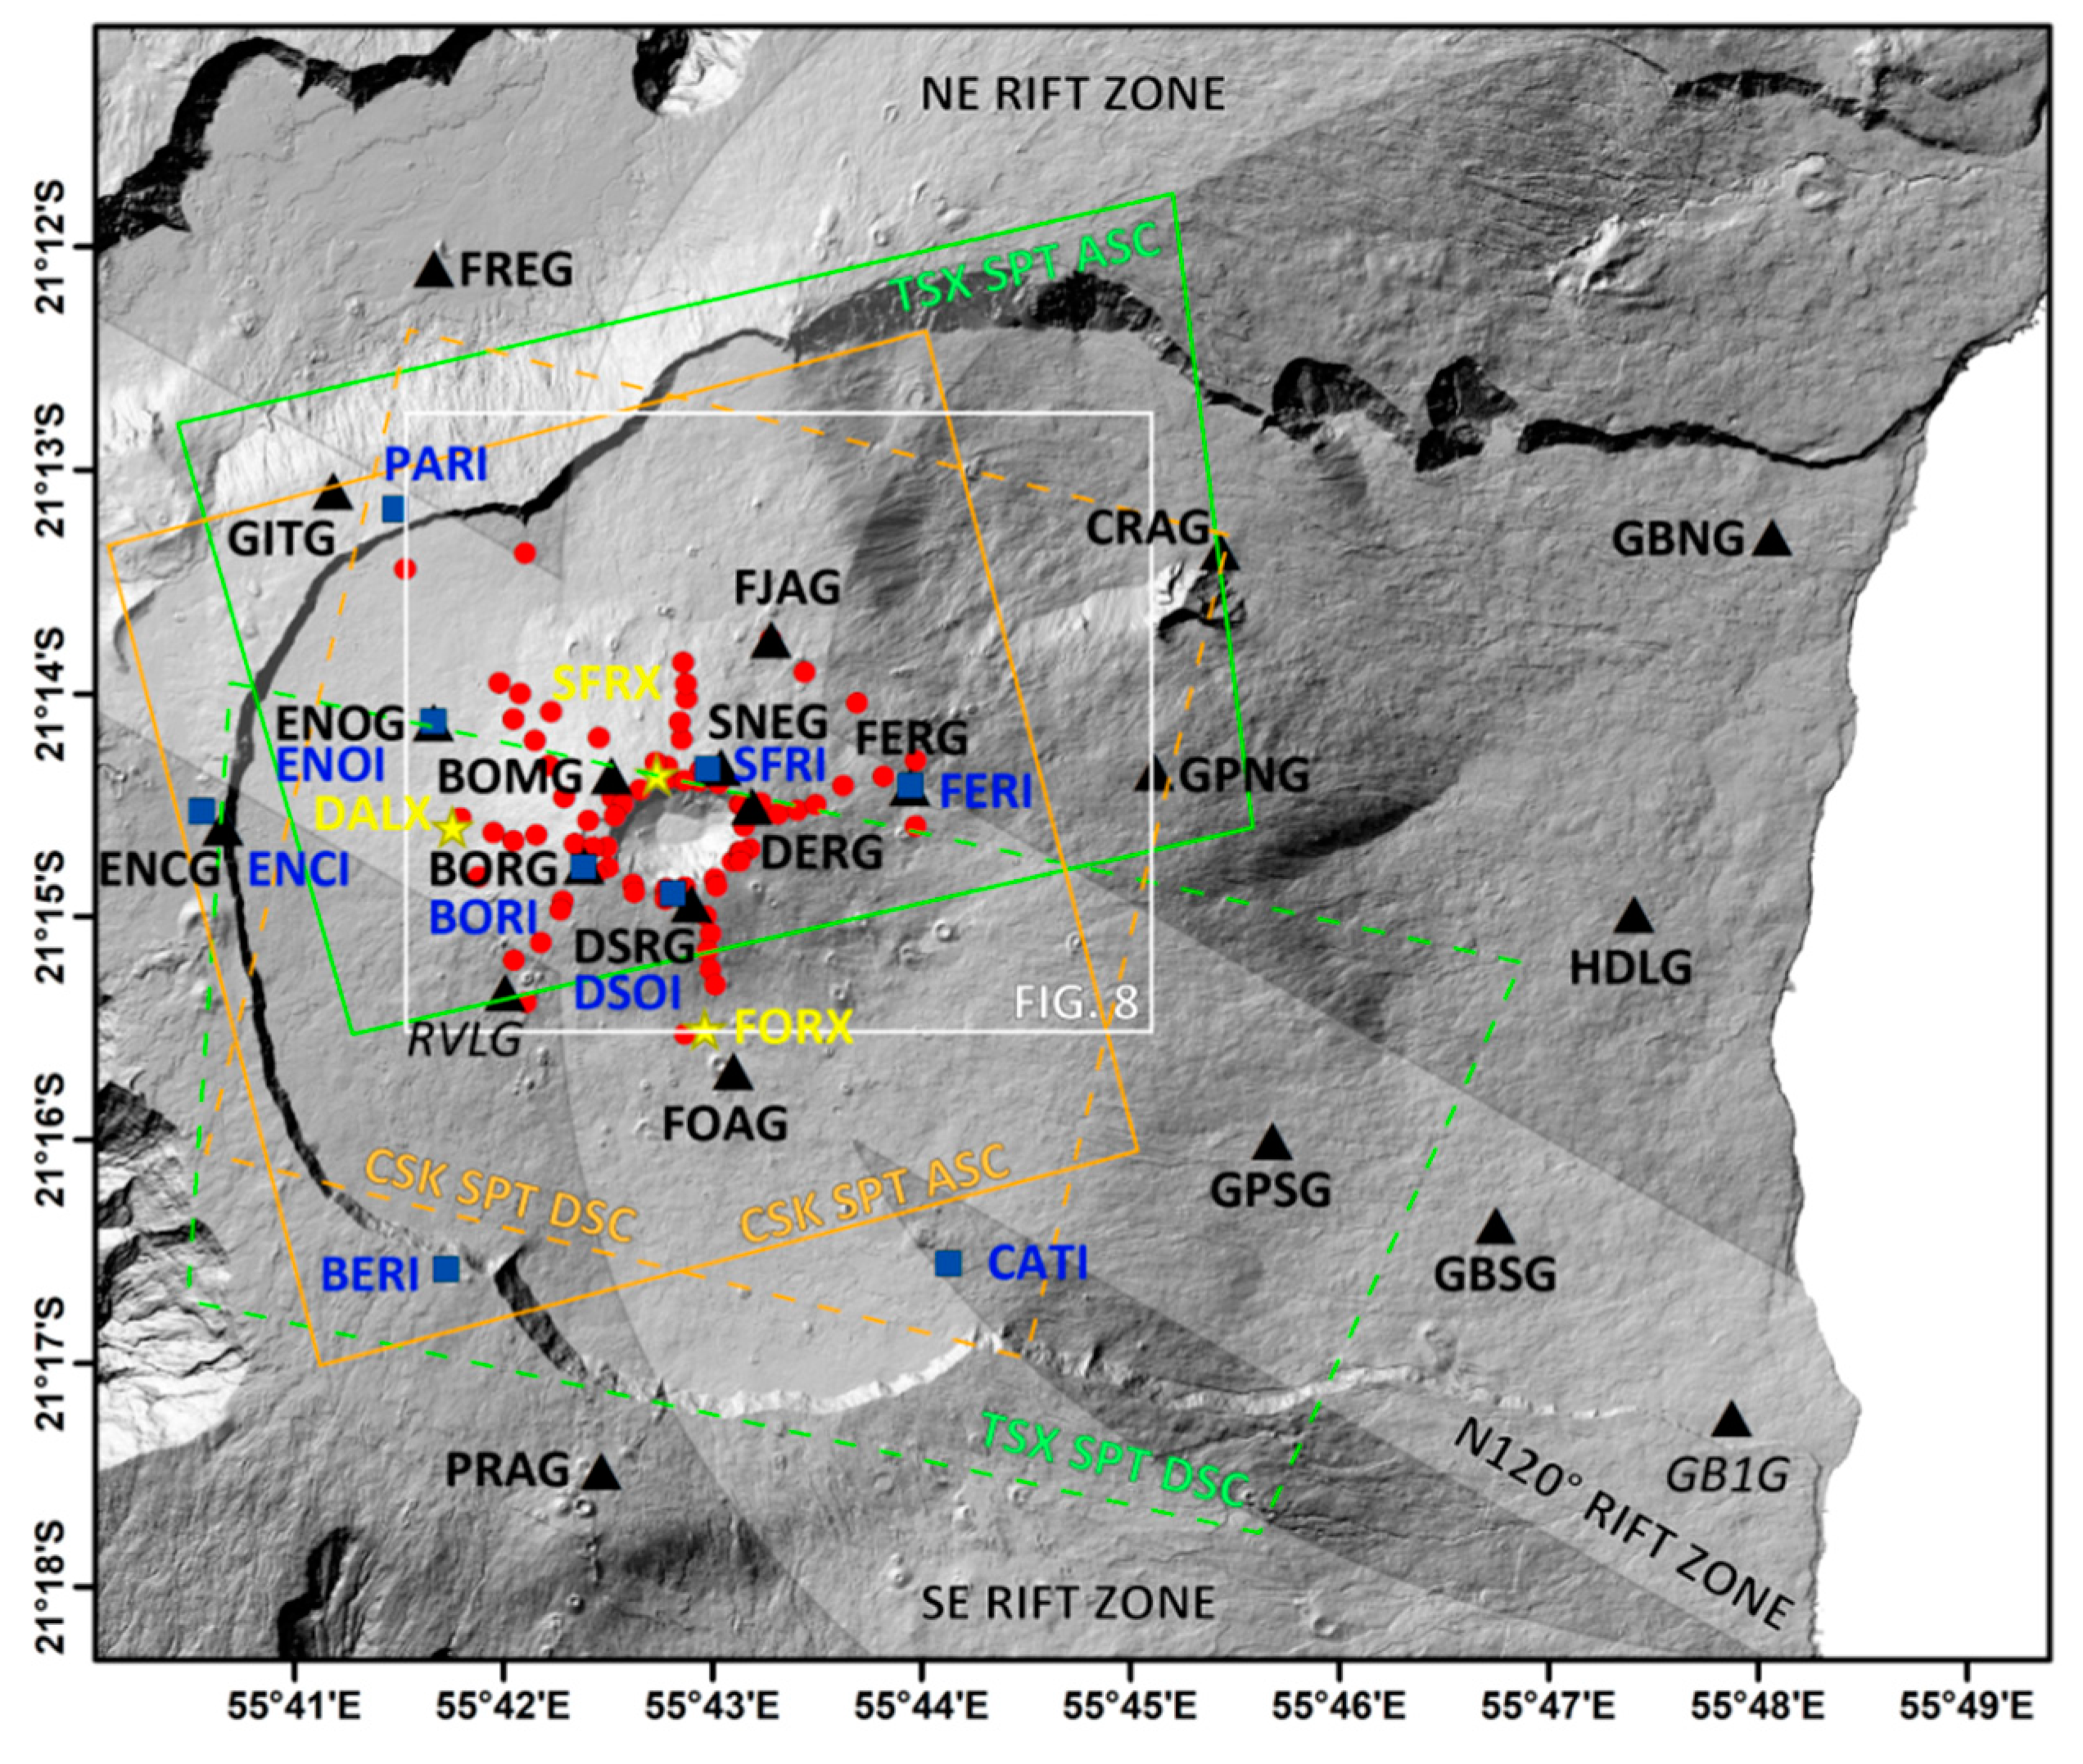
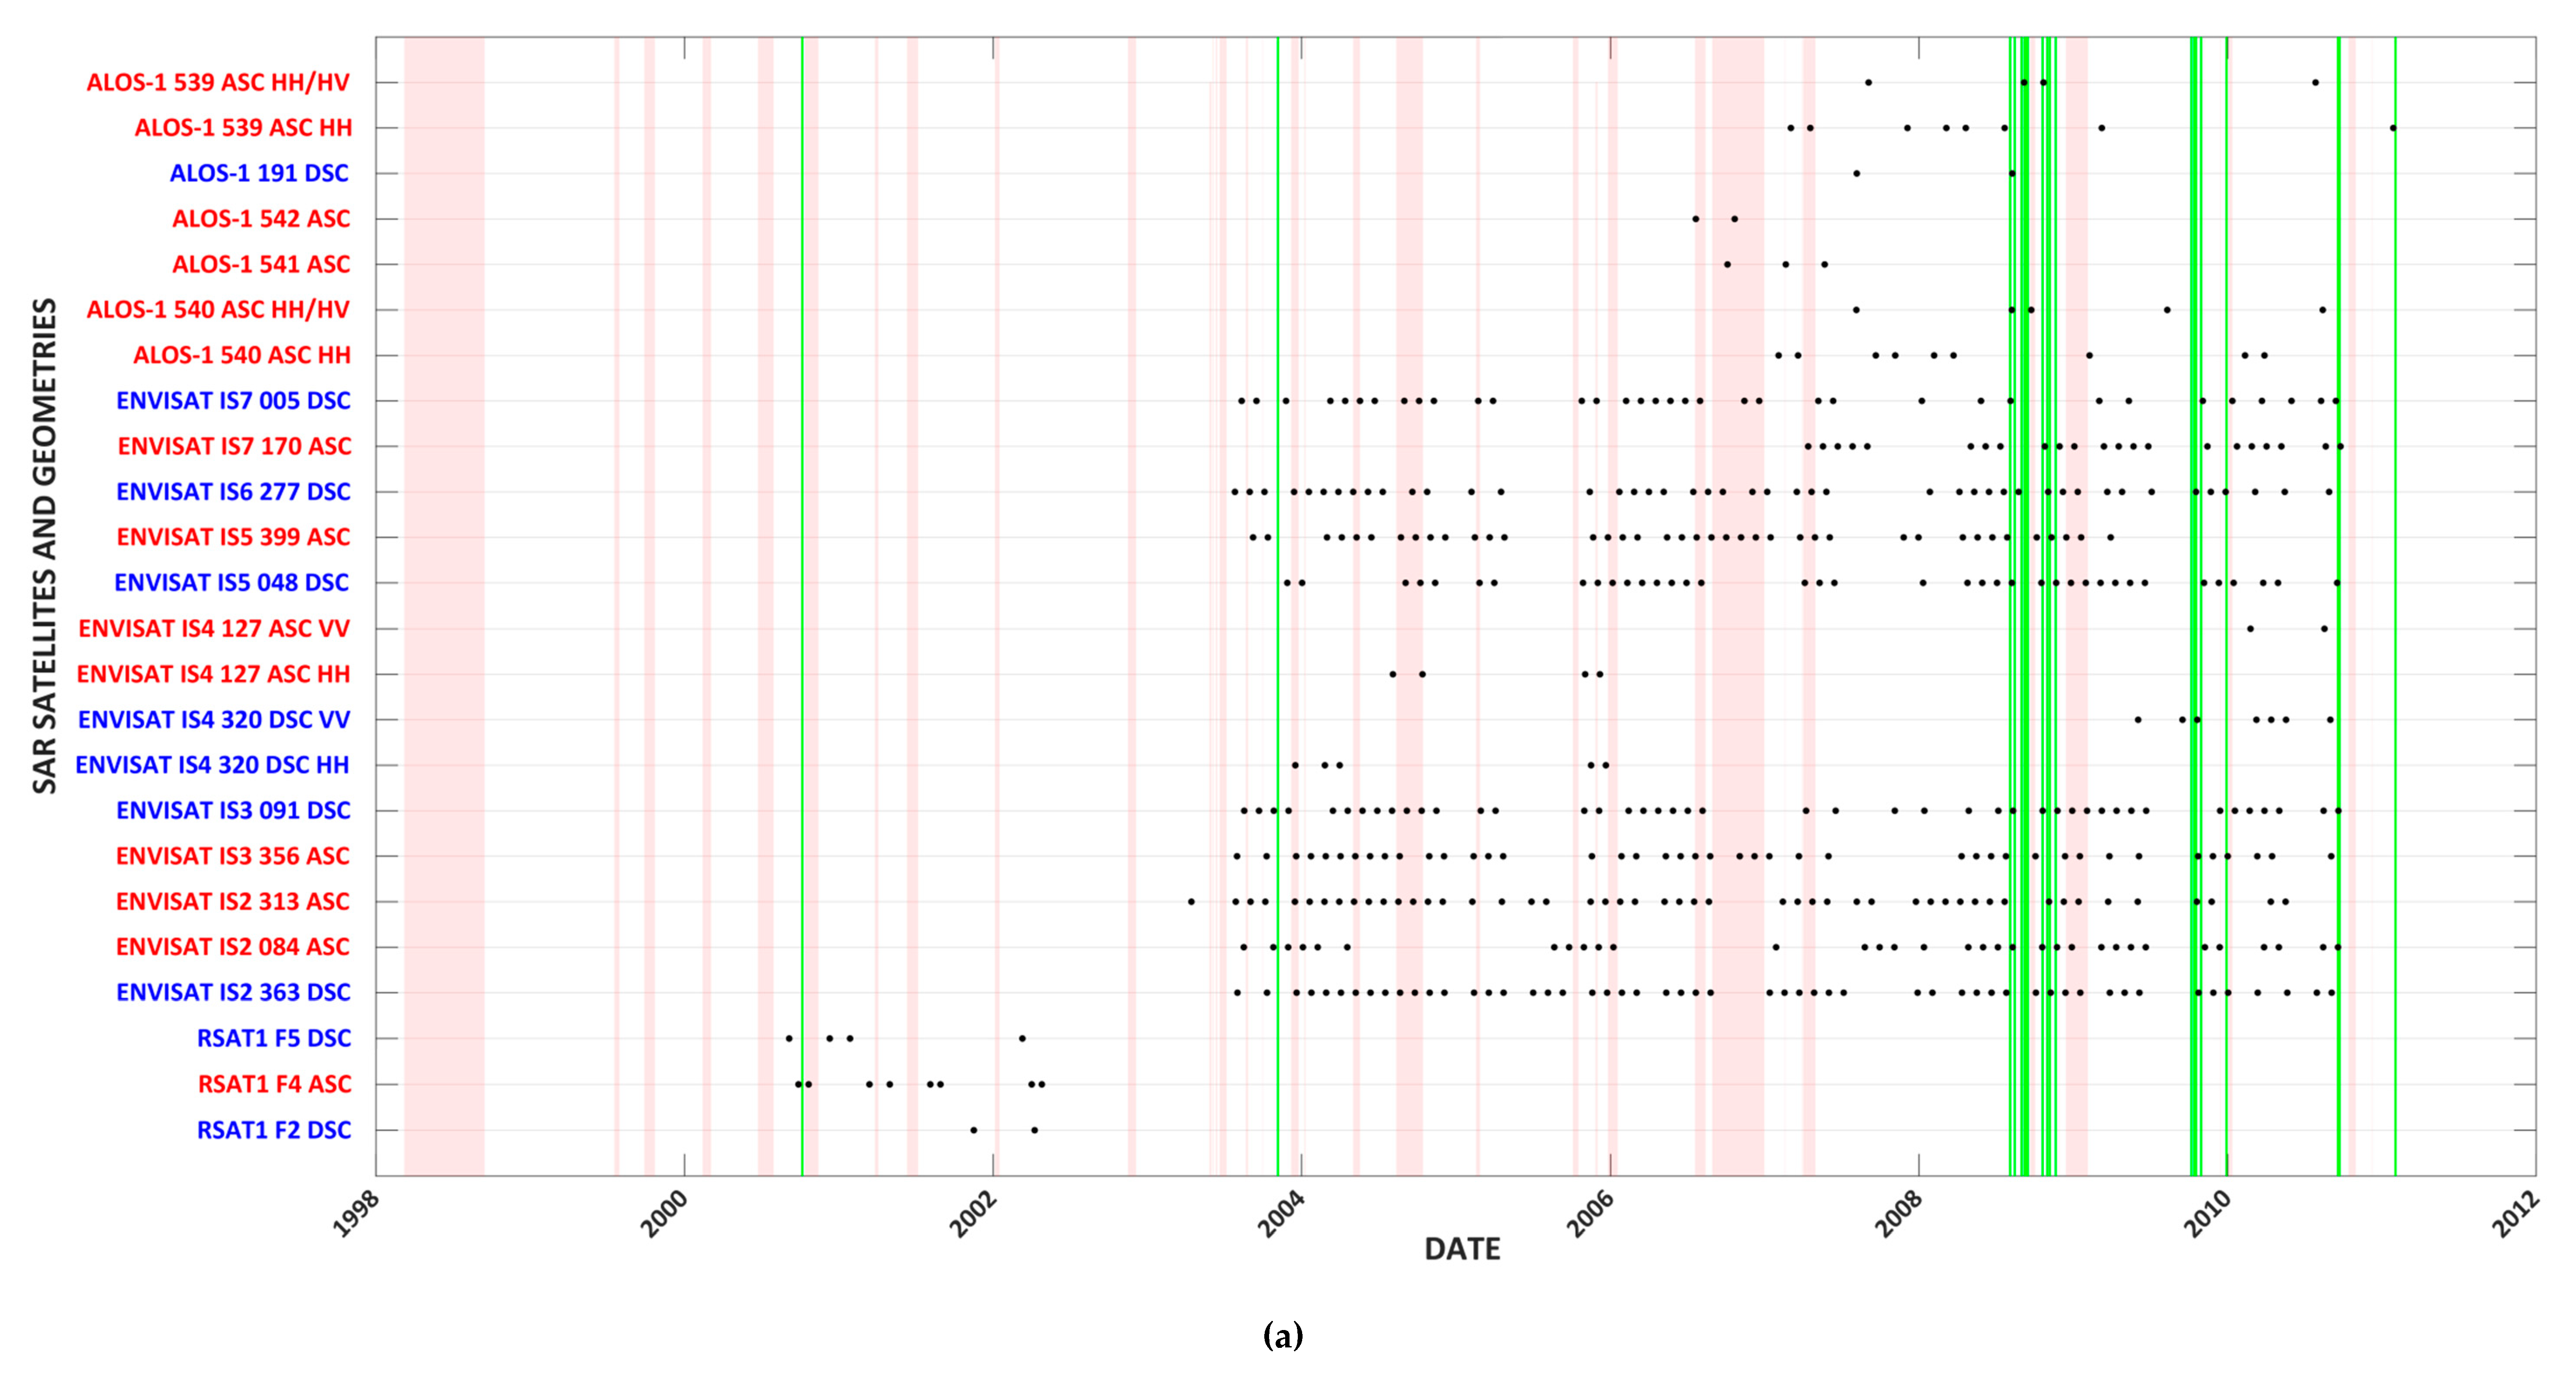
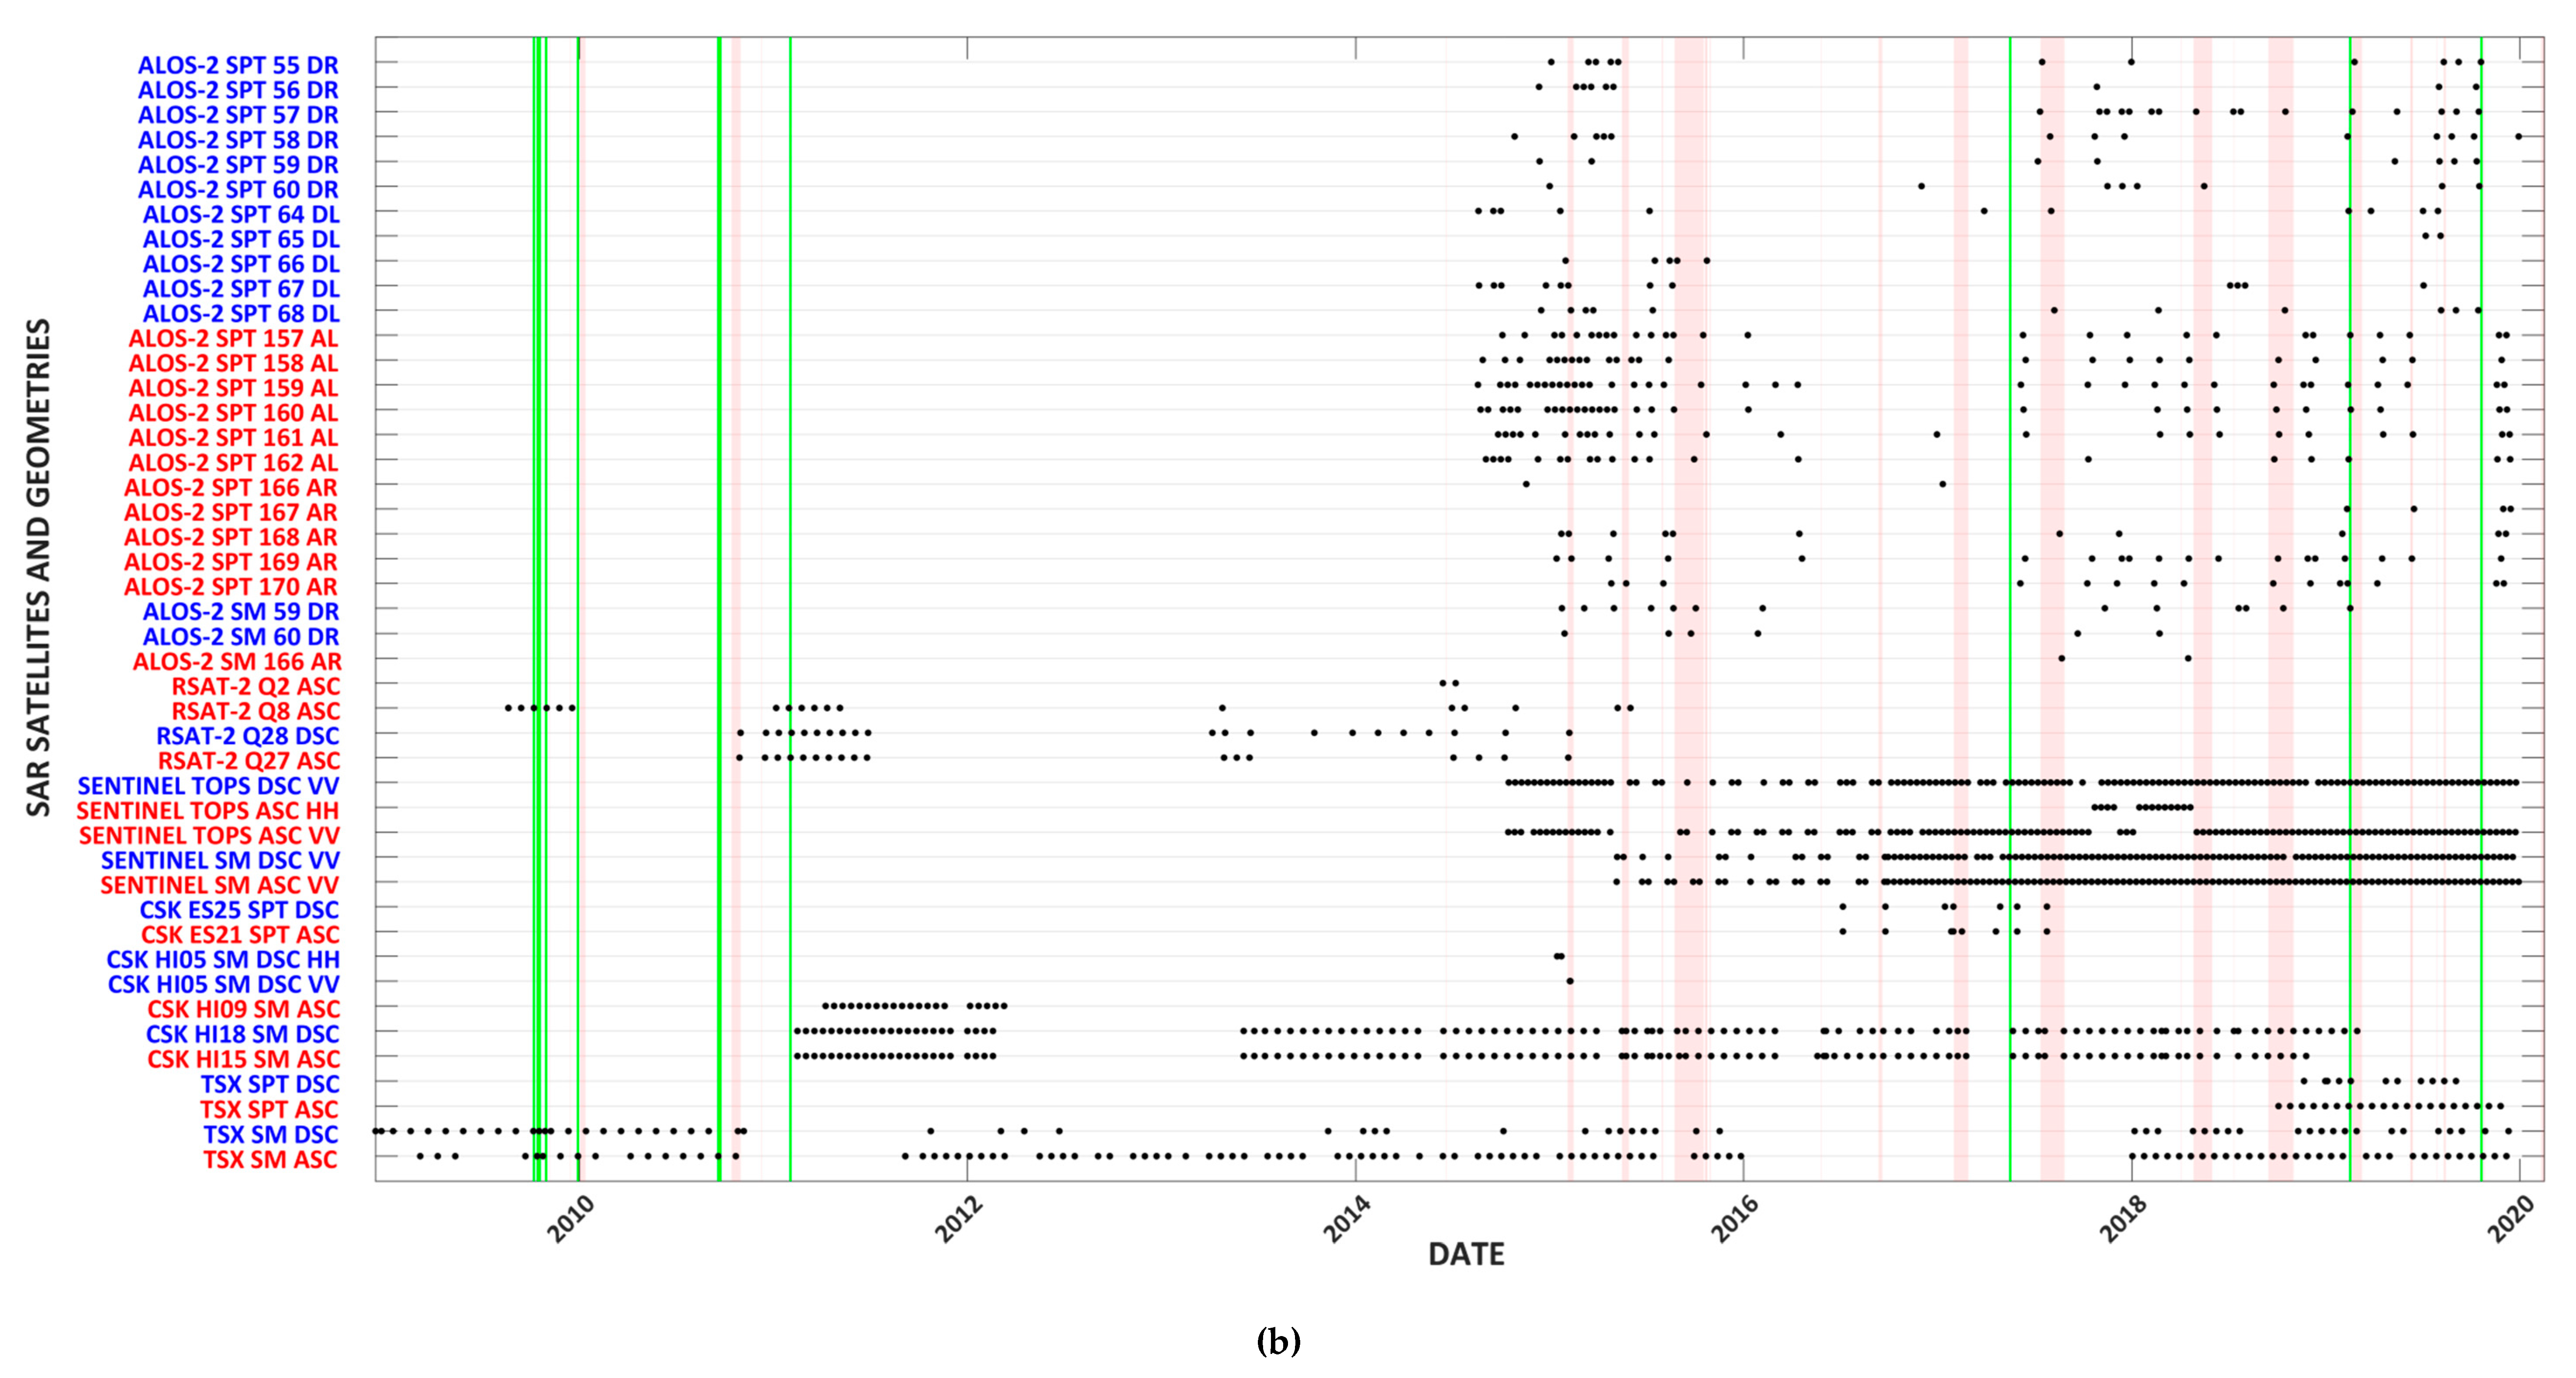
2. SAR Data and SAR Data Archives

The most important SAR data archive for Piton de la Fournaise volcano is the OI2 scientific database that has been developed in order to support both the semi-operational InSAR monitoring of Piton de la Fournaise volcano and the scientific exploitation of long InSAR time series. The OI2 SAR data archive holds 1835 SAR scenes acquired since September 2000 by 8 different SAR satellite systems or constellations (and a total of 13 different satellites) as of 31 December 2019 (Figure 3 and Table 1). In addition, InSAR products such as interferograms and coherence maps dating back to May 2003 are also kept within the OI2 database. All data stored within OI2 are available through a dedicated web interface named CASOAR [24]. The data have been immensely valuable to image and study 52 of the 58 eruptions that occurred since 9 March 1998 (Figure 3). While access to most of the raw data has to be restricted due to the data policies of the responsible space agencies, derived data products are downloadable in geotiff format by registered users. A mirror archive of OI2 has been developed locally at OVPF, ensuring on-site processing and analysis as well as OI2 data and product backup. Even though SAR scenes cannot be distributed through CASOAR, the online platform provides an almost complete listing of all SAR data acquired at Piton de la Fournaise volcano since 2003 (Figure 3 and Table 1). A number of SAR images that were acquired before the development of OI2 are not centrally stored and are, therefore, harder to access for the community. While comprehensiveness is anticipated, not all SAR data acquired since 2003 at Piton de la Fournaise volcano are yet included within the OI2 database. For example, CNES routinely acquired ENVISAT ASAR swath 4 data on both ascending and descending tracks that are not stored within OI2. Also, several Radarsat-1 images may exist that are not maintained within the central archive OI2, and certainly more CSK and ALOS2 images exist than the ones OI2 is holding. Moreover, the German Aerospace Center (DLR) is operating the TanDEM-X satellite (TDX) as a TSX add-on for the collection of digital elevation measurements and the generation of a global digital elevation model (DEM). For this purpose, bistatic SAR data are being acquired in a way that one satellite is transmitting the electromagnetic signal while both TSX and TDX satellites are receiving the echoes simultaneously. Over Piton de la Fournaise volcano, a total of 211 such Co-SSC scenes were acquired before the end of the year 2019, which are listed in Table 1 (but not included in Figure 3). However, not all of them are stored in OI2. Most of the data maintained within the OI2 archive were obtained through data proposals in response to the Space Agencies’ announcements of opportunity (AOs). Because data contingents offered through these AOs are usually limited to a certain number of images or to a specific time window, the temporal density of acquisitions often remains below the capacities of the satellite systems. Another source of SAR data are the open archives of the space agencies. For example, archive data acquired by “old generation” (i.e. out of order) satellites, such as ESA’s ENVISAT, and JAXA’s ALOS-1 SAR systems, are now freely available through these space agencies. For the restricted archives, like RADARSAT, CSK, and TSX, data can be purchased, even if no AOs are open for proposal submissions. For example, the COFUR prices for TSX data for scientific use vary between 200 €/scene (for 1-30 scenes) and 160 €/scene (for >100 scenes) (according to prices listed under https://sss.terrasar-x.dlr.de). Likewise, a CSK StripMap (SM) HIMAGE interferometric datastack of at least 5 scenes over the same area in a twelve-month’ time period can be purchased for 1000 €/scene from e-GEOS. From a scientific point of view, data policies represent strong constraints that explain why data archives, at Piton de la Fournaise and other volcanoes worldwide, may not be complete. The fact that La Réunion is an isolated island located in the Indian Ocean is both an advantage and a drawback: On the one hand, there are generally few acquisition requests before or after the satellite flyover of La Réunion, which makes scheduling conflicts unlikely and rare. On the other hand, the SAR instruments on board the satellites are likely to stay on standby mode during the entire Indian Ocean flyover when no acquisitions are explicitly requested. Therefore, not many background acquisitions are being acquired over La Réunion Island. As for many other isolated volcanic ocean islands, no ERS1 or ERS2 data have been acquired as the satellites were not equipped with large onboard storage capacities and because any real time data downlink station was too far from the island at the time. Likewise, no ENVISAT ASAR swath 1 data have ever been acquired at Piton de la Fournaise since those had unfavorable viewing geometries.
Especially the new generation SAR satellite systems (Figure 3b) deliver high-resolution and high-quality data with acquisition designs that are optimized for InSAR applications. For instance, the separation of SAR scenes in space (represented by the normal baseline “Bn”) is usually kept below critical distances that would cause coherence loss (Figure 4). This is oftentimes achieved by flying the satellites within orbital tubes and/or by operating satellite constellations of the same kind of SAR systems. Resolutions, both temporal and spatial, are continuously improving, and dedicated SAR satellite modes for one and/or the other preference are available. Some space agencies allow target-specific tasking of future acquisitions (oftentimes following a successful data proposal), ensuring data takes with the most suitable acquisition modes, geometries, and timings.
Since 2007, the most commonly used SAR sensors at Piton de la Fournaise are the ones aboard the TSX and CSK (X-band), Sentinel-1 (S1) (C-Band), and ALOS-2 (ALOS2) (L-Band) satellites (Figure 3b). Combining these data allows taking advantage of the individual strength of the satellite systems. The two S1 (S1A and S1B) satellites, for example, are reliably collecting data every 6 days (in different sensor modes), which are available to registered data users right upon acquisition and distributed free of charge. This makes the system closest to near-real time data availability today. However, in particular S1 TOPS/IW data have comparably coarse pixel spacing (Table 1), which may cause surface displacement patterns to be less clearly defined. TSX and CSK provide better spatial resolutions, but the X-band becomes saturated faster with respect to displacement gradients, and the data underlie more difficult distribution policies and restrictions. ALOS2 SPT data combine both high spatial and potentially high temporal sampling, and they feature a better overall coherence over vegetated areas (L-band) (Figure 4) as well as a lower sensitivity that allows for near-field displacement detection. Those data, though, are often delivered with longer delays.
InSAR-derived deformation measurements at Piton de la Fournaise are in overall agreement with GNSS data, as closely investigated and proven by Peltier et al. [25]. The average annual coherences in X-band, C-band, and L-band at Piton de la Fournaise volcano are sufficient for InSAR applications (Figure 4). Except for vegetated areas along the volcano’s eastern flank, the steep walls of the caldera, the two summit craters, and newly emplaced lava flows, coherence in all three bands remains high within the Enclos Grand Brûlé collapse structure and throughout the year. Depending on the frequency and timing of eruptions and SAR acquisitions throughout the period of investigation, information on the age of lava flows, i.e., the timing of their emplacement earlier or later during the year, is reflected in mean coherence maps. For instance, the ALOS2 coherence was lower in areas affected by the July and September 2018 lava flows compared to the areas covered by the early and late April 2018 eruptive products (Figure 4e).

3. Characteristic Deformation and Associated Physical Processes at Piton de la Fournaise volcano

The most common processes to cause measurable surface deformation at Piton de la Fournaise volcano are (a) (long-term) pressure changes within the magma reservoir or changes of the volcano’s hydrothermal system (Section 3.1); (b) rapid subsurface magma ascent associated with intrusions and eruptions (Section 3.2); (c) local instability along the rim of the volcano’s summit craters and eruptive vents, or caldera/pit crater collapse (Section 3.3); (d) cooling and compaction of lava flows, as well as surface flexure in their close proximity upon emplacement (Section 3.4); and (e) movement of the unsupported eastern flank of the volcano that can occur as both steady flank sliding or abrupt flank slip (Section 3.5). Due to the volcano’s high level of activity and frequent eruptions, these processes often occur simultaneously or in rapid succession, so that related surface deformation phenomena can be difficult to discriminate. For example, the same location on the flank of the volcano might be affected by both seaward flank sliding, which is characteristically observed as subsidence and motion towards the unsupported flank [26,27], and lava flow compaction, a process that adds another subsidence component to the total surface deformation observed at this location [19]. In order to study deformation source processes, to quantify involved physics, and to understand associated volcanic hazards, however, it is important to be able to unequivocally attribute surface deformation components to their corresponding sources. Isolating superimposed signal components of surface deformation measurements has, therefore, become a key objective of volcano geodesy at Piton de la Fournaise volcano (cf. Section 3.4 and Section 3.5 on lava flow monitoring and flank instability and references therein). Additional knowledge on the timing and temporal evolution of events, the location and extent of the affected area, and the expected long-term deformation behavior can assist the deformation signal decomposition. For instance, the timing of lava flow emplacement depends on the onset of the corresponding eruption and its effusion rate, the area covered by the lava flow can (under certain circumstances) be retrieved from co-eruptive interferometric coherence or other sources (e.g., aerial photography or infrared observations), and the expected long-term displacement behavior could be described as exponentially decaying subsidence where the magnitude positively correlates with the thickness of the lava flow [19,28,29,30].

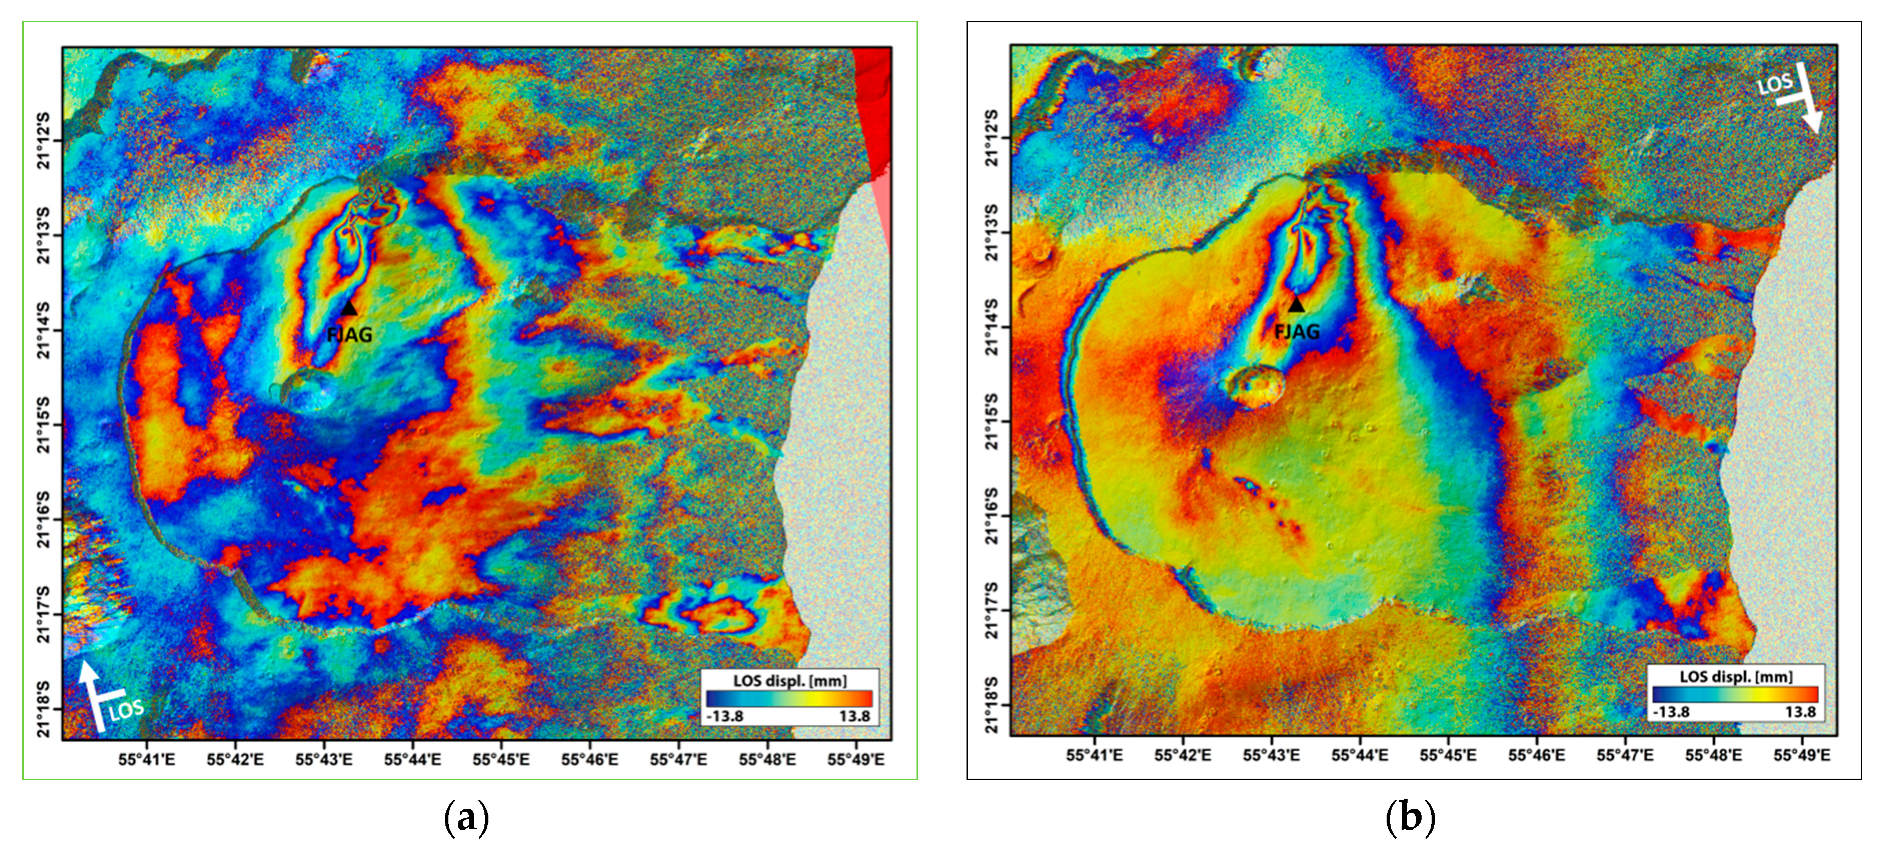
3.1. Displacements of the Central Volcanic Cone

Long- to intermediate-term deformation occurs over the course of days to months and affects the entire central volcanic cone. This type of deformation signal is thought to reflect pressure changes within the shallow magma reservoir, or changes of the hydrothermal system of the volcano [1,15,22,31]. Long-term inflation is thought to reflect a pressurization of the shallow reservoir, indicating feeding from depth and accumulation of magma in the reservoir. This type of inflation, therefore, serves as an early eruption precursor alongside the occurrence of seismicity [21]. As the central volcanic cone of Piton de la Fournaise is equipped with a dense network of permanent GNSS stations in addition to more than 75 campaign GNSS benchmarks that are re-measured by the observatory staff upon each eruption (Figure 2), these longer-term pressure changes within the shallow reservoir are well observed and modelled by means of and based on ground instrumentation and measurements [1,22,31,32,33].
Long-term surface deformation signals in InSAR data were observed, described, and modelled by Tinard [34] over a period between 2003 and 2007, who suggested that displacements of the volcano’s central cone might be related to magma accumulation and withdrawal from the shallow reservoir. Long-term subsidence affecting the central cone was detected over a long period following the major 2007 eruption from SAR interferometry (Figure 5). This time the signals were interpreted as related to changes within the volcano’s hydrothermal system [18]. However, surface subsidence patterns that affect the central cone and that are thought to reflect compression of the shallow reservoir or hydrothermal system are difficult to discriminate from topography-correlated atmospheric phase delays, especially in single time step interferograms [35,36,37]. MT-InSAR approaches potentially overcome these limitations and can help to better estimate and discriminate the atmospheric phase component, allowing for the retrieval of long-term deformation trends (Figure 5). However, compared to the dense ground-based deformation network operated by OVPF, SAR interferometry does not add much crucial information on the long- to intermediate-term displacements that only affect Piton de la Fournaise’s well-equipped central volcanic cone.
InSAR signals of small spatial extent, either of magmatic or hydrothermal origin, are linked to a shallow source underneath the central volcanic cone. At Piton de la Fournaise, large-wavelength signals that extent beyond the Enclos Fouqué caldera and that could be related to the changes within a deeper magmatic reservoir or storage zone have never been observed using SAR interferometry. This does not mean that such large-wavelength displacements do not exist, but as most InSAR data are incoherent outside the Enclos Fouqué caldera (Figure 4), this technique is not sufficient to pick up on any large signals that extent beyond the caldera, should they exist.

3.2. Short-Term Rapid Variations and Typical Deformation Patterns Associated with Eruptions

Volcanic eruptions at Piton de la Fournaise volcano are typically preceded by seismic crises indicating the escape of magma from the shallow reservoir and its propagation towards the surface. A seismic crisis usually lasts between a few hours to days [38] and is accompanied by sudden high rates of surface inflation that are associated with the magma ascent [22,39,40]. Amongst the main deformation phenomena observed at Piton de la Fournaise volcano (as discussed throughout Section 3), this type of deformation is the most straightforward to capture, discriminate, and quantify by means of SAR interferometry. In contrast to deformation that affects the central volcanic cone (Section 3.1), intrusions and eruptions oftentimes take place at locations along the volcano’s rift zones, which are not as densely equipped with ground instrumentation. Therefore, InSAR is the essential technique allowing for imaging, quantifying, and analyzing intrusion- and eruption-related deformation patterns at Piton de la Fournaise volcano. This is especially true for distal eruptions as the GNSS ground deformation network is sparser further away from the central cone (cf. Section 3.2.1 and Section 3.2.2, and references therein; Figure 2, Figure 6 and Figure 7). Because of their high frequency, their occurrence in very confined areas, their short (and known) duration, and their characteristically large amplitudes, eruption- and intrusion-related deformation signals are also the most commonly observed, described, modelled, and analyzed in the Piton de la Fournaise volcano InSAR literature.

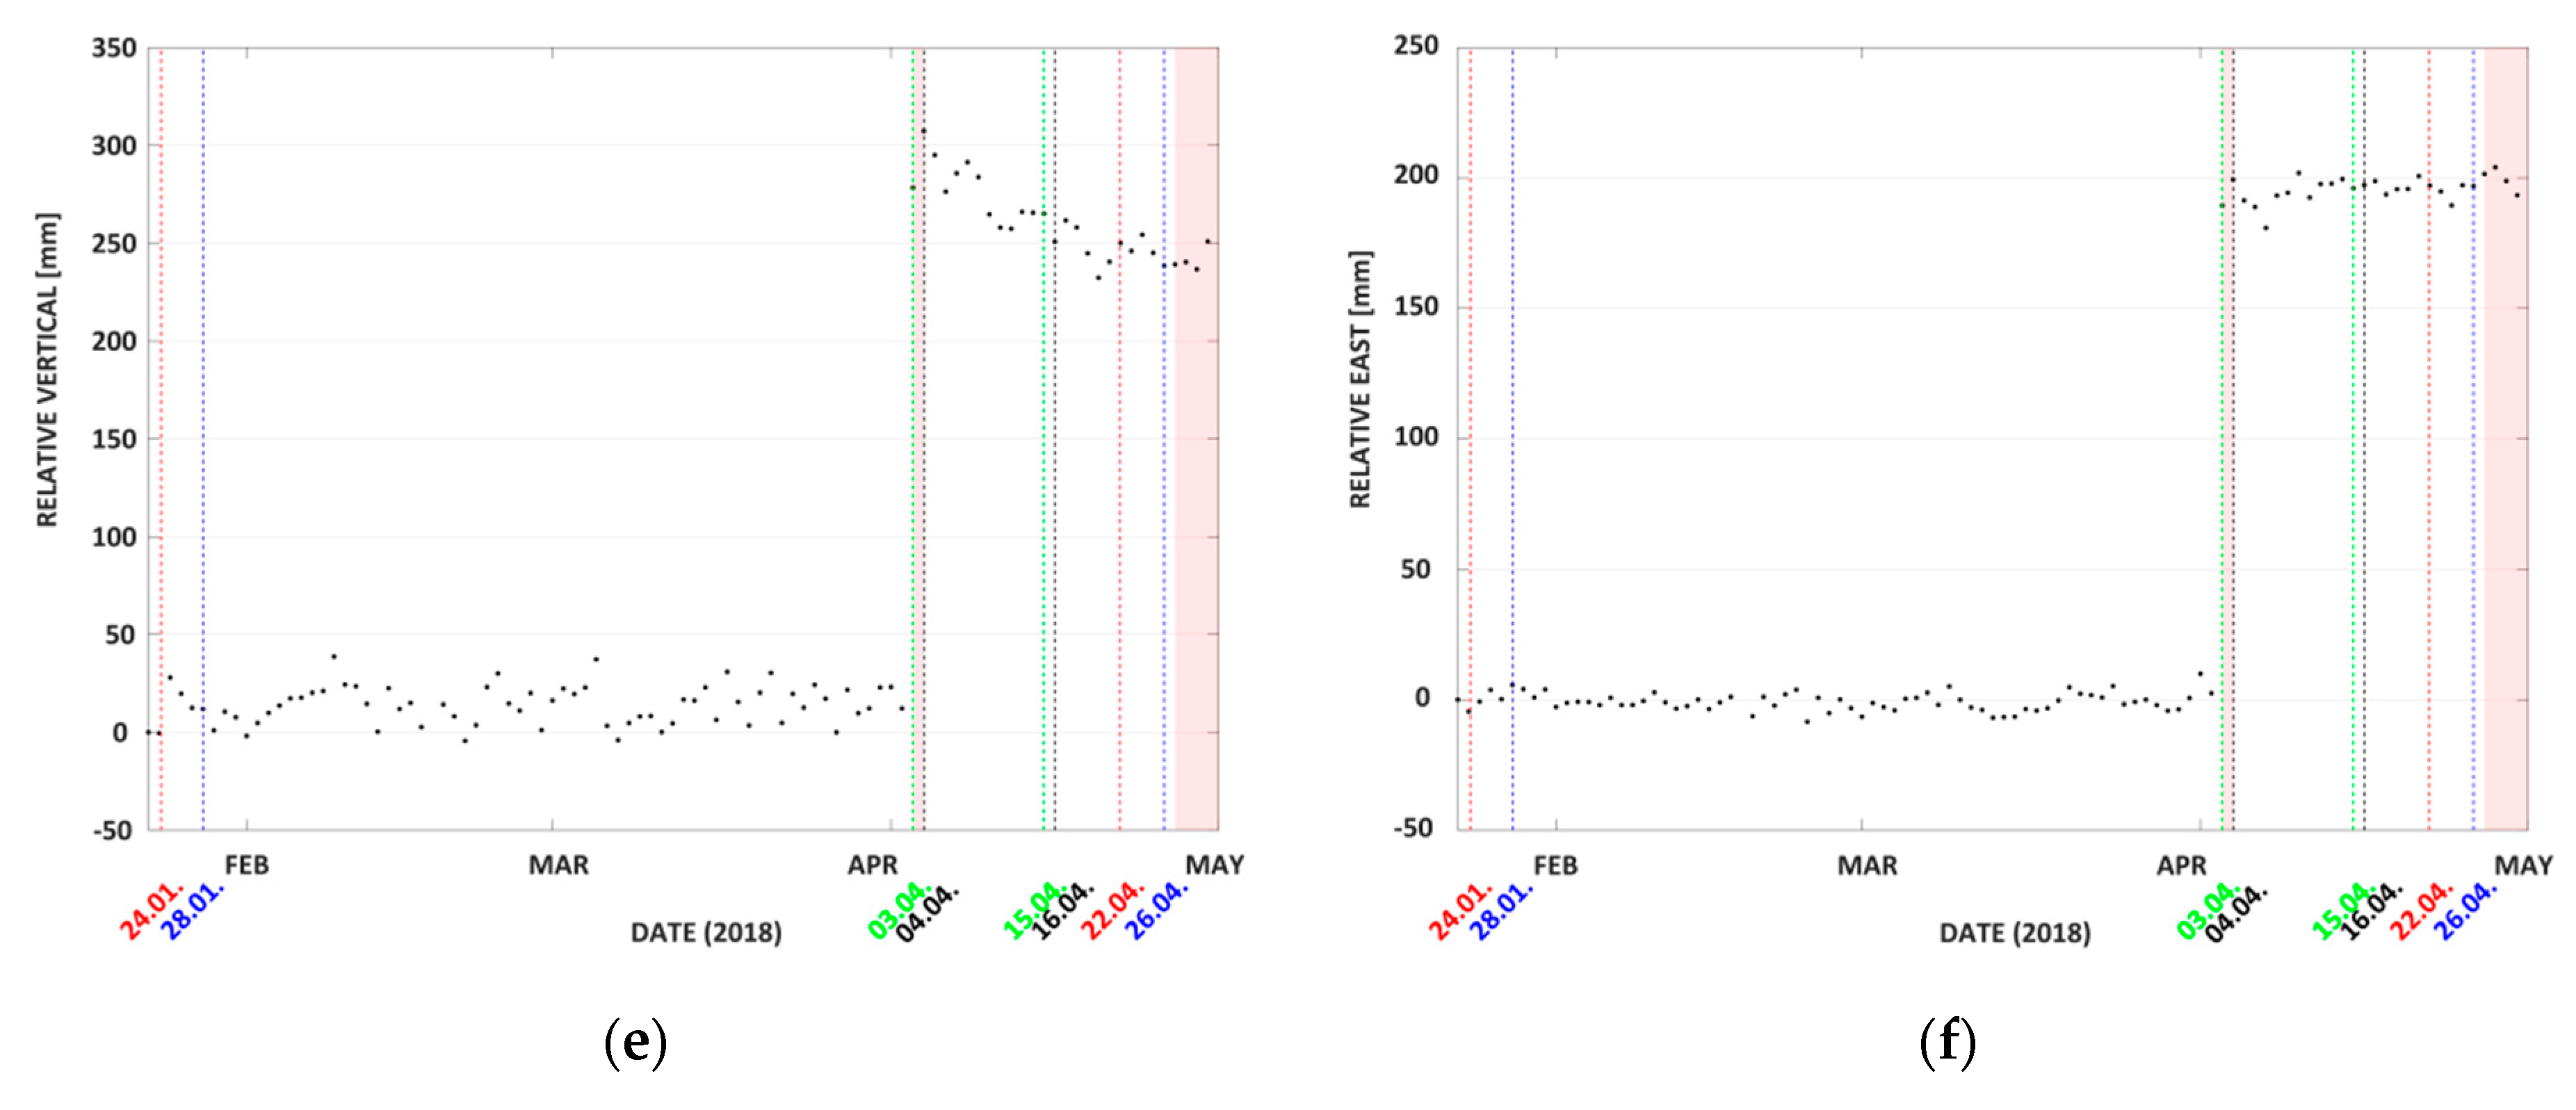
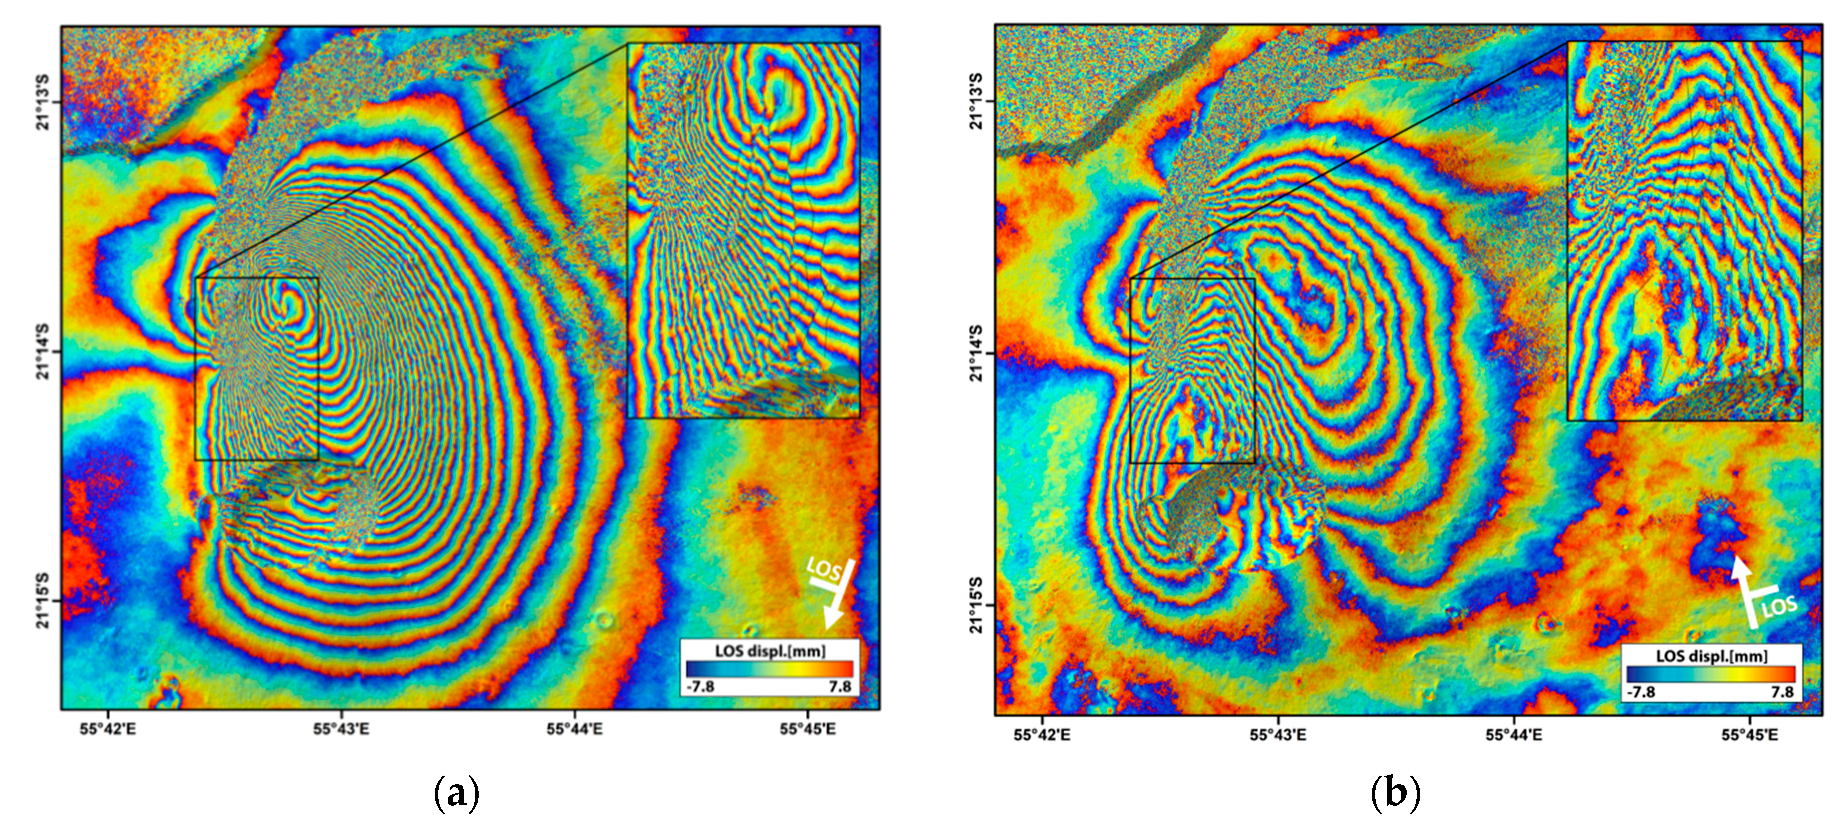
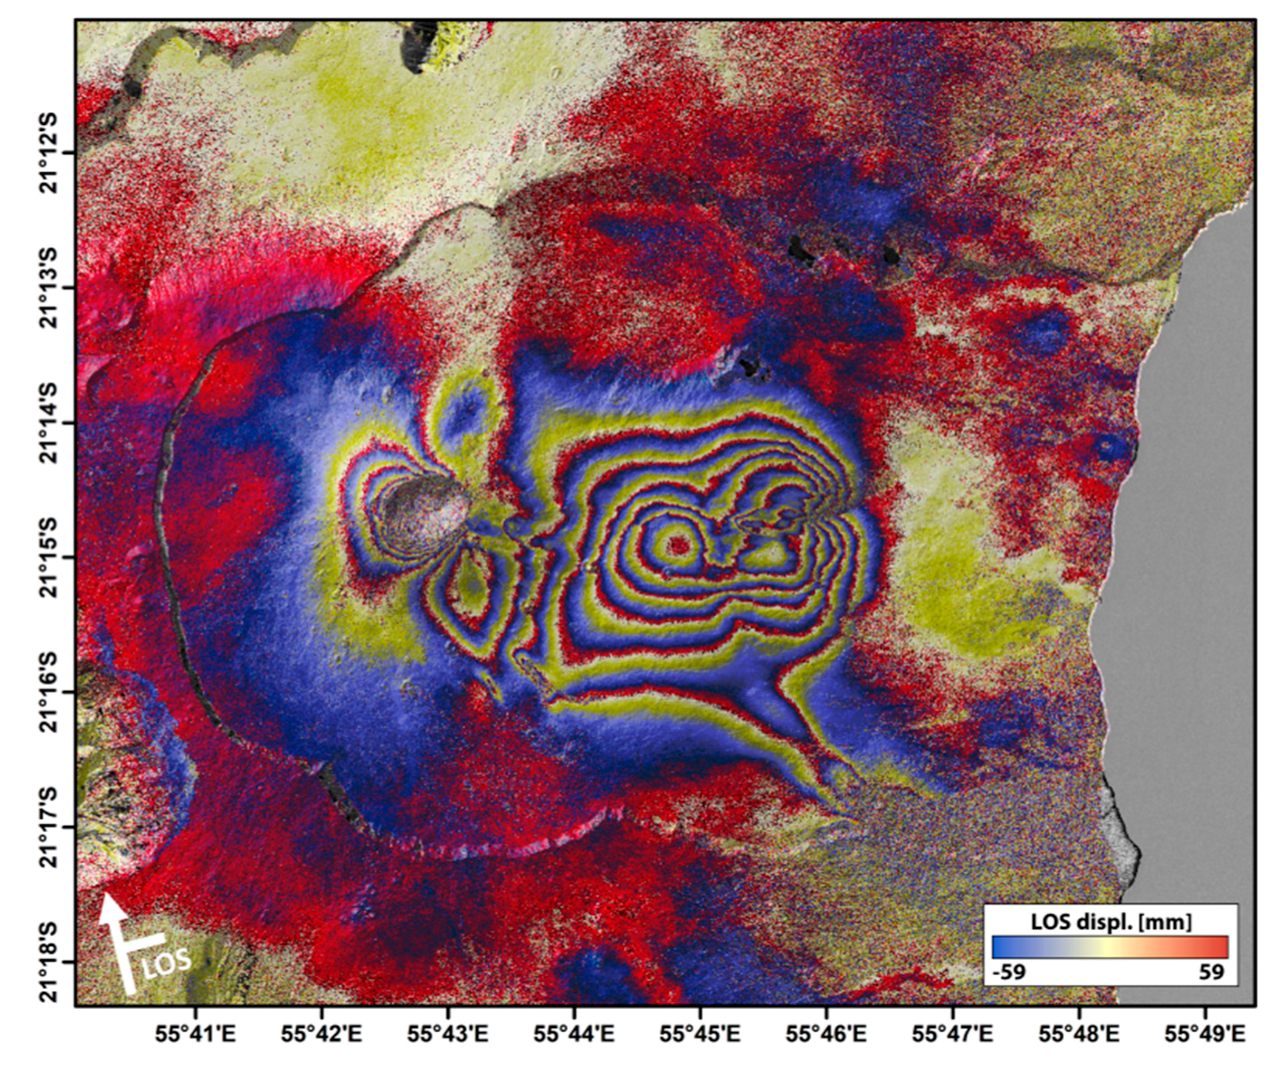
3.2.1. Co-Eruptive Displacements

The first dedicated InSAR study at Piton de la Fournaise was published in 1999 by Sigmundsson et al. [23], who detected ground displacements associated with the 9 March 1998–21 September 1998 eruption of Piton de la Fournaise using satellite data collected by the Canadian RADARSAT-1 satellite (RSAT1). The authors could explain the co-eruptive displacements by means of a 1.5 km-long, dipping dislocation with 60 cm of opening in the north that they extended another 1 km towards the south, allowing for only 40 cm of opening there. Edifice inflation prior to this 1998 event was not observed. According to Sigmundsson et al. [23], the eruption was accompanied by seaward displacement of the eastern flank. The authors concluded that over time the accumulation of displacements caused by similar eruptions contributed to the destabilization of the volcano’s eastern flank. Fukushima et al. [39] used a combination of a boundary element model (including the topography) and a neighborhood algorithm inversion in order to invert for the source geometry that fed the February 2000 eruption based on RSAT1 InSAR data from two ascending and two descending orbits. The authors explained the deformation associated with this eruption by a seaward dipping (61.0°–67.3°) trapezoid, oriented parallel to the rift zone that initiated at 800–1000 m beneath the Dolomieu summit crater. The authors emphasized the importance of taking into account the topography in order to realistically infer for the geometry and overpressure at depth. Froger et al. [41] used ENVISAT ASAR data to describe the deformation field associated with the August 2003 Piton de la Fournaise eruption, and inverted for the associated deformation source. This eruption, too, caused the unsupported eastern flank of the volcano to move seaward (or vice versa). The authors stressed the previous findings of Sigmundsson et al. [23], who stated that successive dike intrusions contribute to the destabilization of the volcanic edifice. Fukushima et al. [40] then analyzed the first five eruptions that occurred since early 1998 using 10 interferograms computed from RSAT1 satellite images. According to these authors, all eruptions apart from the March 1998 event were fed by shallow dikes initiating at depths of less than 1000 m. By taking into account tilt data and seismicity in addition to the InSAR data, Fukushima et al. [40] concluded that vertical magma propagation preceded lateral material ascent prior to eruptions. Augier [42] studied both co- and post-eruptive displacements associated with the 2007 eruption. Smittarello et al. [43] used four propagation phase-spanning interferograms in combination with continuous GNSS data to invert for the intrusion geometry (by means of InSAR data) and the magma propagation dynamics (by means of GNSS data) during the eight hours before the 26 May 2016 eruption. According to these authors, the observed deformation was best explained by a 2700-m-long sill that located 800 m above sea level and that connected to the eruptive fissure by a subvertical dike [43]. In contrast to the above-described numerical and geodetic inversion models that explained co-intrusion and/or co-eruption surface deformation at Piton de la Fournaise volcano as elastic-walled, inclined, or (sub-) horizontal dislocations, Got et al. [44] argued that linear elasticity, which is often assumed in numerical models, might be too general and not representative for the rheology of the highly unconsolidated uppermost part of the volcano’s edifice.
As mentioned in Section 2, a total of 52 of the 58 eruptions that occurred between 9 March 1998 and 31 December 2019 are covered by interferometric SAR data (Figure 3). Co-eruptive interferograms from both ascending and descending viewing geometries are routinely calculated directly upon data availability for all recent Piton de la Fournaise eruptions, and they are converted into near-3D displacements using the method suggested by Wright et al. [45]. While this is an often applied method by volcano geodesists worldwide in order to resolve the near-3D surface deformation components, one has to take into account the fact that time delays of at least ~12 hours between ascending and descending data takes may add uncertainties to the near-3D displacement field obtained by InSAR. Therefore, the timing of data takes with respect to the onset and evolution of surface deformation processes needs to be taken into account carefully, especially when inverting for intrusion geometries and dynamics.
An example is given in Figure 6 and Figure 7, illustrating the surface displacements associated with the 3–4 April 2018 eruption, which occurred far away from the central volcanic cone at a location that is only monitored by a single permanent GNSS station (FJAG). While the surface motion recorded on the FJAG GNSS station sheds light on the temporal evolution of the eruption and suggests that (almost) the entire surface movement occurred during the very short period of magma ascent immediately before the onset of the eruption (Figure 6e,f, data are shown at a down-sampled daily measurement rate), the full spatial extent of the surface displacements associated with this eruption was only detectable using SAR interferometry (Figure 6a–d). Noteworthy, the subsequent eruption that occurred in late April (the start of which is indicated by the red bar on the very right of the graphs shown in Figure 6e,f) was located on the southern flank of the central volcanic cone and therefore did not cause any significant movement of the FJAG GNSS station. The 3–4 April event also highlights the importance of the timing of SAR data takes with respect to the intrusion and eruption dynamics (Section 3.2.2).

3.2.2. Post-Eruptive Displacements

At Piton de la Fournaise volcano, short revisit times (i.e., higher repeat cycles) of ESA’s S1A and S1B satellites (one ascending and one descending IW acquisition every 12 days, and one ascending and one descending SM acquisition every 12 days, 6 days apart from the IW acquisitions) allow for the recognition of subtle displacement signals that might not be detectable with coarser temporal sampling due to superposition of pre-, co-, and post-eruptive surface deformation. For instance, high data sampling of S1 SM data has facilitated the detection of inverse displacements upon the first April 2018 eruption, when post-eruptive line-of-sight (LOS) subsidence of up to ~7 cm was observed approximately at the northeastern tip of the preceding larger scale co-eruptive uplift (Figure 6 and Figure 7). This eruption started on 03 April 2018 at 7H00 UTC, and the timing of ascending S1 SM SAR acquisitions spanning this eruption is particularly interesting: co-eruptive uplift is observed from an interferogram spanning 22 March 2018 (14H52 UTC) to 03 April 2018 (14H52 UTC) (not shown in Figure 7), while post-eruptive subsidence is already detected from interferograms starting on 03 April 2018 (14H52 UTC) (Figure 7a), i.e., less than 8 hours after the onset of the eruption. While the process behind this subsidence remains to be investigated, we note that interferograms spanning longer time periods, or being less fortunate regarding their timing, might not allow for the distinction of such subtle or short-lived (elastic) deformation processes. For example, the TSX interferograms as provided in Figure 6a,b span both the co-eruptive uplift and the post-eruptive subsidence. Moreover, the X-Band sensitivity causes coherence loss in the close proximity of the eruption site (i.e., at the northeastern tip of the uplift pattern that is related to the magma propagation towards the eruption site, cf. Figure 6a–d). At the same time, the closest GNSS station FJAG was not located at the center of this post-eruptive subsidence pattern and, therefore, did not pick up on the signal (Figure 6e,f and Figure 7).

3.3. Fractures and Local Instabilities

Instability of the summit crater rim was investigated by Derrien et al. [46] based on multitemporal photogrammetric data over the period 2007–2015. Results suggest that several locations around the crater rim are instable and have been moving up to 2 m horizontally, i.e., crater-wards over that period of investigation. As volcanic craters worldwide, including the summit craters of Piton de la Fournaise volcano, are attractive to visitors, information on local instabilities has important hazard implications. Although photogrammetry offers higher spatial resolution data for instability monitoring, high-resolution InSAR has also proven to be an adequate tool for detecting and quantifying crater rim instability, e.g., at Kīlauea Volcano, Hawai’i, and other volcanoes worldwide [47].
Furthermore, discontinuities in high-resolution interferograms can help detecting the location of lineaments and fault lines that might otherwise remain undetected and unmapped. Such geomorphological structures were, for instance, observed in interferograms spanning the 11–18 September 2016 eruption of Piton de la Fournaise, which occurred along the volcano’s NE rift zone (Figure 2 and Figure 8). Field investigations to study the nature and origin of these structures were undertaken only after the discontinuities’ discovery based on SAR interferometry.

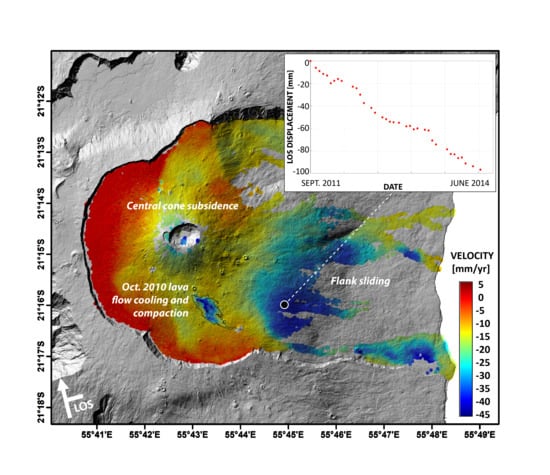
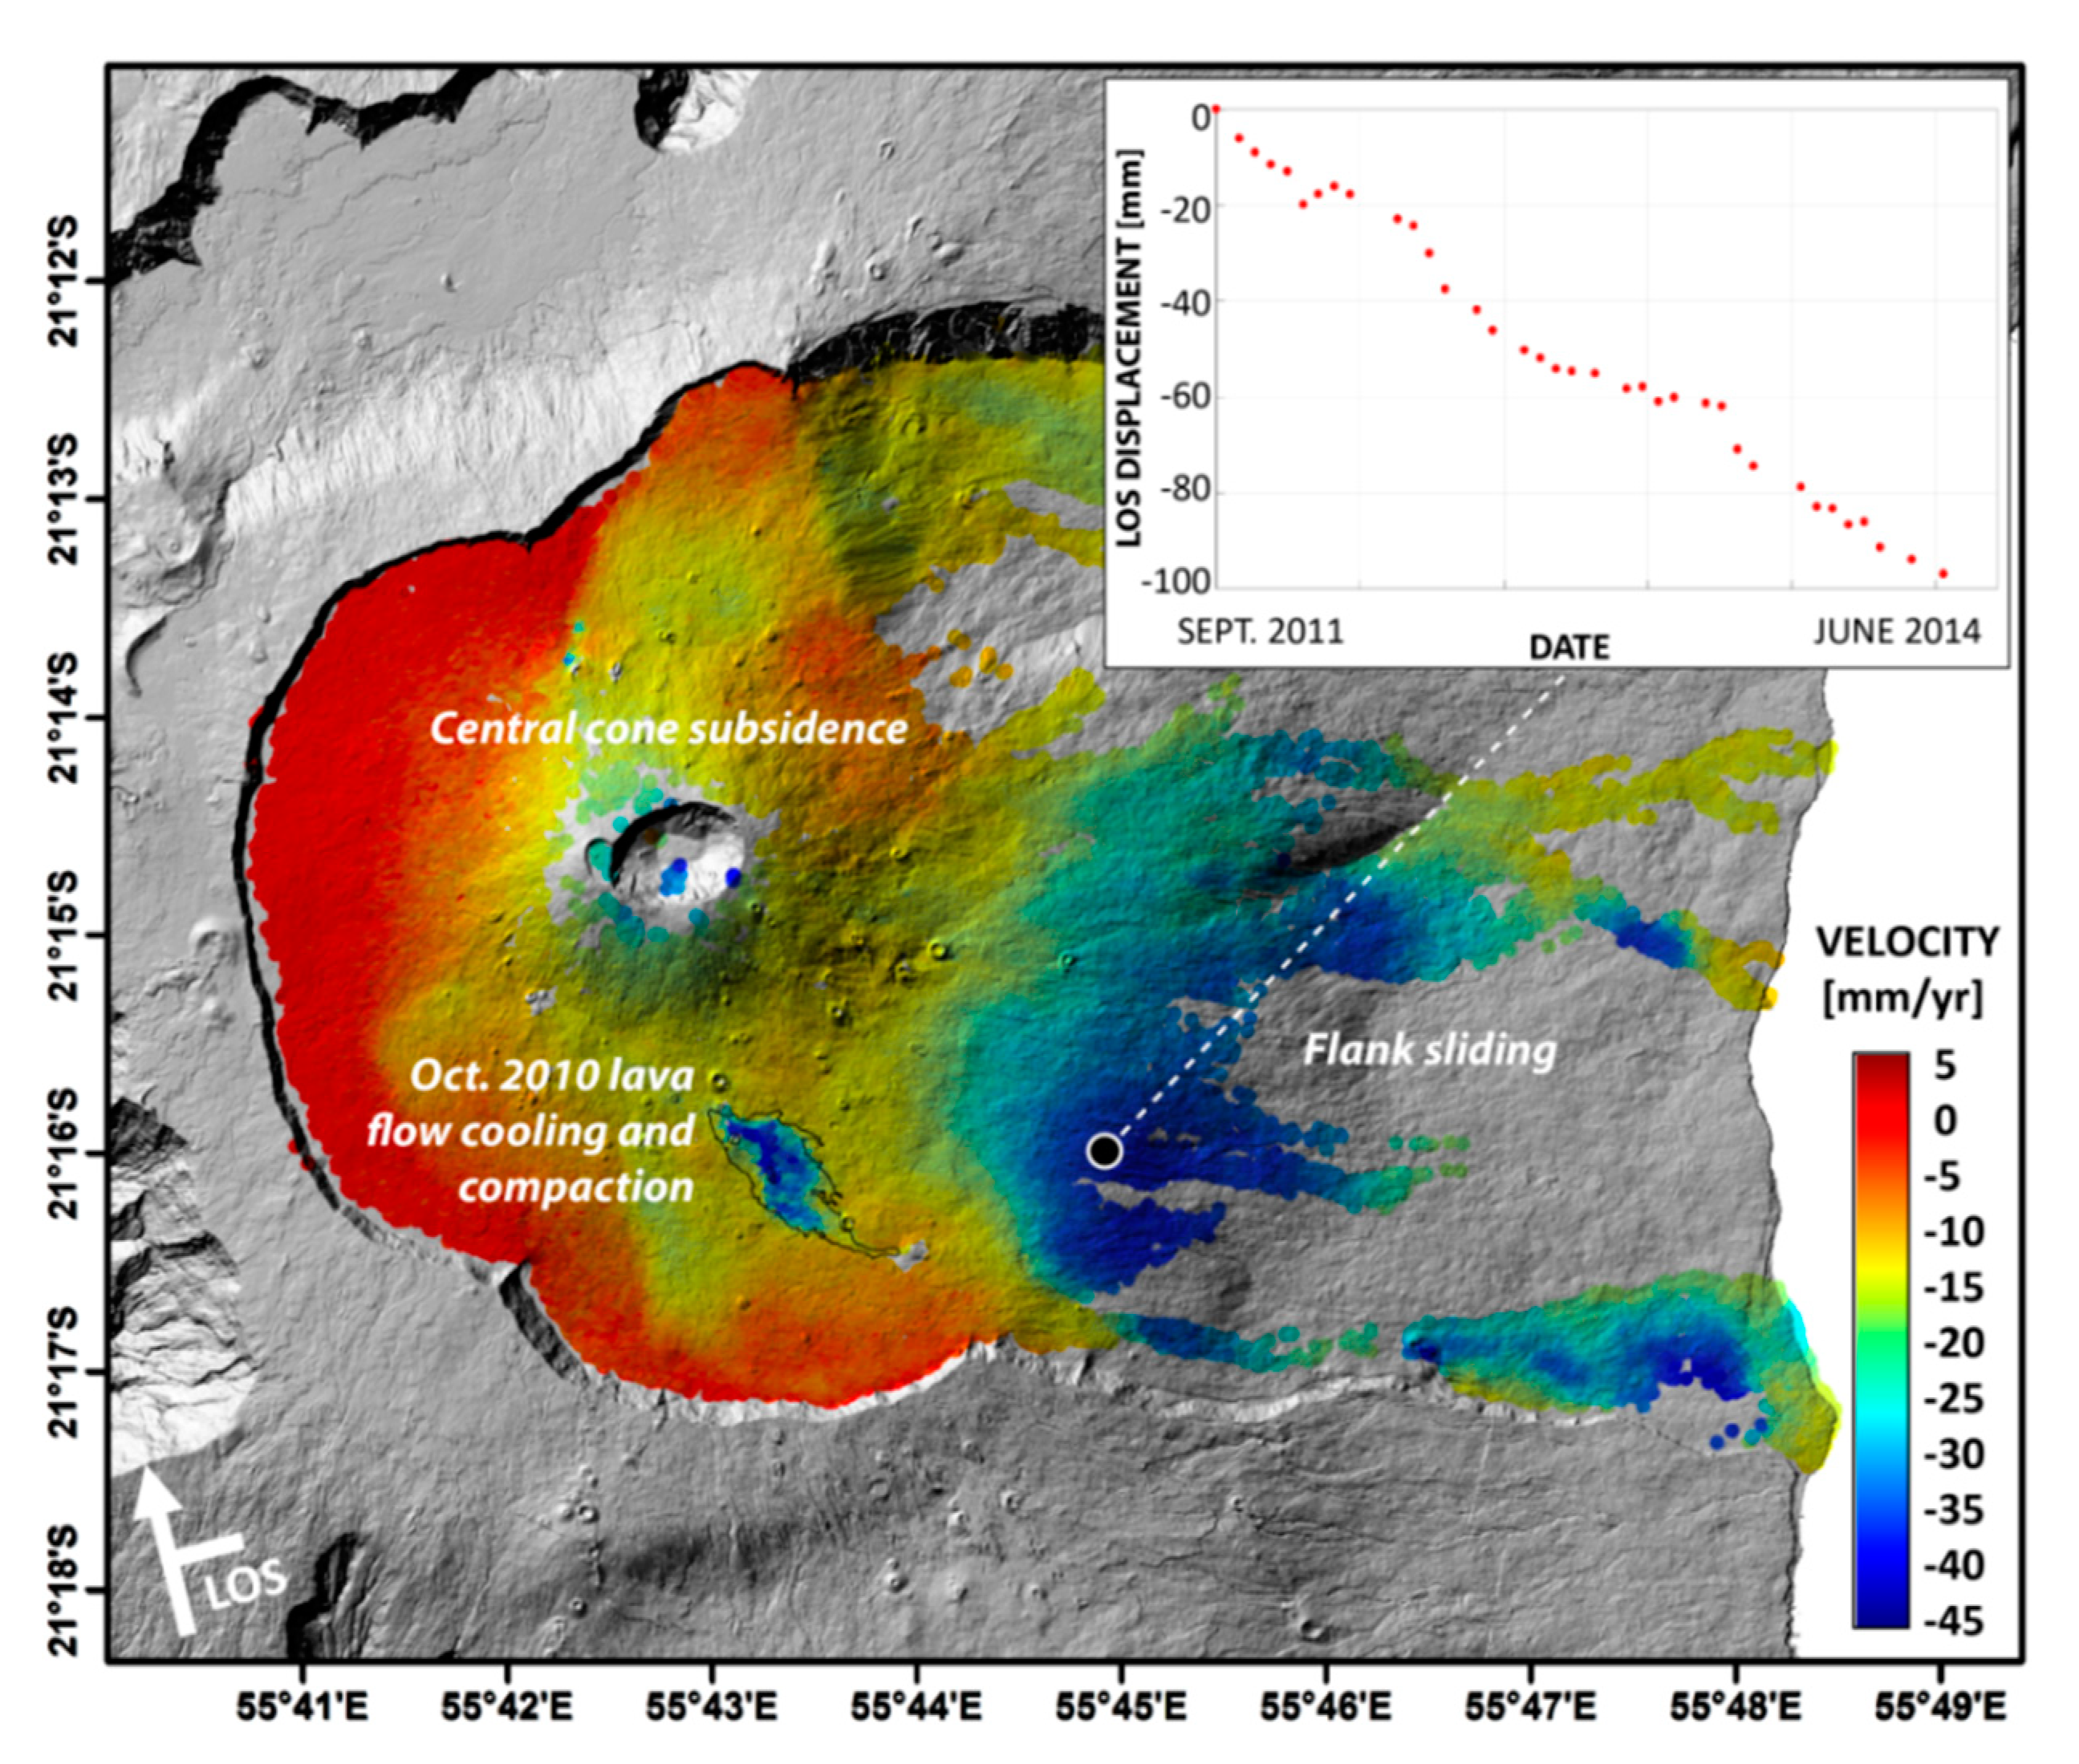
3.4. Lava Flow Cooling and Compaction

Another characteristic source of surface deformation at Piton de la Fournaise volcano is related to the emplacement of lava flows, which add a load onto the surface and, therefore, may cause flexure in the areas directly adjacent to the flows [30,48,49]. SAR coherence is known to be valuable for lava flow mapping and continues to be used for tracking lava flow boundaries over time [28,50,51]. Once the lava flow is emplaced and coherence returns, subsidence is observed as a result of cooling and compaction, a surface deformation phenomenon that is quadratically correlated with lava flow thickness in a way that thicker lava flows subside faster [28].
At Piton de la Fournaise volcano, Bato et al. [52] used InSAR data in combination with thermal remote sensing observations to derive the lava flow volume, area covered, and post-emplacement subsidence during and following the October 2010 eruption (the lava flow that is characterized by LOS subsidence in Figure 5). Hrysiewicz et al. and Hrysiewicz [30,49] used the same approach to characterize the area, thickness, volume, and displacement of all the lava flows emplaced at Piton de la Fournaise between June 2014 and late 2018. Hrysiewicz [49] developed a method to calculate uncertainties concerning the lava flow coverage as derived from InSAR coherence. Results demonstrate how frequent InSAR coherence measurements facilitate systematic updates of lava flow outlines over time, information which is especially important during long lasting eruptions. Harris et al. [51] have shown that SAR-based lava flow length surveillance in combination with modelling can aid crisis response.
A common limitation of InSAR applied at Piton de la Fournaise volcano is the superposition of various processes that cause surface deformation. The discrimination between these processes and the quantification and characterization of their contribution to the total measured deformation remains challenging. For example, overlapping lava flows of successive eruptions can hamper lava flow characterization using InSAR. Chen et al. [19] investigated the long-term post-emplacement deformation of lava flows that were emplaced between March 1998 and April 2007 along the eastern flank of Piton de la Fournaise volcano. The authors succeeded in telling apart the proportion of the displacement signal related to the thermal contraction and compaction of the newly emplaced lava flows and the depression of the underlying substratum from the proportion of the movement due to the slow subsidence and seaward motion of the volcano’s mobile eastern flank.

3.5. Flank Sliding and Slip

Volcano edifice spreading is a common process that accompanies an active volcano’s growth. Spreading is expressed as subsidence of the central cone, and horizontal outward movement of the volcano’s flanks [26,27], and it can occur as both steady flank sliding and sudden flank slip. As Piton de la Fournaise is growing at the eastern flank of its bigger neighbor Piton des Neiges, the direction of Piton de la Fournaise spreading is forced towards its unsupported eastern flank. Although volcano spreading and associated eastern flank instability had long been suspected from the volcano’s distinctive geomorphological setup [5,6,7,8,9,10,11,12,13,14,15], and from sub-sea-level evidence of partial or total flank collapses in the volcano’s history [53,54], the flank mobility was detected and measured for the first time during the 2007 eruption by means of SAR interferometry [18,34,40] (Figure 9). This particular eruption was accompanied by major flank slip of about 1.4 m according to Augier et al. [55] and Clarke et al. [56]. Froger et al. [18] used ENVISAT and ALOS1 satellite data to investigate the 2007 slip event. They suggest that an intrusion into the Grandes Pentes area might have been responsible for the large-scale movement. At that time, no GNSS stations were installed at the Grandes Pentes, which would have allowed for the detection of this movement. It was the first (and so far also the last) time that horizontal displacement of such a strong magnitude was recorded in the Grandes Pentes, even though other minor flank slip events have accompanied the May 2016 eruption [43,57], and most likely both the August 2019 and the October 2019 eruptions (to be confirmed as of the time of writing). Tridon et al. [58] inverted the InSAR measurements of the 2007 flank slip and suggest that the surface displacements might have been induced by a sheared sill. Chen et al. [59] found seaward motion of the volcano’s eastern flank also during the 2009–2014 period (a portion of the data used by Chen et al. [59] which are covering the mid-2011 to mid-2014 period are shown in Figure 5), which the authors interpreted as the continuity of the post-2007 displacement in the Grandes Pentes due to the fact that about the same area was affected by the detected motion, although in a more subtle manner (Figure 5 and Figure 9). The same authors then retrospectively analyzed long-term displacements of areas covered by the 1998–2007 lava flows and found an additional subsidence component to detected lava flow compaction that the authors attributed to flank sliding prior to the major 2007 eruption [19].
Now that flank motion has been proven a fact at Piton de la Fournaise volcano, its detailed mechanism and characterization remains challenging and the subject of scientific investigation and debate. A few clusters of seismicity exist underneath the eastern flank (Figure 1). While these clusters seem to be aligned and possibly delineating a sliding plane or décollement based on the E–W profile (profile A-B in Figure 1), the N–S profile (profile A’-B’ in Figure 1) on the contrary suggests a pan-shaped structure rather than confirming a plane or décollement. Cayol et al. and Chaput et al. [60,61], for example, employed theoretical models that were supported by seismicity and InSAR data in order to find the physical mechanism behind Piton de la Fournaise’s flank motion. Peltier et al., Froger et al., and Chen et al. [3,18,59] all agreed with previous studies [23,41] that stress associated with magmatism, but also pre-existing structural discontinuities and/or active fault structures (as identified by [13,18,19]) could all contribute to the eastern flank mobility. InSAR and MT-InSAR methods like PS-InSAR will continue to play an important role for investigating sudden slip as well as long-term sliding of the volcano’s eastern flank. However, frequent resurfacing by lava flows and the resulting replacement of ground scatterers, the ever-changing topography, and superimposed deformation processes add complexities to MT-InSAR processing at Piton de la Fournaise volcano, and careful data handling and advanced processing techniques are being employed.

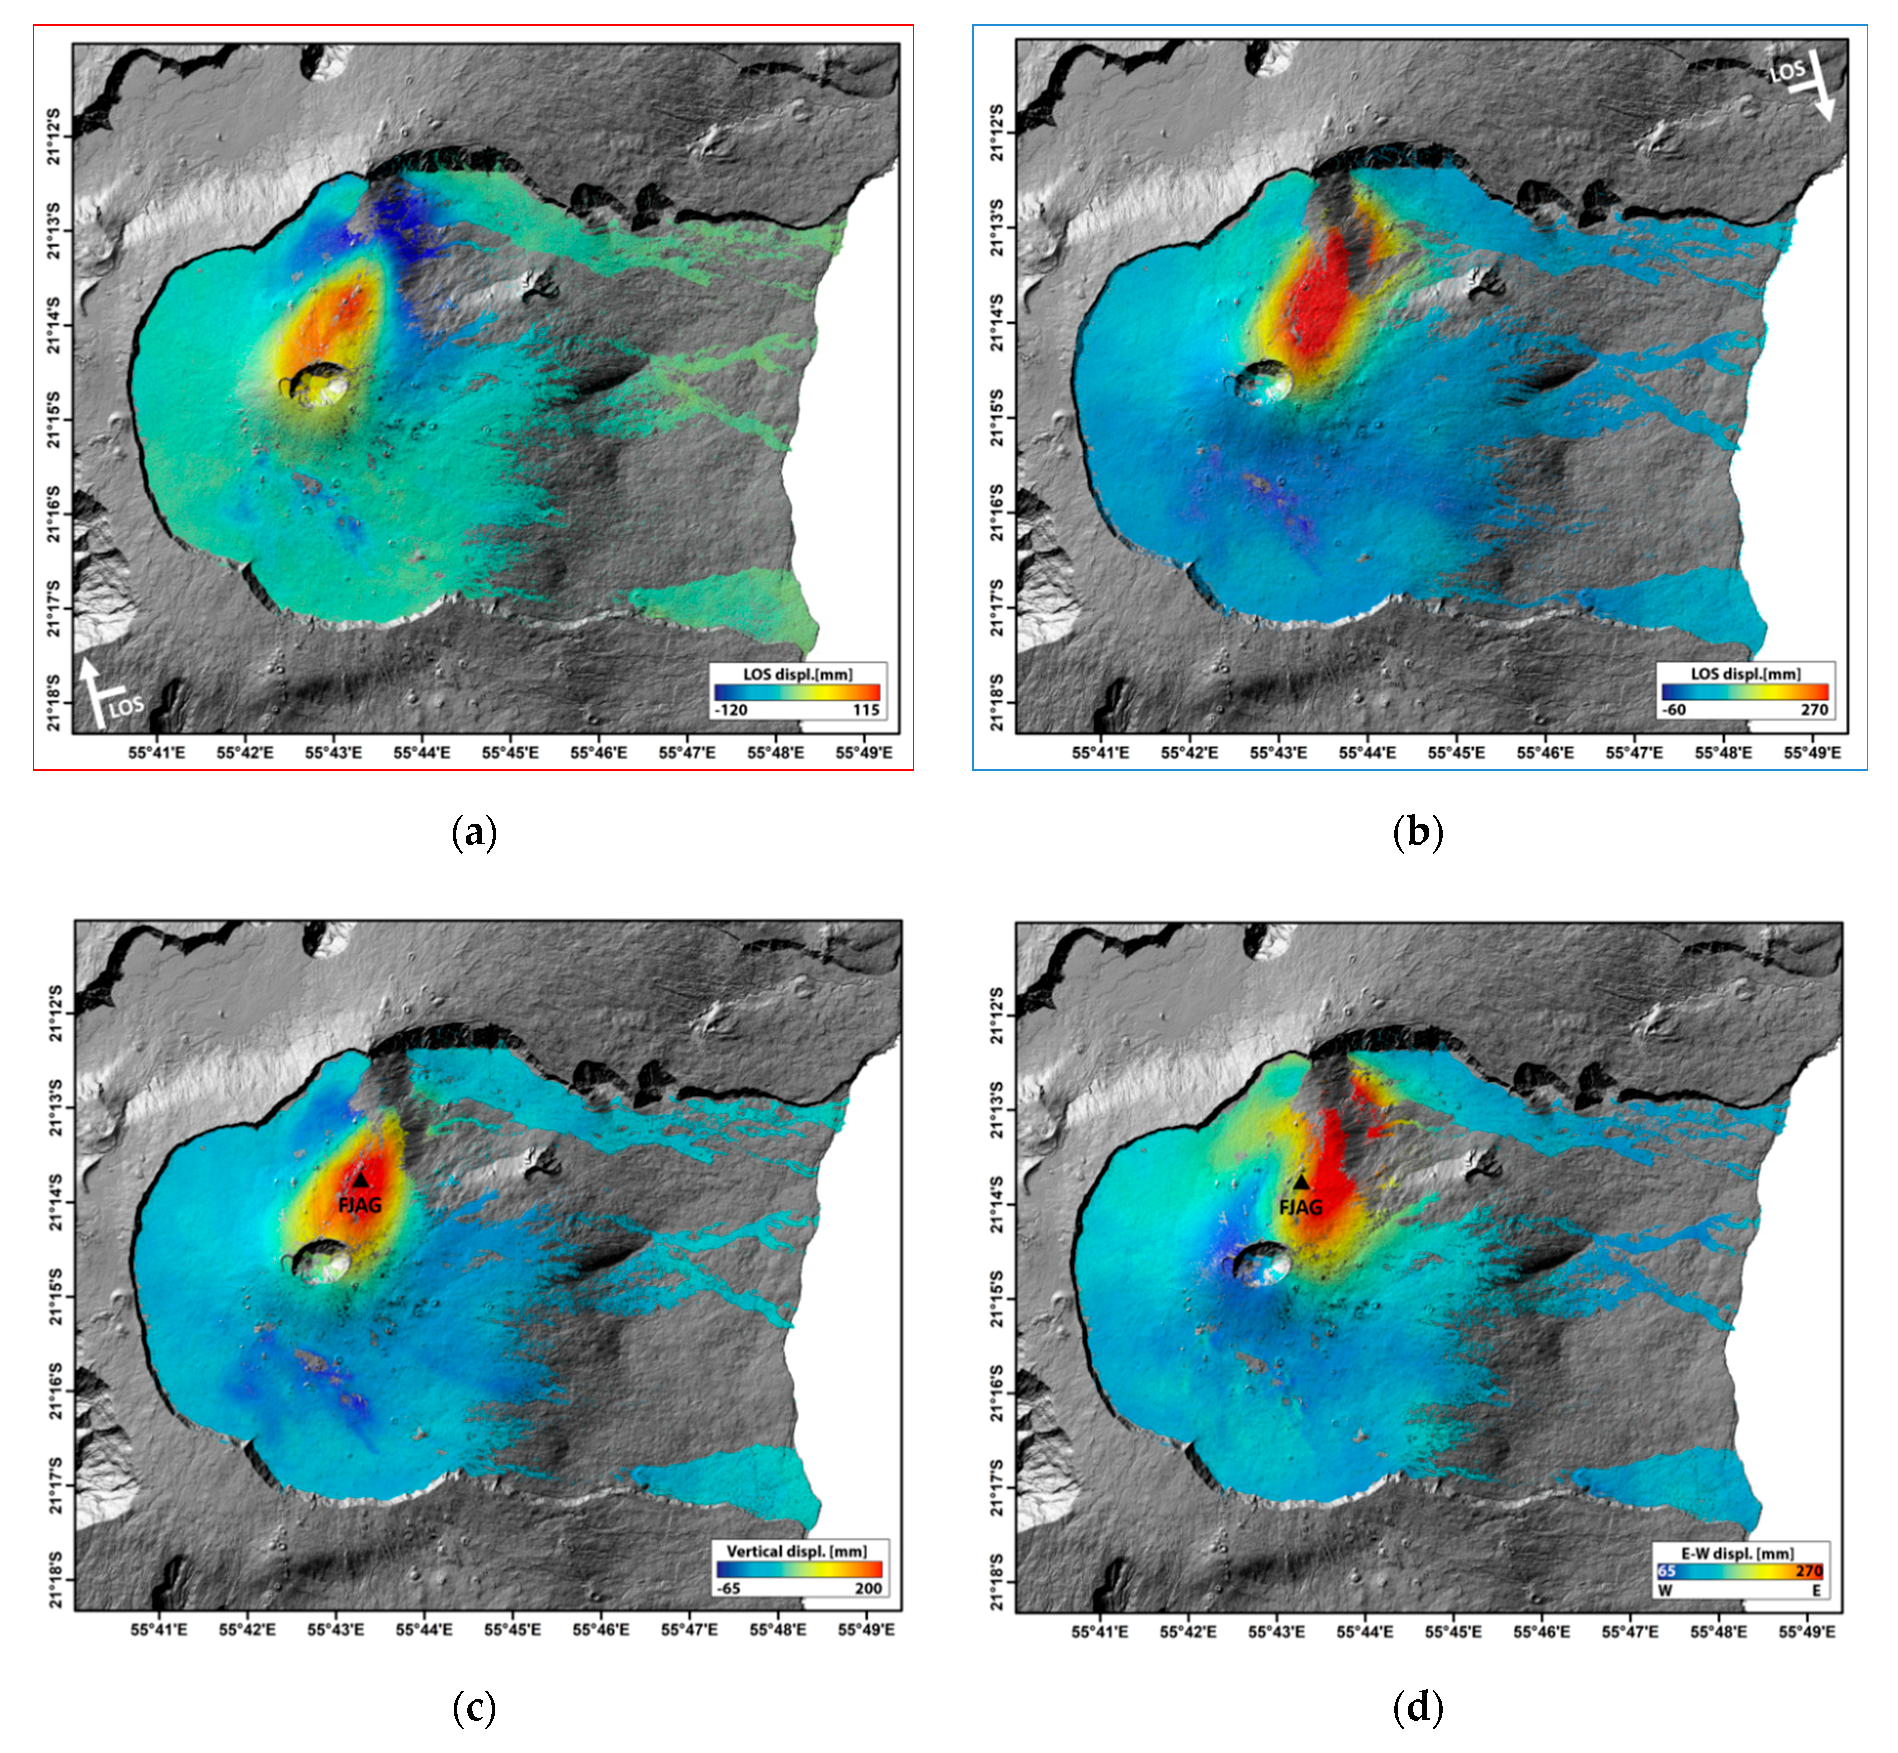
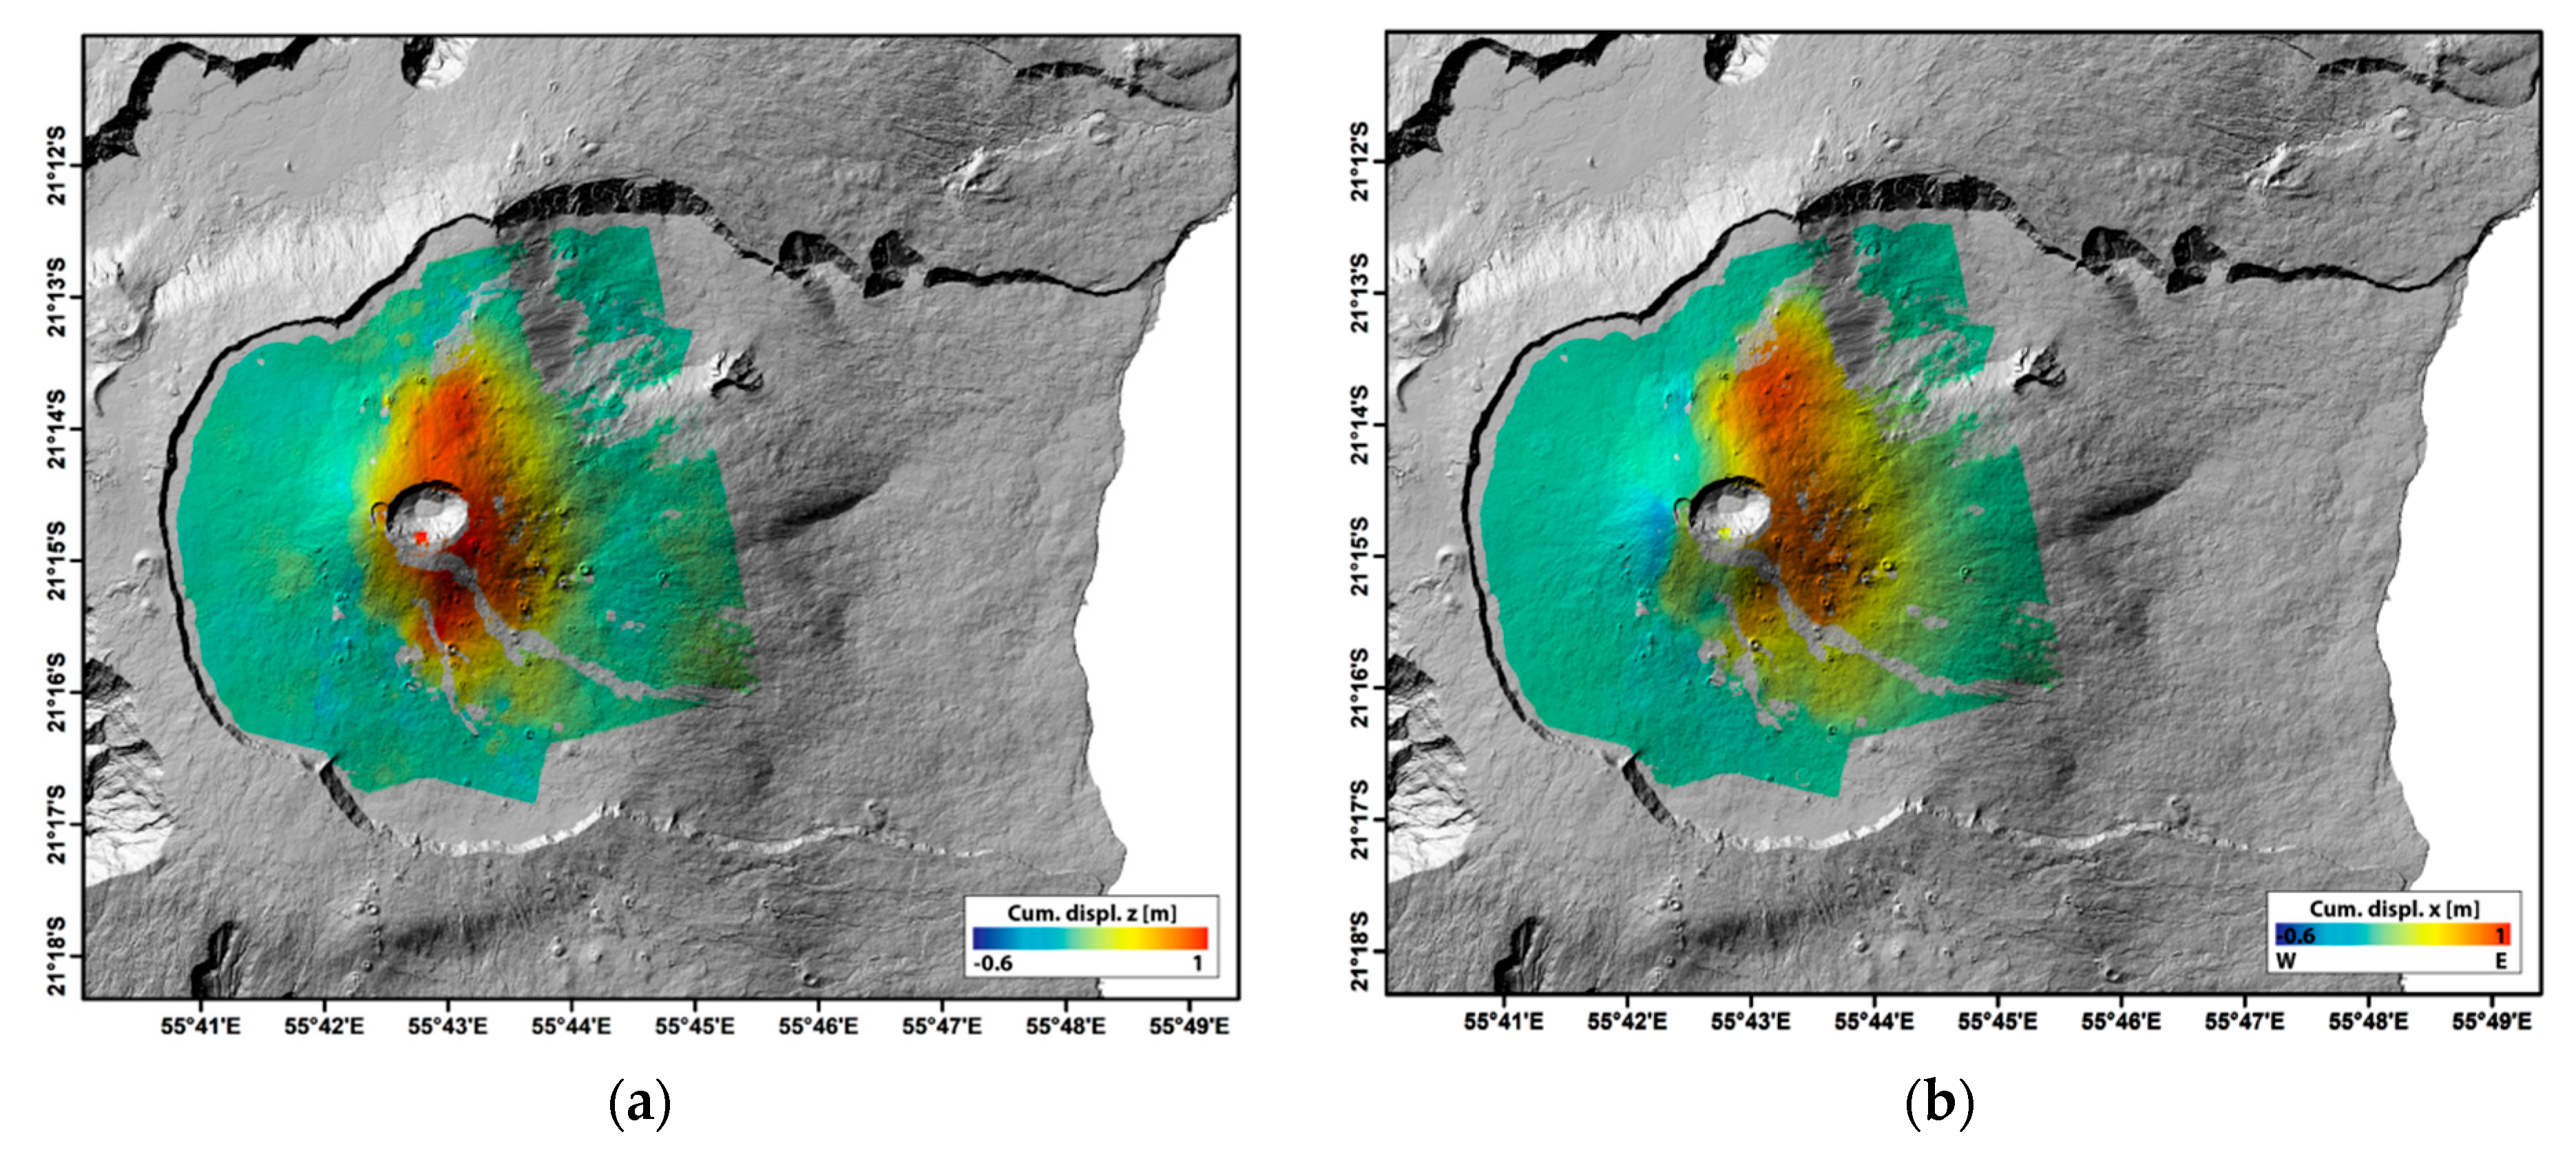
3.6. Cumulative Displacements

The vertical and horizontal cumulative displacements as shown in Figure 10 reflect the total surface displacement associated with successive intrusions. They were calculated based on SAR acquisitions from June 2014, February 2015, May 2015, July 2015, August 2015, May 2016, September 2016, January 2017, May 2017, and July 2017. Cumulative displacement maps provide a powerful means of identifying areas affected by important ground deformation and can, therefore, be used to better position ground instrumentation (such as tiltmeters, GNSS sensors, and benchmarks) that are designed to precisely detect surface deformation in the form of (continuous) point measurements.

4. Discussion and Conclusion: Lessons Learned and Future Perspectives

For Piton de la Fournaise volcano, a well-developed and coherent SAR database exists that contains satellite acquisitions dating back to early September 2000 (Section 2). Surface deformation measurements derived from these data using InSAR and MT-InSAR techniques complement an elaborated ground deformation monitoring network operated by OVPF-IPGP (Figure 2 and Figure 3). The InSAR techniques have proven to be very well suited to measure the spatial extent and magnitude of the full variety of characteristic surface displacement phenomena associated with the high level of activity of Piton de la Fournaise volcano (Section 3). In particular, SAR data are playing a fundamental role in the detection and quantification of movement of the volcano’s eastern flank. The data are also being used to characterize surface deformation associated with 52 Piton de la Fournaise volcanic eruptions that occurred since 1998 (out of a total of 58 eruptions as of the end of 2019). Systematic numerical modeling of associated surface displacements holds the important potential of distinctly quantifying progressive stress accumulation within the volcano’s edifice. The SAR data are also being employed to detect details on lava flow emplacement and post-emplacement subsidence over time, as well as to derive lava flow characteristics (such as lava flow thickness and volume), assisting the assessment of related volcanic hazards. InSAR studies at Piton de la Fournaise volcano have shown that information on the location of otherwise undetected geomorphological structures and discontinuities, as well as an improved conception of the volcano’s magma transport and storage system, can be gained from SAR data. Based on cumulative displacement maps, optimal locations for new ground instrumentation can be identified.
The results obtained by applying SAR interferometry to study surface deformation phenomena at Piton de la Fournaise have important implications for active basaltic ocean island shield volcanoes elsewhere in the world. For instance, surface deformation observed at Piton de la Fournaise volcano helps developing a better understanding of the complex interactions between eruptive activity and volcano edifice stability in general. Several authors have found that repeated magmatic intrusions at Piton de la Fournaise change the edifice’s internal stress distribution and contribute to its destabilization [23,41]. Thanks to a well-stocked SAR data archive allowing for the analysis of the very frequent eruptions of Piton de la Fournaise, (especially shallow) processes of magma storage and transport (occurring at less than ~2500 m depths) are better understood today. Based on the studies summarized in Section 3.2.1, one may conclude that for the majority of the Piton de la Fournaise eruptions, asymmetric deformation patterns are observed with typically higher displacement magnitudes towards the east. This is often explained by either a dipping dyke [23] or the involvement of vertical magma propagation (and associated sliding) [40,43]. The importance of taking into account the topography when inverting for source geometries and the fact that linear elasticity might be too simple of an assumption when modeling magma propagation within a volcano’s distribution system (i.e., uppermost part of the volcano’s edifice that lies above the shallowest magmatic reservoir) are general lessons learned from studying surface deformation at Piton de la Fournaise that may apply to many basaltic shield volcanoes worldwide.
One major limitation of InSAR when applied to processes of active volcanisms remains the sampling rate, i.e., the temporal resolution. Only long-term processes and well-established sources can deliver strong enough constrains to invert for actual deformation source geometries. Many past studies, at Piton de la Fournaise and other volcanoes worldwide, have shown that the timing of interferograms was crucial for modelling and understanding dynamic processes of subsurface magma storage and transport (e.g., examples described in Section 3.2.2). Eruption-spanning interferograms, for example, can only provide information on the overall shape of an intrusion, but not on the intrusion dynamics, i.e., the temporal progression during phases of fast subsurface magma migration [43]. We have described examples of magma ascent at Piton de la Fournaise that affect very shallow levels of the volcanic edifice (<2500 m depths) and that occur over the course of only a few hours to days (typically accompanied by a seismic crisis [38]). Therefore, even a daily SAR data sampling rate would not be sufficient to precisely constrain the dynamics of magma propagation from the (shallow) source to the surface. A (nearly) continuous interferometric data record during such highly dynamic phases of magma ascent (maybe provided by a geostationary SAR system) would probably take our understanding of shallow pre-eruptive magma propagation to a next level. However, already a daily data sampling during phases of unrest helps in detecting (maybe elastic or partially elastic) surface deformation that cannot be observed by any other means (as exemplified in Section 3.2.1 and Section 3.2.2). Therefore, a key requirement for SAR interferometry to qualify for a near-real-time and fully operational volcano monitoring tool is a dense temporal SAR image acquisition rate in combination with very fast and efficient data and data product availability. We have illustrated examples observed at Piton de la Fournaise volcano that highlight the importance of dense temporal sampling for active volcano monitoring, while also various other scientific communities that are using InSAR for surface motion detection and monitoring would certainly benefit from higher temporal sampling rates (e.g., glaciology, as glaciers are moving very fast). Moving from repeat cycles of 35 days for the ENVISAT satellite to the new radar satellite generation with, for example, ~6 days repetition cycle for S1, we are steadily progressing towards near-real-time and operational satellite-based surface deformation measurements.
A great future potential of InSAR lies in the innovative utilization of SAR data collected by multiple, simultaneously operating sensors. For instance, different sensibilities and data resolutions allow for the detection and analysis of diverse processes or different features of the same process (e.g., high-resolution near-field vs. coarser-resolution far-field displacements associated with shallower and deeper processes that might be preceding the same eruption). Even if data acquired by different sensors cannot be combined to interferograms, numerical inversions can benefit from jointly using InSAR results derived from multiple sensor data as a variety of acquisition geometries and timings will provide better constraints on deformation source parameters. Future satellite systems will likely more and more work in constellations and/or support multisensor compatibilities in order to further improve temporal resolutions and to facilitate a more sophisticated definition of the 3D displacement components (EW, NS, UD). An overview of recently launched and already planned (near) future SAR satellite missions is given in Table 2.

Author Contributions

Conceptualization, investigation, visualization, and writing — original draft preparation, N.R.; data processing, visualization, and writing — review and editing, N.R. and J.-L.F. All authors have read and agreed to the published version of the manuscript.

Funding

This research was funded by the AGENCE NATIONALE DE LA RECHERCHE (ANR); grant number ANR-16-CE04-004-01.

Acknowledgments

We thank the OVPF team for their tireless commitment to Piton de la Fournaise volcano monitoring, research, education, and information of scientists, decision makers, media, and the interested public. We also thank Aline Peltier and three anonymous reviewers for very valuable suggestions and comments on the manuscript. Seismic data shown on Figure 1 were collected and processed by the Observatoire Volcanologique du Piton de la Fournaise, Institut de Physique du Globe de Paris (OVPF-IPGP), and raw seismic data can be downloaded from the http://volobsis.ipgp.fr/ website. All SAR data except those shown in Figure 4c, Figure 9, and Figure 10 (which were processed using DIAPASON) were processed using the SARproZ software. We would like to thank the European Space Agency (ESA) for providing ENVISAT ASAR data through the AO-ENVISAT project #746, and ALOS1 data through the ALOS-ADEN project #3622. We also thank the Sentinel-1 ESA team, especially Mr. P. Potin and Mr. Y.-L. Desnos for facilitating routine Sentinel-1 StripMap acquisitions over La Réunion Island. We thank the German Aerospace Center (DLR) for providing TerraSAR-X and TanDEM-X data through the LAN0237, GEO3602, and XTI_GEOL_NR0224 data proposals. ASI provided us with CSK scenes through the CSK AO 2080 project, for which we are thankful. Likewise, we thank JAXA for providing us with ALOS2 data through the 4th ALOS RA 1287, as well as the 6th ALOS RA 3187 projects. We thank the Canadian Space Agency, MacDonald, Dettwiler & Associates Ltd., and the SOAR program for providing RADARSAT-1 and RADARSAT-2 data, as well as the SEAS-OI (Survey of Environment Assisted by Satellite in the Indian Ocean) receiving station that provided RADARSAT-2 data at no cost (www.seas-oi.org). Developing the SAR database for Piton de la Fournaise volcano was supported by the French Space Agency (CNES) through the TOSCA and Kalideos programs, by the French National Institute for Earth Sciences and Astronomy (CNRS-INSU) through the PNTS and SNOV programs, by the French National Research Agency through ANR-10-EQPX-20 (GEOSUD) and ANR-16-CE04-0004-01 (SlideVOLC) projects, and by the French Government Laboratory of Excellence initiative ANR-10-LABX-0006.

Conflicts of Interest

The authors declare no conflicts of interest. The funders had no role in the design of the study; in the collection, analyses, or interpretation of data; in the writing of the manuscript, or in the decision to publish the results.

References

  1. Peltier, A.; Bachèlery, P.; Staudacher, T. Magma transport and storage at Piton de La Fournaise (La Réunion) between 1972 and 2007: A review of geophysical and geochemical data. J. Volcanol. Geotherm. Res. 2009, 184, 93–108. [Google Scholar] [CrossRef]
  2. Michon, L.; Di Muro, A.; Villeneuve, N.; Saint-Marc, C.; Fadda, P.; Manta, F. Explosive activity of the summit cone of Piton de la Fournaise volcano (La Réunion island): A historical and geological review. J. Volcanol. Geotherm. Res. 2013, 264, 117–133. [Google Scholar] [CrossRef] [Green Version]
  3. Peltier, A.; Poland, M.P.; Staudacher, T. Are Piton de la Fournaise (La Réunion) and Kīlauea (Hawai‘i) really “analog volcanoes”. Hawaii Volcanoes Source Surf. Geophys. Monogr. Ser. 2015, 208, 507–531. [Google Scholar] [CrossRef]
  4. Michon, L.; Lénat, J.F.; Bachèlery, P.; Di Muro, A. Geology and morphostructural evolution of Piton de la Fournaise. In Active Volcanoes of the Southwest Indian Ocean; Springer: Berlin/Heidelberg, Germany, 2016; pp. 45–59. [Google Scholar] [CrossRef] [Green Version]
  5. Bachèlery, P. Le Piton de la Fournaise (Ile de la Réunion). Etude volcanologique, structurale et pétrologique. Ph.D. Thesis, University Clermont-Ferrand II, Clermont-Ferrand, France, 1981; p. 215. [Google Scholar]
  6. Chevallier, L.; Bachèlery, P. Evolution structurale du volcan actif du Piton de la Fournaise, Ile de la Réunion - Océan indien occidental. Bull. Volcanol. 1981, 44, 723–741. [Google Scholar] [CrossRef]
  7. Duffield, W.A.; Stieltjes, L.; Varet, J. Huge landslide blocks in the growth of Piton de la Fournaise, La Reunion, and Kilauea Volcano, Hawaii. J. Volcanol. Geoth. Res. 1982, 12, 147–160. [Google Scholar] [CrossRef]
  8. Lénat, J.F.; Vincent, P.M.; Bachèlery, P. The off-shore continuation of an active basaltic volcano: Piton de la Fournaise (Réunion Island, Indian Ocean); structural and geomorphological interpretation from sea beam mapping. J. Volcanol. Geoth. Res. 1989, 36, 1–36. [Google Scholar] [CrossRef]
  9. Labazuy, P. Recurrent landslides events on the submarine flank of Piton de la Fournaise volcano (Réunion Island). Geol. Soc. Spec. Publ. 1996, 110, 293–306. [Google Scholar] [CrossRef]
  10. Merle, O.; Lénat, J. Hybrid collapse mechanism at Piton de la Fournaise volcano, Reunion Island, Indian Ocean. J. Geophys. Res.-Solid Earth 2003, 108, 2166. [Google Scholar] [CrossRef]
  11. Oehler, J.F.; Labazuy, P.; Lénat, J.F. Recurrence of major flank landslides during the last 2-Ma-history of Reunion Island. Bull. Volcanol. 2004, 66, 585–598. [Google Scholar] [CrossRef]
  12. Oehler, J.F.; Lénat, J.F.; Labazuy, P. Growth and collapse of the Reunion Island volcanoes. Bull. Volcanol. 2008, 70, 717–742. [Google Scholar] [CrossRef]
  13. Michon, L.; Saint-Ange, F. Morphology of Piton de la Fournaise basaltic shield volcano (La Réunion Island): Characterization and implication in the volcano evolution. J. Geophys. Res.-Solid Earth 2008, 113, B03203. [Google Scholar] [CrossRef] [Green Version]
  14. Staudacher, T.; Ferrazzini, V.; Peltier, A.; Kowalski, P.; Boissier, P.; Catherine, P.; Lauret, F.; Massin, F. The April 2007 eruption and the Dolomieu crater collapse, two major events at Piton de la Fournaise. J. Volcanol. Geotherm. Res. 2009, 184, 126–137. [Google Scholar] [CrossRef]
  15. Lenat, J.-F.; Bachelery, P.; Peltier, A. The interplay between collapse structures, hydrothermal systems, and magma intrusions: The case of the central area of Piton de la Fournaise volcano. Bull. Volcanol. 2012, 74, 407–421. [Google Scholar] [CrossRef]
  16. Battaglia, J.; Ferrazzini, V.; Staudacher, T.; Aki, K.; Cheminée, J.L. Pre-eruptive migration of earthquakes at the Piton de La Fournaise volcano (Réunion Island). Geophys. J. Int. 2005, 161, 549–558. [Google Scholar] [CrossRef]
  17. Battaglia, J.; Breunguier, F.; Roult, G. Seismic monitoring at Piton de la Fournaise. In Active Volcanoes of the Southwest Indian Ocean; Springer: Berlin/Heidelberg, Germany, 2016; pp. 223–242. [Google Scholar] [CrossRef]
  18. Froger, J.L.; Famin, V.; Cayol, V.; Augier, A.; Michon, L.; Lénat, J.F. Time-dependent displacements during and after the April 2007 eruption of Piton de la Fournaise, revealed by interferometric data. J. Volcanol. Geotherm. Res. 2015, 296, 55–68. [Google Scholar] [CrossRef] [Green Version]
  19. Chen, Y.; Zhang, K.; Froger, J.-L.; Tan, K.; Remy, D.; Darrozes, J.; Peltier, A.; Feng, X.; Li, H.; Villeneuve, N. Long-Term Subsidence in Lava Fields at Piton de la Fournaise Volcano Measured by InSAR: New Insights for Interpretation of the Eastern Flank Motion. Remote Sens. 2018, 10, 597. [Google Scholar] [CrossRef] [Green Version]
  20. Global Volcanism Program. Report on Piton de la Fournaise (France). Available online: https://volcano.si.edu/showreport.cfm?doi=10.5479/si.GVP.BGVN199803-233020 (accessed on 21 March 2020).
  21. Peltier, A.; Villeneuve, N.; Ferrazzini, V.; Testud, S.; Hassen Ali, T.; Boissier, P.; Catherine, P. Changes in the Long-Term Geophysical Eruptive Precursors at Piton de la Fournaise: Implications for the Response Management. Front. Earth Sci. 2018, 6, 104. [Google Scholar] [CrossRef]
  22. Staudacher, T.; Peltier, A. Ground deformation at Piton de la Fournaise, a review from 20 years of GNSS monitoring. In Active Volcanoes of the Southwest Indian Ocean; Springer: Berlin/Heidelberg, Germany, 2016; pp. 251–269. [Google Scholar] [CrossRef]
  23. Sigmundsson, F.; Durand, P.; Massonnet, D. Opening of an eruptive fissure and sea- ward displacement at Piton de la Fournaise volcano measured by RADARSAT satellite radar interferometry. Geophys. Res. Lett. 1999, 26, 533–536. [Google Scholar] [CrossRef]
  24. CASOAR. Available online: https://wwwobs.univ-bpclermont.fr/casoar/resources/php/Accounts/login.php (accessed on 5 March 2020).
  25. Peltier, A.; Froger, J.-L.; Villeneuve, N.; Catry, T. Assessing the reliability and consistency of InSAR and GNSS data for retrieving 3D displacement rapid changes, the example of the 2015 Piton de la Fournaise eruptions. J. Volcanol. Geotherm. Res. 2017, 344, 106–120. [Google Scholar] [CrossRef]
  26. Borgia, A.; Delaney, P.T.; Denlinger, R.P. Spreading volcanoes. Annu. Rev. Earth Planet. Sci. 2000, 28, 539–570. [Google Scholar] [CrossRef]
  27. González, P.J.; Tiampo, K.F.; Camacho, A.G.; Fernández, J. Shallow flank deformation at Cumbre Vieja volcano (Canary Islands): Implications on the stability of steep-sided volcano flanks at oceanic islands. Earth Planet. Sci. Lett. 2010, 297, 545–557. [Google Scholar] [CrossRef]
  28. Dietterich, H.R.; Poland, M.P.; Schmidt, D.A.; Cashman, K.V.; Sherrod, D.R.; Espinosa, A.T. Tracking lava flow emplacement on the east rift zone of Kīlauea, Hawai‘i, with synthetic aperture radar coherence. Geochem. Geophys. Geosys. 2012, 13, 1–17. [Google Scholar] [CrossRef]
  29. Wittmann, W.; Sigmundsson, F.; Dumont, S.; Lavallée, Y. Post-emplacement cooling and contraction of lava flows: InSAR observations and a thermal model for lava fields at Hekla volcano, Iceland. J. Geophys. Res. Solid Earth 2017, 122, 946–965. [Google Scholar] [CrossRef] [Green Version]
  30. Hrysiewicz, A.; Froger, J.-L.; Villeneuve, N.; Menand, T.; Aaron, C.; Peltier, A. InSAR characterization of lava flows at Piton de la Fournaise. In Proceedings of the 19th General Assembly of Wegener on Earth Deformation and the Study of Earthquakes Using Geodesy and Geodynamics, Grenoble, France, 10–13 September 2018. [Google Scholar]
  31. Peltier, A.; Famin, V.; Bachèlery, P.; Cayol, V.; Fukushima, Y.; Staudacher, T. Cyclic magma storages and transfers at Piton de la Fournaise volcano (La Réunion hotspot) inferred from deformation and geochemical data. Earth Planet. Sci. Lett. 2008, 270, 180–188. [Google Scholar] [CrossRef]
  32. Peltier, A. Suivi, Modélisation et Evolution des processus d’injections magmatiques au Piton de la Fournaise. Ph.D. Thesis, Université de La Réunion, Réunion, France, 2007. [Google Scholar]
  33. Peltier, A.; Staudacher, T.; Bachèlery, P. Constraints on magma transfers and structures involved in the 2003 activity at Piton de la Fournaise from displacement data. J. Geophys. Res. 2007, 112, B03207. [Google Scholar] [CrossRef] [Green Version]
  34. Tinard, P. Caractérisation et modélisation des déplacements du sol associés à l’activité volcanique du Piton de la Fournaise, île de La Réunion, à partir de données interférométriques. Ph.D. Thesis, Université de Clermont Ferrand, Clermont-Ferrand, France, 2007. [Google Scholar]
  35. Webley, P.; Wadge, G.; James, I.N. Determining radio wave delay by nonhydrostatic atmospheric modelling of water vapour over mountains. Phys. Chem. Earth 2004, 29, 139–148. [Google Scholar] [CrossRef]
  36. Pavez, A.; Remy, D.; Bonvalot, S.; Diament, M.; Gabalda, G.; Froger, J.-L.; Julien, P.; Lengrand, D.; Moisset, D. Insight into ground deformations at Lascar volcano (Chile) from SAR interferometry, photogrammetry and GPS data: Implications on volcano dynamics and future space monitoring. Remote Sens. Environ. 2006, 100, 307–320. [Google Scholar] [CrossRef] [Green Version]
  37. Ebmeier, S.K.; Biggs, J.; Mather, T.A.; Amelung, F. Applicability of InSAR to tropical volcanoes: Insights from Central America. Geol. Soc. Lond. Spec. Publ. 2013, 380, 15–37. [Google Scholar] [CrossRef] [Green Version]
  38. Staudacher, T.; Peltier, A.; Ferrazzini, V.; Di Muro, A.; Boissier, P.; Catherine, P.; Kowalski, P.; Laurent, F.; Lebreton, J. Fifteen years of intense eruptive activity (1998–2013) at Piton de La Fournaise volcano: A review. In Active Volcanoes of the Southwest Indian Ocean; Springer: Berlin/Heidelberg, Germany, 2016; pp. 139–170. [Google Scholar] [CrossRef]
  39. Fukushima, Y.; Cayol, V.; Durand, P. Finding realistic dike models from interferometric synthetic aperture radar data: The February 2000 eruption at Piton de la Fournaise. J. Geophys. Res. Solid Earth 2005, 110, 1–16. [Google Scholar] [CrossRef] [Green Version]
  40. Fukushima, Y.; Cayol, V.; Durand, D.; Massonnet, D. Evolution of magma conduits during the 1998–2000 eruptions of Piton de la Fournaise volcano, Réunion Island. J. Geophys. Res. 2010, 115, 1–21. [Google Scholar] [CrossRef] [Green Version]
  41. Froger, J.-L.; Fukushima, Y.; Briole, P.; Staudacher, T.; Souriot, T.; Villeneuve, N. The deformation field of the August 2003 eruption at Piton de la Fournaise, Reunion Island, mapped by ASAR interferometry. Geophys. Res. Lett. 2004, 31, 1–5. [Google Scholar] [CrossRef]
  42. Augier, A. Etude de l’éruption d’avril 2007 du Piton de la Fournaise (île de la Réunion) à partir de données d’interférométrie RADAR et GPS, développement et application de procédure de modélisation. Ph.D. Thesis, Université Blaise Pascal, Clermont-Ferrand, France, 2011. [Google Scholar]
  43. Smittarello, D.; Cayol, V.; Pinel, V.; Peltier, A.; Froger, J.-L.; Ferrazzini, V. Magma Propagation at Piton de la Fournaise from joint inversion of InSAR and GNSS. J. Geophys. Res. Solid Earth 2019, 124, 1361–1387. [Google Scholar] [CrossRef]
  44. Got, J.-L.; Peltier, A.; Staudacher, T.; Kowalski, P.; Boissier, P. Edifice strength and magma transfer modulation at Piton de la Fournaise volcano. J. Geophys. Res. Solid Earth 2013, 118, 1–18. [Google Scholar] [CrossRef]
  45. Wright, T.J.; Parsons, B.E.; Lu, Z. Toward mapping surface deformation in three dimensions using InSAR. Geophys. Res. Lett. 2004, 31, 1–5. [Google Scholar] [CrossRef] [Green Version]
  46. Derrien, A.; Villeneuve, N.; Peltier, A.; Michon, L. Multi-temporal airborne structure-from-motion on caldera rim: Hazard, visitor exposure and origins of instabilities at Piton de la Fournaise. Progress Phys. Geogr. Earth Environ. 2019, 43, 193–214. [Google Scholar] [CrossRef]
  47. Richter, N.; Poland, M.P.; Lundgren, P.R. TerraSAR-X interferometry reveals small-scale deformation associated with the summit eruption of Kīlauea Volcano, Hawai‘i. Geophys. Res. Lett. 2013, 40, 1279–1283. [Google Scholar] [CrossRef]
  48. Richter, N.; Favalli, M.; de Zeeuw-van Dalfsen, E.; Fornaciai, A.; da Silva Fernandes, R.M.; Pérez, N.M.; Levy, J.; Silva Victória, S.; Walter, T.R. Lava flow hazard at Fogo Volcano, Cabo Verde, before and after the 2014-2015 eruption. Nat. Hazards Earth Syst. Sci. 2016, 16, 1925–1951. [Google Scholar] [CrossRef] [Green Version]
  49. Hrysiewicz, A. Caractérisation des déplacements liés aux coulees de lave au Piton de la Fournaise à partir de données InSAR. Ph.D. Thesis, Université Clermont Auvergne, Clermont-Ferrand, France, 2019. [Google Scholar]
  50. Zebker, H.A.; Rosen, P.; Hensley, S.; Mouginis-Mark, P.J. Analysis of active lava flows on Kilauea volcano, Hawaii, using SIR-C radar correlation measurements. Geology 1996, 24, 495–498. [Google Scholar] [CrossRef] [Green Version]
  51. Harris, A.J.L.; Chevrel, O.M.; Coppola, D.; Ramsey, M.S.; Hrysiewicz, A.; Thivet, S.; Villeneuve, N.; Favalli, M.; Peltier, A.; Kowalski, P.; et al. Validation of an integrated satellite-data-driven response to an effusive crisis: The April–May 2018 eruption of Piton de la Fournaise. Available online: https://www.annalsofgeophysics.eu/index.php/annals/article/view/7972 (accessed on 20 March 2020).
  52. Bato, M.G.; Froger, J.-L.; Harris, A.J.L.; Villeneuve, N. Monitoring Effusive Eruptions at Piton de la Fournaise through synergy of Space-based Radar and Thermal Data: Insights into the October 2010 Eruption and its Lava Flows. In Detecting, Modelling and Responding to Effusive Eruptions; Harris, A.J.L., De Groeve, T., Garel, F., Carn, S.A., Eds.; Geological Society of London: London, UK, 2016. [Google Scholar] [CrossRef]
  53. Lenat, J.-F.; Bachelery, P.; Bonneville, A.; Galdeano, A.; Labazuy, P.; Rousset, D.; Vincent, P. Structure and morphology of the submarine flank of an active basaltic volcano: Piton de La Fournaise (Reunion Island, Indian Ocean). Oceanol. Acta 1990, 10, 211–223. [Google Scholar]
  54. Oehler, J.F.; van Wyk de Vries, B.; Labazuy, P. Landslides and spreading of oceanic hotspot and arc shield volcanoes on Low Strength Layers (LSLs): An analogue modelling approach. J. Volcanol. Geotherm. Res. 2005, 144, 169–189. [Google Scholar] [CrossRef]
  55. Augier, A.; Froger, J.-L.; Cayol, V.; Fukushima, Y.; Tinard, P.; Souriot, T.; Mora, O.; Staudacher, T.; Durand, P.; Fruneau, B.; et al. The April 2007 eruption at Piton de la Fournaise, Reunion Island, imaged with ENVISAT-ASAR and ALOS-PALSAR data. Proceedings the of USEReST Workshop, Napoli, Italy, 2008; Available online: https://www.researchgate.net/publication/267426899_The_April_2007_eruption_at_Piton_de_la_Fournaise_Reunion_Island_imaged_with_ENVISAT-ASAR_and_ALOS-PALSAR_data (accessed on 20 March 2020).
  56. Clarke, D.; Brenguier, F.; Froger, J.-L.; Shapiro, N.M.; Peltier, A.; Staudacher, T. Timing of a large volcanic flank movement at Piton de la Fournaise volcano using noise-based seismic monitoring and ground deformation measurements. Geophys. J. Int. 2013, 195, 1132–1140. [Google Scholar] [CrossRef] [Green Version]
  57. Smittarello, D.; Cayol, V.; Pinel, V.; Froger, J.-L.; Peltier, A.; Dumont, Q. Combining InSAR and GNSS to Track Magma Transport at Basaltic Volcanoes. Remote Sens. 2019, 11, 2236. [Google Scholar] [CrossRef] [Green Version]
  58. Tridon, M.; Cayol, V.; Froger, J.-L.; Augier, A.; Bachèlery, P. Inversion of coeval shear and normal stress of Piton de la Fournaise flank displacement. J. Geophys. Res. Solid Earth 2016, 121, 7846–7866. [Google Scholar] [CrossRef] [Green Version]
  59. Chen, Y.; Remy, D.; Froger, J.-L.; Peltier, A.; Villeneuve, N.; Darrozes, J.; Perfettini, H.; Bonvalot, S. Long-term ground displacement observations using InSAR and GNSS at Piton de la Fournaise volcano between 2009 and 2014. Remote Sens. Environ. 2017, 194, 230–247. [Google Scholar] [CrossRef]
  60. Cayol, V.; Catry, T.; Michon, L.; Chaput, M.; Famin, V.; Bodart, O.; Froger, J.-L.; Romagnoli, C. Sheared sheet intrusions as mechanism for lateral flank displacement on basaltic volcanoes: Applications to Réunion Island volcanoes. J. Geophys. Res. Solid Earth 2014, 119, 7607–7635. [Google Scholar] [CrossRef] [Green Version]
  61. Chaput, M.; Pinel, V.; Famin, V.; Michon, L.; Froger, J.-L. Cointrusive shear displacement by sill intrusion in a detachment: A numerical approach. Geophys. Res. Lett. 2014, 41, 1937–1943. [Google Scholar] [CrossRef] [Green Version]
Figure 1. The location and timing of all located seismic events of a minimum magnitude of -0.6 that were recorded on the Piton de la Fournaise Volcanological Observatory (OVPF) network between early March 1996 and early September 2019 (marked by colored dots) plotted onto the shaded relief of Piton de la Fournaise volcano with the approximate location of the three main rift zones (shaded areas). The profiles A-B and A’-B’ illustrate the depths of the seismic events and show clusters of increased seismic activity within the volcano’s interior. Inset shows the location of Piton de la Fournaise (PdF) and Piton des Neiges (PdN) on La Réunion Island (OVPF-IPGP).
Remotesensing 12 01019 g001
Figure 2. The ground deformation monitoring network of OVPF plotted onto the shaded relief of Piton de la Fournaise volcano with the approximate location of the three main rift zones (shaded areas). Permanent GNSS stations are marked as black triangles, tiltmeters as blue squares, extensometers as yellow stars, and stainless-steel benchmarks as red dots. Station names ending with “G” are indicative of GNSS stations, station names ending with “I” are indicative of tiltmeters, station names ending with “X” are indicative of extensometers; the first three letters of a station name represent the station location. Two GNSS stations were offline at the time of writing and have italicized labels (OVPF-IPGP). All Synthetic Aperture Radar (SAR) data described in this publication cover the entire Enclos Grand Brûlé collapse structure, except for COSMO-SkyMed (CSK) and TerraSAR-X (TSX) SpotLight (SPT) data, the spatial coverages of which are indicated by solid (ascending, ASC) and dashed (descending, DSC) orange and light green frames, respectively. Throughout this publication, all maps feature the exact same map extent (wherein North is up), except for Figure 8, which covers the area indicated by the white solid frame.
Remotesensing 12 01019 g002
Figure 3. Overview of the complete SAR data archive holding a total of 1835 SAR scenes (represented as black dots) acquired over Piton de la Fournaise between 5 September 1998 and 31 December 2019: (a) data collected by “old generation” SAR satellites that are no longer operating; (b) data collected by “new generation” SAR satellites. A total of 58 eruptions are marked by red bars, while 24 intrusions are shown as green lines.
Remotesensing 12 01019 g003aRemotesensing 12 01019 g003b
Figure 4. The full graph average coherence over the course of about one year (end of January 2018 to end of February 2019): (a) X-band from ascending TSX SM data, 18 SAR scenes, 153 interferograms, incidence angle = 33.4°; (b) interferogram connection graph corresponding to (a); (c) C-band from descending S1 SM data, 32 images, 496 interferograms, incidence angle = 36.95°; (d) interferogram connection graph corresponding to (c); (e) L-band from descending ALOS2 SPT, 7 images, 21 interferograms, incidence angle = 59.2°; dates indicate the timing of four eruptions that occurred during the period of investigation; (f) interferogram connection graph corresponding to (e).
Remotesensing 12 01019 g004
Figure 5. Line-of-sight (LOS) displacement velocities between 7 September 2011 and 14 June 2014 from ascending TSX SM data. Characteristic deformation processes observed during this quiescent period of the volcano are lava flow subsidence, flank sliding of about ~3 cm of LOS subsidence per year, and the continuation of subsidence of the central volcanic cone upon the major 2007 eruption. Inset shows the time series for one selected point along the volcano’s mobile eastern flank.
Remotesensing 12 01019 g005
Figure 6. Deformation associated with the 03–04 April 2018 eruption as imaged by TSX SM interferometry: (a) unwrapped interferogram spanning 24 January to 22 April 2018 (ascending); (b) unwrapped interferogram spanning 28 January to 26 April 2018 (descending); (c) near-vertical displacements as derived from the combination of both ascending and descending interferograms, black triangle marks the location of the closest GNSS station (FJAG); (d) near E–W displacements as derived from the combination of both ascending and descending interferograms, black triangle marks the location of the closest GNSS station (FJAG); (e) vertical displacement component and (f) eastward displacement component of GNSS station FJAG (mm; at a daily sampling), where red bars mark the two April 2018 eruptions and dashed lines mark the time periods spanned by interferograms: red—time spanned by Figure 6a, blue—time spanned by Figure 6b, green—time spanned by Figure 7a, black—time spanned by Figure 7b.
Remotesensing 12 01019 g006aRemotesensing 12 01019 g006b
Figure 7. Post-eruptive deformation following the 03–04 April 2018 eruption as imaged by S1 SM interferometry: (a) wrapped interferogram spanning 03 April to 15 April 2018 (ascending), Bn 16 m, 14H52 UTC; (b) wrapped interferogram spanning 04 April to 16 April 2018 (descending), Bn 50 m, 01H46 UTC. The black triangle marks the location of the closest GNSS station (FJAG). Colored frames correspond to the colors used to mark the timing of SAR acquisitions in Figure 6e,f. Both the descending and the ascending post-eruptive displacement patterns correspond to a lengthening of the ground-satellite distance of about 7 cm.
Remotesensing 12 01019 g007
Figure 8. Deformation associated with the 11–18 September 2016 eruption as imaged by CSK SM interferometry: (a) wrapped interferogram spanning 31 August to 20 September 2016 (descending), Bn = 50 m; (b) wrapped interferogram spanning 31 August to 20 September 2016 (ascending), Bn = 172 m. Insets show a close-up of detected lineaments.
Remotesensing 12 01019 g008
Figure 9. ALOS1 ascending interferogram spanning 46 days (4 March to 19 April 2007) during the 30 March to 1 May 2007 eruption. A complete phase cycle (blue–yellow–red) represents an increase in the Earth–satellite distance of 11.8 cm. The white arrow indicates the LOS direction. Figure is adapted from Froger et al. [18].
Remotesensing 12 01019 g009
Figure 10. Cumulative displacements of Piton de la Fournaise volcano between June 2014 and July 2017: (a) near-vertical component (z), red areas are affected by uplift; (b) near E–W component (x), red areas are moving eastward.
Remotesensing 12 01019 g010
Table 1. Piton de la Fournaise SAR data specifications. The order of SAR satellites, modes, and acquisition geometries follows the structure of Figure 3a,b; “old generation” and “new generation” satellites are separated by a blank line. In addition to the data shown in Figure 3, also TanDEM-X Co-SSCs are listed.
Satellite aBandAcq.
Mode b
Pol.Resolution
R/A c (m)
Image Size
RxA c (km)
Scene Center CoordinateSwath /Track /Beam dPass LD eLook Angle (°) fFirst Image Date yyyy/mm/ddLast Image Date
yyyy/mm/dd
No. Scenes
ALOS1LSMHH/HV9.37/3.2043.5 × 59.021.36°S 55.98°E539AR37.32007/09/042010/07/284
ALOS1LSMHH4.68/3.2043.7 × 59.021.37°S 55.96°E539AR37.32007/03/042011/01/288
ALOS1LSMHH4.68/3.1943.7 × 59.021.29°S 55.93°E191DR39.82007/08/072008/08/092
ALOS1LSMHH4.68/3.6051.4 × 66.421.00°S 55.83°E542AR46.42006/07/222006/10/222
ALOS1LSMHH/HV9.37/4.0852.5 × 75.421.36°S 55.81°E541AR43.62006/10/052007/05/233
ALOS1LSMHH/HV9.37/3.2043.5 × 59.021.36°S 55.72°E540AR40.52007/08/062010/08/145
ALOS1LSMHH4.68/3.2043.7 × 59.021.36°S 55.42°E540AR40.52007/02/032010/03/299
ENVISATCSMVV7.80/3.2540.1 × 107.221.19°S 55.78°EIS7 005DR43.82003/08/122010/09/1435
ENVISATCSMVV7.80/3.2440.1 × 107.321.18°S 55.94°EIS7 170AR42.72007/04/142010/09/2522
ENVISATCSMVV7.80/3.9847.2 × 108.520.98°S 55.65°EIS6 277DR40.12003/07/272010/08/2945
ENVISATCSMVV7.80/3.2340.1 × 100.221.24°S 55.46°EIS5 399AR38.82003/09/082009/03/3039
ENVISATCSMVV7.80/3.2340.1 × 107.520.99°S 55.56°EIS5 048DR36.22003/11/282010/09/1738
ENVISATCSMVV7.80/3.9649.1 × 102.121.14°S 55.48°EIS4 127AR34.82010/02/242010/08/182
ENVISATCSMHH7.80/3.9649.1 × 102.121.14°S 55.48°EIS4 127AR34.82004/08/042015/12/074
ENVISATCSMVV7.80/4.0248.7 × 110.921.09°S 55.48°EIS4 320DR31.82009/06/032010/09/017
ENVISATCSMHH7.80/4.0248.7 × 110.921.09°S 55.48°EIS4 320DR31.82003/12/172005/12/215
ENVISATCSMVV7.80/3.1839.9 × 109.921.12°S 55.54°EIS3 091DR27.12003/08/182010/09/2044
ENVISATCSMVV7.80/3.1840.0 × 108.121.15°S 55.39°EIS3 356AR30.32003/08/012010/09/0342
ENVISATCSMVV7.80/4.0640.5 × 109.221.05°S 55.97°EIS2 313AR20.22003/04/152010/05/1849
ENVISATCSMVV7.80/4.0640.5 × 98.321.23°S 55.28°EIS2 084AR25.42003/08/172010/09/1933
ENVISATCSMVV7.80/4.0640.5 × 109.621.10°S 55.69°EIS2 363DR21.92003/08/022010/09/0453
RSAT1CSMHH4.63/5.1727.7 × 58.321.18°S 55.75°EF5DR47.52000/09/052002/03/114
RSAT1CSMHH4.63/5.0526.3 × 59.421.19°S 55.66°EF4AR46.12000/09/272002/04/268
RSAT1CSMHH4.63/5.3627.8 × 60.921.19°S 55.67°EF2AR40.92001/11/162002/04/092
ALOS2LSPTHH1.43/0.9723.4 × 26.221.25°S 55.71°E55DR69.22015/01/042019/10/2011
ALOS2LSPTHH1.43/0.9722.6 × 26.221.25°S 55.71°E56DR64.82014/12/122019/10/119
ALOS2LSPTHH1.43/0.9721.5 × 26.221.25°S 55.71°E57DR59.32017/07/122019/10/1616
ALOS2LSPTHH1.43/0.9719.8 × 26.221.25°S 55.71°E58DR52.42014/10/272019/12/3113
ALOS2LSPTHH1.43/0.9717.2 × 26.321.25°S 55.71°E59DR43.52014/12/132019/10/128
ALOS2LSPTHH1.43/0.9713.2 × 26.321.25°S 55.71°E60DR31.82015/01/012019/10/178
ALOS2LSPTHH1.43/0.9713.1 × 26.221.25°S 55.71°E64DL31.72014/08/202019/07/3111
ALOS2LSPTHH1.43/0.9717.2 × 26.221.25°S 55.71°E65DL43.32019/07/082019/08/052
ALOS2LSPTHH1.43/0.9719.8 × 26.121.25°S 55.71°E66DL52.52015/01/312015/10/245
ALOS2LSPTHH1.43/0.9721.5 × 26.021.25°S 55.71°E67DL59.62014/08/212019/07/0412
ALOS2LSPTHH1.43/0.9822.7 × 26.021.25°S 55.71°E68DL65.12014/12/162019/10/1511
ALOS2LSPTHH1.43/0.9823.2 × 26.021.25°S 55.71°E157AL68.42014/10/042019/12/0727
ALOS2LSPTHH1.43/0.9822.4 × 26.021.25°S 55.71°E158AL63.62014/08/282019/11/2824
ALOS2LSPTHH1.43/0.9821.1 × 26.021.25°S 55.71°E159AL57.72014/08/192019/12/0335
ALOS2LSPTHH1.43/0.9819.2 × 26.121.25°S 55.71°E160AL50.22014/08/242019/12/0829
ALOS2LSPTHH1.43/0.9716.2 × 26.221.25°S 55.74°E161AL40.42014/09/262019/12/1325
ALOS2LSPTHH1.43/0.9711.6 × 26.221.25°S 55.71°E162AL27.72014/09/032019/12/1420
ALOS2LSPTHH1.43/0.9715.4 × 26.321.25°S 55.71°E166AR30.92014/11/182017/01/102
ALOS2LSPTHH1.43/0.9718.0 × 26.321.25°S 55.71°E167AR46.12019/02/102019/12/154
ALOS2LSPTHH1.43/0.9820.4 × 26.321.25°S 55.71°E168AR54.62015/01/232019/12/0611
ALOS2LSPTHH1.43/0.9721.9 × 26.221.25°S 55.71°E169AR61.02015/01/142019/11/2719
ALOS2LSPTHH1.43/0.9722.9 × 26.221.25°S 55.71°E170AR66.22014/04/272019/12/0215
ALOS2LSM1HH1.43/1.9539.3 × 72.721.35°S 55.76°E59DR43.52015/01/242019/02/1613
ALOS2LSM1HH1.43/1.9230.8 × 72.721.19°S 55.64°E60DR31.52015/01/292018/02/226
ALOS2LSM1HH1.43/2.2334.0 × 72.721.09°S 55.78°E166AR35.22017/08/222018/04/172
RS2CSMQuad4.73/4.909.7 × 29,821.25°S 55.73°EQ2AR20.72014/06/142014/07/082
RS2CSMQuad4.73/4.8313.1 × 38,421.23°S 55.71°EQ8AR28.02009/08/202015/06/0220
RS2CSMQuad4.73/4.8019.9 × 29,721.26°S 55.75°EQ28DR46.92010/10/312015/02/0723
RS2CSMQuad4.73/4.9519.7 × 29,821.24°S 55.80°EQ27AR45.62010/10/292015/02/0517
S1CIWVH/VV2.32/14.06159.2 × 94.821.21°S 55.46°E151DR36.82014/10/162019/12/25128
S1CIWHH/HV2.33/14.06159.3 × 211.221.38°S 55.41°E144AR37.92017/10/232018/04/2113
S1CIWVH/VV2.33/14.06159.3 × 211.221.38°S 55.41°E144AR37.92014/10/152019/12/24116
S1CSMVH/VV2.66/4.1448.7 × 165.720.31°S 55.70°E151DR36.82015/05/082019/12/19124
S1CSMVH/VV3.19/4.1156.3 × 162.420.86°S 55.82°E144AR37.92015/05/072019/12/30135
CSKXSPTVV0.40/0.705.5 × 7.021.24°S 55.72°ES2-25DR52.42016/07/062017/07/257
CSKXSPTVV0.39/0.705.2 × 7.021.24°S 55.71°ES2-21AR48.82016/07/062017/07/258
CSKXSMHH1.17/2.0923.0 × 47.221.27°S 55.81°EH4-05DR34.42015/01/152015/01/232
CSKXSMVV1.17/2.0923.0 × 47.121.27°S 55.81°EH4-05DR34.42015/02/082015/02/092
CSKXSMVV1.33/2.2529.8 × 48.621.23°S 55.62°EH4-09AR39.72011/04/092012/03/1020
CSKXSMVV1.73/2.0924.9 × 45.621.22°S 55.66°EH4-18DR52.22011/02/152019/03/01107
CSKXSMVV1.63/2.2531.2 × 48.021.28°S 55.62°EH4-15AR48.52011/02/152018/11/25106
TSX/TDXXSPTVV0.45/0.844.9 × 5.021.26°S 55.72°E044DR37.02018/11/212019/09/0311
TSX/TDXXSPTVV0.45/0.855.0 × 5.321.23°S 55.73°E036AR33.42018/10/042019/11/2620
TSX/TDXXSM/MonoVV0.90/2.0719.7 × 42.721.25°S 55.64°E121DR37.02008/12/132019/12/1163
TSX/TDXXSM/MonoVV1.36/1.8619.8 × 42.721.25°S 55.72°E68AR33.42009/03/072019/12/07108
TSX/TDXXSM/BiVV0.90/2.0720.7 × 56.921.23°S 55.64°E121DR37.02011/06/032019/12/222 × 188
TSX/TDXXSM/BiVV1.36/1.8621.2 × 54.821.27°S 55.71°E68AR33.42011/09/062014/08/302 × 17
TSX/TDXXSM/Bi/DEMHH0.90/2.0720.7 × 56.9differ slightly121DR37.02011/08/302012/12/262 × 3
TSX/TDXXSM/Bi/DEMHH1.36/1.8621.2 × 54.8differ slightly68AR33.42013/01/242014/11/042 × 4
a ENVISAT = ENVISAT ASAR; RSAT1 = RADARSAT-1; ALOS1 = ALOS-1 PALSAR-1; TSX/TDX = TerraSAR-X/TanDEM-X; CSK = COSMO-SkyMed; RSAT2 = RADARSAT-2; S1 = Sentinel-1; ALOS2 = ALOS-2 PALSAR-2; b Acquisition Mode: SM = StripMap; SM/Mono = StripMap monostatic; SM/Bi = StripMap bistatic; SPT = SpotLight; IW = Interferometric Wide Swath; SM1 = StripMap 1 for ALOS2; c R = Range; A = Azimuth; d In case of ENVISAT ASAR, ISx yyy means swath ISx, track yyy; e LD = Look Direction; A = Ascending; D = Descending; R = Right; L = Left; f Look angle at Dolomieu Crater location, in decimal degrees.
Table 2. Overview of future SAR satellite missions.
Mission NameCountry/Space AgencyLaunch DateNumber of SatellitesWavelengthNotes
ICEYEFinlandICEYE-X1 launched January 201818 SAR microsatellitesX-band
PAZSpainlaunched January 20181X-bandOperated in constellation with Germany’s TerraSAR-X and TanDEM-X satellites
HRWS (High Resolution Wide Swath)Germany20231 active, 3 companionsX-band
COSMO-SkyMedItaly2018–20202X-band
RCM (RADARSAT Constellation Mission)Canadain phase of planning, uncertain launch date3C-bandCanada focused only
NISARUSA-Indianot before 31 January 20221L-band, S-bandLeft-looking;
free and open data policy
TanDEM-LGermany-Japanuncertain2L-band

