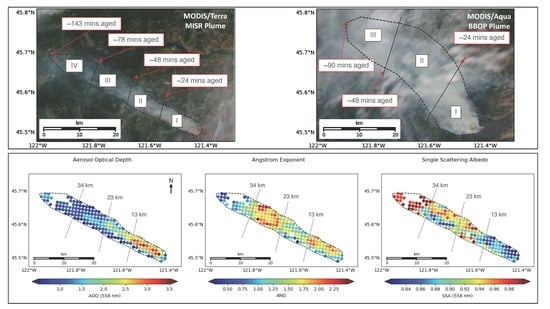
Wildfire Smoke Particle Properties and Evolution, from Space-Based Multi-Angle Imaging
Abstract
1. Introduction
2. Materials and Methods
2.1. Case Selection and Fire Properties
2.2. MISR
2.3. Aircraft Data
2.3.1. Aerosol Optical Properties
2.3.2. Aerosol Microphysical Properties
2.3.3. Air and Particle Chemistry
3. Results
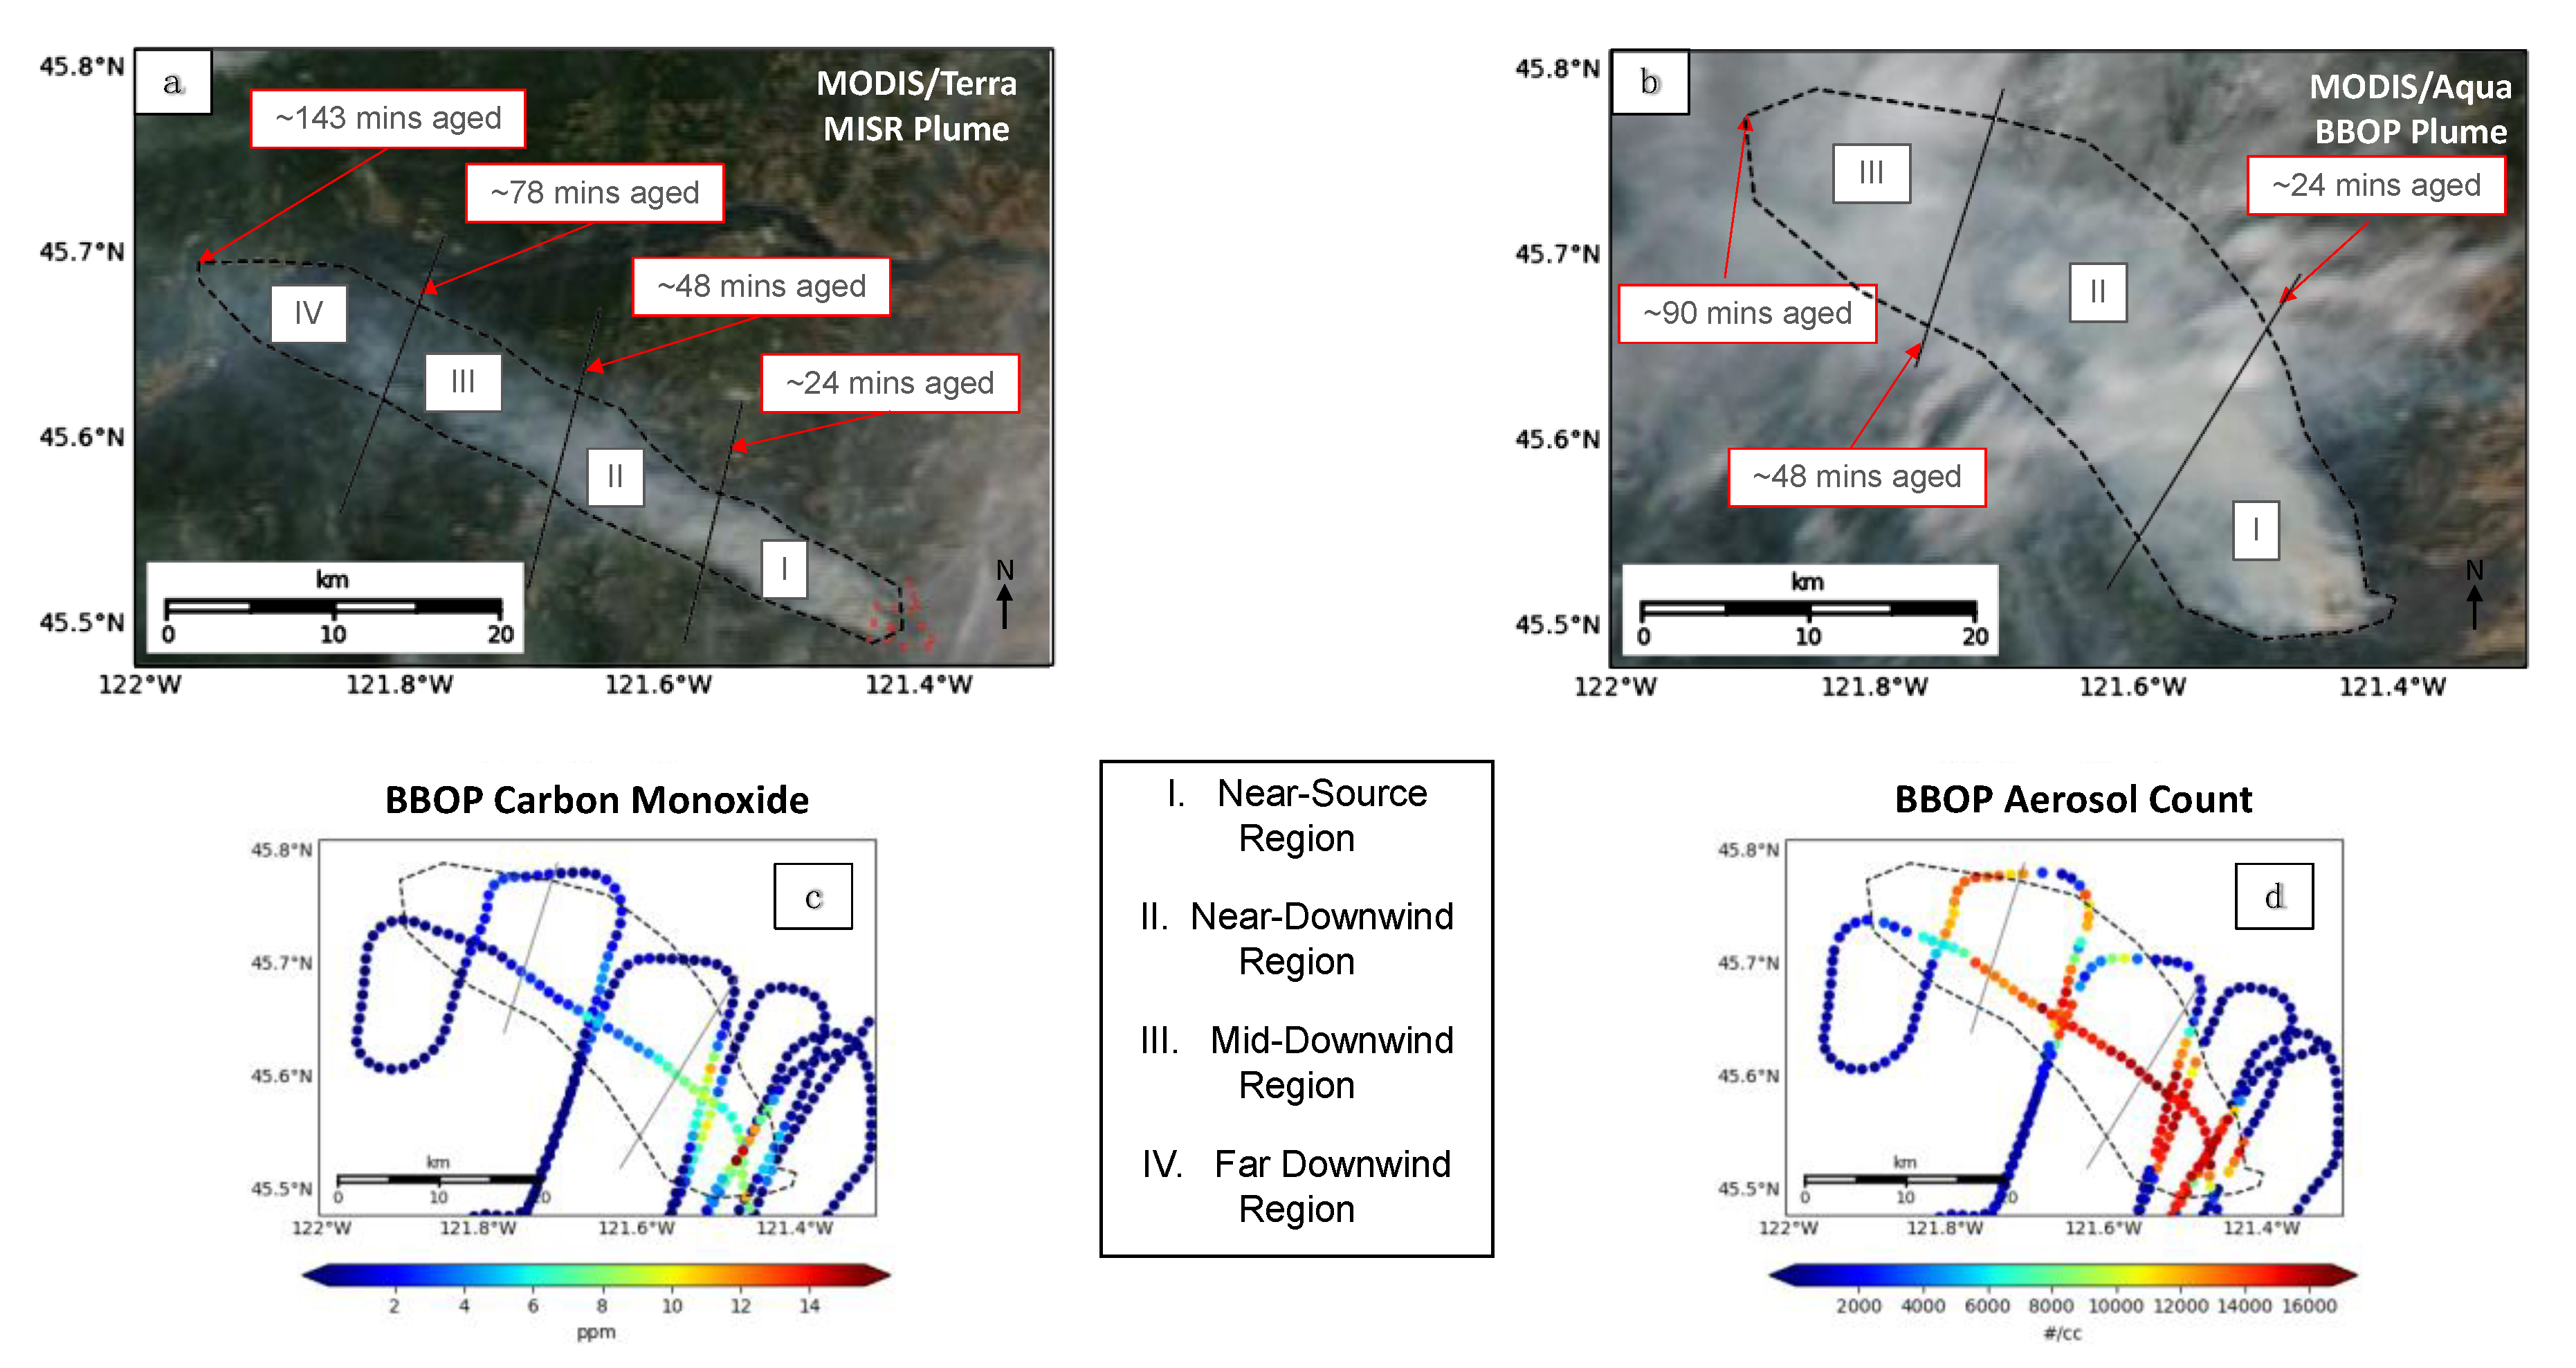
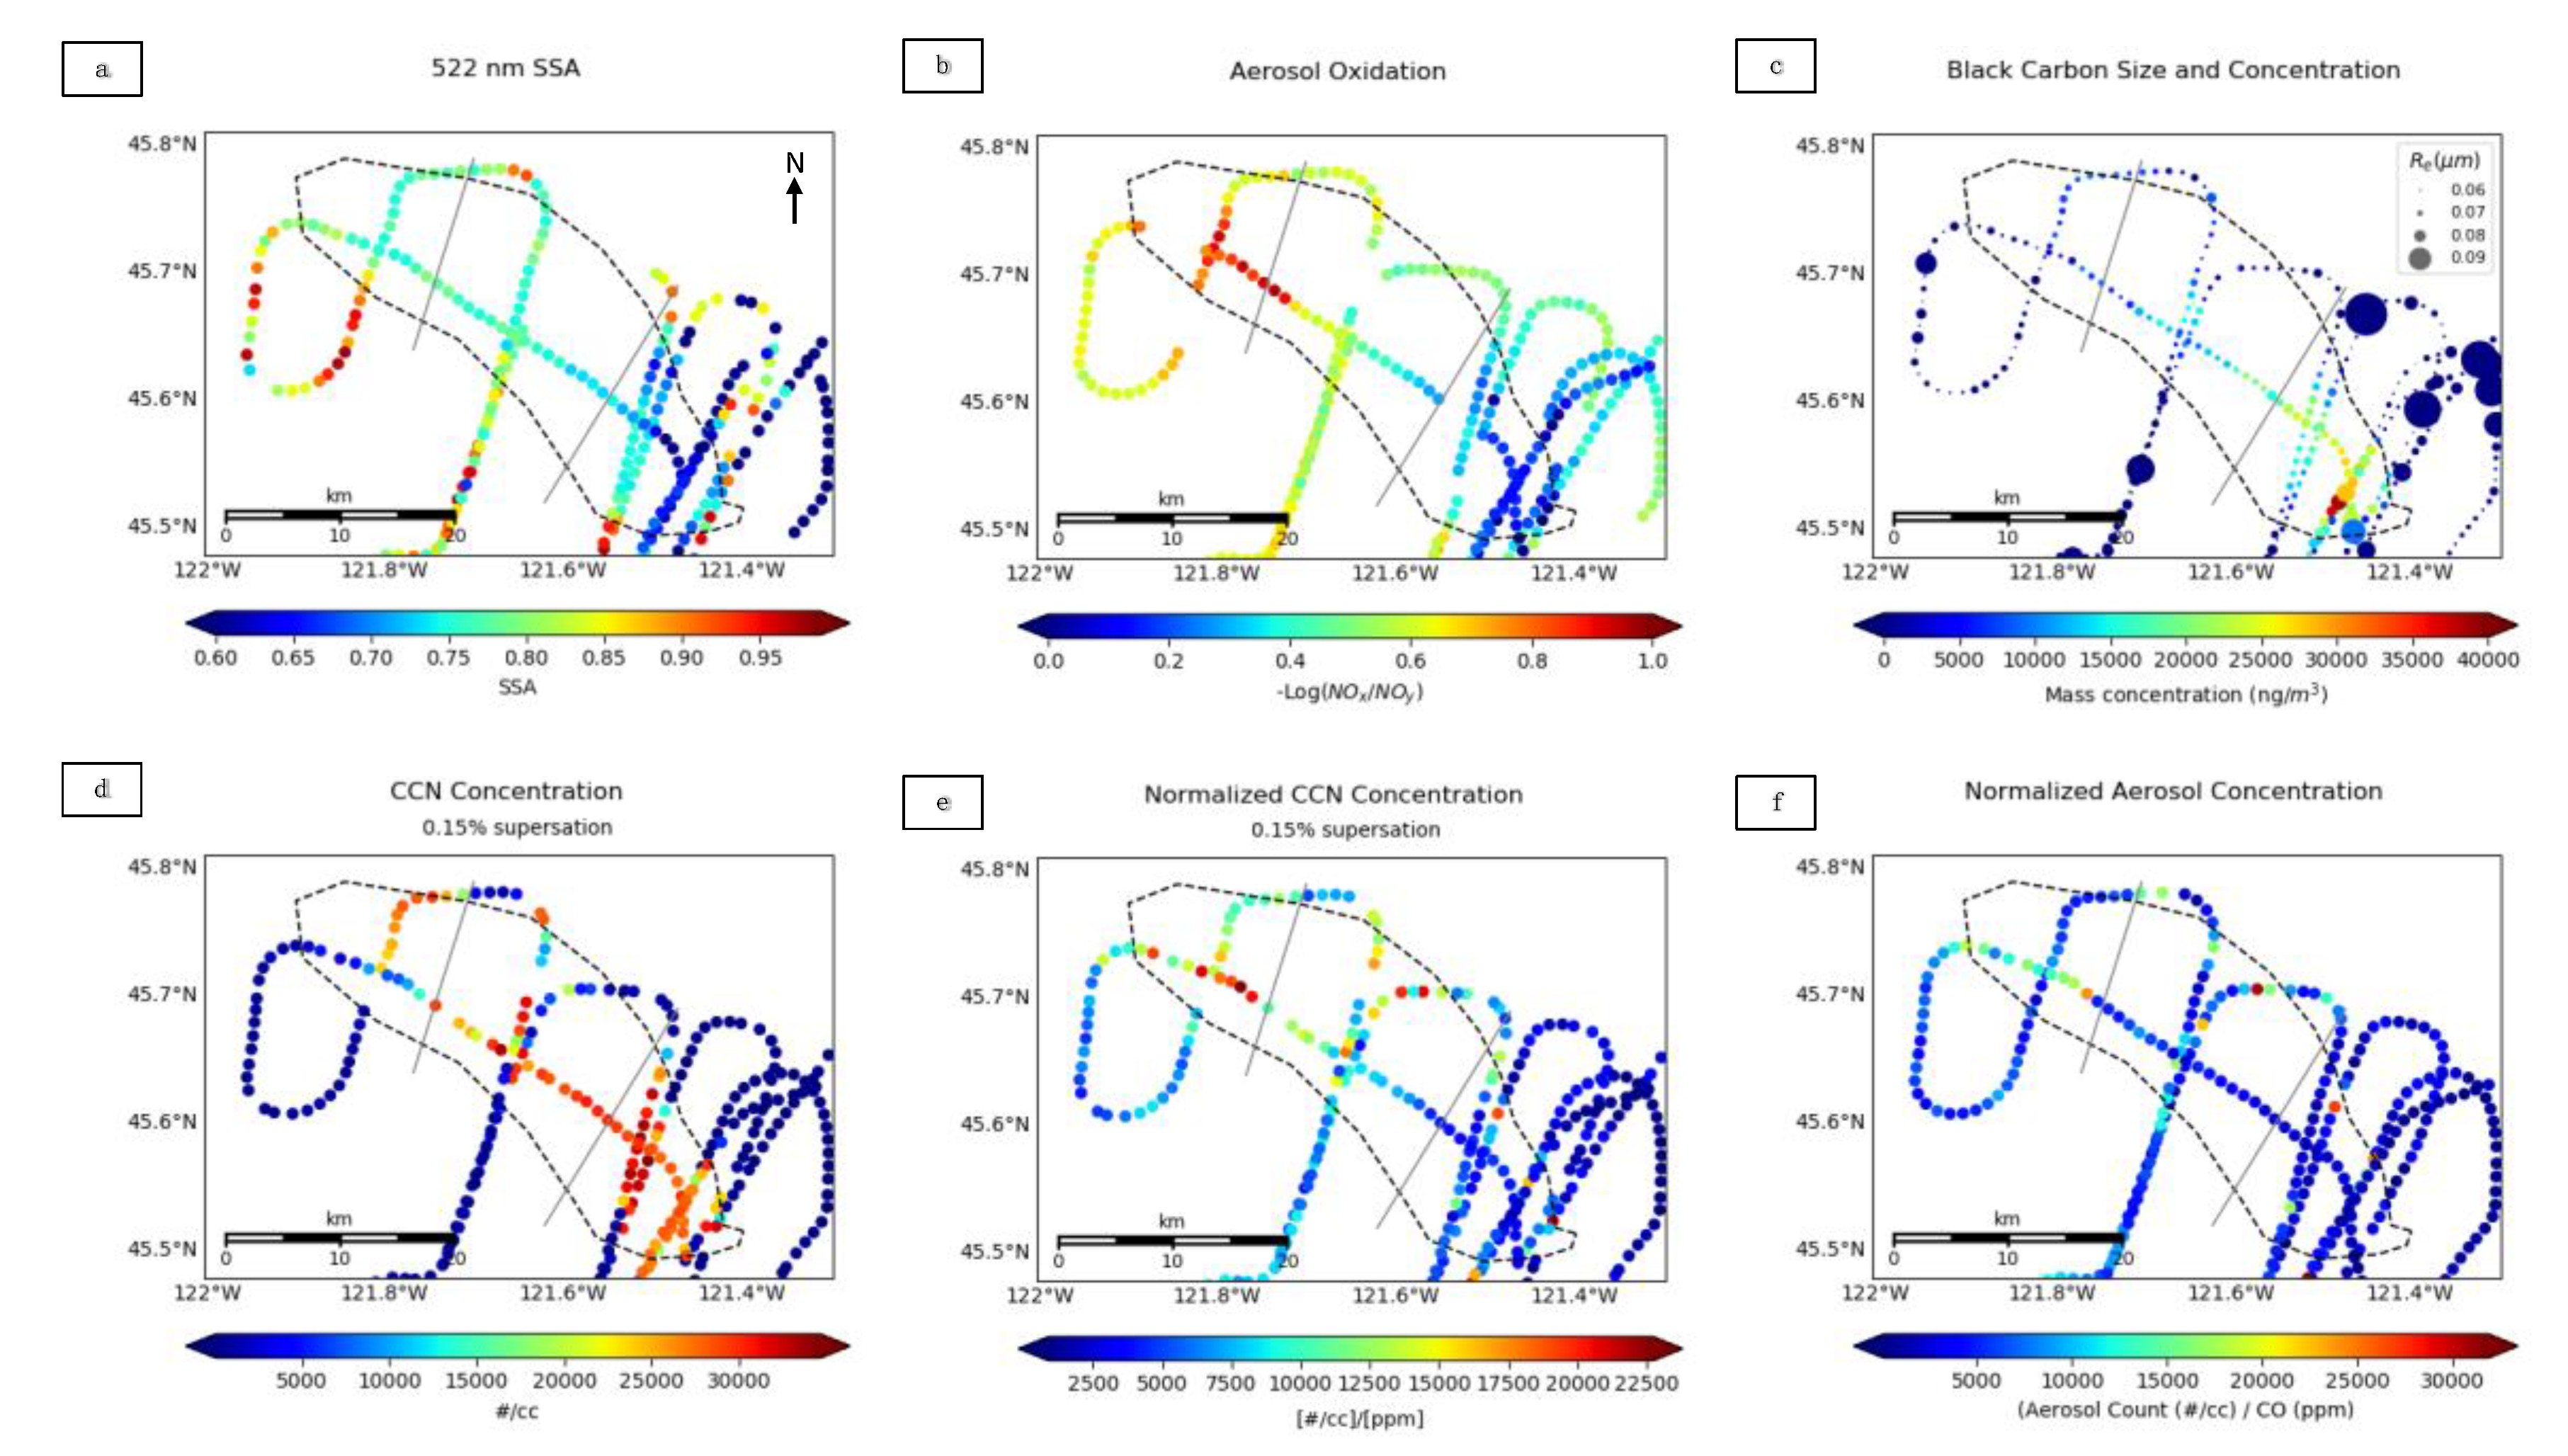
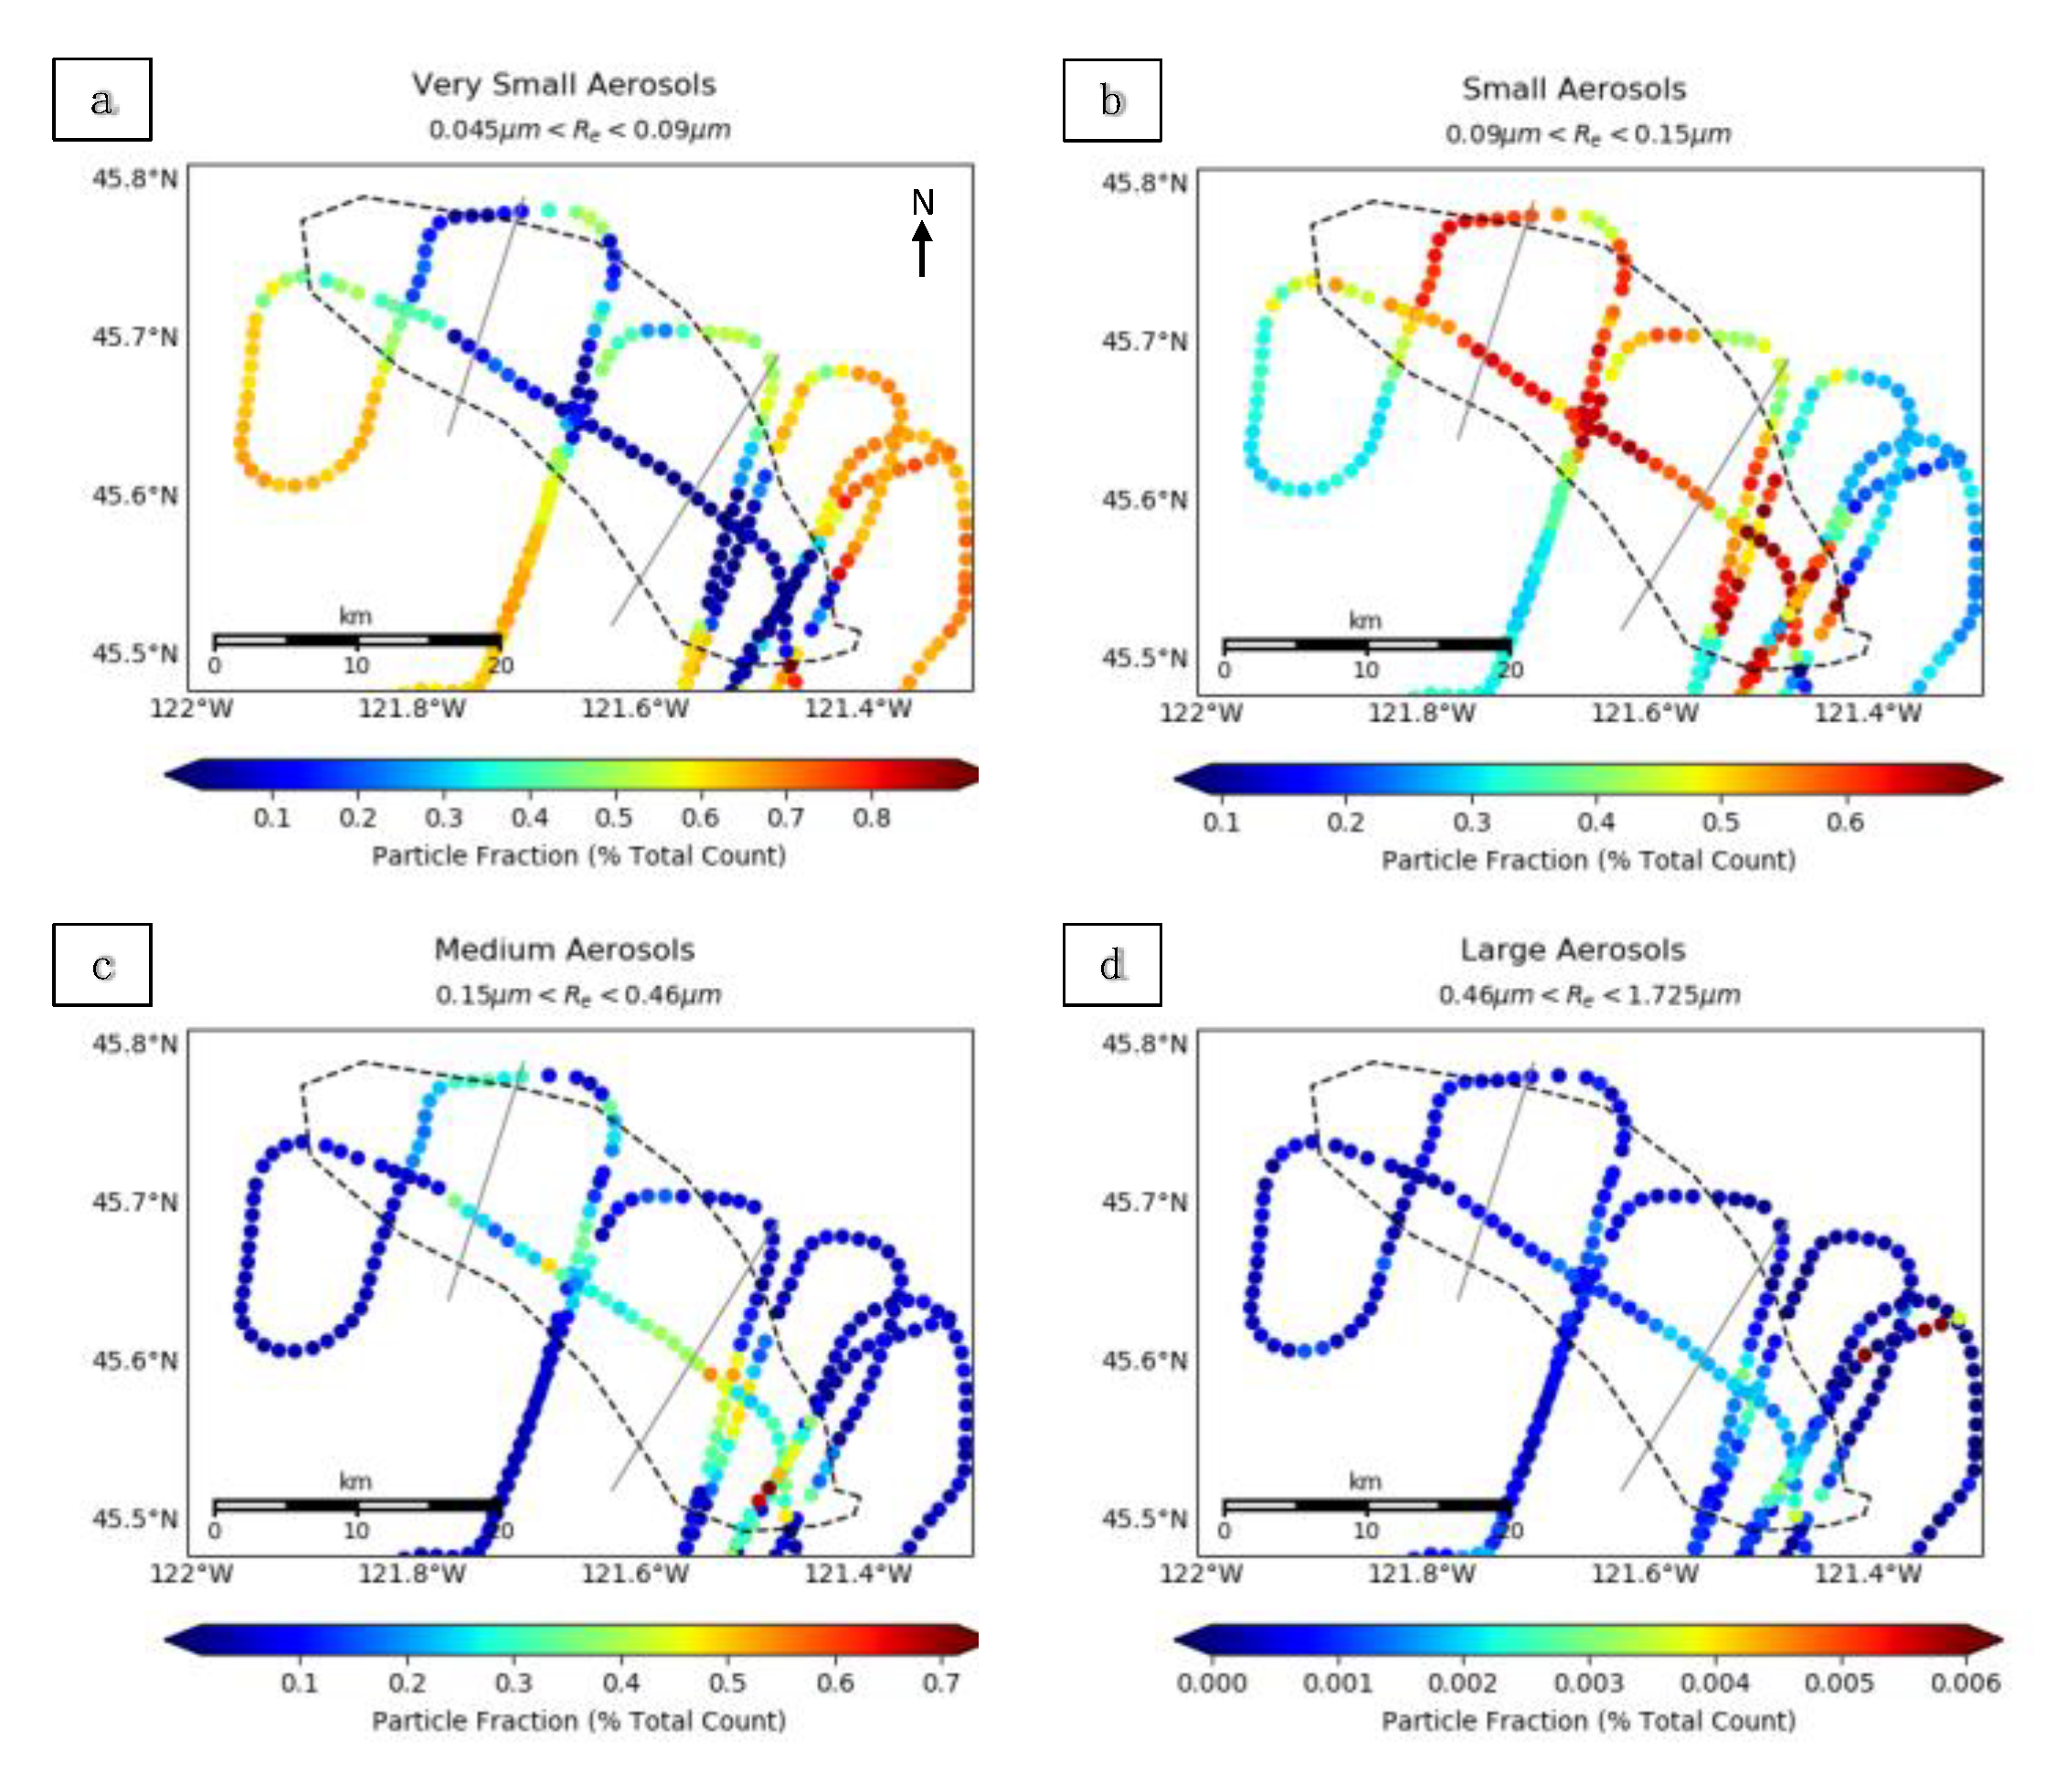
3.1. In Situ Observations: A First Look
3.2. Satellite Observations: Validation and Providing a Broader Context
3.3. Brief Summary of the Government Flats Smoke Plume Analysis
3.4. Secondary Comparisons: Using Non-Coincident RA and In Situ Observations
3.4.1. The Colockum Tarps Fire: Aircraft Observations Preceding Satellite Observations
3.4.2. The Douglas Complex Fire: Satellite Observations Preceding Aircraft Observations
4. Conclusions
Supplementary Materials
Author Contributions
Funding
Acknowledgments
Conflicts of Interest
References
- Colarco, P.R.; Schoeberl, M.R.; Doddridge, B.G.; Marufu, L.T.; Torres, O.; Welton, E.J. Transport of Smoke from Canadian Forest Fires to the Surface near Washington, D.C.: Injection Height, Entrainment, and Optical Properties. J. Geophys. Res. 2004, 109. [Google Scholar] [CrossRef]
- Kahn, R.A.; Chen, Y.; Nelson, D.L.; Leung, F.-Y.; Li, Q.; Diner, D.J.; Logan, J.A. Wildfire Smoke Injection Heights: Two Perspectives from Space. Geophys. Res. Lett. 2008, 35, L04809. [Google Scholar] [CrossRef]
- Warner, J.; Twomey, S. The Production of Cloud Nuclei by Cane Fires and the Effect on Cloud Droplet Concentration. J. Atmos. Sci. 1967, 24, 704–706. [Google Scholar] [CrossRef]
- Hobbs, P.V.; Radke, L.F. Cloud Condensation Nuclei from a Simulated Forest Fire. Science 1969, 163, 279–280. [Google Scholar] [CrossRef]
- Kaufman, Y.J.; Fraser, R.S. The Effect of Smoke Particles on Clouds and Climate Forcing. Science 1997, 277, 1636–1639. [Google Scholar] [CrossRef]
- Albrecht, B.A. Aerosols, Cloud Microphysics, and Fractional Cloudiness. Science 1989, 245, 1227–1230. [Google Scholar] [CrossRef]
- Dubovik, O.; Holben, B.; Eck, T.F.; Smirnov, A.; Kaufman, Y.J.; King, M.D.; Tanre, D.; Slutsker, I. Variability of Absorption and Optical Properties of Key Aerosol Types Observed in Worldwide Locations. J. Atmos. Sci. 2002, 59, 19. [Google Scholar] [CrossRef]
- Chen, W.-T.; Kahn, R.A.; Nelson, D.; Yau, K.; Seinfeld, J.H. Sensitivity of Multiangle Imaging to the Optical and Microphysical Properties of Biomass Burning Aerosols. J. Geophys. Res. 2008, 113, D10203. [Google Scholar] [CrossRef]
- Eck, T.F.; Holben, B.N.; Reid, J.S.; O’Neill, N.T.; Schafer, J.S.; Dubovik, O.; Smirnov, A.; Yamasoe, M.A.; Artaxo, P. High Aerosol Optical Depth Biomass Burning Events: A Comparison of Optical Properties for Different Source Regions. Geophys. Res. Lett. 2003, 30. [Google Scholar] [CrossRef]
- Shi, S.; Cheng, T.; Gu, X.; Guo, H.; Wu, Y.; Wang, Y. Biomass Burning Aerosol Characteristics for Different Vegetation Types in Different Aging Periods. Environ. Int. 2019, 126, 504–511. [Google Scholar] [CrossRef] [PubMed]
- Chakrabarty, R.K.; Moosmüller, H.; Chen, L.-W.A.; Lewis, K.; Arnott, W.P.; Mazzoleni, C.; Dubey, M.K.; Wold, C.E.; Hao, W.M.; Kreidenweis, S.M. Brown Carbon in Tar Balls from Smoldering Biomass Combustion. Atmos. Chem. Phys. 2010, 10, 6363–6370. [Google Scholar] [CrossRef]
- Chakrabarty, R.K.; Gyawali, M.; Yatavelli, R.L.N.; Pandey, A.; Watts, A.C.; Knue, J.; Chen, L.-W.A.; Pattison, R.R.; Tsibart, A.; Samburova, V.; et al. Brown Carbon Aerosols from Burning of Boreal Peatlands: Microphysical Properties, Emission Factors, and Implications for Direct Radiative Forcing. Atmos. Chem. Phys. 2016, 16, 3033–3040. [Google Scholar] [CrossRef]
- Petrenko, M.; Kahn, R.; Chin, M.; Soja, A.; Kucsera, T.; Harshvardhan. The Use of Satellite-Measured Aerosol Optical Depth to Constrain Biomass Burning Emissions Source Strength in the Global Model GOCART. J. Geophys. Res. 2012, 117. [Google Scholar] [CrossRef]
- Samset, B.H.; Stjern, C.W.; Andrews, E.; Kahn, R.A.; Myhre, G.; Schulz, M.; Schuster, G.L. Aerosol Absorption: Progress Towards Global and Regional Constraints. Curr. Clim. Chang. Rep. 2018, 4, 65–83. [Google Scholar] [CrossRef] [PubMed]
- Akagi, S.K.; Craven, J.S.; Taylor, J.W.; McMeeking, G.R.; Yokelson, R.J.; Burling, I.R.; Urbanski, S.P.; Wold, C.E.; Seinfeld, J.H.; Coe, H.; et al. Evolution of Trace Gases and Particles Emitted by a Chaparral Fire in California. Atmos. Chem. Phys. 2012, 12, 1397–1421. [Google Scholar] [CrossRef]
- Zhou, S.; Collier, S.; Jaffe, D.A.; Briggs, N.L.; Hee, J.; Sedlacek, A.J., III; Kleinman, L.; Onasch, T.B.; Zhang, Q. Regional Influence of Wildfires on Aerosol Chemistry in the Western US and Insights into Atmospheric Aging of Biomass Burning Organic Aerosol. Atmos. Chem. Phys. 2017, 17, 2477–2493. [Google Scholar] [CrossRef]
- Kleinman, L.I.; Sedlacek, A.J. Biomass Burning Observation Project Science Plan; DOE/SC-ARM; Brookhaven National Laboratory (BNL): Upton, NY, USA, 2013. [Google Scholar]
- Kleinman, L.I.; Sedlacek, A.J. Biomass Burning Observation Project (BBOP): Final Campaign Report; DOE ARM Climate Research Facility: Washington, DC, USA, 2016. [Google Scholar]
- Toon, O.B.; Maring, H.; Dibb, J.; Ferrare, R.; Jacob, D.J.; Jensen, E.J.; Luo, Z.J.; Mace, G.G.; Pan, L.L.; Pfister, L.; et al. Planning, Implementation, and Scientific Goals of the Studies of Emissions and Atmospheric Composition, Clouds and Climate Coupling by Regional Surveys (SEAC4RS) Field Mission. J. Geophys. Res. Atmos. 2016, 121, 4967–5009. [Google Scholar] [CrossRef]
- Forrister, H.; Liu, J.; Scheuer, E.; Dibb, J.; Ziemba, L.; Thornhill, K.L.; Anderson, B.; Diskin, G.; Perring, A.E.; Schwarz, J.P.; et al. Evolution of Brown Carbon in Wildfire Plumes. Geophys. Res. Lett. 2015, 42, 4623–4630. [Google Scholar] [CrossRef]
- Sedlacek, A.J., III; Buseck, P.R.; Adachi, K.; Onasch, T.B.; Springston, S.R.; Kleinman, L. Formation and Evolution of Tar Balls from Northwestern US Wildfires. Atmos. Chem. Phys. 2018, 18, 11289–11301. [Google Scholar] [CrossRef]
- Adachi, K.; Sedlacek, A.J.; Kleinman, L.; Springston, S.R.; Wang, J.; Chand, D.; Hubbe, J.M.; Shilling, J.E.; Onasch, T.B.; Kinase, T.; et al. Spherical Tarball Particles Form through Rapid Chemical and Physical Changes of Organic Matter in Biomass-Burning Smoke. Proc. Natl. Acad. Sci. USA 2019, 116, 19336–19341. [Google Scholar] [CrossRef]
- Feng, Y.; Ramanathan, V.; Kotamarthi, V.R. Brown Carbon: A Significant Atmospheric Absorber of Solar Radiation? Atmos. Chem. Phys. 2013, 13, 8607–8621. [Google Scholar] [CrossRef]
- Jethva, H.; Torres, O. Satellite-Based Evidence of Wavelength-Dependent Aerosol Absorption in Biomass Burning Smoke Inferred from Ozone Monitoring Instrument. Atmos. Chem. Phys. 2011, 11, 10541–10551. [Google Scholar] [CrossRef]
- Konovalov, I.B.; Beekmann, M.; Berezin, E.V.; Formenti, P.; Andreae, M.O. Probing into the Aging Dynamics of Biomass Burning Aerosol by Using Satellite Measurements of Aerosol Optical Depth and Carbon Monoxide. Atmos. Chem. Phys. 2017, 17, 4513–4537. [Google Scholar] [CrossRef]
- Kahn, R.A. A global perspective on wildfires. EOS Am. Geophys. Union 2020, 101. [Google Scholar] [CrossRef]
- Nelson, D.; Garay, M.; Kahn, R.; Dunst, B. Stereoscopic Height and Wind Retrievals for Aerosol Plumes with the MISR INteractive EXplorer (MINX). Remote Sens. 2013, 5, 4593–4628. [Google Scholar] [CrossRef]
- Limbacher, J.A.; Kahn, R.A. MISR Research-Aerosol-Algorithm Refinements for Dark Water Retrievals. Atmos. Meas. Technol. 2014, 7, 3989–4007. [Google Scholar] [CrossRef]
- Limbacher, J.A.; Kahn, R.A. Updated MISR Over-Water Research Aerosol Retrieval Algorithm—Part 2: A Multi-Angle Aerosol Retrieval Algorithm for Shallow, Turbid, Oligotrophic, and Eutrophic Waters. Atmos. Meas. Technol. 2019, 12, 675–689. [Google Scholar] [CrossRef]
- Kahn, R.A.; Limbacher, J. Eyjafjallajökull Volcano Plume Particle-Type Characterization from Space-Based Multi-Angle Imaging. Atmos. Chem. Phys. 2012, 12, 9459–9477. [Google Scholar] [CrossRef]
- Scollo, S.; Kahn, R.A.; Nelson, D.L.; Coltelli, M.; Diner, D.J.; Garay, M.J.; Realmuto, V.J. MISR Observations of Etna Volcanic Plumes. J. Geophys. Res. 2012, 117. [Google Scholar] [CrossRef]
- Flower, V.J.B.; Kahn, R.A. Distinguishing Remobilized Ash From Erupted Volcanic Plumes Using Space-Borne Multiangle Imaging: Remobilized Ash Plumes. Geophys. Res. Lett. 2017, 44, 10772–10779. [Google Scholar] [CrossRef]
- Flower, V.J.B.; Kahn, R.A. Karymsky Volcano Eruptive Plume Properties Based on MISR Multi-Angle Imagery and the Volcanological Implications. Atmos. Chem. Phys. 2018, 18, 3903–3918. [Google Scholar] [CrossRef] [PubMed]
- Flower, V.J.B.; Kahn, R.A. Interpreting the Volcanological Processes of Kamchatka, Based on Multi-Sensor Satellite Observations. Remote Sens. Environ. 2020, 237, 111585. [Google Scholar] [CrossRef]
- Kahn, R.A.; Gaitley, B.J. An Analysis of Global Aerosol Type as Retrieved by MISR: MISR Aerosol Type. J. Geophys. Res. Atmos. 2015, 120, 4248–4281. [Google Scholar] [CrossRef]
- Diner, D.J.; Beckert, J.C.; Reilly, T.H.; Bruegge, C.J.; Conel, J.E.; Kahn, R.A.; Martonchik, J.V.; Ackerman, T.P.; Davies, R.; Gerstl, S.A.W.; et al. Multi-Angle Imaging SpectroRadiometer (MISR) Instrument Description and Experiment Overview. IEEE Trans. 1998, 36, 1072–1087. [Google Scholar] [CrossRef]
- Nelson, D.L.; Chen, Y.; Kahn, R.A.; Diner, D.J.; Mazzoni, D. Example Applications of the MISR INteractive EXplorer (MINX) Software Tool to Wildfire Smoke Plume Analyses. Remote Sens. Fire Sci. Appl. 2008, 708909. [Google Scholar] [CrossRef]
- Val Martin, M.; Logan, J.A.; Kahn, R.A. Smoke Injection Heights from Fires in North America: Analysis of 5 Years of Satellite Observations. Atmos. Chem. Phys. 2010, 10, 1491–1510. [Google Scholar] [CrossRef]
- Val Martin, M.; Kahn, R.; Tosca, M. A Global Analysis of Wildfire Smoke Injection Heights Derived from Space-Based Multi-Angle Imaging. Remote Sens. 2018, 10, 1609. [Google Scholar] [CrossRef]
- Tosca, M.G.; Randerson, J.T.; Zender, C.S.; Nelson, D.L.; Diner, D.J.; Logan, J.A. Dynamics of Fire Plumes and Smoke Clouds Associated with Peat and Deforestation Fires in Indonesia. J. Geophys. Res. 2011, 116, D08207. [Google Scholar] [CrossRef]
- Flower, V.J.B.; Kahn, R.A. Assessing the Altitude and Dispersion of Volcanic Plumes Using MISR Multi-Angle Imaging from Space: Sixteen Years of Volcanic Activity in the Kamchatka Peninsula, Russia. J. Volcanal. Geoth. Res. 2017, 337, 1–15. [Google Scholar] [CrossRef]
- Yu, Y.; Kalashnikova, O.V.; Garay, M.J.; Lee, H.; Notaro, M. Identification and Characterization of Dust Source Regions Across North Africa and the Middle East Using MISR Satellite Observations. Geophys. Res. Lett. 2018, 45, 6690–6701. [Google Scholar] [CrossRef]
- Vernon, C.J.; Bolt, R.; Canty, T.; Kahn, R.A. The Impact of MISR-Derived Injection Height Initialization on Wildfire and Volcanic Plume Dispersion in the HYSPLIT Model. Atmos. Meas. Technol. 2018, 11, 6289–6307. [Google Scholar] [CrossRef]
- Kahn, R.A.; Gaitley, B.J.; Garay, M.J.; Diner, D.J.; Eck, T.; Smirnov, A.; Holben, B.N. Multiangle Imaging SpectroRadiometer global aerosol product assessment by comparison with the Aerosol Robotic Network. J. Geophys. Res. 2010, 115, D23209. [Google Scholar] [CrossRef]
- Lee, J.; Hsu, N.C.; Sayer, A.M.; Bettenhausen, C.; Yang, P. AERONET-Based Nonspherical Dust Optical Models and Effects on the VIIRS Deep Blue/SOAR Over Water Aerosol Product: Dust Optical Models for Deep Blue/SOAR. J. Geophys. Res. Atmos. 2017, 122, 10384–10401. [Google Scholar] [CrossRef] [PubMed]
- Andreae, M.O.; Gelencser, A. Black Carbon or Brown Carbon? The Nature of Light-Absorbing Carbonaceous Aerosols. Atmos. Chem. Phys. 2006, 18, 3419–3463. [Google Scholar] [CrossRef]
- Lyapustin, A.; Wang, Y. MODIS Multi-Angle Implementation of Atmospheric Correction (MAIAC) Data User’s Guide; NASA: Greenbelt, MD, USA, 2018. [Google Scholar]
- Chand, D.; Schmid, B. Nephelometer PSAP, BBOP. Atmospheric Radiation Measurement Climate Research Facility. 2015. Available online: https://www.osti.gov/biblio/1461871-nephelometer-psap-bbop (accessed on 30 January 2020). [CrossRef]
- Anderson, T.L.; Ogren, J.A. Determining Aerosol Radiative Properties Using the TSI 3563 Integrating Nephelometer. Aerosol Sci. Technol. 1998, 29, 57–69. [Google Scholar] [CrossRef]
- Bond, T.C.; Anderson, T.L.; Campbell, D. Calibration and Intercomparison of Filter-Based Measurements of Visible Light Absorption by Aerosols. Aerosol Sci. Technol. 1999, 30, 582–600. [Google Scholar] [CrossRef]
- Ogren, J.A. Comment on “Calibration and Intercomparison of Filter-Based Measurements of Visible Light Absorption by Aerosols”. Aerosol Sci. Technol. 2010, 44, 589–591. [Google Scholar] [CrossRef]
- Springston, S.R. Particle Soot Absorption Photometer (PSAP) Instrument Handbook; DOE ARM Climate Research Facility: Washington, DC, USA, 2018. [Google Scholar]
- Arnott, W.P. PAS, BBOP. Atmospheric Radiation Measurement Climate Research Facility. 2013. Available online: https://adc.arm.gov/discovery/#v/results/s/s::bbop (accessed on 20 December 2019).
- Sedlacek, A.; Lee, J. Photothermal Interferometric Aerosol Absorption Spectrometry. Aerosol Sci. Technol. 2007, 41, 1089–1101. [Google Scholar] [CrossRef]
- Reid, J.S.; Koppmann, R.; Eck, T.F.; Eleuterio, D.P. A Review of Biomass Burning Emissions Part II: Intensive Physical Properties of Biomass Burning Particles. Atmos. Chem. Phys. 2005, 28, 799–825. [Google Scholar] [CrossRef]
- Uin, J. Cloud Condensation Nuclei Particle Counter Instrument Handbook; DOE ARM Climate Research Facility: Washington, DC, USA, 2016. [Google Scholar]
- Mei, F. AAF-CCN, BBOP. Atmospheric Radiation Measurement Climate Research Facility. 2013. Available online: https://adc.arm.gov/discovery/#v/results/s/s::bbop (accessed on 20 September 2019).
- Yokelson, R.J.; Crounse, J.D.; DeCarlo, P.F.; Karl, T.; Urbanski, S.; Atlas, E.; Campos, T.; Shinozuka, Y.; Kapustin, V.; Clarke, A.D.; et al. Emissions from Biomass Burning in the Yucatan. Atmos. Chem. Phys. 2009, 28, 5785. [Google Scholar] [CrossRef]
- Kleinman, L.I.; Springston, S.R.; Daum, P.H.; Weinstein-Lloyd, J.; Alexander, M.L.; Hubbe, J.; Ortega, J.; Canagaratna, M.R.; Jayne, J. The Time Evolution of Aerosol Composition over the Mexico City Plateau. Atmos. Chem. Phys. 2008, 17, 14461–14509. [Google Scholar] [CrossRef]
- DeCarlo, P.F.; Dunlea, E.J.; Kimmel, J.R.; Aiken, A.C.; Sueper, D.; Crounse, J.; Wennberg, P.O.; Emmons, L.; Shinozuka, Y.; Clarke, A.; et al. Fast Airborne Aerosol Size and Chemistry Measurements above Mexico City and Central Mexico during the MILAGRO Campaign. Atmos. Chem. Phys. 2008, 8, 4027–4048. [Google Scholar] [CrossRef]
- Sedlacek, A.J. Single Particle Soot Photometers (SP2) Instrument Handbook; DOE ARM Climate Research Facility: Washington, DC, USA, 2017. [Google Scholar]
- Sedlacek, A.J.; Lewis, E.R.; Kleinman, L.; Xu, J.; Zhang, Q. Determination of and Evidence for Non-Core-Shell Structure of Particles Containing Black Carbon Using the Single-Particle Soot Photometer (SP2). Geophys. Res. Lett. 2012, 39. [Google Scholar] [CrossRef]
- Oregon Department of Forestry: Fires List. Available online: https://apps.odf.oregon.gov/DIVISIONS/protection/fire_protection/fires/FIRESlist.asp (accessed on 28 December 2019).
- National Fire and Aviation Management: Incident Status Summary. Available online: https://fam.nwcg.gov/fam-web/hist_209/hist_r_print_209_head_2013?v_number=WA-SES-349&v_report_date=08/18/2013&v_hour=1200&v_gaid=NW (accessed on 28 December 2019).
- Hodshire, A.L.; Bian, Q.; Ramnarine, E.; Lonsdale, C.R.; Alvarado, M.J.; Kreidenweis, S.M.; Jathar, S.H.; Pierce, J.R. More than emissions and chemistry: Fire size, dilution, and background aerosol also greatly influence near-field biomass burning aerosol aging. J. Geophys. Res. Atmos. 2019, 124, 5589–5611. [Google Scholar] [CrossRef]
- Konovalov, I.B.; Beekmann, M.; Golovushkin, N.A.; Andreae, M.O. Nonlinear behavior of organic aerosol in biomass burning plumes: A microphysical model analysis. Atmos. Chem. Phys. 2019, 19, 12091–12119. [Google Scholar] [CrossRef]
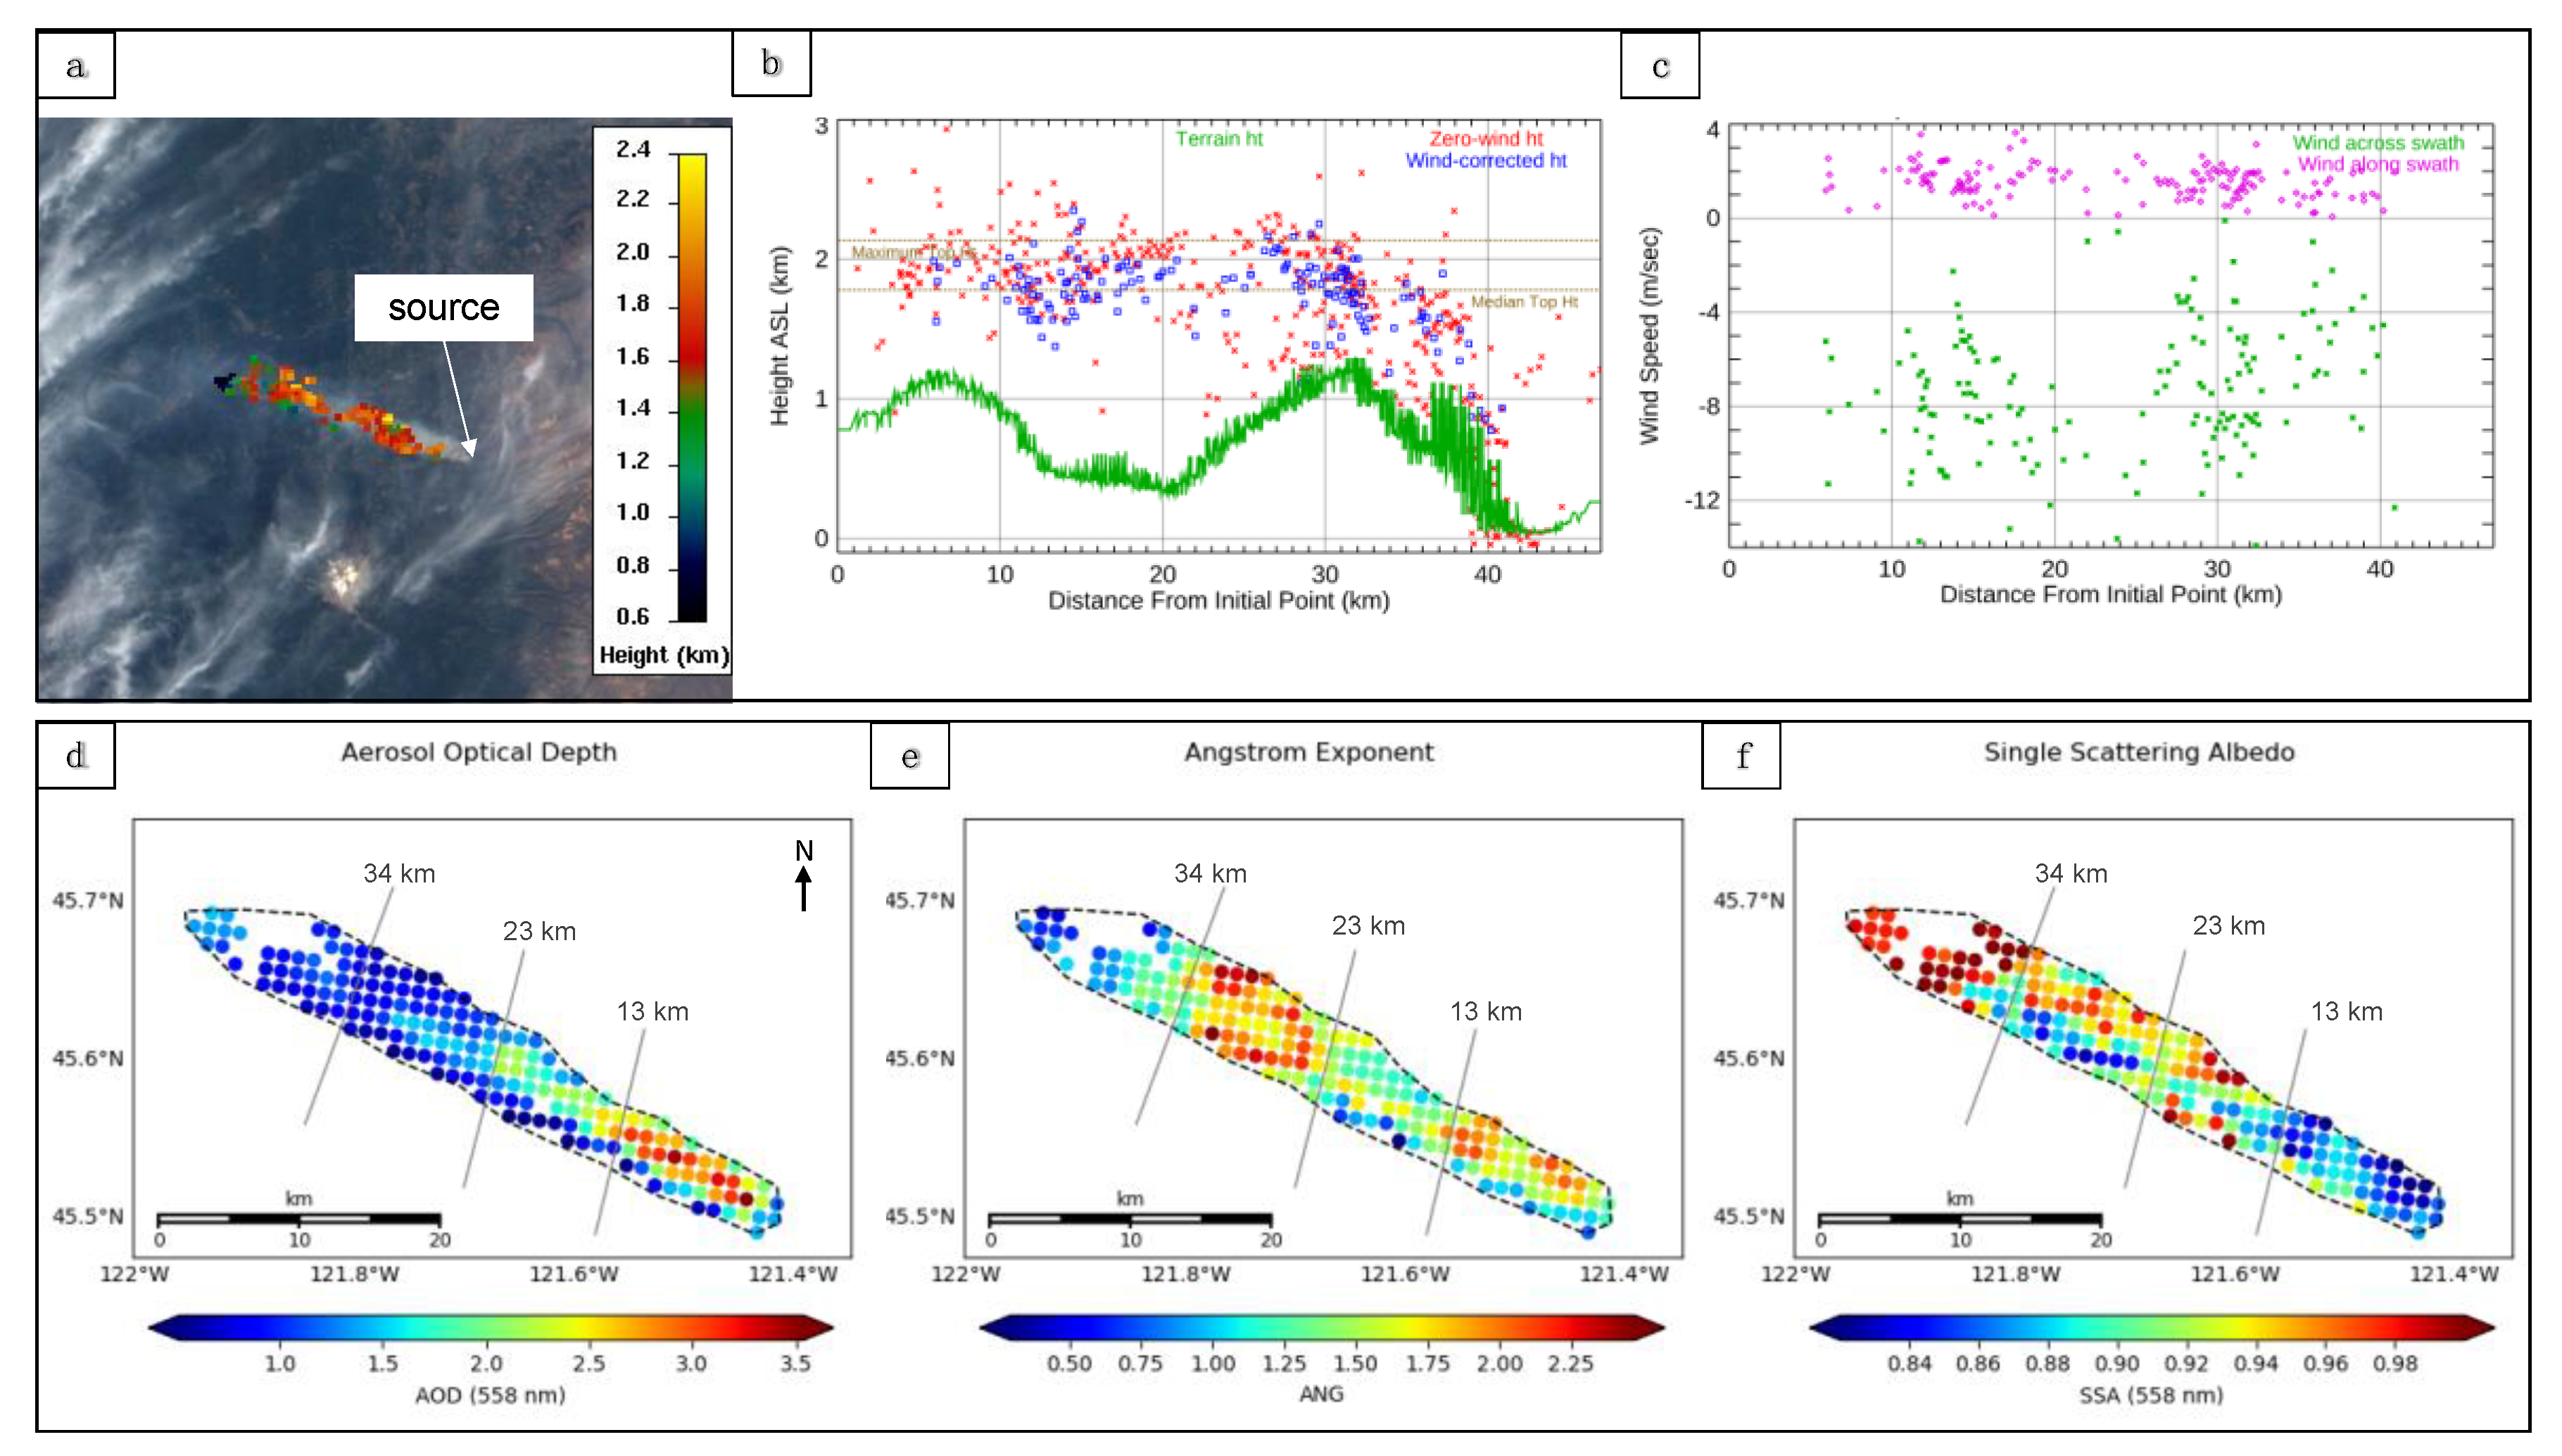
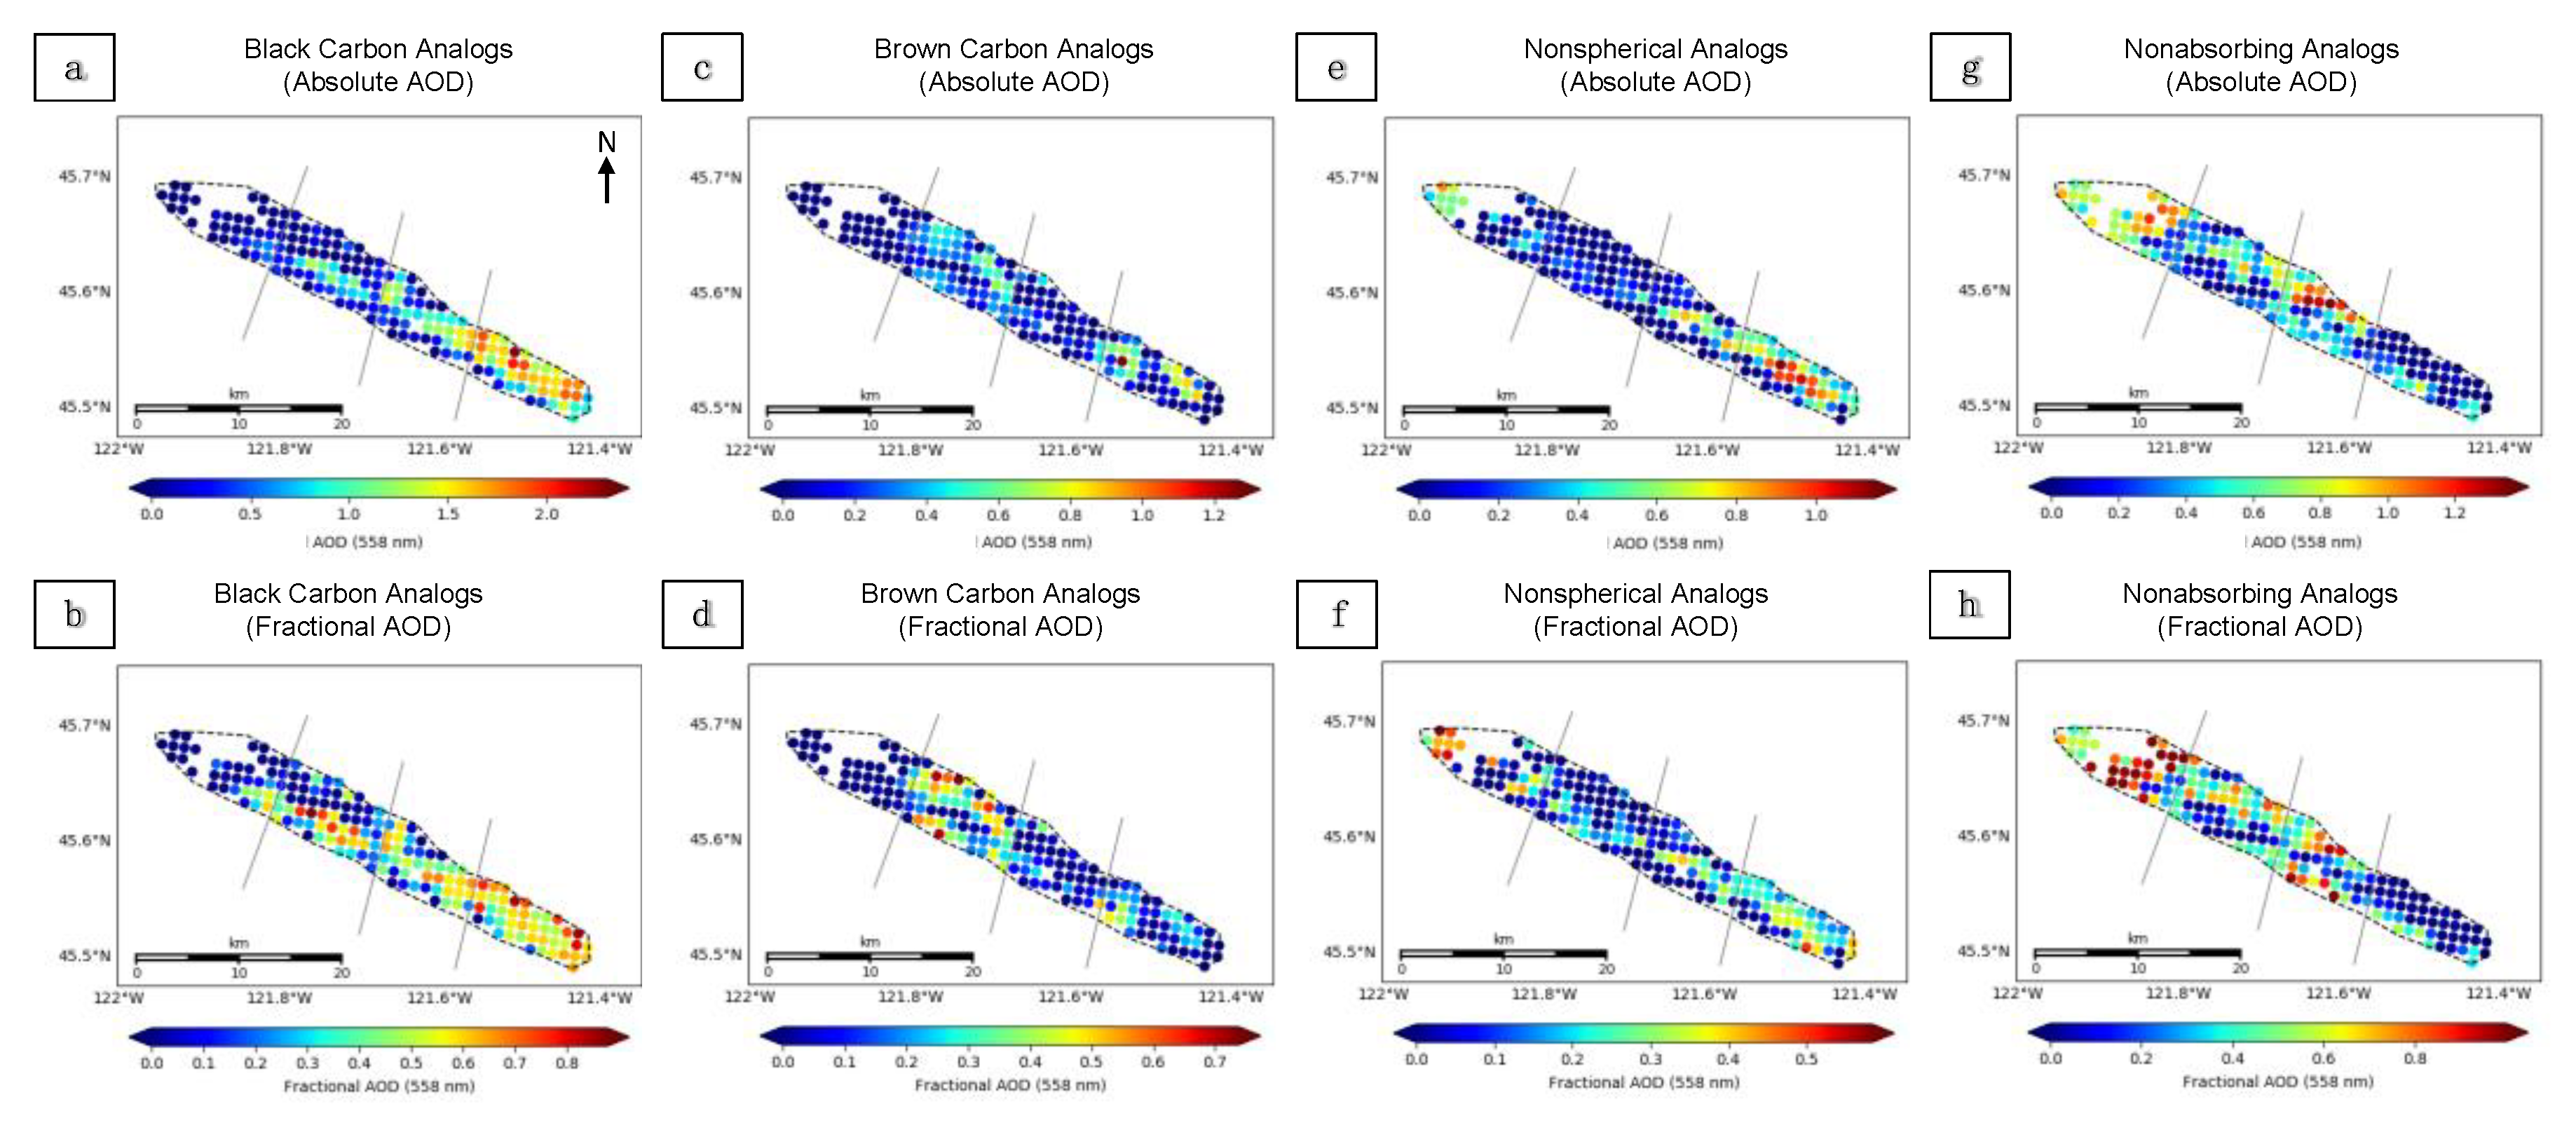
| Aircraft Observations | MISR Observations | ||||||
|---|---|---|---|---|---|---|---|
| Fire Identifier | Date (UTC) | Start Time–End Time (UTC) a | Location | Date (UTC) | Orbit; Block (s) | Time (UTC) | Approximate Delay (h) |
| Colockum Tarps | 26/7/13 | 20:00–22:20 | Southern central WA | 7/27/13 | 72382; 53–54 | 19:13 | +23 |
| Douglas Complex | 06/8/13 | 19:30–21:00 | Southern coastal OR | 8/5/13 | 72513; 56 | 19:08 | −23 |
| Government Flats | 21/8/13 | 21:20–22:30 | Northern central OR | 8/21/13 | 72746; 54 | 19:07 | −2 |
| Particle Size, Shape, Absorption | re (µm)a | SSA (446) | SSA (558) | SSA (672) | SSA (866) | Code b |
|---|---|---|---|---|---|---|
| Very small, spherical, strongly absorbing (flat) | 0.06 | 0.84 | 0.79 | 0.73 | 0.62 | VSmSphSab(f) |
| Very small, spherical, strongly absorbing (steep) | 0.06 | 0.76 | 0.80 | 0.83 | 0.76 | VSmSphSab(s) |
| Very small, spherical, moderately absorbing (flat) | 0.06 | 0.92 | 0.89 | 0.86 | 0.78 | VSmSphMab(f) |
| Very small, spherical, moderately absorbing (steep) | 0.06 | 0.88 | 0.90 | 0.90 | 0.87 | VSmSphMab(s) |
| Small, spherical, strongly absorbing (flat) | 0.12 | 0.81 | 0.79 | 0.78 | 0.74 | SmSphSab(f) |
| Small, spherical, strongly absorbing (steep) | 0.12 | 0.72 | 0.80 | 0.87 | 0.84 | SmSphSab(s) |
| Small, spherical, moderately absorbing (flat) | 0.12 | 0.90 | 0.89 | 0.88 | 0.85 | SmSphMab(f) |
| Small, spherical, moderately absorbing (steep) | 0.12 | 0.85 | 0.90 | 0.93 | 0.92 | SmSphMab(s) |
| Medium, spherical, strongly absorbing (flat) | 0.26 | 0.78 | 0.80 | 0.80 | 0.81 | MeSphSab(f) |
| Medium, spherical, strongly absorbing (steep) | 0.26 | 0.70 | 0.80 | 0.88 | 0.89 | MeSphSab(s) |
| Medium, spherical, moderately absorbing (flat) | 0.26 | 0.89 | 0.90 | 0.90 | 0.90 | MeSphMab(f) |
| Medium, spherical, moderately absorbing (steep) | 0.26 | 0.83 | 0.90 | 0.94 | 0.94 | MeSphMab(s) |
| Very small, spherical, non-absorbing | 0.06 | 1.0 | 1.0 | 1.0 | 1.0 | VSmSphNab |
| Small, spherical, non-absorbing | 0.12 | 1.0 | 1.0 | 1.0 | 1.0 | SmSphNab |
| Medium, spherical, non-absorbing | 0.26 | 1.0 | 1.0 | 1.0 | 1.0 | MeSphNab |
| Large, spherical, weakly absorbing | 1.28 | 1.0 | 1.0 | 1.0 | 1.0 | LaSphNab |
| Large, non-spherical, weakly absorbing | 1.21 | 0.91 | 0.95 | 0.97 | 0.98 | LaNsphWab |
| Size Category | Size Range (Re, µm) | Comparable RA Components | Instruments Used a |
|---|---|---|---|
| Very small | 0.045–0.09 | VSmSphSab(f), VSmSphSab(s), VSmSphMab(f), VSmSphMab(s), VSmSphNab | PCASP |
| Small | 0.09–0.15 | SmSphSab(f), SmSphSab(s), SmSphMab(f), SmSphMab(s), SmSphNab | PCASP |
| Medium | 0.15–0.46 | MeSphSab(f), MeSphMab(f), MeSphSab(s), MeSphMab(s), MeSphNab | PCASP |
| Large | 0.46–1.725 | LaSphNab, LaNsphWab | PCASP, CAS |
| Plume Region: | Near-Source (I) | Near-Downwind (II) | Mid-Downwind (III) | |
|---|---|---|---|---|
| Very small aerosols a | mean ± σ | 0.1250 ± 0.1712 | 0.1904 ± 0.1626 | 0.2935 ± 0.1573 |
| median | 0.03893 | 0.1121 | 0.3473 | |
| Small aerosols a | mean ± σ | 0.5662 ± 0.1124 | 0.5930 ± 0.07029 | 0.5609 ± 0.1124 |
| median | 0.5962 | 0.6096 | 0.5612 | |
| Medium aerosols a | mean ± σ | 0.3072 ± 0.1534 | 0.2157 ± 0.1144 | 0.1452 ± 0.09571 |
| median | 0.3072 | 0.2383 | 0.09315 | |
| Large aerosols a | mean ± σ | 0.001549 ± 0.0007137 | 0.0008949 ± 0.0004193 | 0.0004482 ± 0.0002103 |
| median | 0.001502 | 0.0008090 | 0.0004333 | |
| SSA522 b | mean ± σ | 0.7001 ± 0.07297 | 0.7679 ± 0.030083 | 0.7814 ± 0.03647 |
| median | 0.7029 | 0.7605 | 0.7748 | |
| Oxidation c | mean ± σ | 0.2018 ± 0.1447 | 0.5307 ± 0.1400 | 0.7855 ± 0.1115 |
| median | 0.2037 | 0.5318 | 0.8026 | |
| rBC mass d | mean ± σ | 16,383.15 ± 8494.77 | 8638.98 ± 5765.73 | 4805.65 ± 3553.27 |
| median | 17,437.12 | 8164.26 | 4036.97 | |
| rBC mass normalized by CO e | mean ± σ | 8328.4 ± 15,678 | 5973.7 ± 10,509 | 4528.1 ± 4298.5 |
| median | 2812.2 | 3388.7 | 3416.7 | |
| Re(BC) f | mean ± σ | 0.070 ± 0.0064 | 0.065 ± 0.0049 | 0.064 ± 0.0060 |
| median | 0.070 | 0.065 | 0.065 | |
| CCN15 g | mean ± σ | 24,273.13 ± 9852.24 | 19,976.24 ± 11,071.74 | 15,497.54 ± 10,310.76 |
| median | 27,578.10 | 24,810.73 | 12,212.83 | |
| CCN15 normalized by CO h | mean ± σ | 5710.84 ± 3566.64 | 10,657.30 ± 4390.24 | 14,829.78 ± 4112.40 |
| median | 4716.05 | 9408.83 | 13,340.70 | |
| Aerosol count normalized by CO i | mean ± σ | 3844.60 ± 4960.87 | 7048.10 ± 5861.56 | 9465.11 ± 5191.19 |
| median | 2328.85 | 5015.14 | 7451.74 | |
| BrC absorption normalized by CO j | mean | 172.39 | 216.97 | 207.14 |
| median | 163.66 | 210.10 | 217.69 | |
| 355-nm scattering normalized by CO k | mean | 1771.90 | 2447.76 | 2515.30 |
| median | 1591.90 | 2363.77 | 2377.25 | |
| Plume Region: | Near-Source (I) | Near-Downwind (II) | Mid-Downwind (III) | Far Downwind (IV) | |
|---|---|---|---|---|---|
| AOD | mean ± σ | 2.222 ± 0.7840 | 1.556 ± 0.6195 | 0.9851 ± 0.2856 | 1.020 ± 0.2164 |
| median | 2.281 | 1.653 | 0.8913 | 1.007 | |
| ANG | mean ± σ | 1.541 ± 0.3800 | 1.319 ± 0.3234 | 1.824 ± 0.3106 | 1.042 ± 0.3272 |
| median | 1.583 | 1.293 | 1.822 | 1.024 | |
| SSA | mean ± σ | 0.8641 ± 0.02926 | 0.9251 ± 0.03960 | 0.9154 ± 0.04117 | 0.9688 ± 0.03889 |
| median | 0.8639 | 0.9217 | 0.9229 | 0.9802 | |
| BC a,b | mean ± σ | 0.5606 ± 0.1681 | 0.3649 ± 0.2186 | 0.2727 ± 0.2546 | 0.09674 ± 0.1661 |
| median | 0.5852 | 0.4156 | 0.2403 | 0 | |
| BrC a,c | mean ± σ | 0.1260 ± 0.1304 | 0.08067 ± 0.1106 | 0.3024 ± 0.2102 | 0.02564 ± 0.08594 |
| median | 0.08545 | 0.03358 | 0.3049 | 0 | |
| Non-absorbing a,d | mean ± σ | 0.1069 ± 0.1726 | 0.4434 ± 0.2915 | 0.3498 ± 0.2547 | 0.6914 ± 0.2948 |
| median | 0 | 0.4440 | 0.3835 | 0.7383 | |
| Non-spherical a,e | mean ± σ | 0.2064 ± 0.1307 | 0.1110 ± 0.1253 | 0.07516 ± 0.09498 | 0.1863 ± 0.1984 |
| median | 0.2119 | 0.05470 | 0.0158 | 0.08771 | |
© 2020 by the authors. Licensee MDPI, Basel, Switzerland. This article is an open access article distributed under the terms and conditions of the Creative Commons Attribution (CC BY) license (http://creativecommons.org/licenses/by/4.0/).
Share and Cite
Junghenn Noyes, K.; Kahn, R.; Sedlacek, A.; Kleinman, L.; Limbacher, J.; Li, Z. Wildfire Smoke Particle Properties and Evolution, from Space-Based Multi-Angle Imaging. Remote Sens. 2020, 12, 769. https://doi.org/10.3390/rs12050769
Junghenn Noyes K, Kahn R, Sedlacek A, Kleinman L, Limbacher J, Li Z. Wildfire Smoke Particle Properties and Evolution, from Space-Based Multi-Angle Imaging. Remote Sensing. 2020; 12(5):769. https://doi.org/10.3390/rs12050769
Chicago/Turabian StyleJunghenn Noyes, Katherine, Ralph Kahn, Arthur Sedlacek, Lawrence Kleinman, James Limbacher, and Zhanqing Li. 2020. "Wildfire Smoke Particle Properties and Evolution, from Space-Based Multi-Angle Imaging" Remote Sensing 12, no. 5: 769. https://doi.org/10.3390/rs12050769
APA StyleJunghenn Noyes, K., Kahn, R., Sedlacek, A., Kleinman, L., Limbacher, J., & Li, Z. (2020). Wildfire Smoke Particle Properties and Evolution, from Space-Based Multi-Angle Imaging. Remote Sensing, 12(5), 769. https://doi.org/10.3390/rs12050769


