Article

Spatiotemporal Characteristics of the Association between AOD and PM over the California Central Valley

1
NASA Ames Research Center, Moffett Field, CA 94035, USA
2
Universities Space Research Association (USRA), Mountain View, CA 94043, USA
3
Keck School of Medicine, University of Southern California, Los Angeles, CA 90032, USA
4
Jet Propulsion Laboratory, Pasadena, CA 91109, USA
*
Author to whom correspondence should be addressed.
Remote Sens. 2020, 12(4), 685; https://doi.org/10.3390/rs12040685
Submission received: 10 January 2020 / Revised: 12 February 2020 / Accepted: 13 February 2020 / Published: 19 February 2020

Abstract

:
Many air pollution health effects studies rely on exposure estimates of particulate matter (PM) concentrations derived from remote sensing observations of aerosol optical depth (AOD). Simple but robust calibration models between AOD and PM are therefore important for generating reliable PM exposures. We conduct an in-depth examination of the spatial and temporal characteristics of the AOD-PM2.5 relationship by leveraging data from the Distributed Regional Aerosol Gridded Observation Networks (DRAGON) field campaign where eight NASA Aerosol Robotic Network (AERONET) sites were co-located with EPA Air Quality System (AQS) monitoring sites in California’s Central Valley from November 2012 to April 2013. With this spatiotemporally rich data we found that linear calibration models (R2 = 0.35, RMSE = 10.38 μg/m3) were significantly improved when spatial (R2 = 0.45, RMSE = 9.54 μg/m3), temporal (R2 = 0.62, RMSE = 8.30 μg/m3), and spatiotemporal (R2 = 0.65, RMSE = 7.58 μg/m3) functions were included. As a use-case we applied the best spatiotemporal model to convert space-borne MultiAngle Imaging Spectroradiometer (MISR) AOD observations to predict PM2.5 over the region (R2 = 0.60, RMSE = 8.42 μg/m3). Our results imply that simple AERONET AOD-PM2.5 calibrations are robust and can be reliably applied to space-borne AOD observations, resulting in PM2.5 prediction surfaces for use in downstream applications.

Graphical Abstract

1. Introduction

The use of remotely sensed Aerosol Optical Depth (AOD) for estimating concentrations of ground monitored fine particulate matter (PM2.5) has been well established in many applications, e.g., [1,2,3,4,5,6,7,8,9]. The motivation for incorporating AOD as an explanatory variable in PM estimation models lies in the physical principles underlying the basic relationships between AOD and airborne particle concentrations [10]. Further lending to its appeal, satellite observations of AOD provide spatial coverage that far surpasses point measurements of ground-level PM. The 4.4 km resolution Multiangle Imaging Spectroradiometer (MISR) AOD product, which has the spectral and angular features that enable the characterization of aerosol size and type, is suitable to address this issue. The only caveat is that its temporal coverage is not daily; MISR has a weekly recurrence, therefore, information on the aerosol type and size cannot capture the day to day variation in air quality [11]. The new 4.4 km MISR aerosol product has been used in a number of previous air quality studies [2,12,13,14] and MISR, along with the Moderate Resolution Imaging Spectroradiometer (MODIS), serves as one of the core satellite datasets in global estimates of the PM burden [7]. Although MISR has more or less weekly temporal availability, its ability to retrieve both total column aerosol loading and aerosol type over land is important, e.g., [15]. MISR was also chosen for this study due to its similarities to the forthcoming Multi-Angle Imager for Aerosols (MAIA) mission. One of the main objectives of MAIA is to provide researchers with PM estimates that can be used in epidemiological studies that examine associations between air quality and health outcomes [16]. As a target-based mission, MAIA will focus on selected geographic areas, within which there will be limited ground-based global NASA Aerosol Robotic Network (AERONET) stations for validation. The MAIA mission will provide 1 km daily PM concentrations that rely on these limited AERONET stations to validate the PM models for each primary target area (PTA) [16]. Aerosol products from AERONET have been widely used as well-calibrated ‘ground-truth’ measurements to perform validations of satellite-based AOD retrievals, including MISR AOD [17,18,19,20,21]. AERONET is a network of autonomously operated CIMEL sun–sky photometers that measure direct beam irradiance and directional sky radiance and provide column-integrated aerosol properties of AOD and aerosol microphysical and radiative properties [22]. AERONET measurements are made in eight spectral bands (340, 380, 440, 500, 675, 870, 940, and 1020 nm) approximately every 15 min. These solar extinction measurements are then used to compute AOD at each wavelength [23]. In addition to long-term fixed AERONET sites, several Distributed Regional Aerosol Gridded Observation Networks (DRAGON) field campaigns have been deployed at different times in a variety of regions globally [24]. One such campaign was established in the California Central Valley where 18 sites were deployed North to South from Fresno to Bakersfield and East to West from Porterville near the foothills of the Sierra Nevada to Huron [24,25] between November 2012 and April 2013. Data from DRAGON campaigns have been used to evaluate High Spectral Resolution Lidar 2 (HSRL2) and airborne in situ AOD measurements [26], evaluate MISR AOD [21,25], estimate PM concentrations [27], and analyze interaction of aerosols with clouds [28], among others.
The Central Valley DRAGON sites were co-located with Environmental Protection Agency (EPA) Air Quality System (AQS) ground monitoring PM2.5 sites, providing a rich, short-term but high-density dataset of particulate matter information. We leverage these data to perform a detailed analysis of AOD-PM2.5 relationships, particularly since this DRAGON campaign enables the examination of spatial relationships given its dense distribution of co-located sites in a relatively small region. Furthermore, three of the AERONET sites in the region are longer running and are also co-located with AQS monitors enabling the assessment of the temporal aspects of the AOD-PM2.5 association. Given the quality of the instrumentation and data produced from this campaign, we consider the AERONET-AQS models to be a robust and reliable calibration of AOD to PM2.5. To test this assumption, we examine its transferability by applying the trained AERONET AOD-PM2.5 calibration models to satellite-based observations of AOD, with MISR as our use-case.
While other approaches include many covariates (e.g., meteorology, land use) [5,7,8,9,29,30], we are taking an approach that uses AOD without other sources of data.
The results from this study provide insight on the use of AERONET for modeling exposure estimates as a proxy for satellite-based PM estimations. The data and methods used are detailed in Section 2; Section 3. presents the results, followed by the discussion and conclusions in Section 4 and Section 5, respectively.

2. Materials and Methods

2.1. Data

The study region covers California’s Central Valley (Figure 1). From the DRAGON field campaign, which was conducted from 1 November 2012 through 1 April 2013 at 15 sites, we obtained both NASA AERONET AOD and EPA air quality system (AQS) PM2.5 from 8 co-located sites (Table 1; Figure 1). To supplement our examination of the short-term DRAGON campaign of densely distributed AERONET stations, we also examined data available at three long-term sites: Bakersfield, Fresno, and Modesto. At these sites, there are co-located instruments with a long-term record of available data every 3–6 days from 2002–2018. The long-term Modesto site, just north of the region shown in Figure 1, was not part of the DRAGON network.

2.1.1. AERONET Data

Version 3 Level 2 (V3_L2) AERONET AOD data, cloud screened and quality assured, measured at 8 different wavelengths (340, 380, 440, 500, 675, 870, 940, and 1020 nm), were acquired from https://aeronet.gsfc.nasa.gov/. Out of the 18 sites that were part of the DRAGON campaign, 8 were co-located (<1 km) with EPA PM2.5 monitors (Table 1, Figure 1) and had available data during the campaign time period.
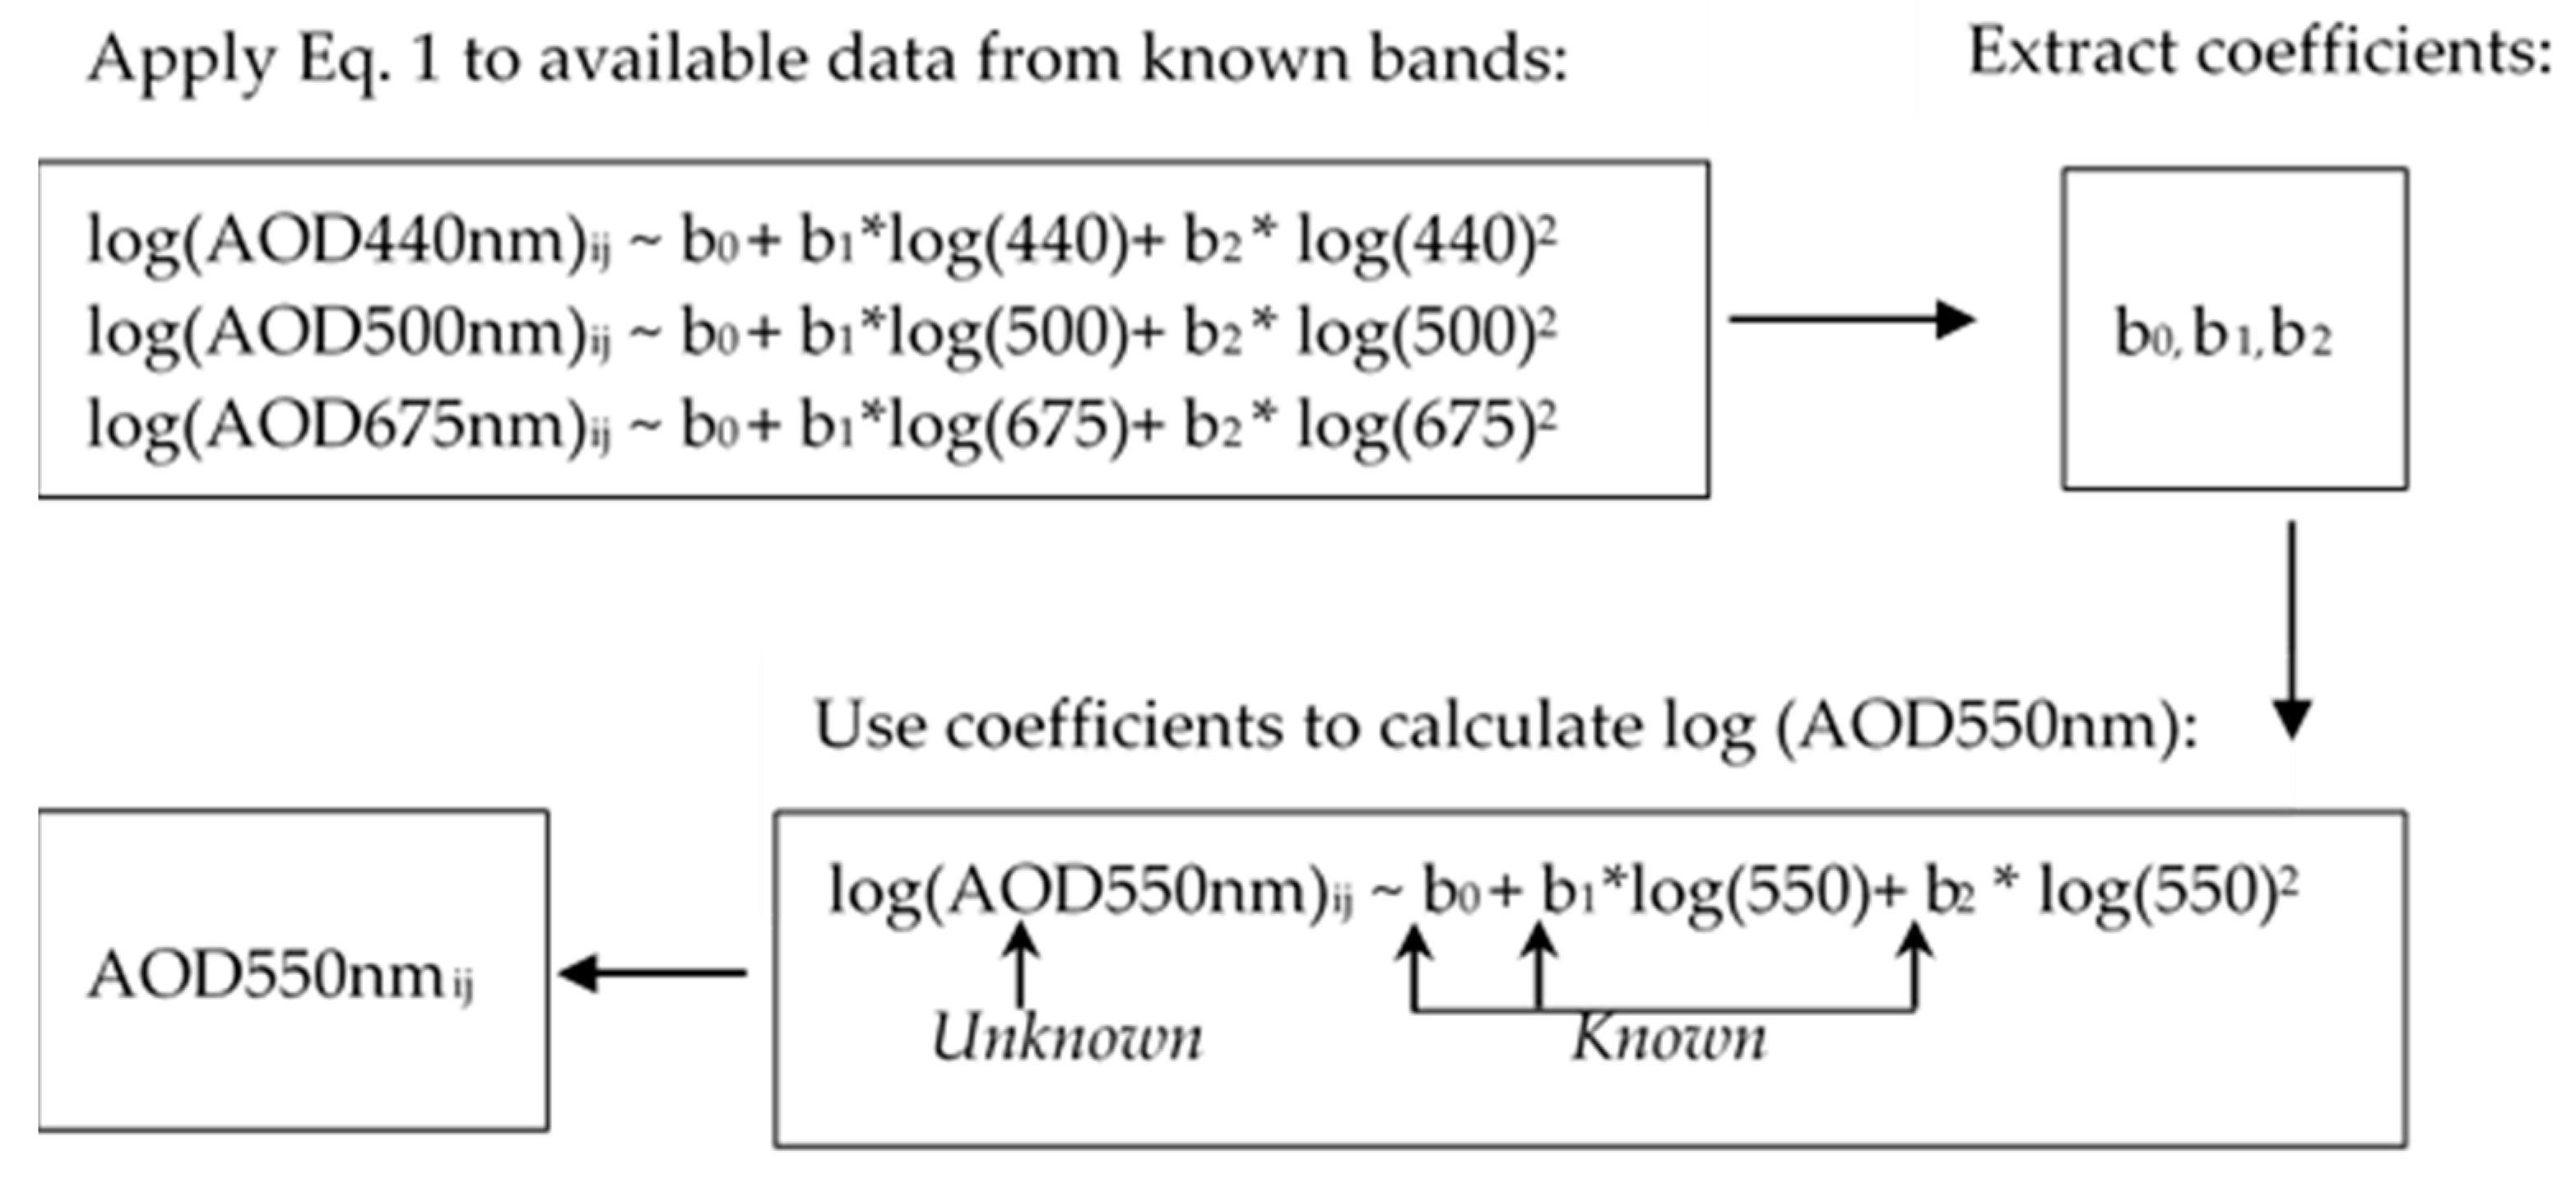
In order to comply with MISR AOD we used a quadratic log-log interpolation to calculate AOD at 550 nm (Equation (1); [31,32]), which required availability of AOD in at least 3 wavelengths using the 870 nm, 675 nm, 500 nm, and 440 nm bands for each day–station pair. The coefficients were extracted by solving a three-way equation system in order to calculate AOD at 550nm (a detailed example can be found in Appendix A):
log(AODwaveI)ij ~ b0ij + b1ij * log(waveI) + b2ij * log(waveI)2; I = 1, ..., 3
where AODwaveI = 1,…,3 is the AOD in a known wavelength I = 1, …, 3 at site i and day j, and b0, b1, and b2, are the coefficients derived from the interpolation using AOD in known wavelengths. Applying these coefficients to Equation (1) using waveI = 550 will reveal AOD at 550 nm for each site i and day j.
AOD and its spectral dependence can be expressed approximately as a power law relationship, where the Ångstrom exponent equals the log ratio between the ratio of two AOD values and the ratio of two wavelengths, respectively. If the Ångstrom exponent is known, AOD at one wavelength can also be calculated from AOD at another wavelength [31]. However, when the AOD is measured at three or more wavelengths in different spectral regions, the wavelength dependence of the Ångstrom exponent can be better described by a second order polynomial empirical relationship between the logarithmic AOD and logarithmic wavelengths. The second order coefficient accounts for the curvature in the log (AODwaveI) and log (waveI) relationship. Ignoring the second-order approximation sometimes introduces significant errors [32].

2.1.2. PM2.5 EPA Data

Daily PM2.5 concentrations, measured by EPA Federal Reference Method (FRM) gravimetric monitors, were collected by EPA AQS monitors and the data were obtained from https://aqs.epa.gov/aqsweb/airdata/download_files.html. The data were processed to remove negative concentrations. For our analysis, we average AERONET AOD to match the daily FRM PM2.5 temporal resolution resulting in a complete AOD-PM dataset for the DRAGON campaign that includes a total of 301 co-located daily observations.
Three sites in the Central Valley have long-term AERONET-AQS co-locations (Fresno and Bakersfield same locations as the DRAGON campaign; Modesto not included in the DRAGON campaign but in the region). This dataset includes a total of 3806 co-located daily observations starting in 2002.

2.1.3. MISR Data

The MISR instrument onboard NASA’s Terra Satellite has been collecting data with nine camera angles and 4 spectral channels since early 2000. The most recent version 23 (V23) of the aerosol retrieval algorithm was recently processed at 4.4 km [33] using high-resolution (275 m) MISR observations and includes additional improvements for retrievals over dark water [34]. The MISR V23 aerosol product has been shown to have a better sampling than the previous V22 version and demonstrated improved performance at high AOD values. The MISR V23 is also better able to resolve spatial gradients in AOD for a wide range of aerosol loadings [25], and therefore suitable for evaluation of AOD spatial variability for variety of aerosol conditions.
In addition to AOD, the V23 aerosol product includes MISR component-particle optical properties covering size, shape, and absorption properties. For this study we focus on total AOD, retrieved at 550 nm, matching available MISR overpasses with the daily AOD and PM2.5 at the coincident DRAGON sites as done in other MISR satellite AOD-PM2.5 studies [2]. For these matches we examined the relationships between AERONET and MISR AOD as well as AQS PM2.5 and MISR AOD.

2.2. Methodology

2.2.1. Calibration Models

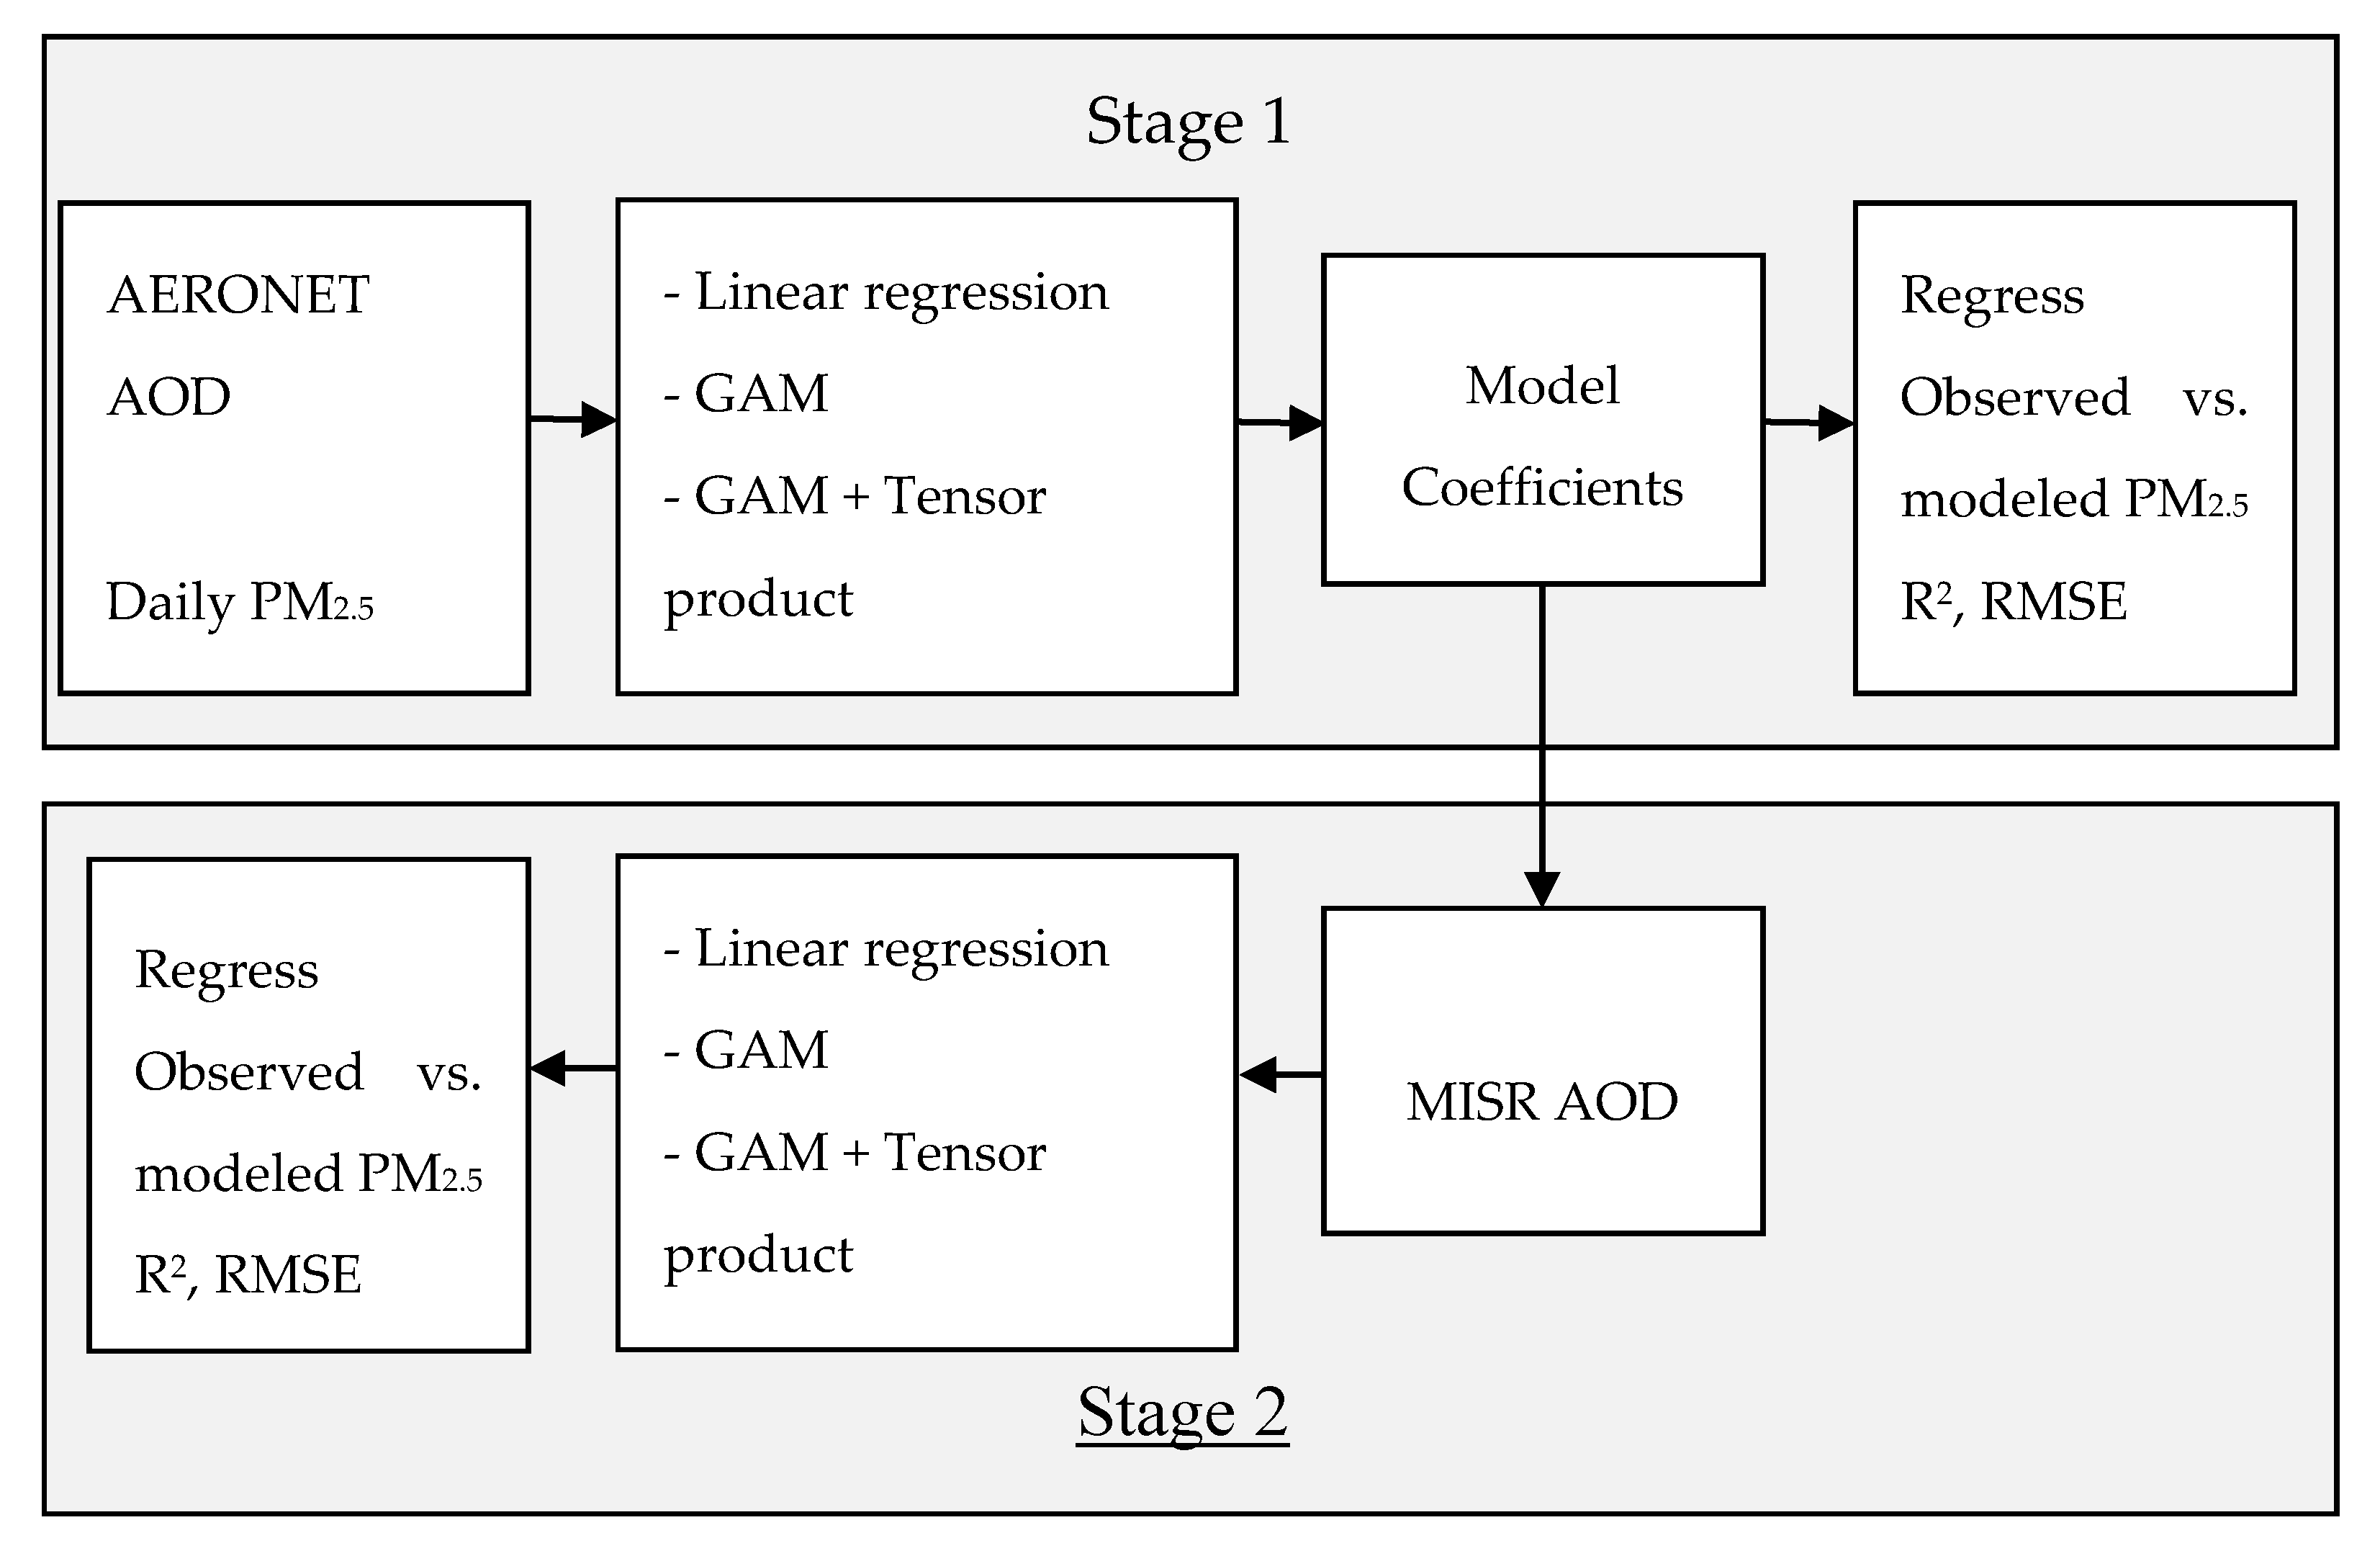
Stage 1: The main goal of this study is to develop and evaluate regression-based calibration models using only AERONET AOD and AQS PM2.5 concentrations. After calibration, the models are then applied to convert MISR AOD to PM2.5 (Stage 2). We start with a simple linear regression (Equation (2)), referred to as a baseline model:
Baseline: PM = α + β∙AOD + ε
where PM is the daily PM2.5 concentration, α and β are the model intercept and slope, respectively, AOD is the daily AERONET AOD at 550 nm, and ε is the prediction error in μg/m3. The marginal correlation between remotely sensed AOD and PM2.5 concentrations in the baseline model, motivated the development of other models.
We then developed a set of Generalized Additive Models (GAMs) to model non-parametric functions of AOD and the spatial and temporal components of the data, and to examine their roles in the calibration [2]. Additive models are used to construct a regression model of smooth functions of the independent variables, where the linear relationship between the variables and the response are replaced by a functional relationship [35,36] Building on the baseline model, we added a cubic regression smoothing spline (f) on AERONET AOD (Model 1; Equation (3)); a spatiotemporal model with a tensor product spline (fs,t(x,y,t)) of space and time (Model 2; Equation (4)); a spatiotemporal model with a cubic spline (f) for space and functions of time, which is broken down into three components using a cubic regression spline (ft1) on date (t1), and indicator categorial functions (It2 and It3) for month (t2; used only with long-term AQS-based models) and day of the week (t3), respectively (Model 3; Equation (5)); a temporal only model (Model 4; Equation (6)); and a spatial only model with a 2-D tensor product spline (fs) of space (geographic coordinates, x,y) that captures spatial patterns of the measurements (Model 5; Equation (7)).
Model 1: PM = α + f(AOD) + ε
Model 2: PMs,t = α + f(AOD) + fs,t(x,y,t) + εs,t
Model 3: PMs,t = α + f(AOD) + fs(x,y) + ft1(t1) + It2(t2) + It3(t3) + εs,t
Model 4: PMt = α + f(AOD) + ft1(t1) + It2(t2) + It3(t3) + εt
Model 5: PMs = α + f(AOD) + fs(x,y) + εs
Stage 2: The second step was to demonstrate how well the calibration models predict PM2.5 when applied to satellite-based AOD. We used MISR AOD observations (550 nm) from 4.4 km pixels coincident with each DRAGON site. The calibration, validation, and evaluation processes are detailed in Figure 2.

2.2.2. Model Evaluation

The results from all Stage 1 and 2 models are presented based on leave-one-site-out cross-validation (LOSO CV), where R2, Root Mean Square Error (RMSE), and Mean Absolute Bias (MAB) represent the statistics based on observed (from left out site) versus predicted (from model on remaining sites) data. Bias is defined as the estimate of the systematic error, here we use the absolute bias, determined as the difference between the monitored PM2.5 and the modeled PM2.5 concentrations. The bias will provide an estimate to the models’ direction, namely, if they are overestimating or underestimating the PM2.5 concentrations in the study area in general and between the sites.
To better understand the contribution of the temporal component of the models, we leveraged three long-term co-located AQS-AERONET sites in Bakersfield, Fresno, and Modesto with available data from 2002 to the present. To these data we re-fit the baseline model and Models 1, 2, and 4, with Model 2 having tensor product for the temporal components only (date, month, day of the week). The spatial component was not able to fit with only 3 sites.
To better understand the contribution of the spatial component of the models, we examined the spatial distribution of the residuals from the best fitting DRAGON model to see if there was any pattern. We also applied the long-term models from Bakersfield and Fresno to each DRAGON site to determine the feasibility of using a calibration model from one site spatially over a larger domain. These models were evaluated by comparing the observed DRAGON data to the predictions from the two long-term AQS-AERONET models.

3. Results

Stage 1: Site-specific summary statistics of DRAGON AERONET AOD and PM2.5 concentrations, ordered by their Spearman correlations, are detailed in Table 1. Mean AOD did not vary widely by site (0.10 in Madera City and Tranquility to 0.14 in Porterville); mean PM2.5 exhibited spatial variability, primarily from east to west (13.2 μg/m3 in Tranquility to 27.8 μg/m3 in Fresno). Site-specific AOD-PM2.5 correlations ranged from 0.25 in Fresno to 0.77 in Bakersfield, and RMSE from 7.62 μg/m3 in Madera City to 13. 6 μg/m3 in Hanford. Notably, the per-site sample size (N = 17 to 66) did not have a strong impact on the magnitude of the correlations or RMSE.
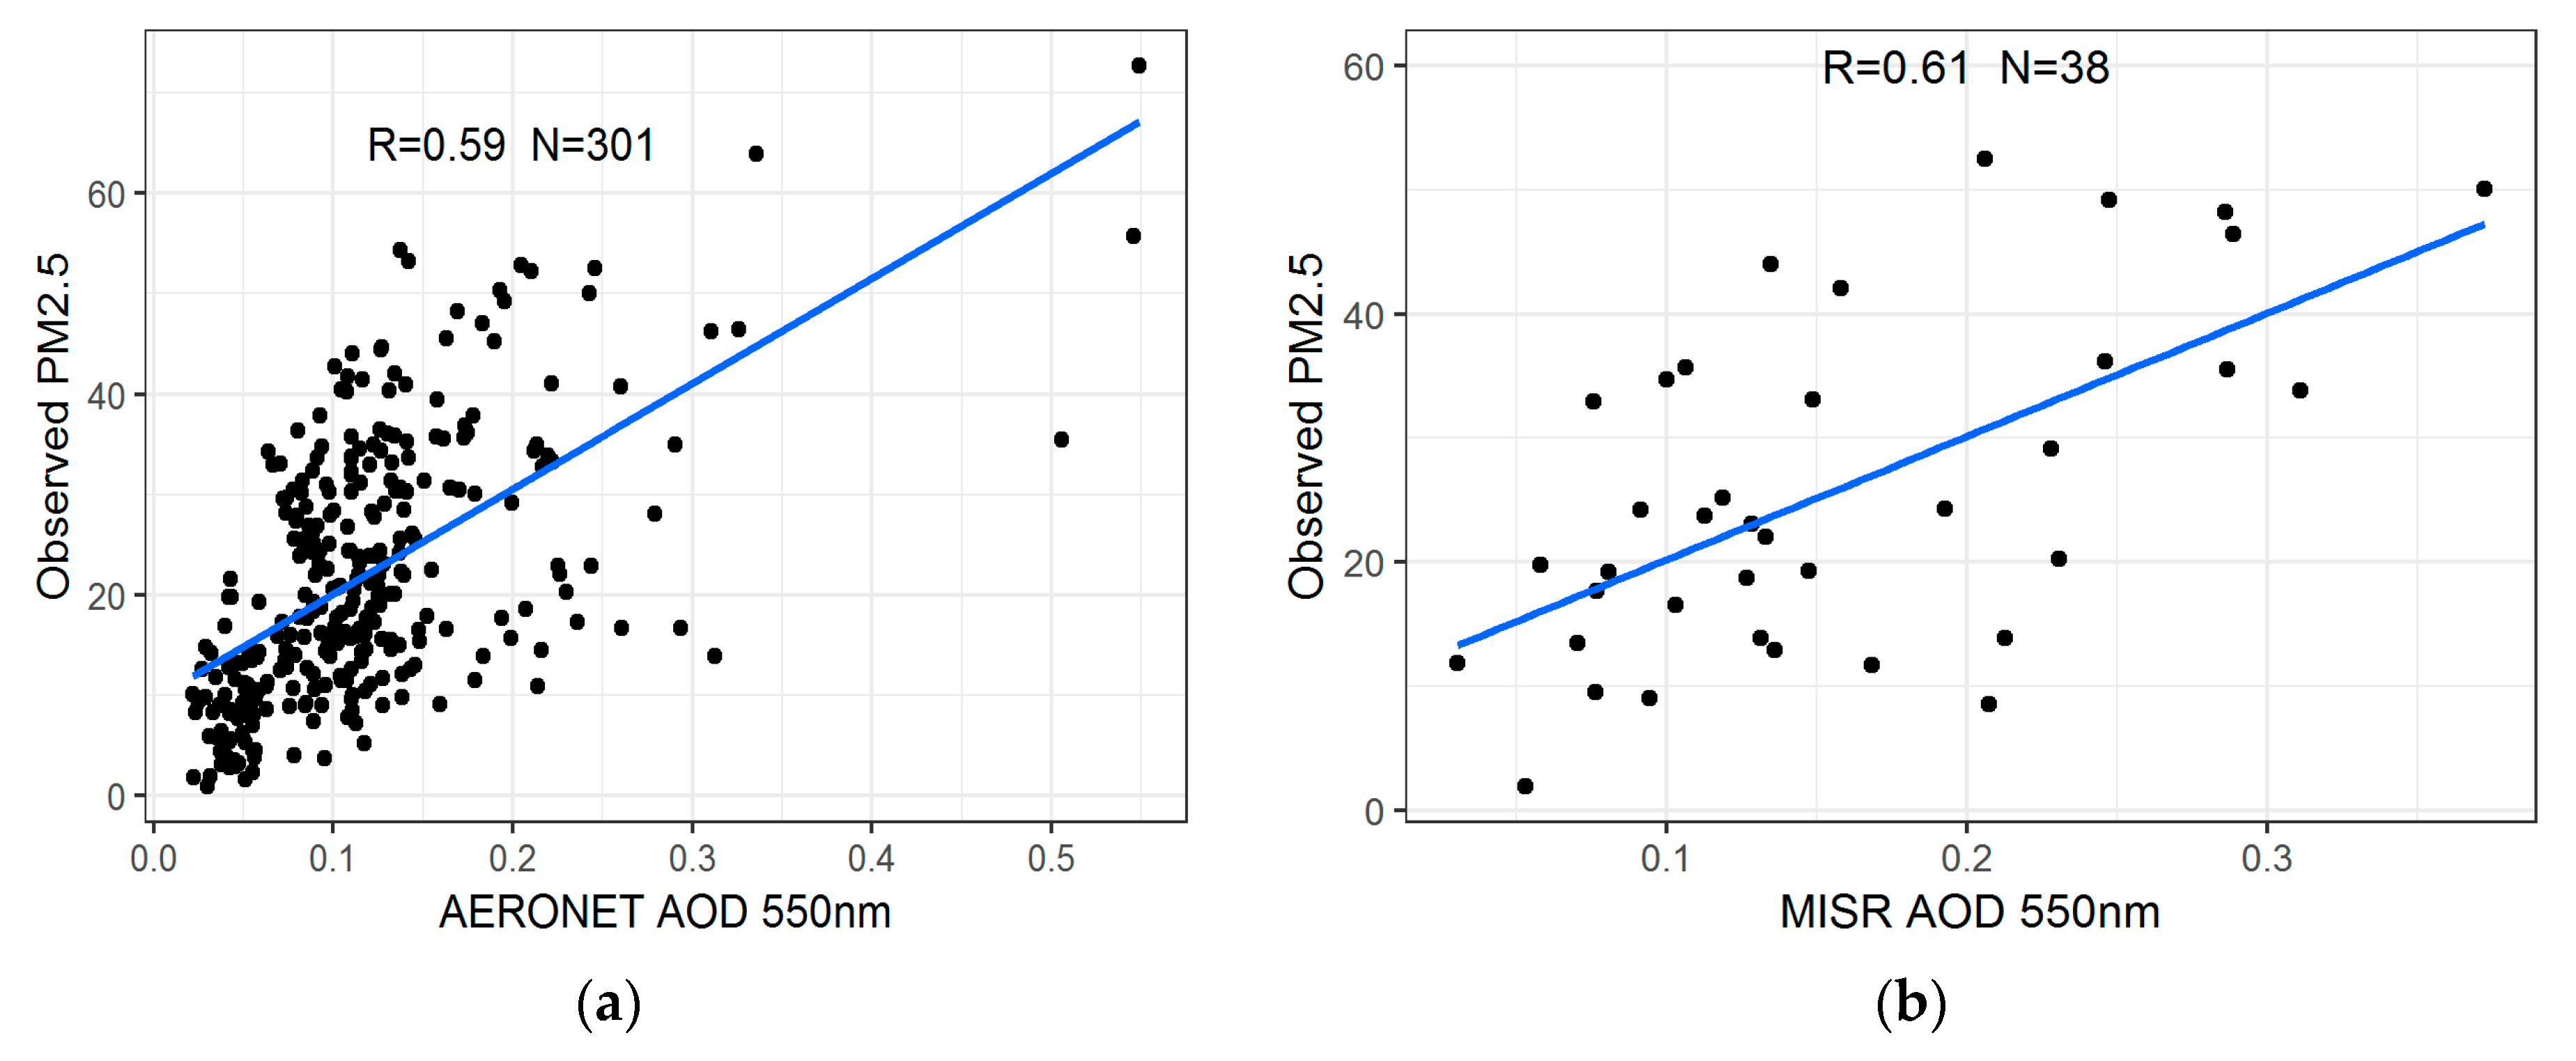
Applying the non-linear GAM (Model 1) modestly improved the Baseline linear model (Table 2; Figure 3) where the R2 increased by 5% and RMSE decreased by 0.45 μg/m3. The inclusion of a spatiotemporal tensor product (Model 2) further improved the model fit, increasing the R2 from 0.40 to 0.65, and lowering RMSE from 9.93 μg/m3 to 7.62 μg/m3 (Table 2). Separating the spatial and temporal basis functions within the same model (Model 3) results in the same R2 (0.65) but slightly lower RMSE (7.58 μg/m3). Examining the separate contributions of time (Model 4) and space (Model 5) emphasizes the stronger role the temporal component plays on the AOD-PM2.5 association. Neither performs as well as Model 3, but the model with temporal only (Model 4, R2 = 0.62; RMSE = 8.30 μg/m3) significantly outperforms the model with spatial only (Model 5, R2 = 0.45; RMSE = 9.54 μg/m3)
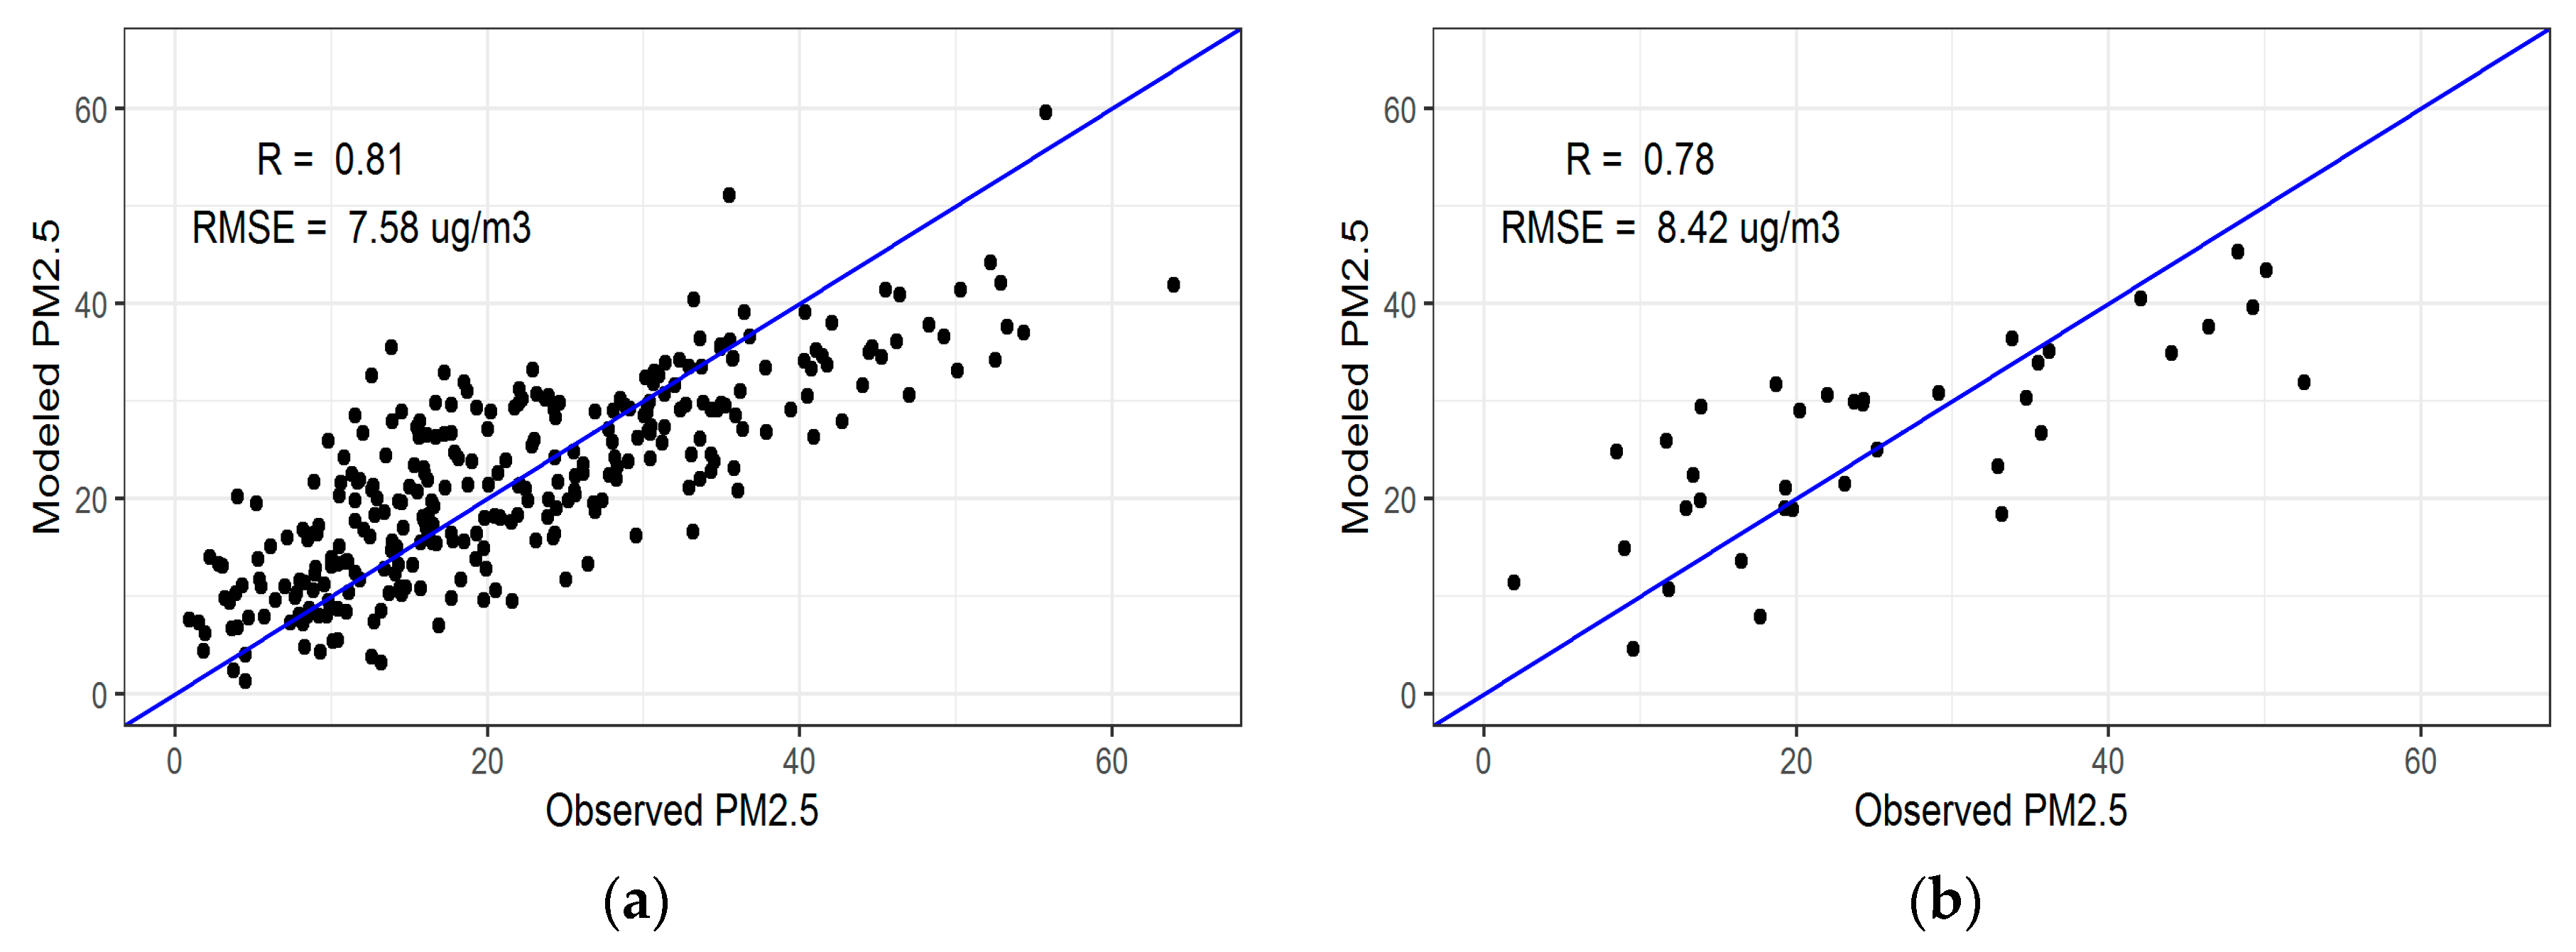
Stage 2: The number of coincident MISR AOD pixels over the DRAGON sites was only N = 38 due to MISR’s near-weekly orbit. Applying the calibration models to MISR AOD yielded similar model evaluation statistics (Table 2). For example, the linear (baseline model) regression between PM2.5 and AERONET AOD had R2 = 0.35 and RMSE = 10.38 μg/m3 (N = 301); when applied to MISR, AOD yielded R2 = 0.37 and RMSE = 10.60 μg/m3 (N = 38) (Table 2, Figure 3). Model 3, the best performing calibration, also performed best on the MISR observations (R2 = 0.60; RMSE = 8.42 μg/m3), improving the baseline model by 80% (Table 2, Figure 4). Similarly, the temporal products were found to be the main contributor (Model 4) in the model evaluation on MISR data. With AOD, the temporal terms explained approximately 61% of the variation in PM2.5, while AOD with spatial terms explained only 44% of the variation. While the AERONET-based calibration models have a negligible bias, the MISR-based estimations seem to marginally underestimate the PM2.5 concentrations for all models (e.g., negative MAB ~ −1.3 μg/m3; Table 2).
For illustration, we applied calibration Model 3 to convert all 4.4 km MISR AOD retrieved over the Central Valley, CA region to PM2.5 concentrations showing the per-pixel average over the short period of the DRAGON campaign (Figure 5).
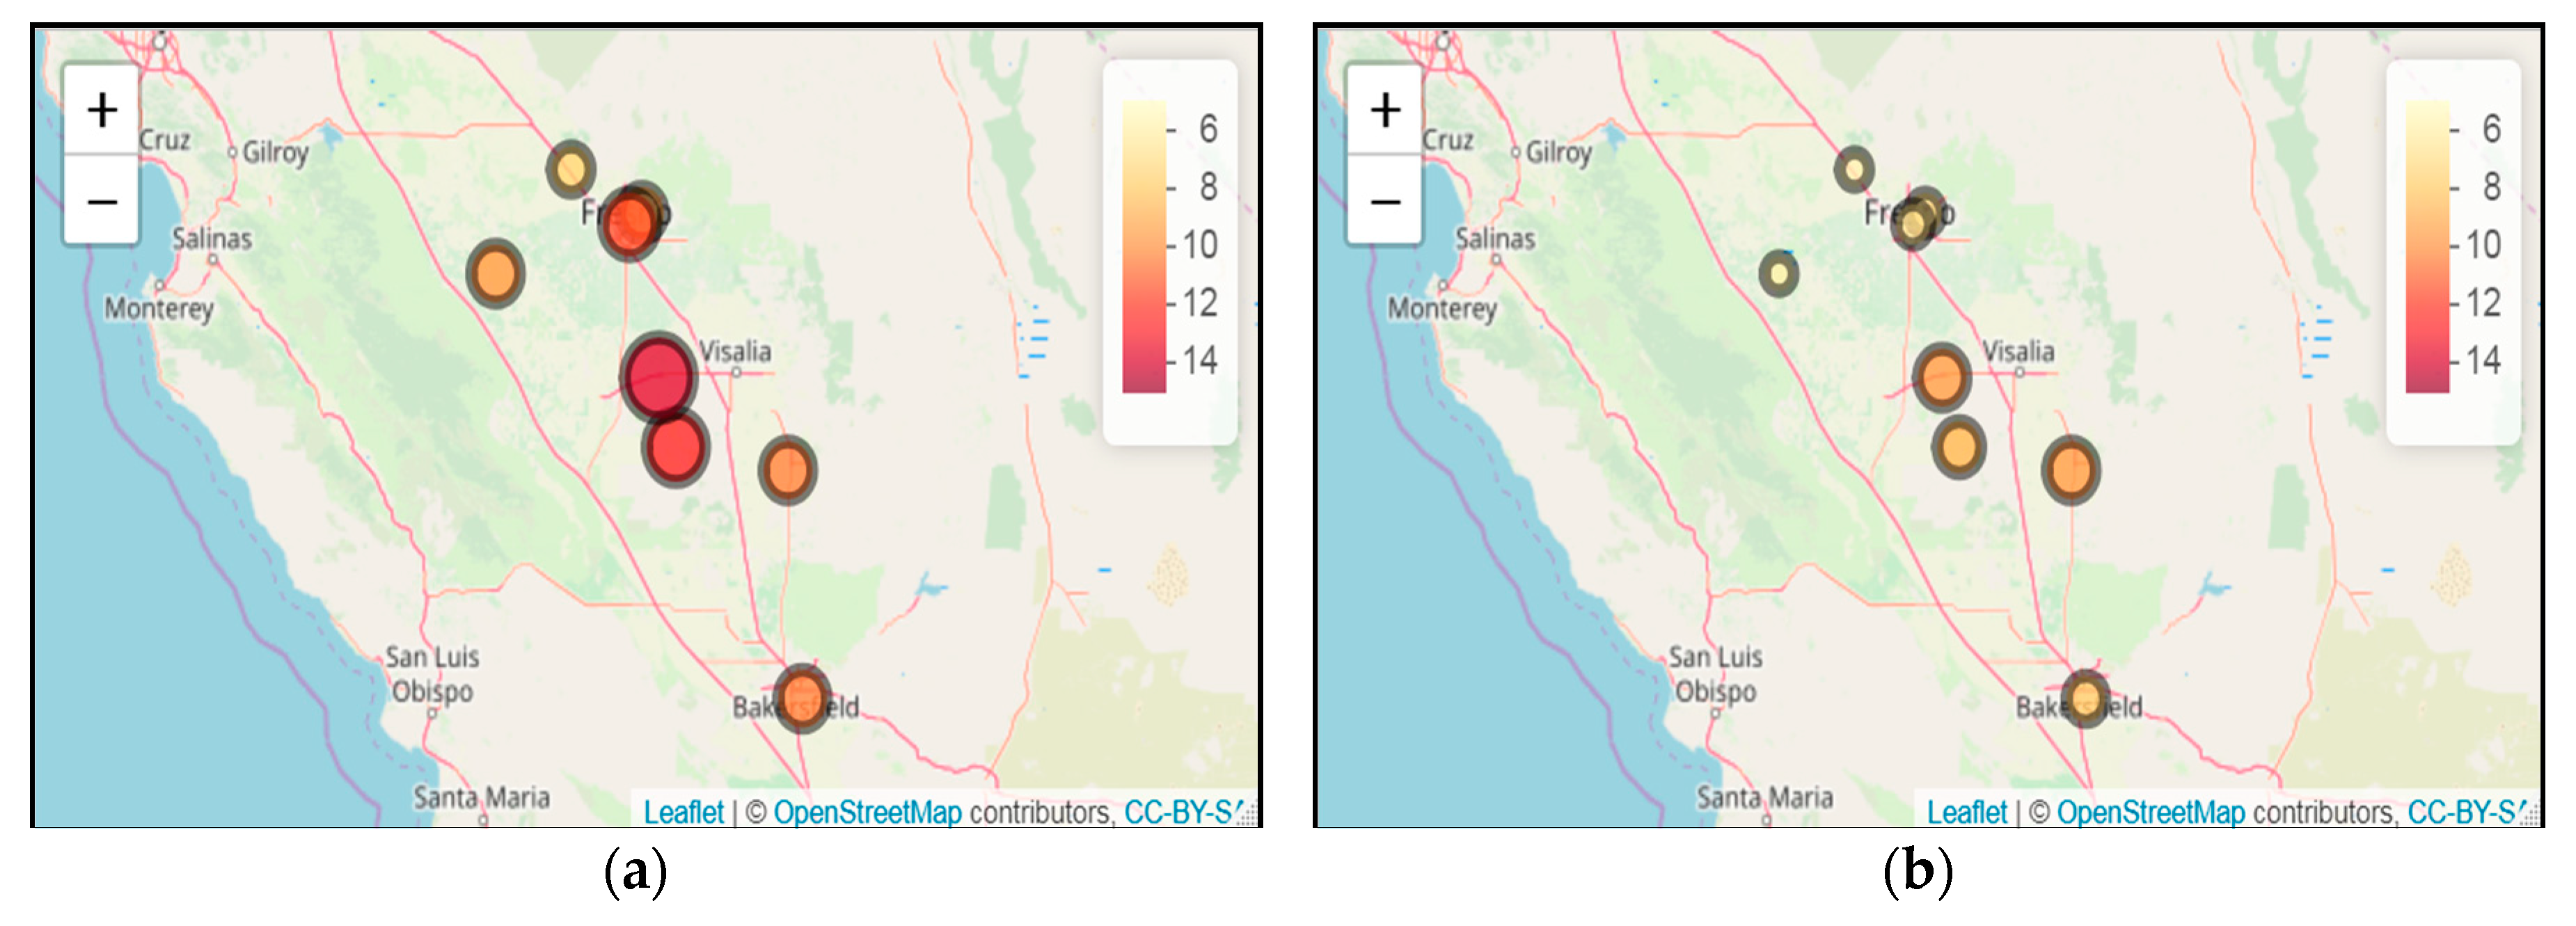
Model Evaluation: Spatial analyses of the per-site RMSE from the DRAGON AERONET—PM2.5 calibration models show high values with a strong spatial trend based on the baseline linear model (Figure 6, left) that are significantly improved when spatiotemporal Model 3 is applied (Figure 6, right). The overall improvement in the total RMSE for all stations is 27% ranging from a 7% decrease in Porterville site to a 41% decrease in the Fresno site.
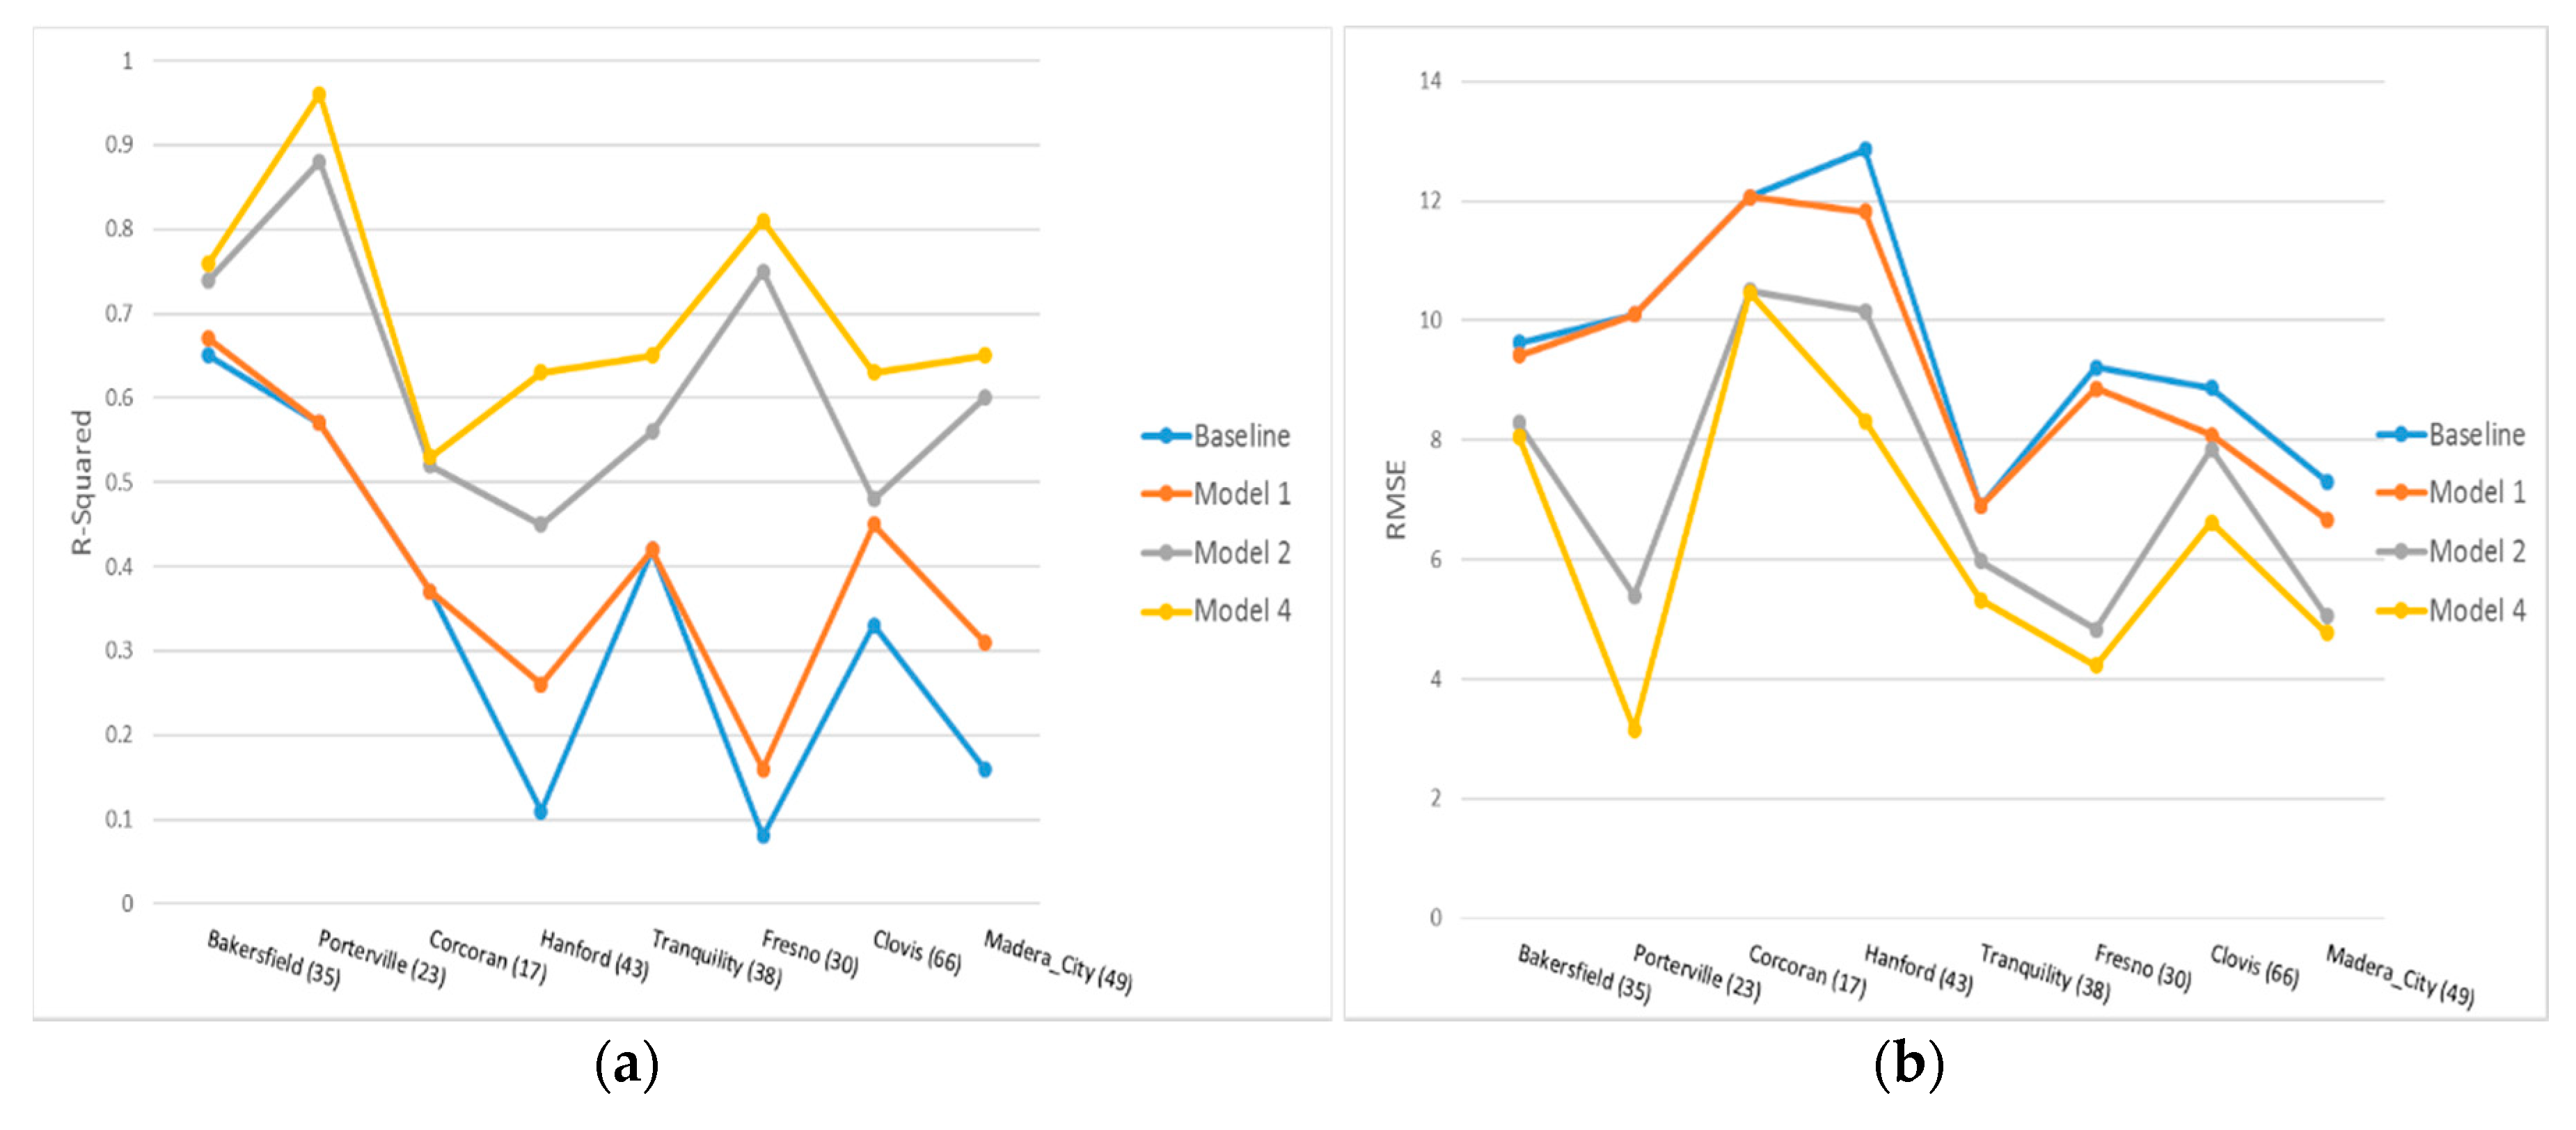
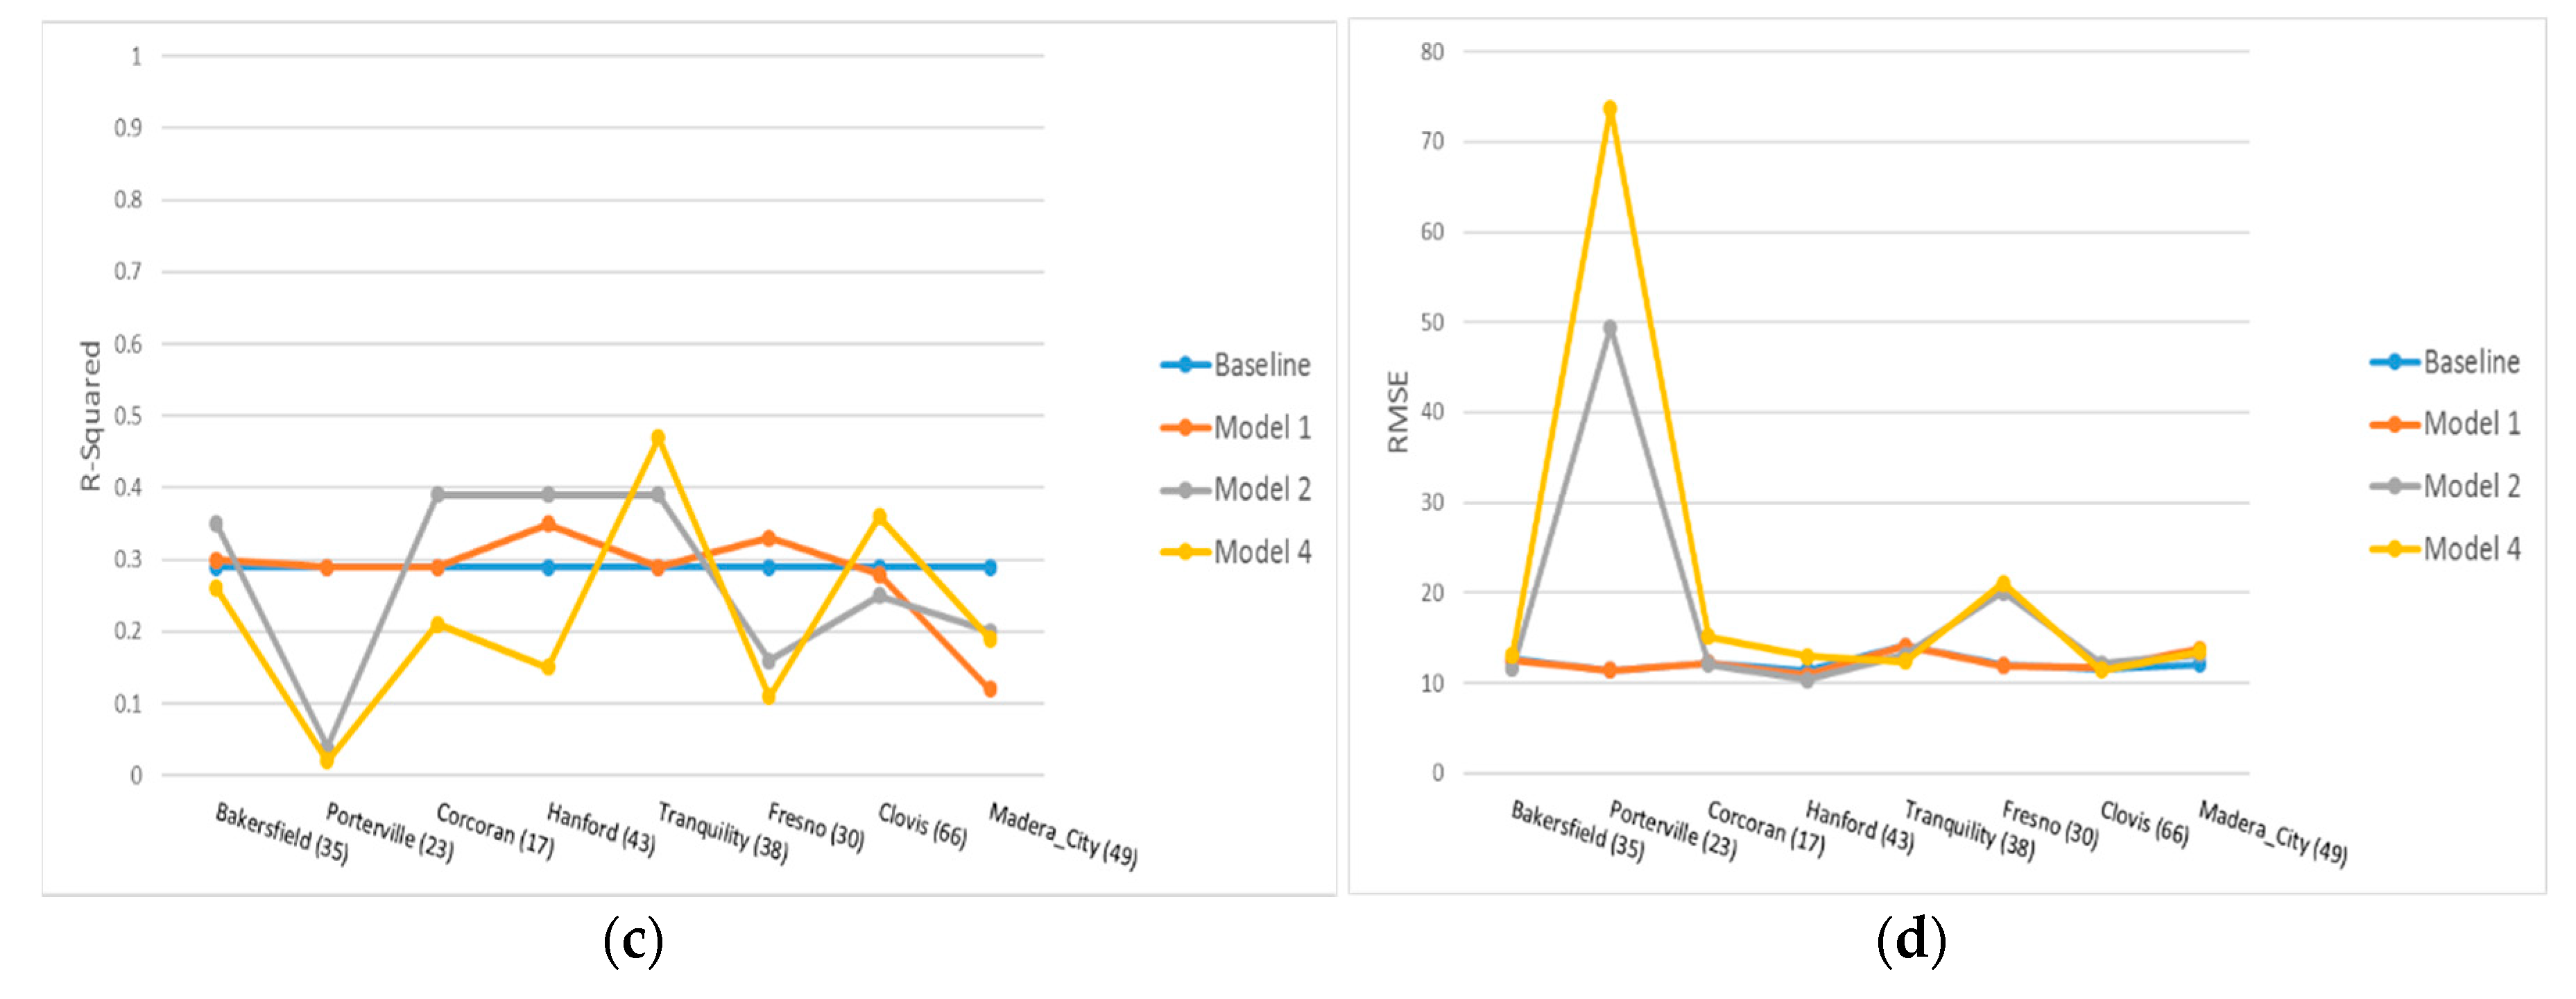
We also ran the Baseline model, Model 1 (GAM w/AOD), Model 2 only with a temporal tensor product, and Model 4 (GAM w/separate temporal products) on each DRAGON site and examined the R2 and RMSE (Figure 7a,b). The results clearly demonstrate that the GAM models with the temporal predictors are doing better for each station. The single site models were also applied to the DRAGON-MISR data and showed relatively constant results for the linear baseline model, yet the temporal predictors change by site with a high error in Porterville (Figure 7c,d). The mean absolute bias showed relatively low bias for the MISR-based estimates, with a marginal overestimation for Fresno, Bakersfield and Corcoran, MAB = 1.11, 0.03, 0.13 μg/m3, respectively, and a slight underestimation for all other sites (from MAB = −0.18 μg/m3 in Hanford to MAB = −5.44 μg/m3 in Porterville).
There was a total of 3806 available co-located AOD-PM2.5 observations at the long-term (2002-present) AERONET-AQS sites in Fresno, Bakersfield, and Modesto (Figure 1; Table 3). The Fresno site had the most data and the highest correlation coefficient between AOD and PM2.5 (R = 0.47).
To the combined data from the 3 sites, re-fitting the Baseline model and Models 1, 2, and 4 shows, not unexpectedly, that on the long-term data the GAM model incorporating only temporal products (Model 4) had the best results in both AERONET-PM2.5 calibration model (R2 = 0.61; RMSE = 8.6 μg/m3) and MISR-based evaluation (R2 = 0.38; RMSE = 11.22 μg/m3). However, the Stage 2 MISR application of the calibration model was not as good as we saw with the spatiotemporal Model 3 above, and the improvement of Model 4 from the Baseline model was comparatively low ranging from R2 = 0.34 to R2 = 0.38 based on Model 4 (Figure 8).
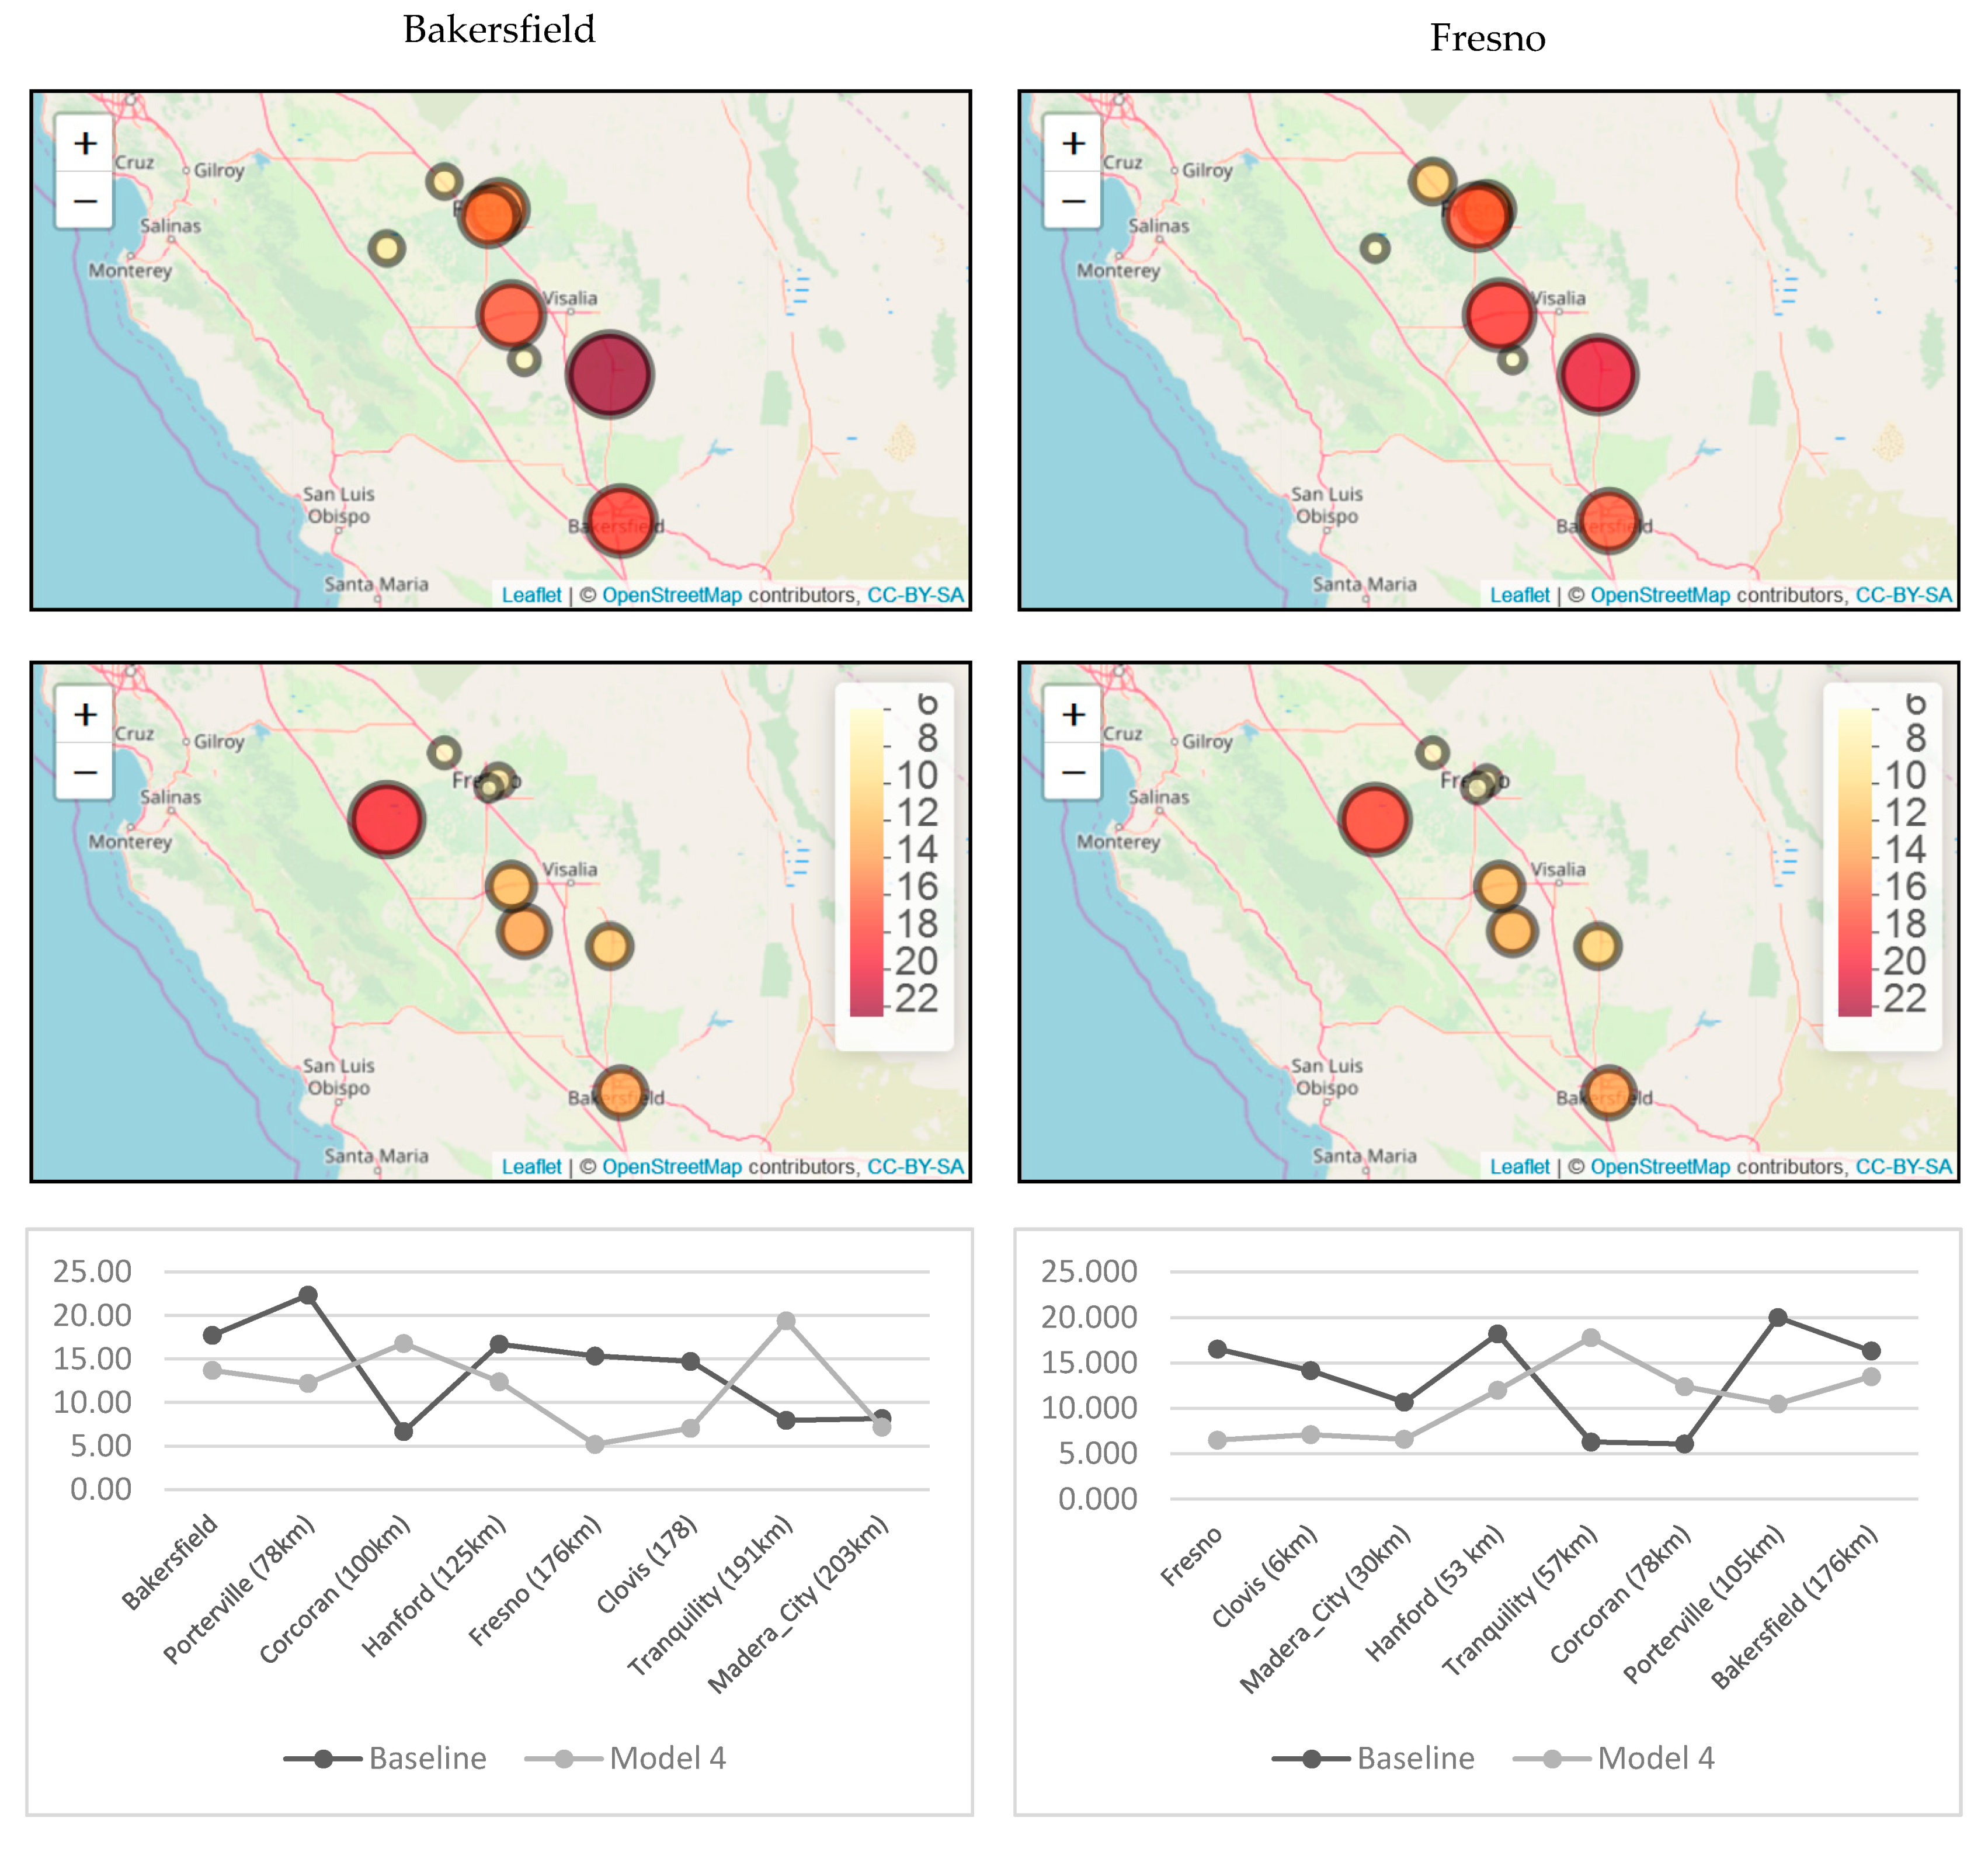
To test the feasibility of using one calibration model to predict PM2.5 over the larger Central Valley region, we calibrated the Baseline model and Model 4 at the long term AERONET-AQS PM2.5 sites in Fresno and Bakersfield (that were part of the DRAGON network) separately, and evaluated the model on MISR data (at all DRAGON sites). The estimated evaluation error was spatially examined by distance from the AQS site locations (Figure 9).
Except for the Tranquility site, there is a clear reduction in the prediction error between the linear regression (Figure 9, upper panel) and Model 4 (Figure 9, center panel) even when calibrating the model on data from only one long-term site. No significant differences are seen in Model 4 results between the models calibrated on two different long-term AQS stations, Fresno, and Bakersfield, and applied to all DRAGON sites (Figure 9; center panel).

4. Discussion

In this study, we examined the contribution of both spatial (locations of sites) and temporal (date, month, day of the week) components in the prediction of PM2.5 concentrations, based solely on remotely sensed AOD measured at AERONET sites in Central Valley, CA. We found a strong effect of the spatial and temporal predictors in all examined models and datasets, indicating that linear models with AOD as the only predictor are not capable of capturing complex dependencies in AOD-PM relationships. More sophisticated statistical models are therefore needed to explain the relationships in time and in space. Similar approaches have been taken in studies of the association between satellite AOD and PM2.5, including Sorek-Hamer et al. [37] who reported that both Multivariate Adaptive Regression Splines (MARS) and GAM models were more efficient than a linear regression in retrieving PM2.5 concentrations from different satellite aerosol products. Strawa et al. [38] showed that GAM resulted in an improved correlation coefficient, particularly capturing hourly PM2.5 exceedances that were not seen in the simple linear regression model. Franklin et al. [2] found that spatiotemporal tensor products of space and time best characterized the associations between MISR AOD in small, medium and large fractions to predict PM2.5 and PM10 concentrations, respectively.
Similarly, we found by leveraging the DRAGON data, which provides rich spatial and temporal information on both AOD and PM2.5, that including spatiotemporal functions in a regression model resulted in a far better calibration between AOD and PM2.5 than a simple linear regression (R2 0.65 vs. 0.35; RMSE 7.58 vs. 10.38 μg/m3). Importantly, our results indicate that temporal functions are the largest contributors to the performance of AOD-PM2.5 calibration models; that is, the temporal component of the spatiotemporal calibration models played a stronger role in the model improvement than the spatial component alone. Applying the DRAGON-AERONET spatiotemporal calibration models to MISR AOD data revealed good results with R2 and RMSE values that were better than those seen in other studies [2,12]. However, one limitation is that due to the nature of the daily PM2.5 data available at the DRAGON sites, we were not able to look at associations specifically at the MISR overpass time.
Leveraging the longer time series at the Fresno and Bakersfield sites showed promising results for the AERONET-AQS calibration model (R2 = 0.61; RMSE = 8.6 μg/m3), again indicating the functional temporal components contributed significantly to the models over a simple AOD model alone. However, when these calibration models were evaluated on MISR data, the R2 was far lower (0.38) and RMSE higher (10.73 μg/m3). It did not matter what site was used in developing the calibration model, as evidenced by nearly identical RMSE when either the Fresno or the Bakersfield site was applied to MISR data. With this limited dataset we were able to show that although spatial variability exists, the temporal predictors strongly contribute to the explained variance, but using one site for AOD-PM2.5 calibration is likely to be more useful for predicting over small (local) regions as long as the site-specific characteristics are well characterized in the model.
Having a spatially and temporally calibrated AOD-PM2.5 model is shown to be the best approach when subsequently applying it to convert satellite-observed AOD over a larger region. With separate spatial and temporal components in one model (Model 3) fit on the DRAGON data we could capture the spatial trends in PM2.5 levels over the Central Valley, CA (Figure 5). These results imply that simple AERONET AOD-PM2.5 calibrations with both spatial and temporal components are robust and can be reliably applied to space-borne AOD observations, resulting in PM2.5 prediction surfaces for use in downstream applications. An important consideration of our results is that if applied to different regions of the world there will be different topological and meteorological conditions that may alter the magnitude and strength of the AOD-PM2.5 association. To address this issue, studies have incorporated random effects to distinguish a nested geographical hierarchy [39] where regions or countries (e.g., Brazil) are nested within super-regions (e.g., Latin America and Caribbean) to allow for multi-scale heterogeneity in the spatiotemporally adjusted AOD-PM association. Following these results, since they apply to a certain study area during a limited period of observations, future research will examine the application of the spatiotemporal characteristics on different AERONET AOD-PM co-locations where available, in other parts of the U.S. and globally, and apply more sophisticated machine learning methods incorporating additional variables, e.g. meteorology, traffic, according to the MAIA modeling scheme.
The results from this study demonstrate the use of AERONET aerosol products for modeling exposure estimates as a proxy for satellite-based PM2.5 estimations. The upcoming MAIA mission will be capable of characterizing aerosol sizes, compositions and quantities. One of the main objectives of MAIA is to provide researchers with modeled PM estimates that can be used in health studies in order to better understand associations between air quality and health outcomes. The results of this study help to inform and support the MAIA algorithm development process.

5. Conclusions

The primary objective of this study was to develop spatiotemporal models that link aerosol optical properties obtained from AERONET to co-located ground-level PM2.5 mass concentrations obtained from the EPA national monitoring networks, and then apply the calibration models to convert MISR AOD to PM2.5 maps. By focusing primarily on the DRAGON field campaign in California’s Central Valley we were able to characterize spatial dependencies and the strong contribution of temporal predictors to the AOD-PM2.5 association. The linear correlation between AERONET AOD and PM2.5 from different co-located sites had a wide range with relatively high correlations, with a strong dependency on the site. Leveraging spatial and temporal effects in a non-linear model resulted in a better fit R2 = 0.65 and improved RMSE = 7.58 μg/m3. Finally, applying the DRAGON AERONET-based calibrated model to MISR AOD is reliable with predicted vs. observed PM2.5 R2 = 0.65 and RMSE = 7.99 μg/m3. Using only temporal dependencies from a longer time series at one site (Fresno) resulted in poorer results but can still be applied to predict PM2.5 from MISR relatively well. Our results point out the value in spatially dense campaigns such as DRAGON and imply that AERONET AOD in addition to spatial and temporal information can be utilized for calibrating AOD-PM models with cautious on the site-specific effects.

Author Contributions

Conceptualization, O.K. and M.F.; methodology, O.K., M.F., M.G., and M.S.-H.; obtaining data and model development, M.S.-H., M.F., K.C.; writing—original draft preparation, M.S.-H. and M.F.; writing—review and editing, O.K. and M.G.; supervision, O.K. All authors have read and agreed to the published version of the manuscript.

Funding

This research was funded and supported by the MISR project of NASA’s Climate and Radiation Research and Analysis Program, under H. Maring and NASA Grant 80NSSC19K0225.

Acknowledgments

We thank reviewers for their helpful comments that we believe improved the clarity and readability of this manuscript. Portions of this work were performed at the Jet Propulsion Laboratory, California Institute of Technology, under a contract with the National Aeronautics and Space Administration. We thank Brent Holben and the AERONET team for their effort in establishing and maintaining DRAGON-USA 2012–2013 instrument deployments which occurred in and around the San Joaquin Valley of California.

Conflicts of Interest

The authors declare no conflict of interest.

Appendix A

Example of applying a quadratic log-log interpolation to calculate AOD at 550 nm for each specific site (i) and day (j) using available AOD data from three different bands (440:500, 675 nm).
Remotesensing 12 00685 i001

References

  1. Engel-Cox, J.A.; Holloman, C.H.; Coutant, B.W.; Hoff, R.M. Qualitative and quantitative evaluation of MODIS satellite sensor data for regional and urban scale air quality. Atmos. Environ. 2004, 38, 2495–2509. [Google Scholar] [CrossRef]
  2. Franklin, M.; Kalashnikova, O.V.; Garay, M.J. Size-resolved particulate matter concentrations derived from 4.4 km-resolution size-fractionated Multi-angle Imaging SpectroRadiometer (MISR) aerosol optical depth over Southern California. Remote Sens. Environ. 2017, 196, 312–323. [Google Scholar] [CrossRef]
  3. Koelemeijer, R.B.A.; Homan, C.D.; Matthijsen, J. Comparison of spatial and temporal variations of aerosol optical thickness and particulate matter over Europe. Atmos. Environ. 2006, 40, 5304–5315. [Google Scholar] [CrossRef]
  4. Hoff, R.M.; Christopher, S.A. Remote Sensing of Particulate Pollution from Space: Have We Reached the Promised Land? J. Air Waste Manag. Assoc. 2009, 59, 645–675. [Google Scholar] [CrossRef] [PubMed]
  5. Kloog, I.; Chudnovsky, A.A.; Just, A.C.; Nordio, F.; Koutrakis, P.; Coull, B.A.; Lyapustin, A.; Wang, Y.; Schwartz, J. A new hybrid spatio-temporal model for estimating daily multi-year PM2.5 concentrations Across Northeastern USA Using High Resolution Aerosol Optical Depth Data. Atmos. Environ. 2014, 95, 581–590. [Google Scholar] [CrossRef] [PubMed] [Green Version]
  6. Sorek-Hamer, M.; Kloog, I.; Koutrakis, P.; Strawa, A.W.; Chatfield, R.; Cohen, A.; Ridgway, W.L.; Broday, D.M. Assessment of PM 2.5 concentrations over bright surfaces using MODIS satellite observations. Remote Sens. Environ. 2015, 163, 180–185. [Google Scholar] [CrossRef]
  7. van Donkelaar, A.; Martin, R.V.; Brauer, M.; Hsu, N.C.; Kahn, R.A.; Levy, R.C.; Lyapustin, A.; Sayer, A.M.; Winker, D.M. Global Estimates of Fine Particulate Matter using a Combined Geophysical-Statistical Method with Information from Satellites, Models, and Monitors. Environ. Sci. Technol. 2016, 50, 3762–3772. [Google Scholar] [CrossRef]
  8. Zaman, N.A.F.K.; Kanniah, K.D.; Kaskaoutis, D.G. Estimating Particulate Matter using satellite based aerosol optical depth and meteorological variables in Malaysia. Atmos. Res. 2017, 193, 142–162. [Google Scholar]
  9. Gupta, P.; Christopher, S.A.; Wang, J.; Gehrig, R.; Lee, Y.; Kumar, N. Satellite remote sensing of particulate matter and air quality assessment over global cities. Atmos. Environ. 2006, 40, 5880–5892. [Google Scholar]
  10. Bohren, C.F.; Clothiaux, E.E. Fundamentals of Atmospheric Radiation: An Introduction with 400 Problems; John Wiley & Sons: Hoboken, NJ, USA, 2008. [Google Scholar]
  11. Kahn, R.A.; Gaitley, B.J.; Garay, M.J.; Diner, D.J.; Eck, T.F.; Smirnov, A.; Holben, B.N. Multiangle Imaging SpectroRadiometer global aerosol product assessment by comparison with the Aerosol Robotic Network. J. Geophys. Res. 2010, 115, D23209. [Google Scholar] [CrossRef]
  12. Franklin, M.; Chau, K.; Kalashnikova, O.; Garay, M.; Enebish, T.; Sorek-Hamer, M. Using Multi-Angle Imaging SpectroRadiometer Aerosol Mixture Properties for Air Quality Assessment in Mongolia. Remote Sens. 2018, 10, 1317. [Google Scholar] [CrossRef] [Green Version]
  13. Franklin, M.; Kalashnikova, O.V.; Garay, M.J.; Fruin, S. Characterization of Subgrid-Scale Variability in Particulate Matter with Respect to Satellite Aerosol Observations. Remote Sens. 2018, 10, 623. [Google Scholar] [CrossRef] [Green Version]
  14. Meng, X.; Garay, M.J.; Diner, D.J.; Kalashnikova, O.V.; Xu, J.; Liu, Y. Estimating PM2.5 speciation concentrations using prototype 4.4km-resolution MISR aerosol properties over Southern California. Atmos. Environ. 2018, 181, 70–81. [Google Scholar] [CrossRef] [PubMed]
  15. Kahn, R.A.; Gaitley, B.J. An analysis of global aerosol type as retrieved by MISR. J. Geophys. Res. Atmos. 2015, 120, 4248–4281. [Google Scholar] [CrossRef]
  16. Diner, D.J.; Boland, S.W.; Brauer, M.; Bruegge, C.; Burke, K.A.; Chipman, R.; Di Girolamo, L.; Garay, M.J.; Hasheminassab, S.; Hyer, E. Advances in multiangle satellite remote sensing of speciated airborne particulate matter and association with adverse health effects: From MISR to MAIA. J. Appl. Remote Sens. 2018, 12, 42603. [Google Scholar] [CrossRef] [Green Version]
  17. Martonchik, J.V. Comparison of MISR and AERONET aerosol optical depths over desert sites. Geophys. Res. Lett. 2004, 31. [Google Scholar] [CrossRef] [Green Version]
  18. Diner, D.J.; Abdou, W.A.; Bruegge, C.J.; Conel, J.E.; Crean, K.A.; Gaitley, B.J.; Helmlinger, M.C.; Kahn, R.A.; Martonchik, J.V.; Pilorz, S.H.; et al. MISR aerosol optical depth retrievals over southern Africa during the SAFARI-2000 Dry Season Campaign. Geophys. Res. Lett. 2001, 28, 3127–3130. [Google Scholar] [CrossRef]
  19. Qi, Y.; Ge, J.; Huang, J. Spatial and temporal distribution of MODIS and MISR aerosol optical depth over northern China and comparison with AERONET. Chinese Sci. Bull. 2013, 58, 2497–2506. [Google Scholar] [CrossRef] [Green Version]
  20. Kahn, R.A.; Garay, M.J.; Nelson, D.L.; Levy, R.C.; Bull, M.A.; Diner, D.J.; Martonchik, J.V.; Hansen, E.G.; Remer, L.A.; Tanré, D. Response to “Toward unified satellite climatology of aerosol properties. 3. MODIS versus MISR versus AERONET. J. Quant. Spectrosc. Radiat. Transf. 2011, 112, 901–909. [Google Scholar] [CrossRef] [Green Version]
  21. Moon, T.; Wang, Y.; Liu, Y.; Yu, B. Evaluation of a MISR-Based High-Resolution Aerosol Retrieval Method Using AERONET DRAGON Campaign Data. IEEE Trans. Geosci. Remote Sens. 2015, 53, 4328–4339. [Google Scholar] [CrossRef]
  22. Giles, D.M.; Sinyuk, A.; Sorokin, M.G.; Schafer, J.S.; Smirnov, A.; Slutsker, I.; Eck, T.F.; Holben, B.N.; Lewis, J.R.; Campbell, J.R.; et al. Advancements in the Aerosol Robotic Network (AERONET) Version 3 database —automated near-real-time quality control algorithm with improved cloud screening for Sun photometer aerosol optical depth (AOD) measurements. Atmos. Meas. Tech. 2019, 12, 169–209. [Google Scholar] [CrossRef] [Green Version]
  23. Holben, B.N.; Tanré, D.; Smirnov, A.; Eck, T.F.; Slutsker, I.; Abuhassan, N.; Newcomb, W.W.; Schafer, J.S.; Chatenet, B.; Lavenu, F.; et al. An emerging ground-based aerosol climatology: Aerosol optical depth from AERONET. J. Geophys. Res. 2001, 106, 12067–12097. [Google Scholar] [CrossRef]
  24. Holben, B.N.; Kim, J.; Sano, I.; Mukai, S.; Eck, T.F.; Giles, D.M.; Schafer, J.S.; Sinyuk, A.; Slutsker, I.; Smirnov, A.; et al. An overview of mesoscale aerosol processes, comparisons, and validation studies from DRAGON networks. Atmos. Chem. Phys. 2018, 18, 655–671. [Google Scholar] [CrossRef] [Green Version]
  25. Garay, M.J.; Kalashnikova, O.V.; Bull, M.A. Development and assessment of a higher-spatial-resolution (4.4 km) MISR aerosol optical depth productusing AERONET-DRAGON data. Atmos. Chem. Phys. 2017, 17, 5095–5106. [Google Scholar] [CrossRef] [Green Version]
  26. Sawamura, P.; Moore, R.H.; Burton, S.P.; Chemyakin, E.; Müller, D.; Kolgotin, A.; Ferrare, R.A.; Hostetler, C.A.; Ziemba, L.D.; Beyersdorf, A.J.; et al. HSRL-2 aerosol optical measurements and microphysical retrievals vs. airborne in situ measurements during DISCOVER-AQ 2013: An intercomparison study. Atmos. Chem. Phys 2017, 17, 7229–7243. [Google Scholar] [CrossRef] [Green Version]
  27. Seo, S.; Kim, J.; Lee, H.; Jeong, U.; Kim, W.; Holben, B.N.; Kim, S.W.; Song, C.H.; Lim, J.H. Estimation of PM10 concentrations over Seoul using multiple empirical models with AERONET and MODIS data collected during the DRAGON-Asia campaign. Atmos. Chem. Phys. 2015, 15, 319–334. [Google Scholar] [CrossRef] [Green Version]
  28. Eck, T.F.; Holben, B.N.; Schafer, J.; Giles, D.M.; Kim, J.; Kim, Y.J.; Reid, J.S.; Pickering, K.E.; Crawford, J.H.; Sinyuk, A.; et al. Observations of the Interaction of Aerosols with Cloud or Fog during DRAGON Campaigns from AERONET Ground-Based Remote Sensing. In Proceedings of the European Geosciences Union General Assembly 2014, Vienna, Austria, 27 April–2 May 2014. [Google Scholar]
  29. Stafoggia, M.; Schwartz, J.; Badaloni, C.; Bellander, T.; Alessandrini, E.; Cattani, G.; De Donato, F.; Gaeta, A.; Leone, G.; Lyapustin, A.; et al. Estimation of daily PM10 concentrations in Italy (2006-2012) using finely resolved satellite data, land use variables and meteorology. Environ. Int. 2017, 99, 234–244. [Google Scholar] [CrossRef]
  30. Gupta, P.; Christopher, S.A. Particulate matter air quality assessment using integrated surface, satellite, and meteorological products: Multiple regression approach. J. Geophys. Res. Atmos. 2009, 114, 14205. [Google Scholar] [CrossRef] [Green Version]
  31. Eck, T.F.; Holben, B.N.; Reid, J.S.; Dubovik, O.; Smirnov, A.; O’Neill, N.T.; Slutsker, I.; Kinne, S. Wavelength dependence of the optical depth of biomass burning, urban, and desert dust aerosols. J. Geophys. Res. 1999, 104, 31333–31349. [Google Scholar] [CrossRef]
  32. Li, Q.; Li, C.; Mao, J. Evaluation of Atmospheric Aerosol Optical Depth Products at Ultraviolet Bands Derived from MODIS Products. Aerosol Sci. Technol. 2012, 46, 1025–1034. [Google Scholar] [CrossRef] [Green Version]
  33. Garay, M.J.; Witek, M.L.; Kahn, R.A.; Seidel, F.C.; Limbacher, J.A.; Bull, M.A.; Diner, D.J.; Hansen, E.G.; Kalashnikova, O.V.; Lee, H.; et al. Introducing the 4.4 km spatial resolution MISR aerosol product. AMT 2019. [Google Scholar] [CrossRef]
  34. Witek, M.L.; Garay, M.J.; Diner, D.J.; Bull, M.A.; Seidel, F.C. New approach to the retrieval of AOD and its uncertainty from MISR observations over dark water. Atmos. Meas. Tech. 2018, 11, 429–439. [Google Scholar] [CrossRef] [Green Version]
  35. Hastie, T.; Tibshirani, R.; Friedman, J. The Elements of Statistical Learning: Data Mining, Inference, and Prediction, 2nd ed.; Springer: Berlin, Germany, 2009. [Google Scholar]
  36. Wood, S.N.; Pya, N.; Säfken, B. Smoothing Parameter and Model Selection for General Smooth Models. J. Am. Stat. Assoc. 2016, 111, 1548–1563. [Google Scholar] [CrossRef]
  37. Sorek-Hamer, M.; Strawa, A.W.; Chatfield, R.B.; Esswein, R.; Cohen, A.; Broday, D.M. Improved retrieval of PM2.5 from satellite data products using non-linear methods. Environ. Pollut. 2013, 182, 417–423. [Google Scholar] [CrossRef] [PubMed]
  38. Strawa, A.W.; Chatfield, R.B.; Legg, M.; Scarnato, B.; Esswein, R. Improving retrievals of regional fine particulate matter concentrations from Moderate Resolution Imaging Spectroradiometer (MODIS) and Ozone Monitoring Instrument (OMI) multisatellite observations. J. Air Waste Manag. Assoc. 2013, 63, 1434–1446. [Google Scholar] [CrossRef] [PubMed]
  39. Shaddick, G.; Thomas, M.L.; Green, A.; Brauer, M.; van Donkelaar, A.; Burnett, R.; Chang, H.H.; Cohen, A.; Van Dingenen, R.; Dora, C.; et al. Data integration model for air quality: A hierarchical approach to the global estimation of exposures to ambient air pollution. J. R. Stat. Soc. Ser. C Appl. Stat. 2018, 67, 231–253. [Google Scholar] [CrossRef]
Figure 1. Aerosol Robotic Network (AERONET) sites (black circles) and co-located PM2.5 sites (red circles) during the Distributed Regional Aerosol Gridded Observation Networks (DRAGON) campaign over Central Valley, CA, USA. Long-term Air Quality System (AQS) PM2.5 sites (blue circles) have available data since 2002 onwards.
Remotesensing 12 00685 g001
Figure 2. Methodology flowchart for calibration model development. Top: Stage 1—calibration models using only AERONET Aerosol Optical Depth (AOD) and Environmental Protection Agency (EPA) PM2.5 data, Bottom: Stage 2—apply calibration models to convert Multiangle Imaging Spectroradiometer (MISR) AOD to PM2.5 concentrations.
Remotesensing 12 00685 g002
Figure 3. Linear regression (baseline model) between the observed daily PM2.5 concentrations and (a) AERONET AOD 550 nm; (b) MISR AOD 550 nm. The blue line represents the regression line.
Remotesensing 12 00685 g003
Figure 4. Correlation between the observed PM2.5 concentrations and the modeled PM2.5 concentrations resulted from Model 3 (a) calibration with AERONET datasets and (b) evaluation with MISR datasets. The blue line represents the 1:1 line between the observed and modeled variables.
Remotesensing 12 00685 g004
Figure 5. Map of Central Valley, CA with predicted PM2.5 concentrations from applying AERONET-DRAGON calibration Model 3 to MISR AOD 550 nm (4.4 km grid), and observed mean PM2.5 concentrations (for the whole DRAGON campaign period) at 8 EPA AQS sites (dots).
Remotesensing 12 00685 g005
Figure 6. Spatial distribution of DRAGON AERONET—PM2.5 calibration model error (RMSE) from the (a) baseline model; and (b) Model 3.
Remotesensing 12 00685 g006
Figure 7. Stage 1 model fit (R-squared and RMSE) for calibration models fit on each DRAGON AERONET-PM2.5 site (a,b); and Stage 2 evaluation of these models by site on MISR data during the DRAGON field campaign (c,d). X-axes in all figures are sorted geographically from South (Bakersfield) to North (Madera city). (a) R2 for different DRAGON-AERONET calibration models by site; (b) Estimated validation error (RMSE) for different DRAGON-AERONET calibration models by site; (c) Results of applying different statistical DRAGON-AERONET-based models by site on MISR data (R2); (d) Estimated evaluation error (RMSE) from applying different statistical DRAGON-AERONET-based models by site on MISR data.
Remotesensing 12 00685 g007aRemotesensing 12 00685 g007b
Figure 8. R2 ((a), solid) and RMSE ((b), dotted) from the baseline linear and non-linear calibration models fitted on data from the long-term AQS-AERONET sites in Central Valley, CA, showing AOD-PM2.5 models (black), and application to MISR AOD data (red).
Remotesensing 12 00685 g008
Figure 9. Baseline (top) and Model 4 (middle) calibration models for Bakersfield (N = 249, left) and Fresno (N = 3023, right) showing RMSE (g/m3) by site between observed PM2.5 and the MISR-predicted PM2.5; RMSE (g/m3) ordered by distance from the calibration site are shown in the lower panel.
Remotesensing 12 00685 g009
Table 1. Summary statistics of AOD from DRAGON-AERONET sites co-located with PM2.5 from EPA AQS monitors for the whole DRAGON campaign period 11/2012–4/2013. The correlation coefficient is between AOD and PM2.5, per site.
Site NameLatitudeLongitudeN *Mean/Max AODMean/Max PM2.5 (μg/m3)Correlation Coefficient
(R)
Bakersfield35.33−119.0350.13/0.5521.9/72.70.766
Porterville36.03−119.1230.14/0.5526.7/63.90.759
Corcoran36.10−119.6170.12/0.3124.1/54.30.686
Tranquility36.63−120.4380.10/0.2813.2/35.70.681
Clovis36.82−119.7660.11/0.3120.6/50.10.626
Hanford36.32−119.6430.14/0.5126.7/53.20.447
Madera City36.95−120.0490.10/0.2619.1/35.20.432
Fresno36.79−119.8300.11/0.2627.8/44.60.245
* Number of co-located AOD-PM2.5 observations.
Table 2. Stage 1 DRAGON AERONET—PM2.5 and Stage 2 MISR—PM2.5 model performance results.
Calibration
(AERONET Data)
Evaluation
(MISR Data)
Model NameModel DescriptionR2RMSE [μg/m3]MAB [μg/m3]R2RMSE [μg/m3]MAB [μg/m3]
BaselineLinear Regression0.3510.383.2 × 10−160.3710.60−1.47
Model 1GAM AOD0.409.931.8 × 10−140.3410.83−1.39
Model 2GAM w/spatiotemporal tensor product0.657.625.3 × 10−150.608.46−1.29
Model 3GAM w/spatiotemporal separated 0.657.58−1.5 × 10−140.608.42−1.31
Model 4GAM w/temporal only0.628.30−1.6 × 10−140.618.96−1.24
Model 5GAM w/spatial only0.459.545.2 × 10−140.4410.86−1.61
Table 3. Summary statistics between AOD and PM2.5 at long-term co-located AERONET-AQS sites.
Site NameNumber of obs.Correlation Coefficient (R)
Bakersfield2490.31
Fresno30230.47
* Modesto5340.37
* This site is located in Central Valley, CA, but was not included in the DRAGON campaign.