Historical Aerial Surveys Map Long-Term Changes of Forest Cover and Structure in the Central Congo Basin

 ,
,  , , , , ,
  and
and
Abstract

1. Introduction
2. Methods
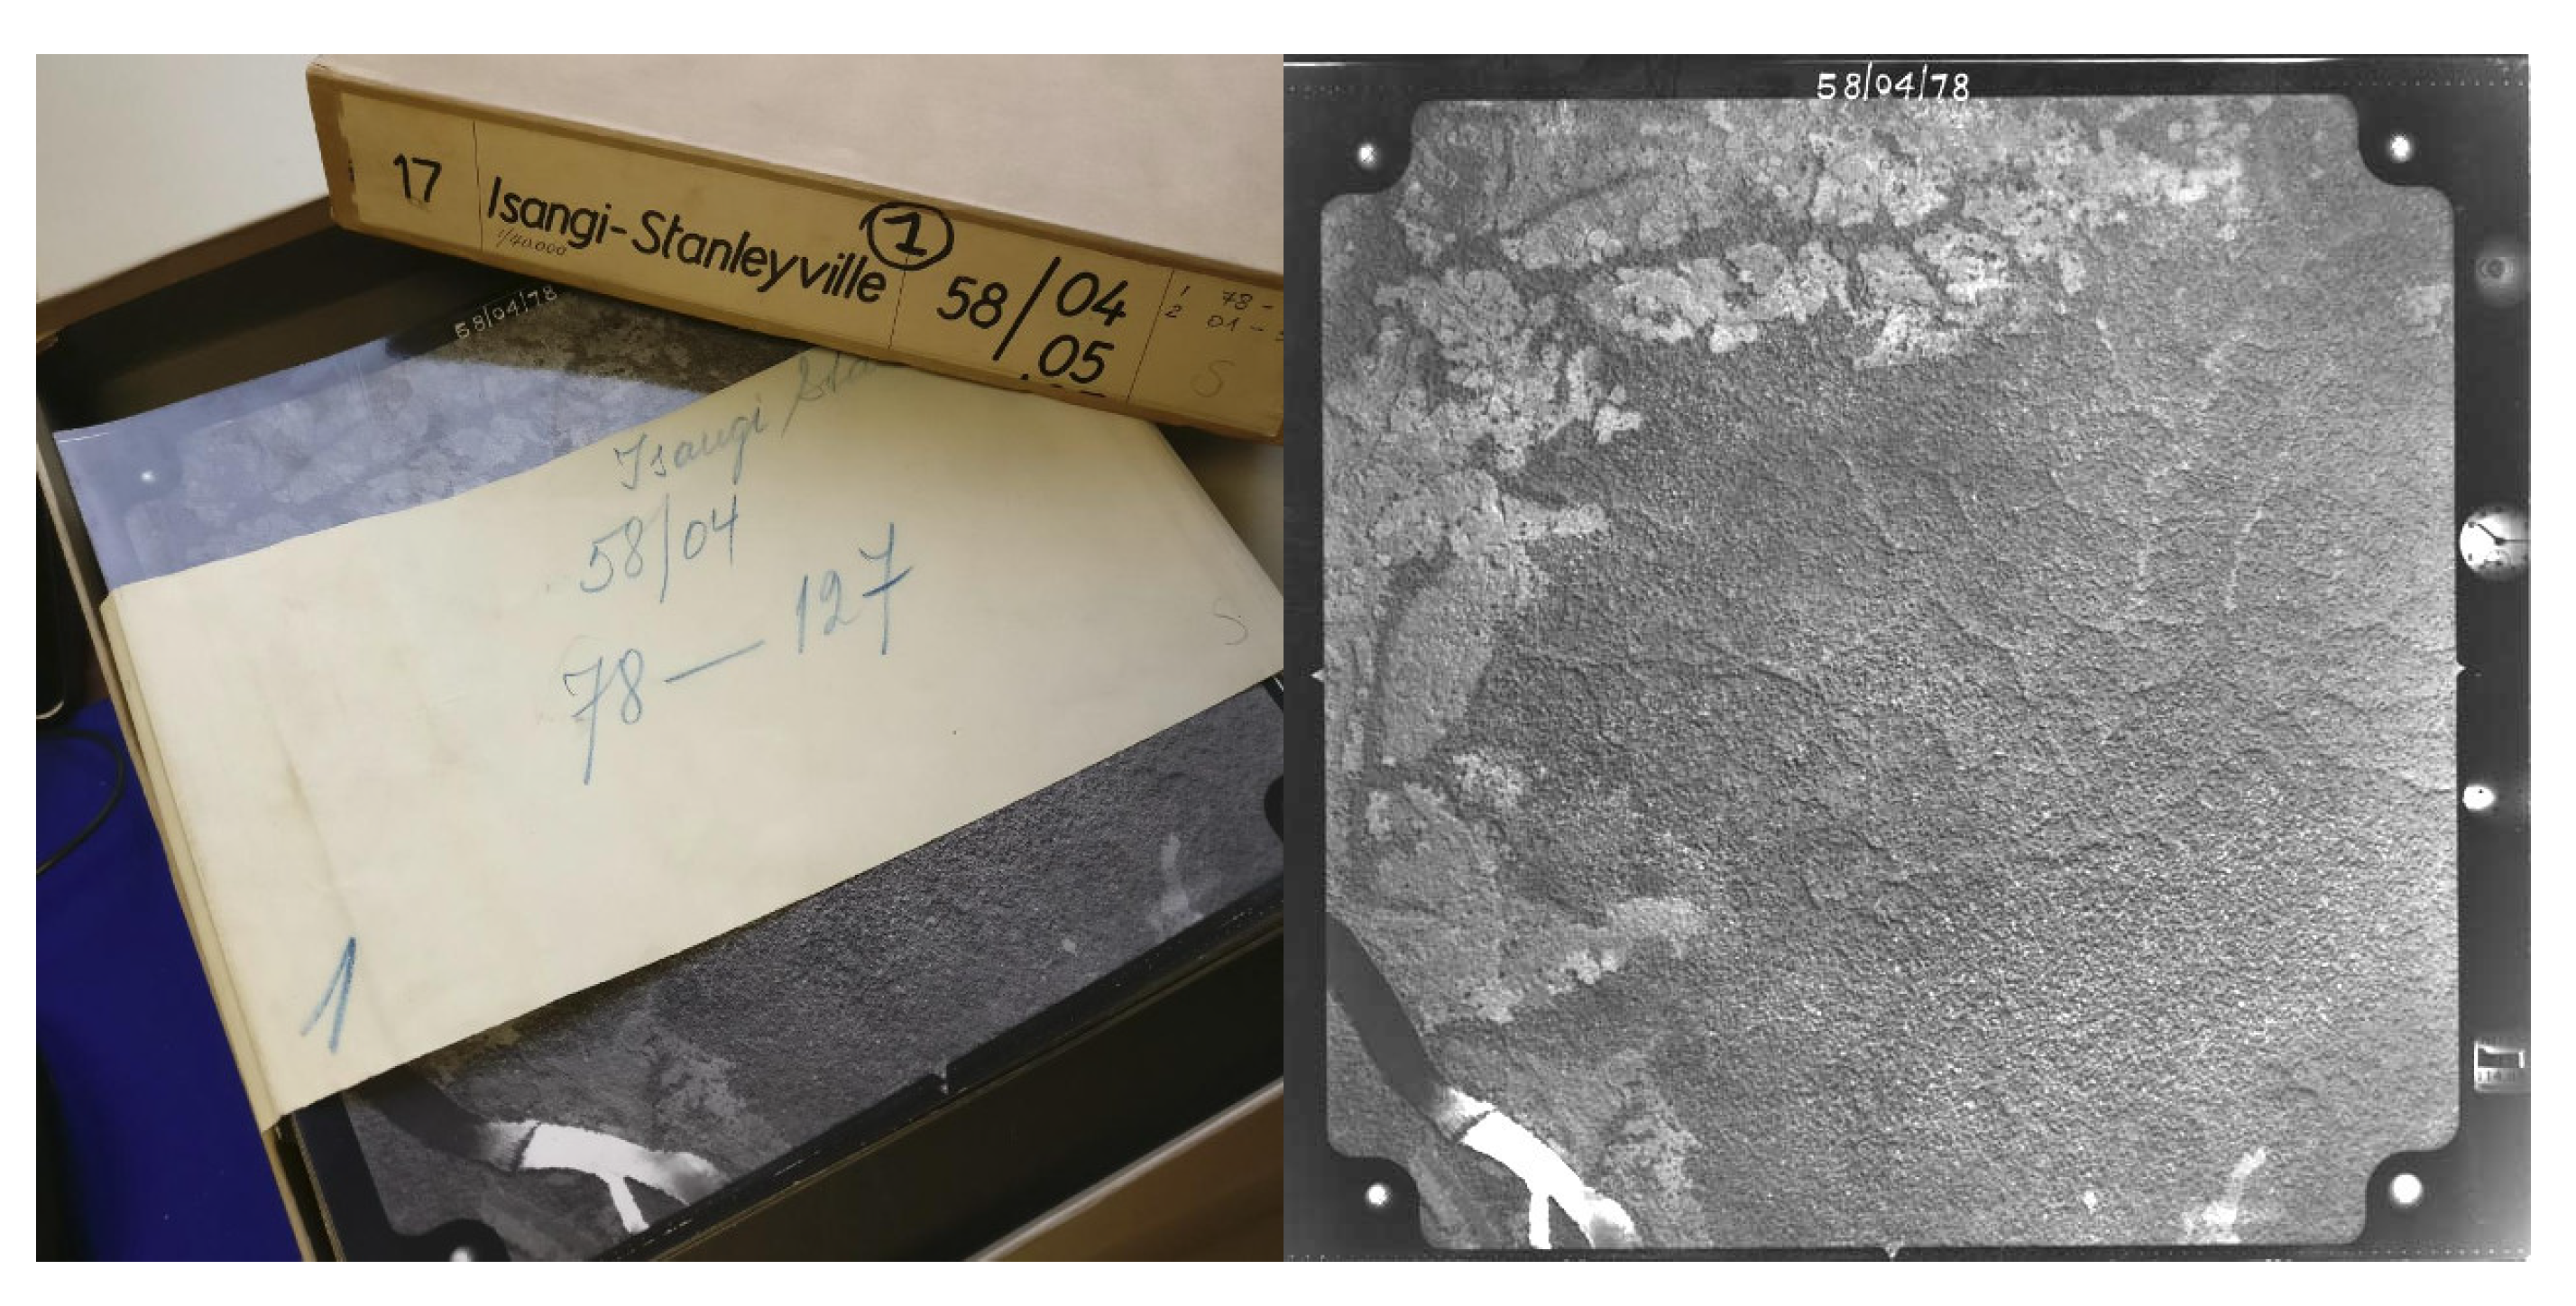
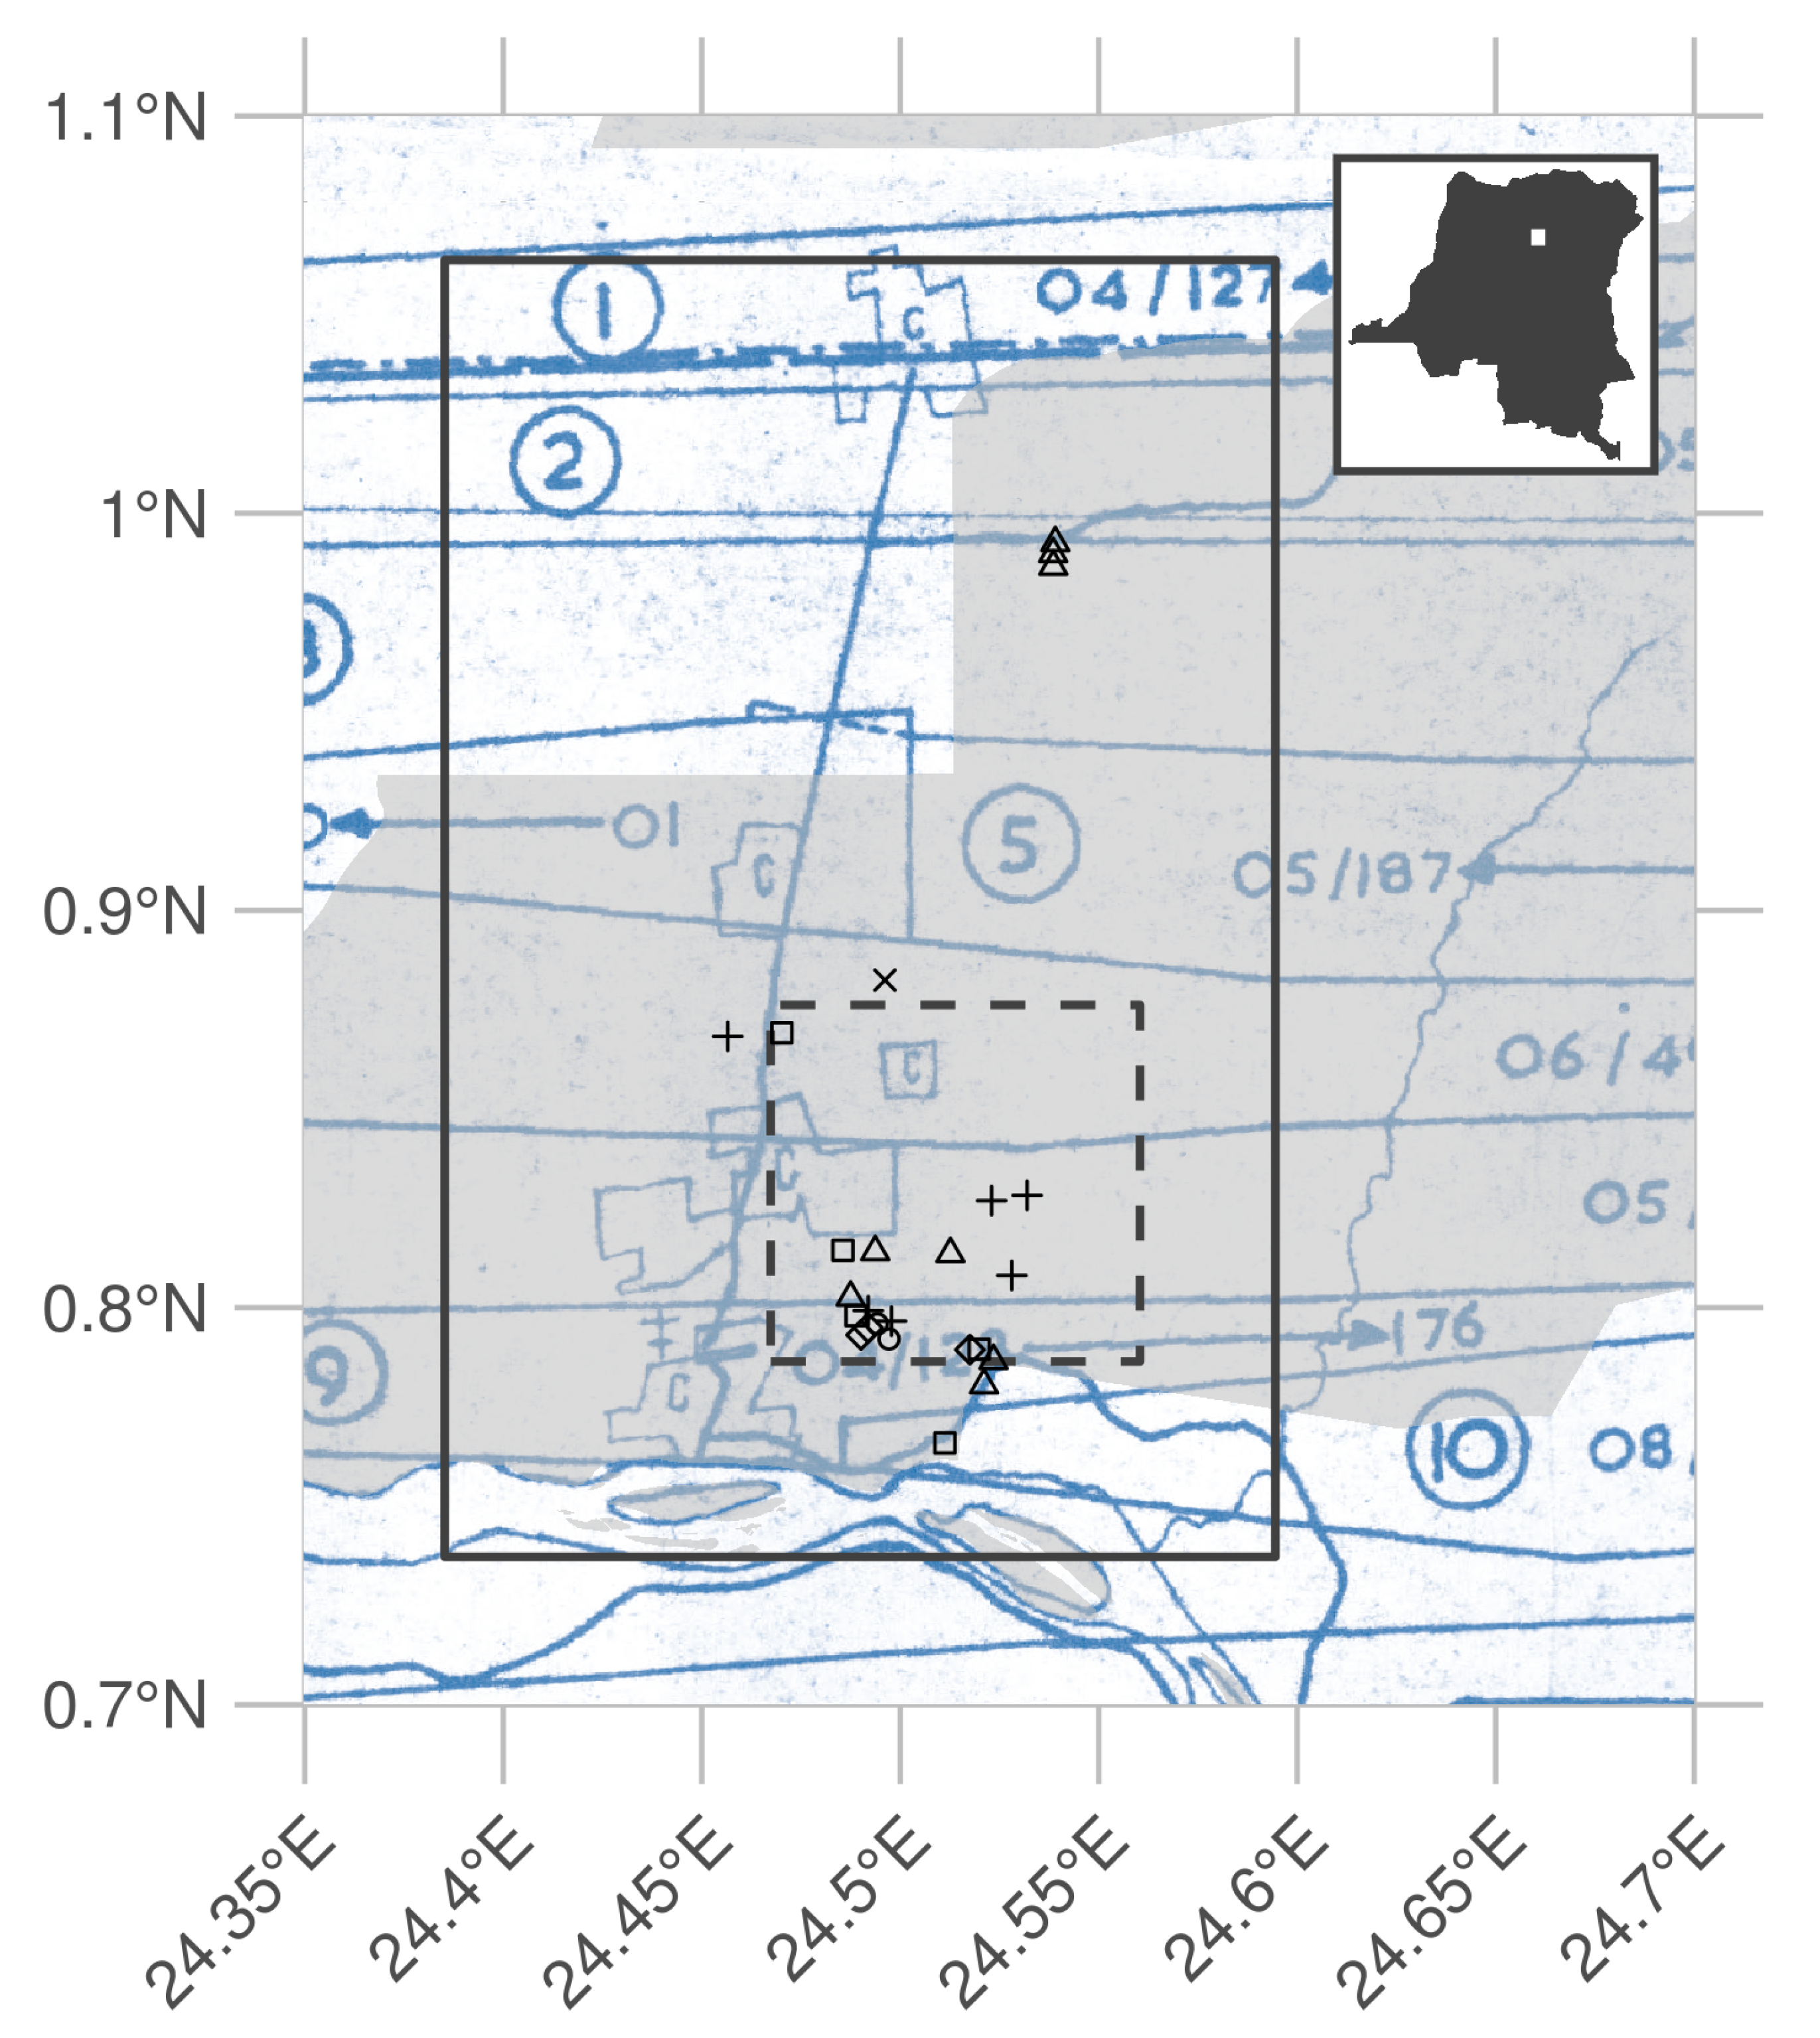
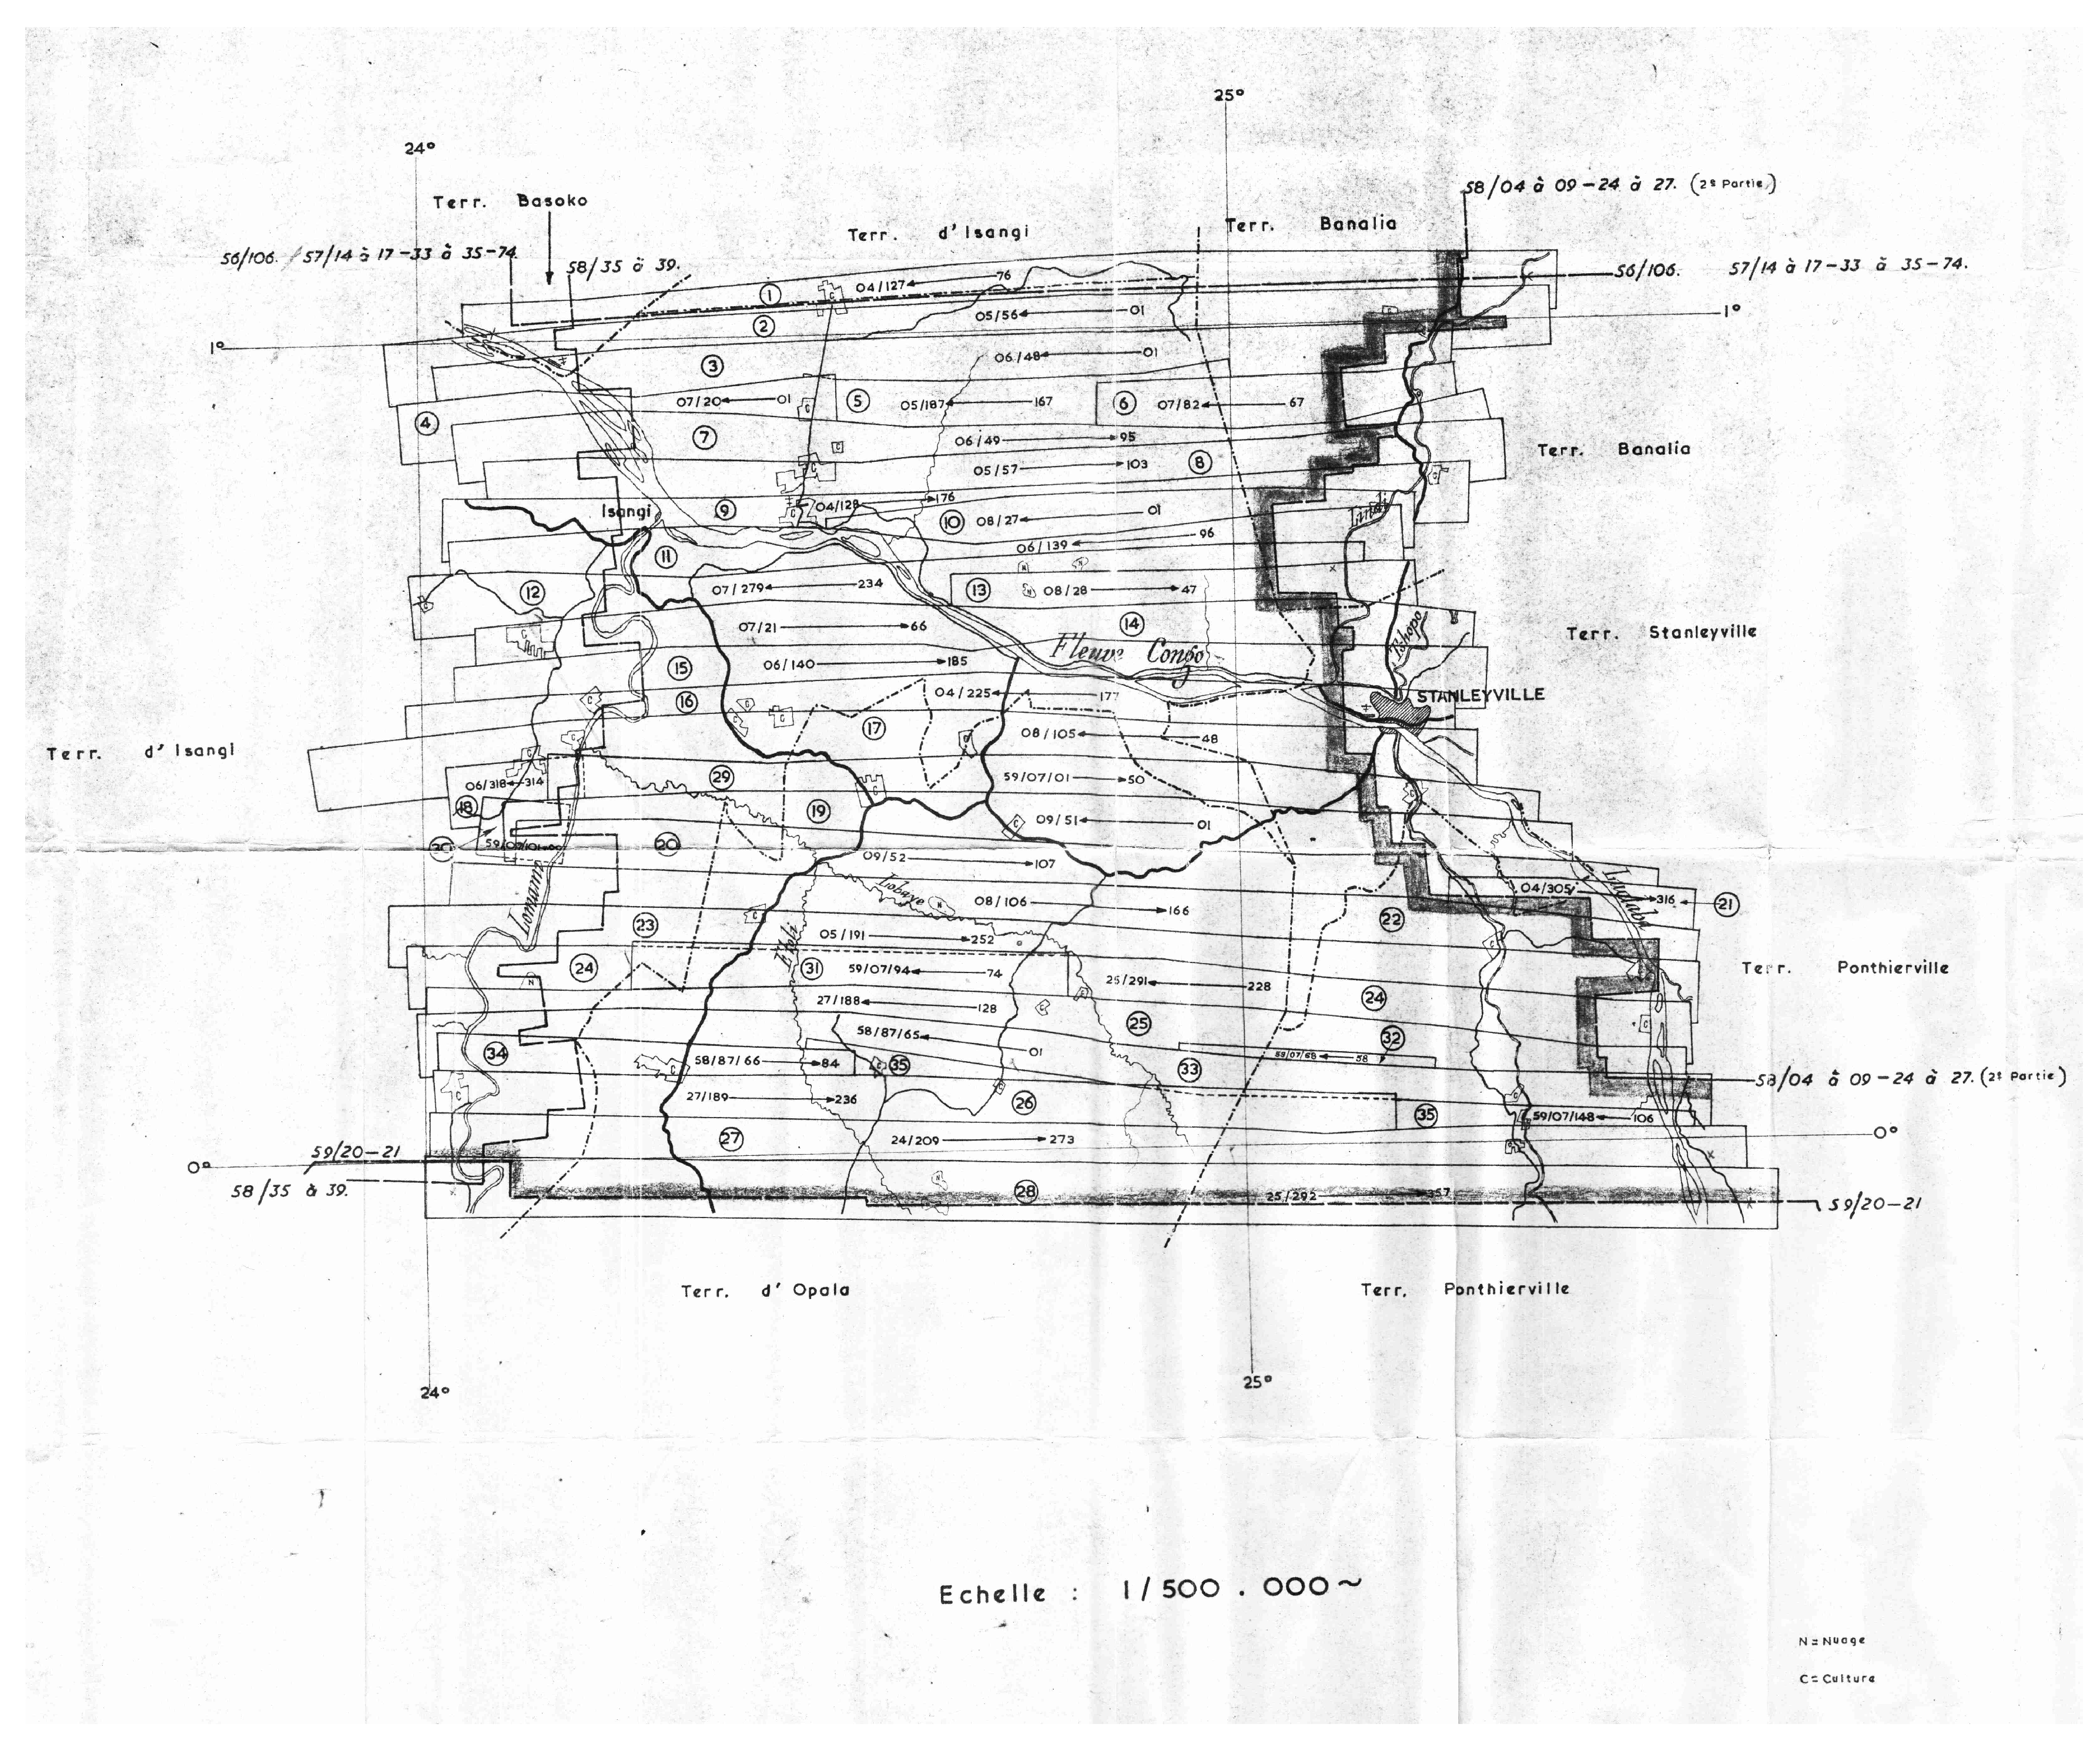
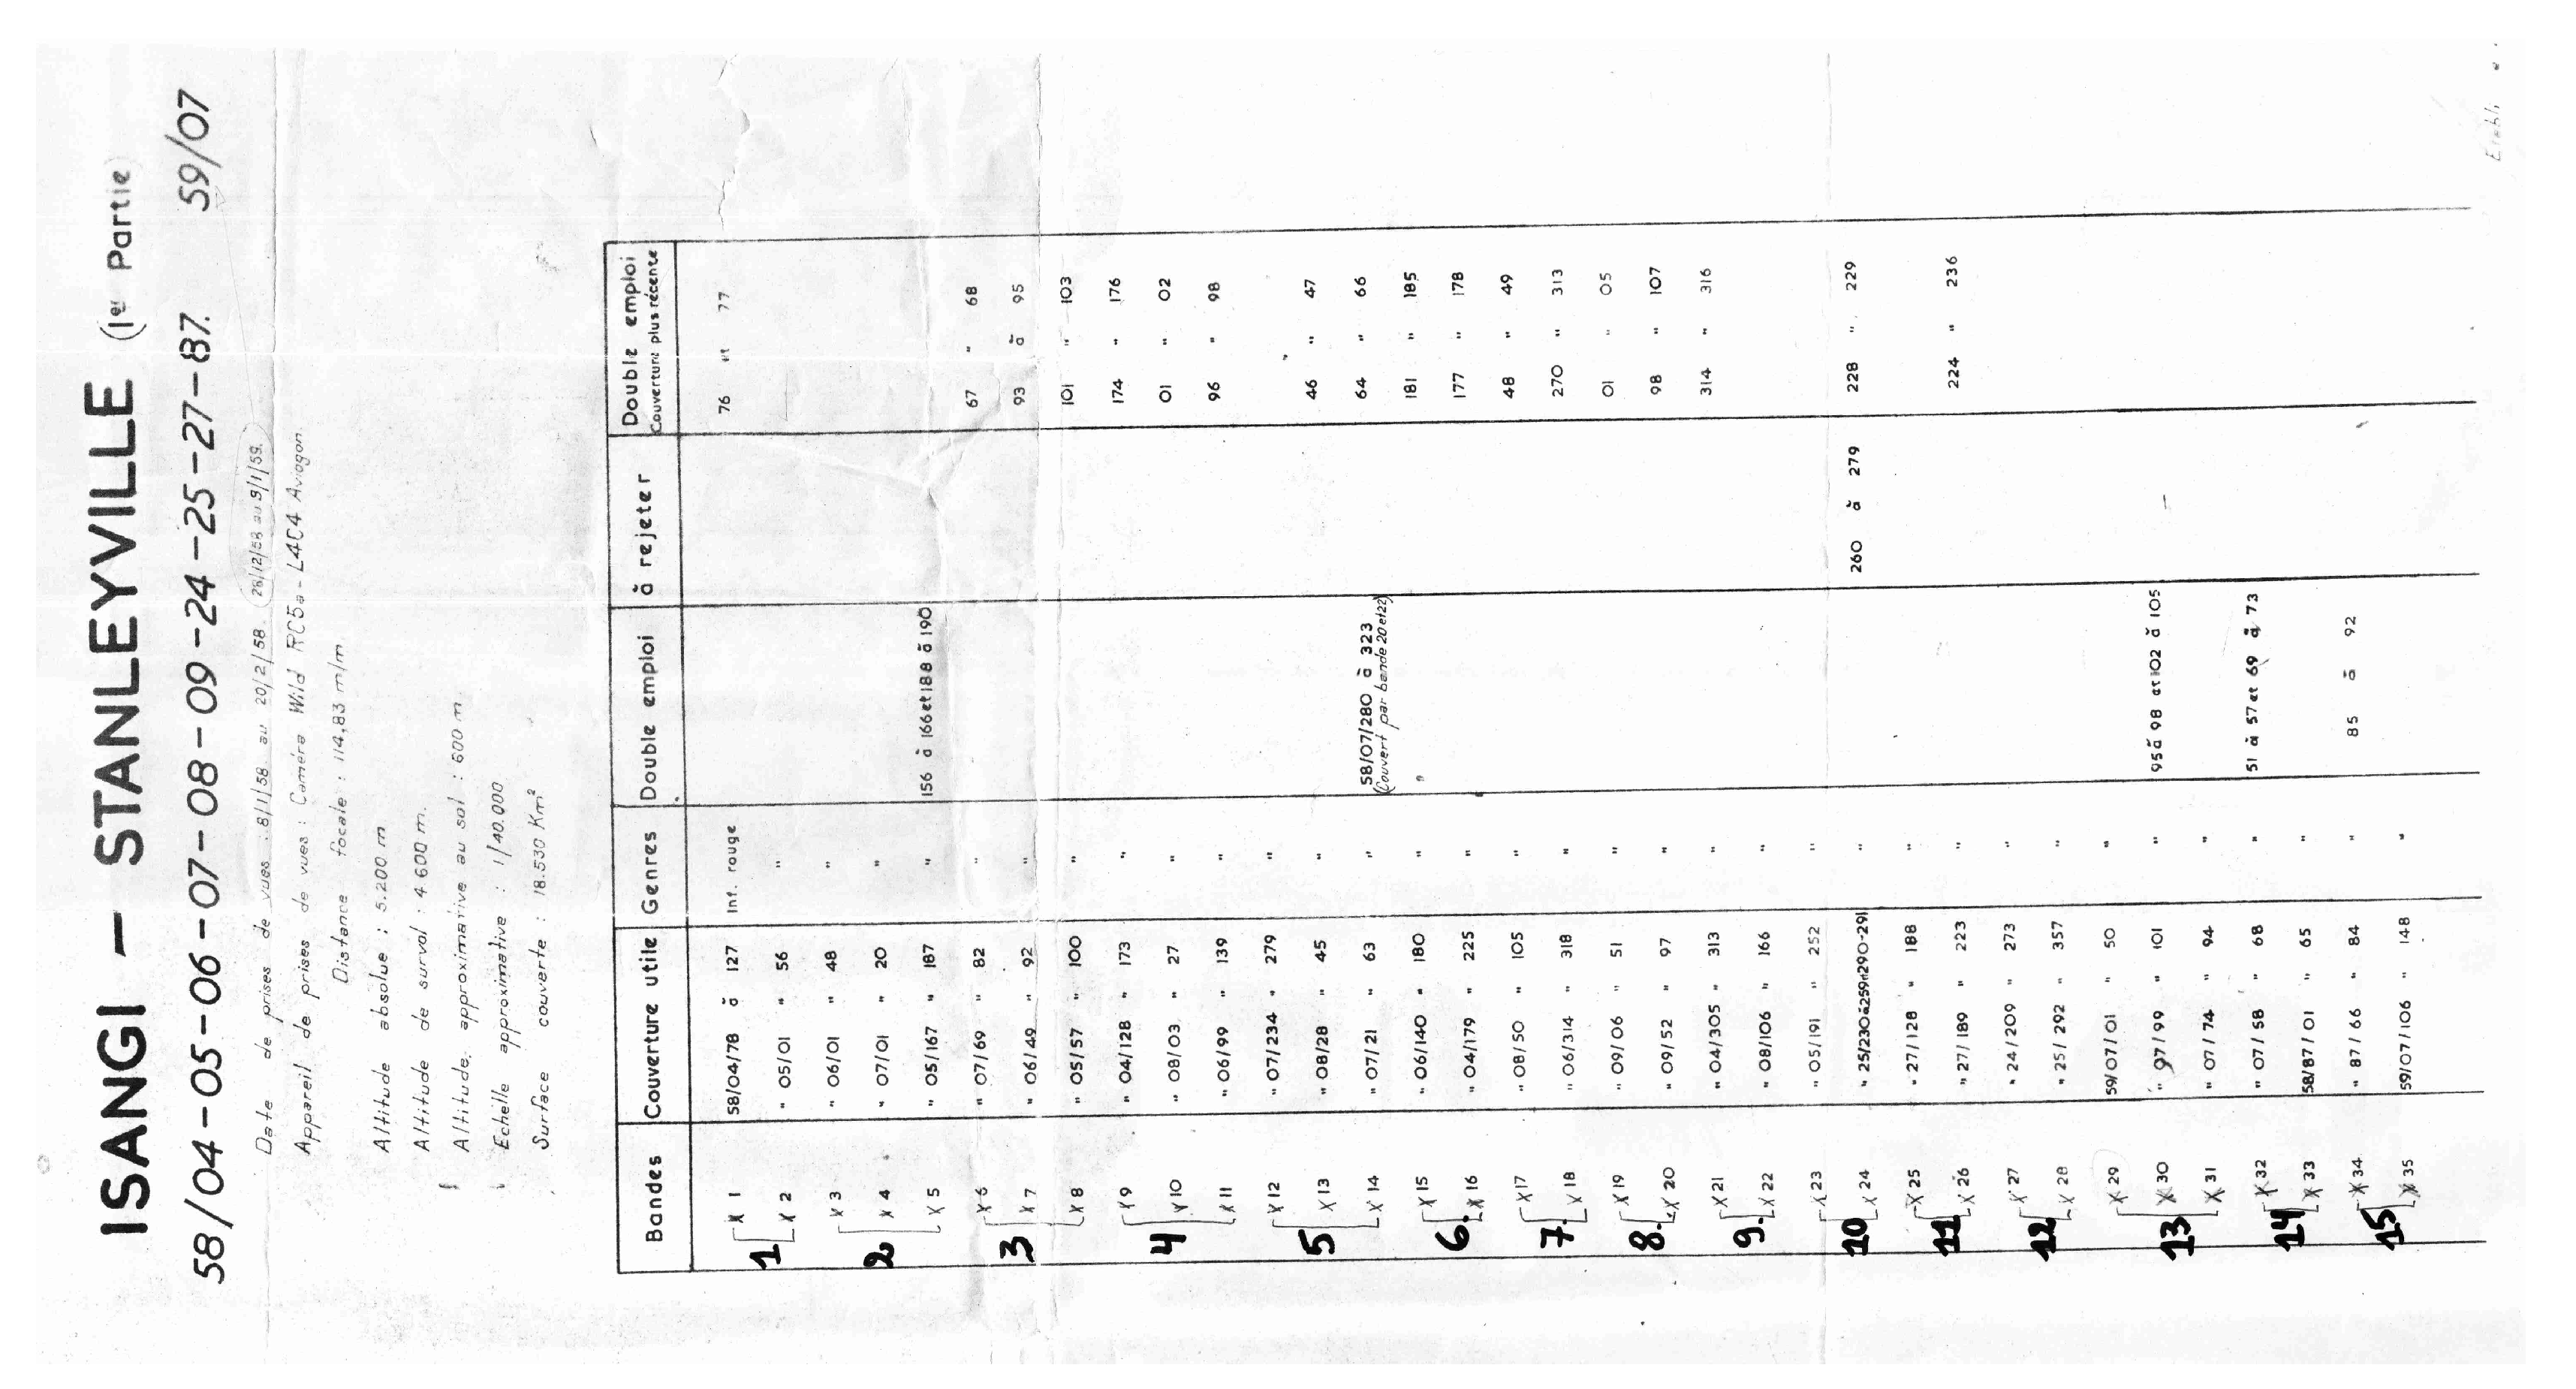
2.1. Historical Data Acquisition
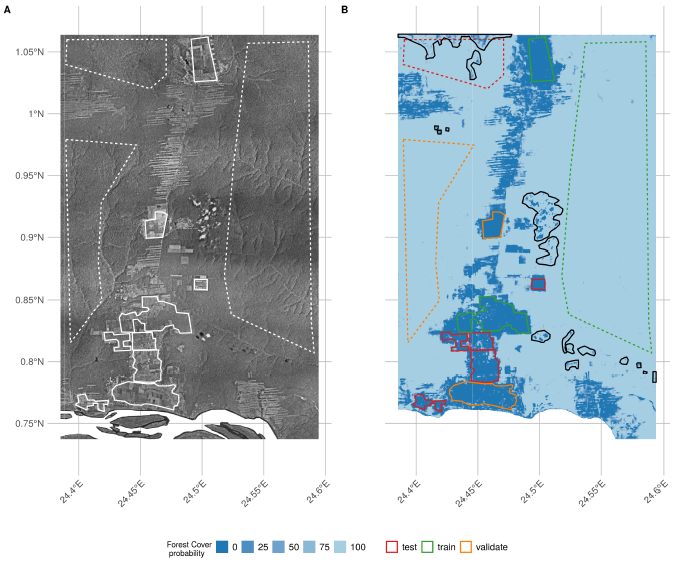
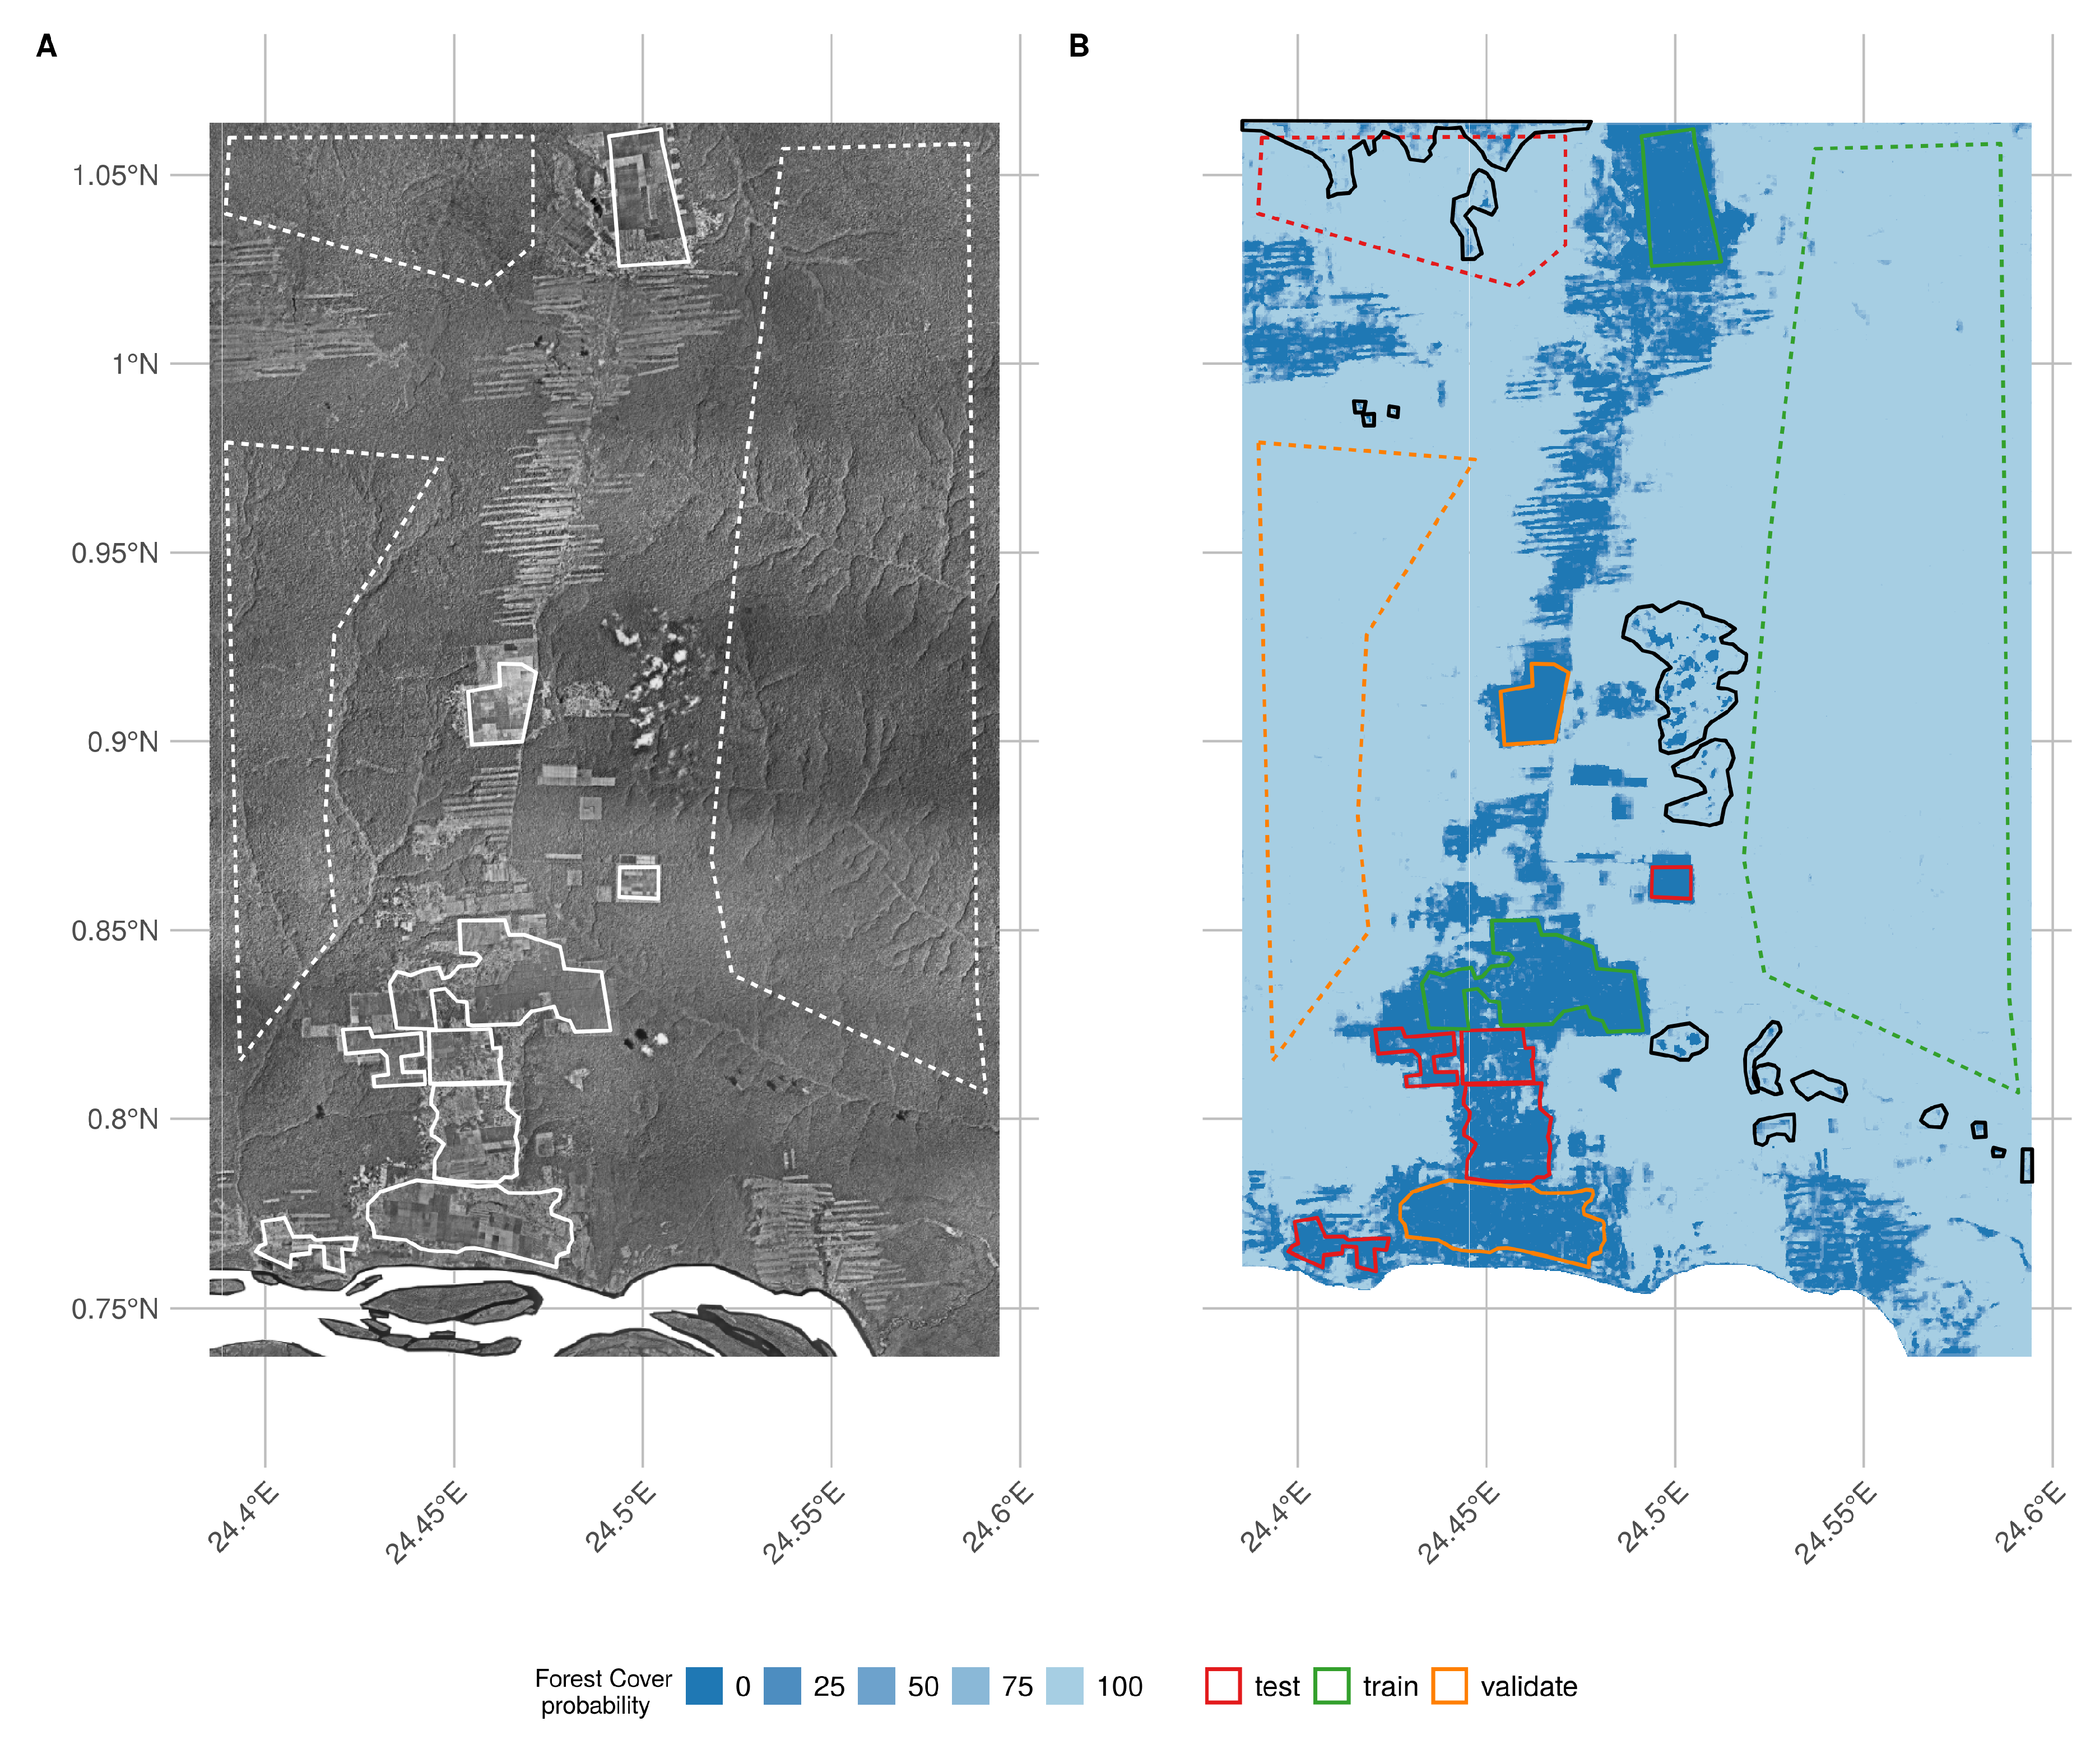
2.2. Site Selection
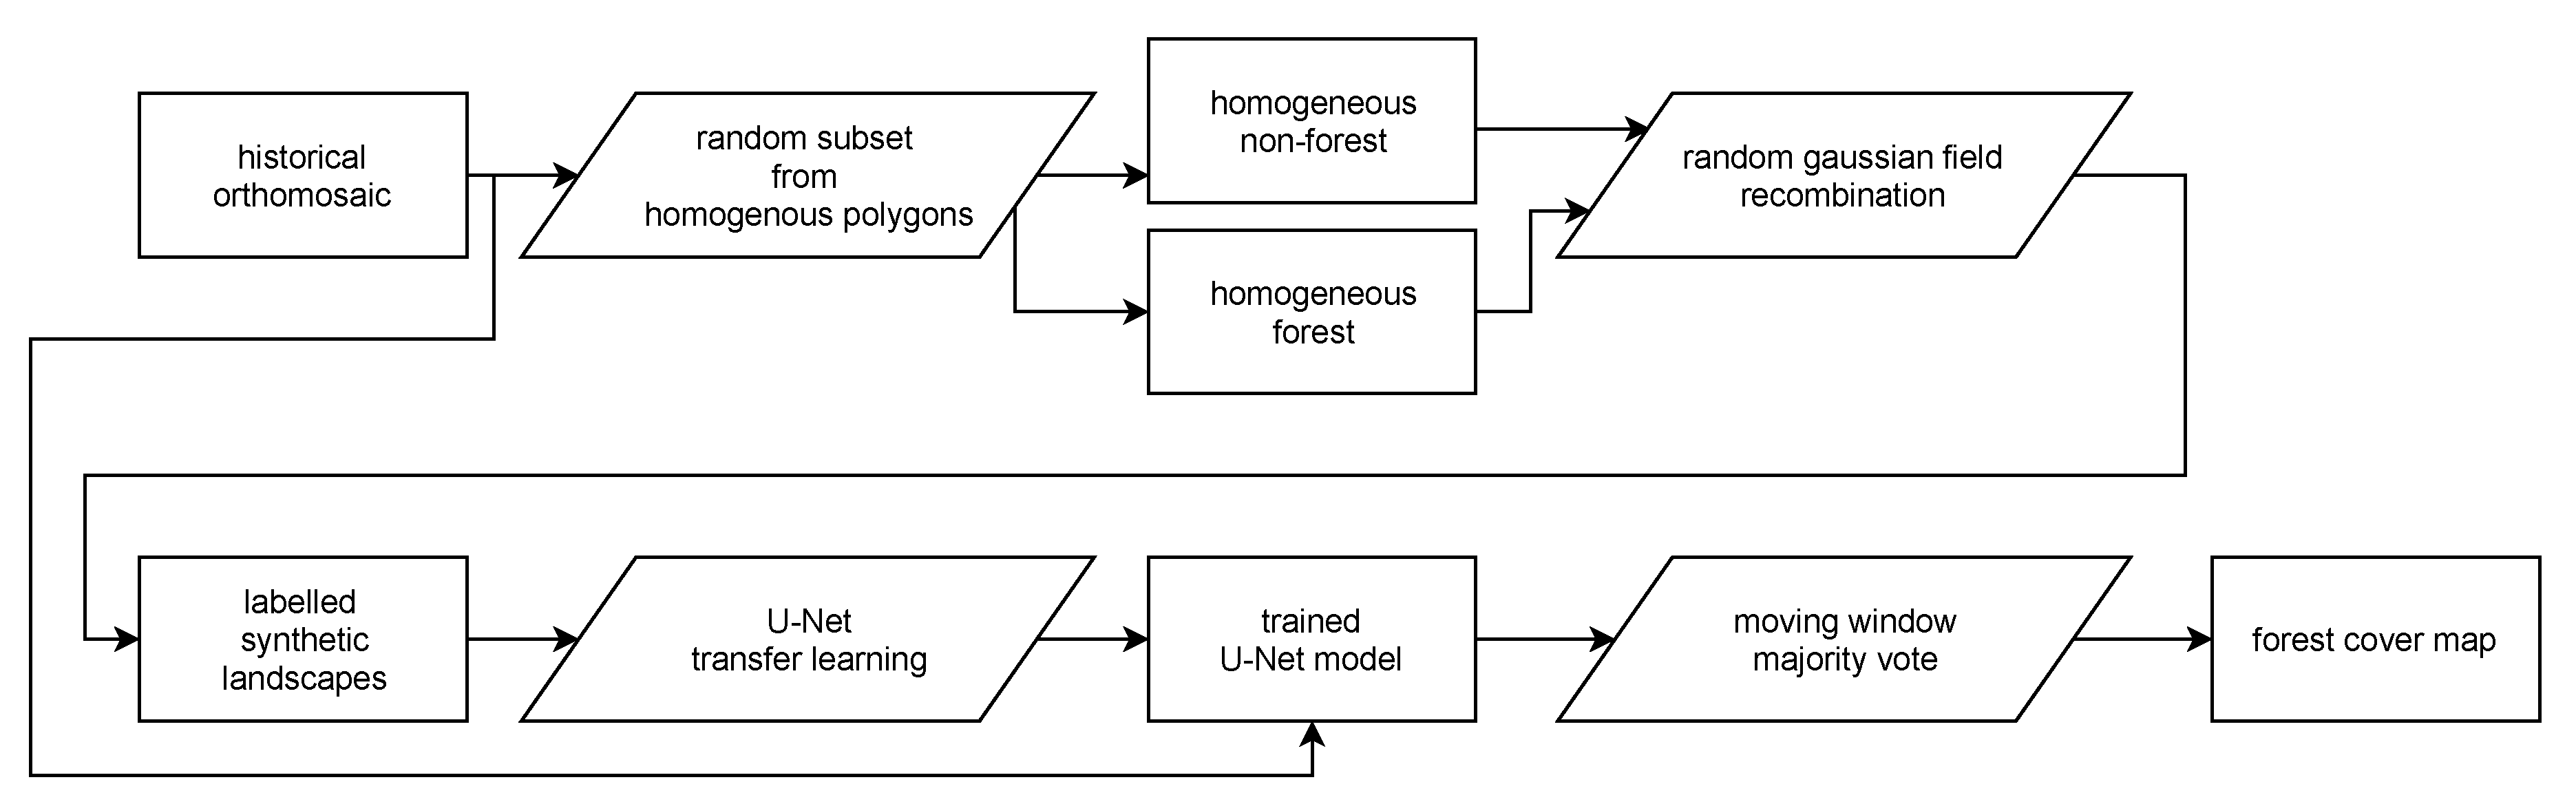
2.3. Digitization and Data Processing
2.4. Land-Use and Land-Cover Change
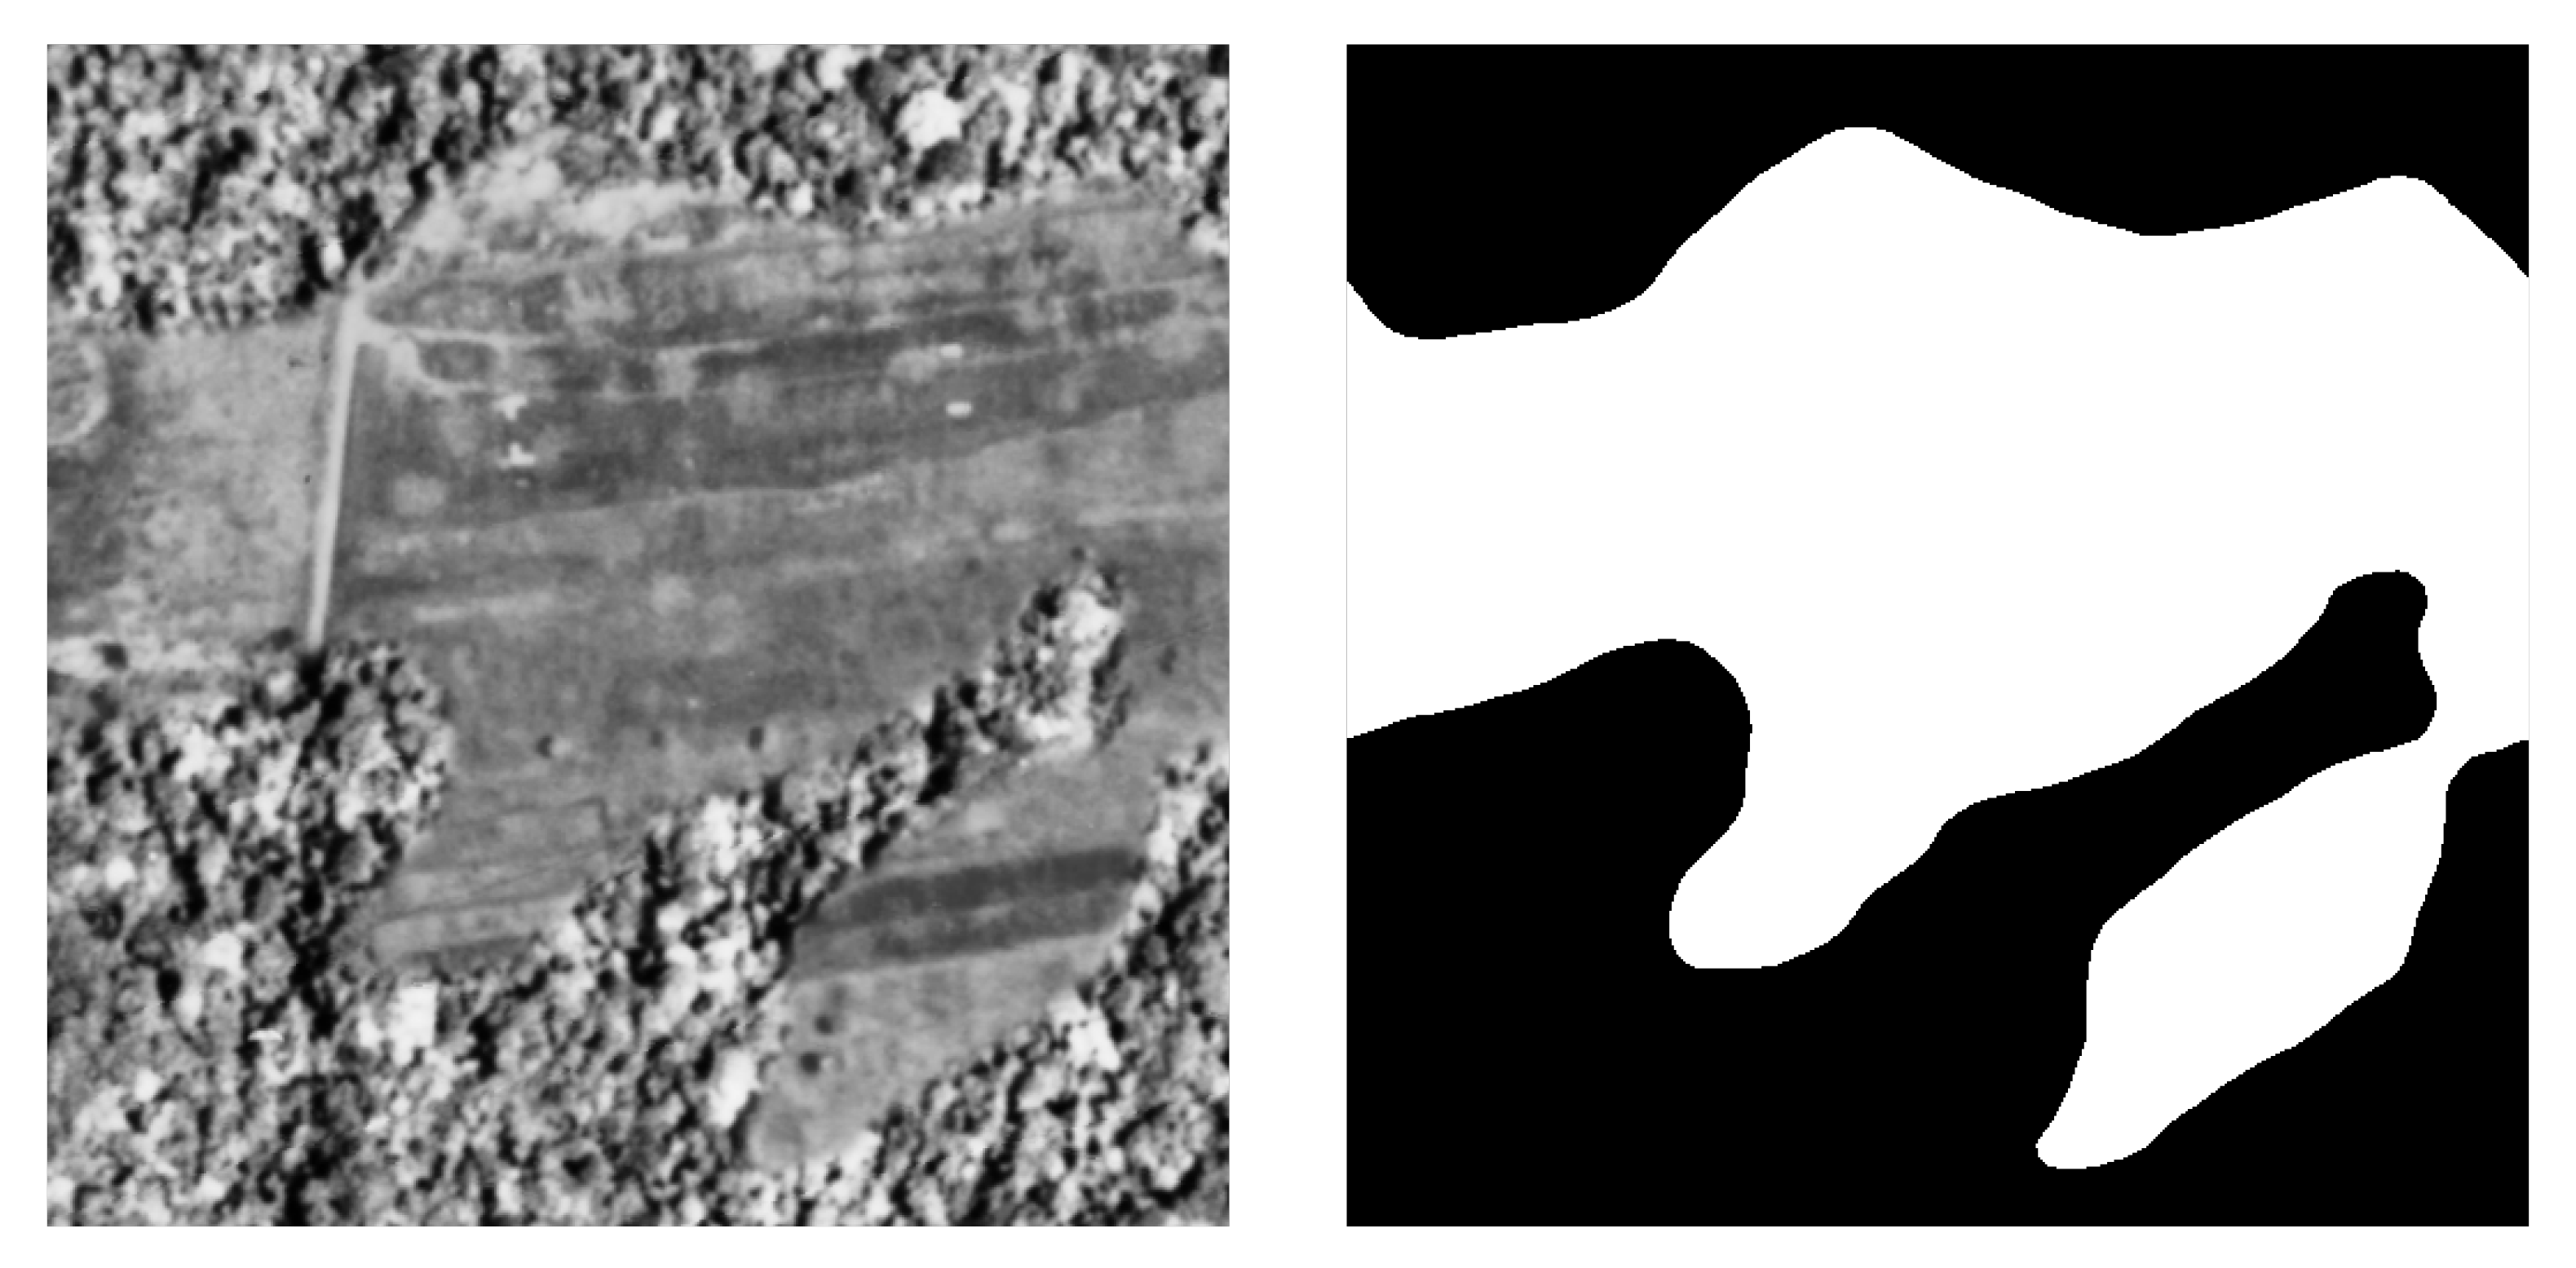
2.4.1. Classifying Land-Use and Land-Cover
Model Training
Model Validation
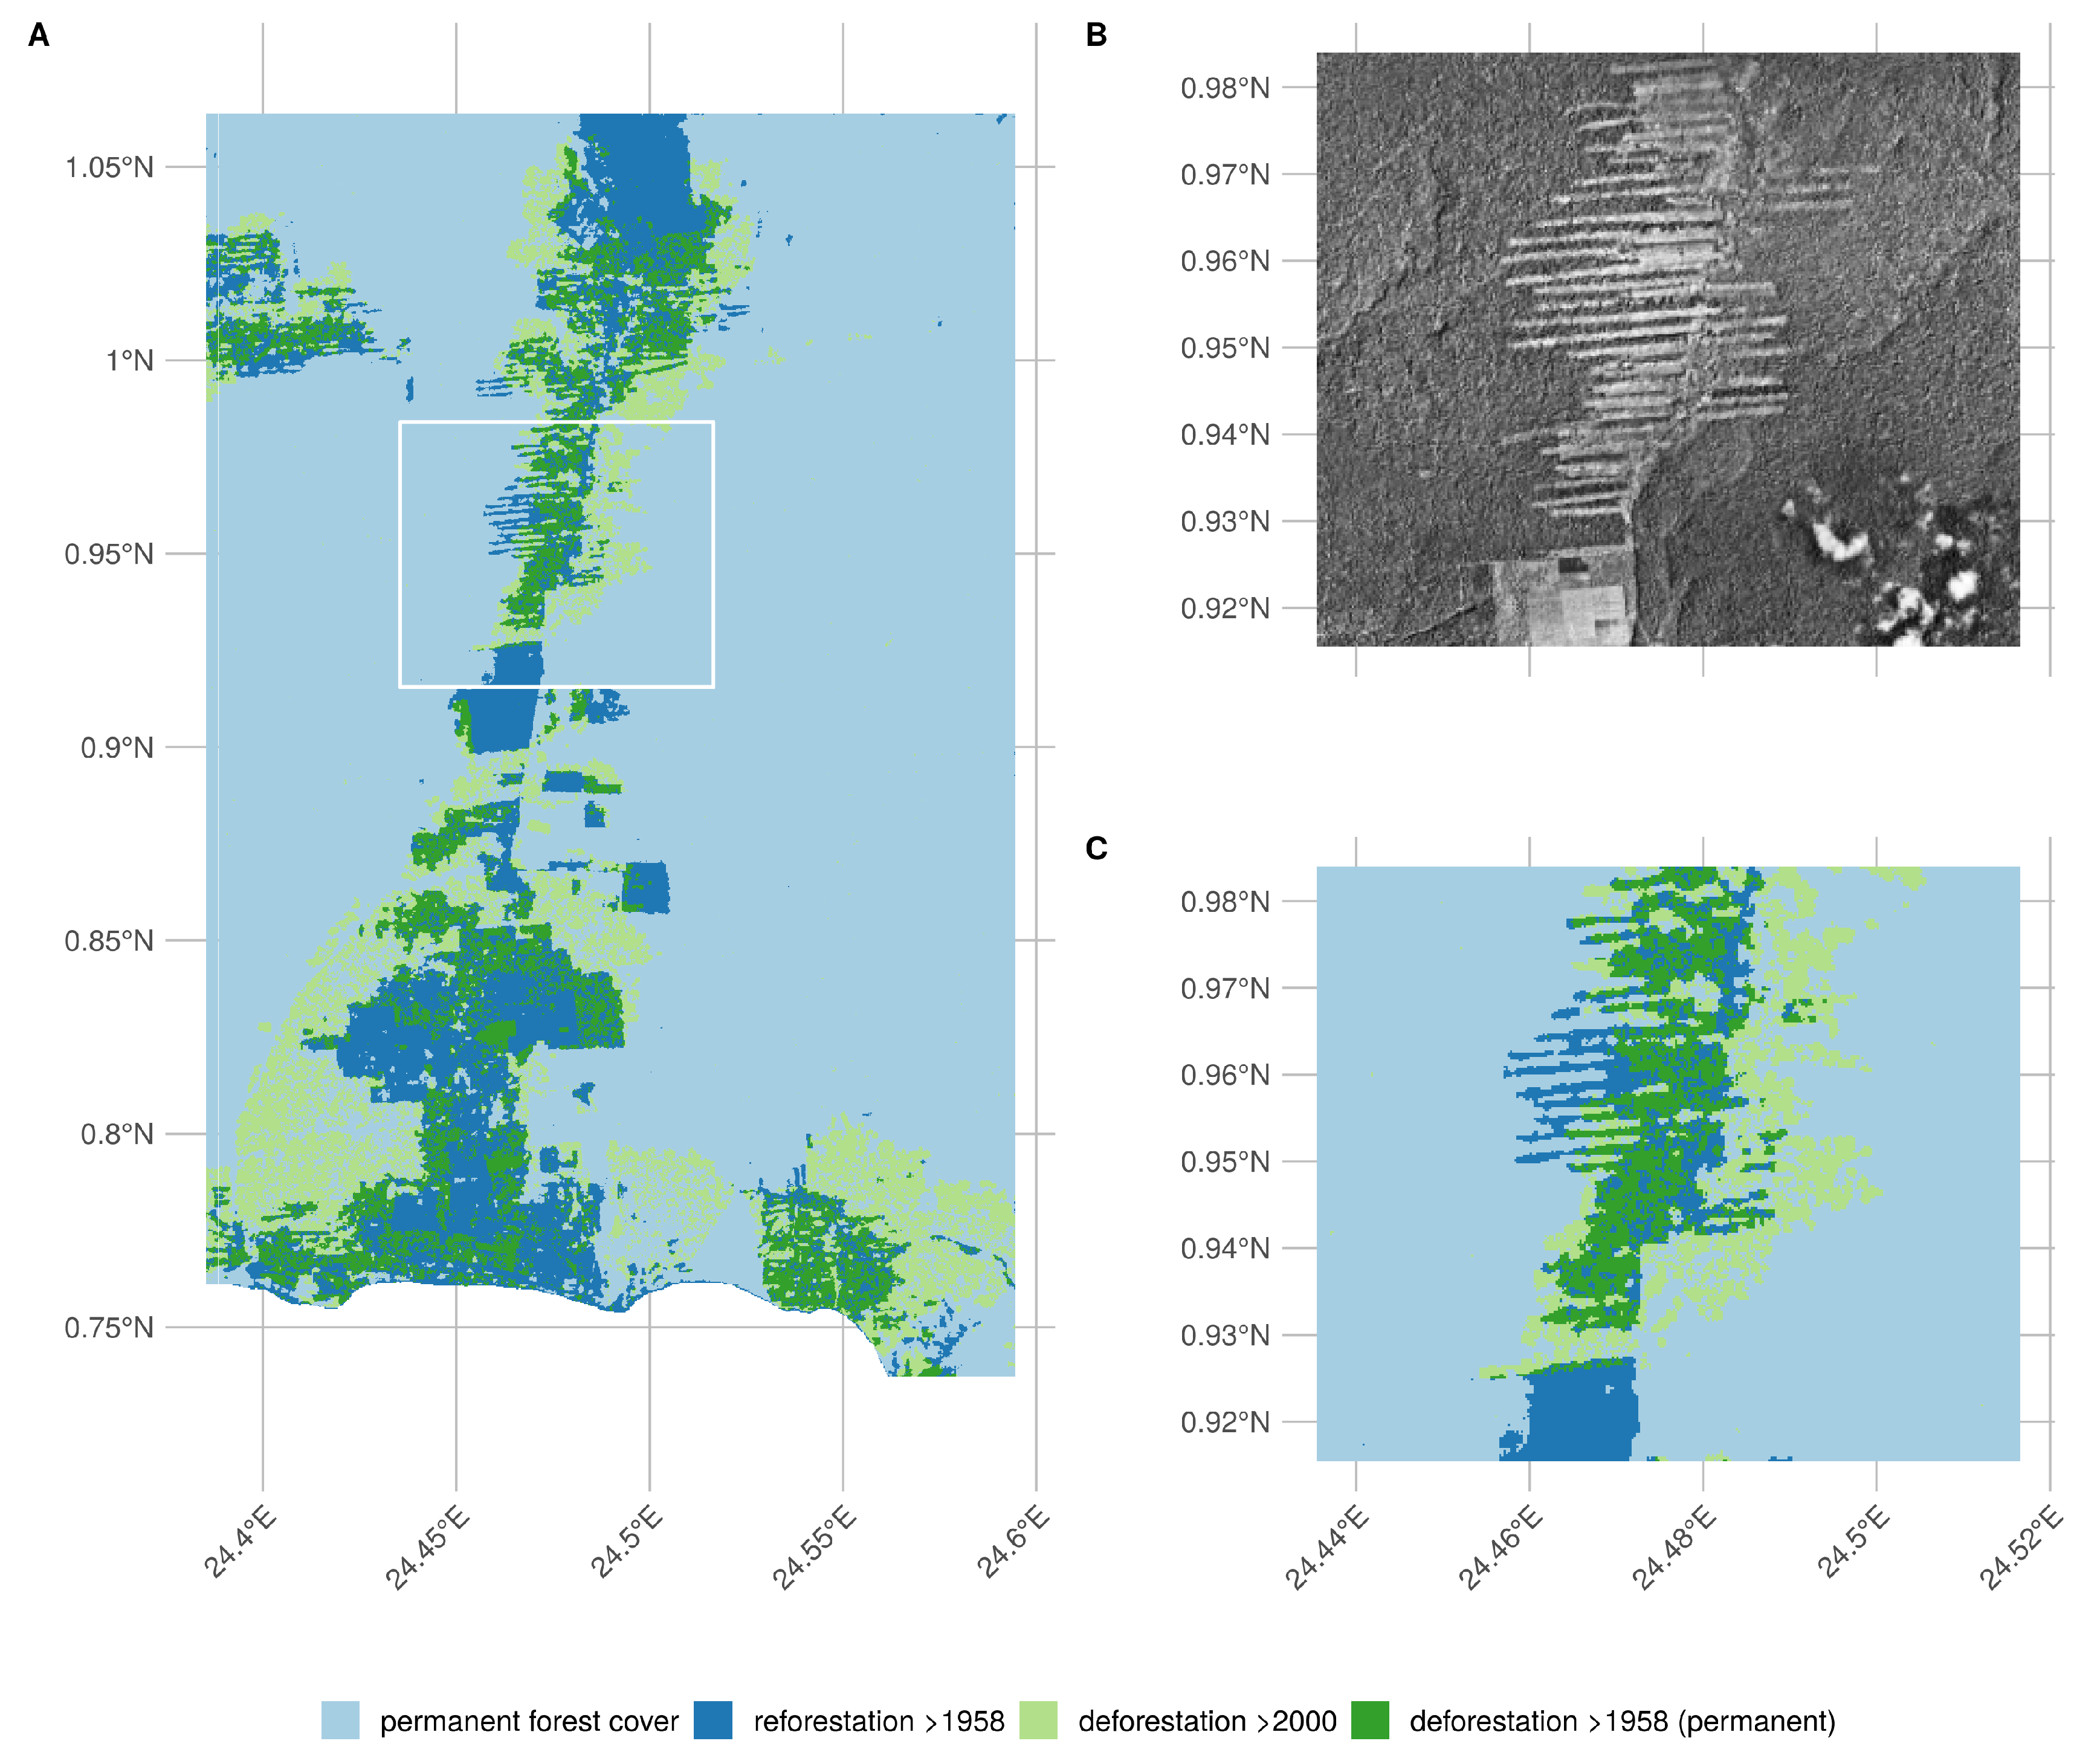
2.4.2. Characterizing Long-Term Change
2.4.3. Landscape Fragmentation and Aboveground Carbon Estimates
2.5. Canopy Structure and FOTO Texture Analysis
3. Results
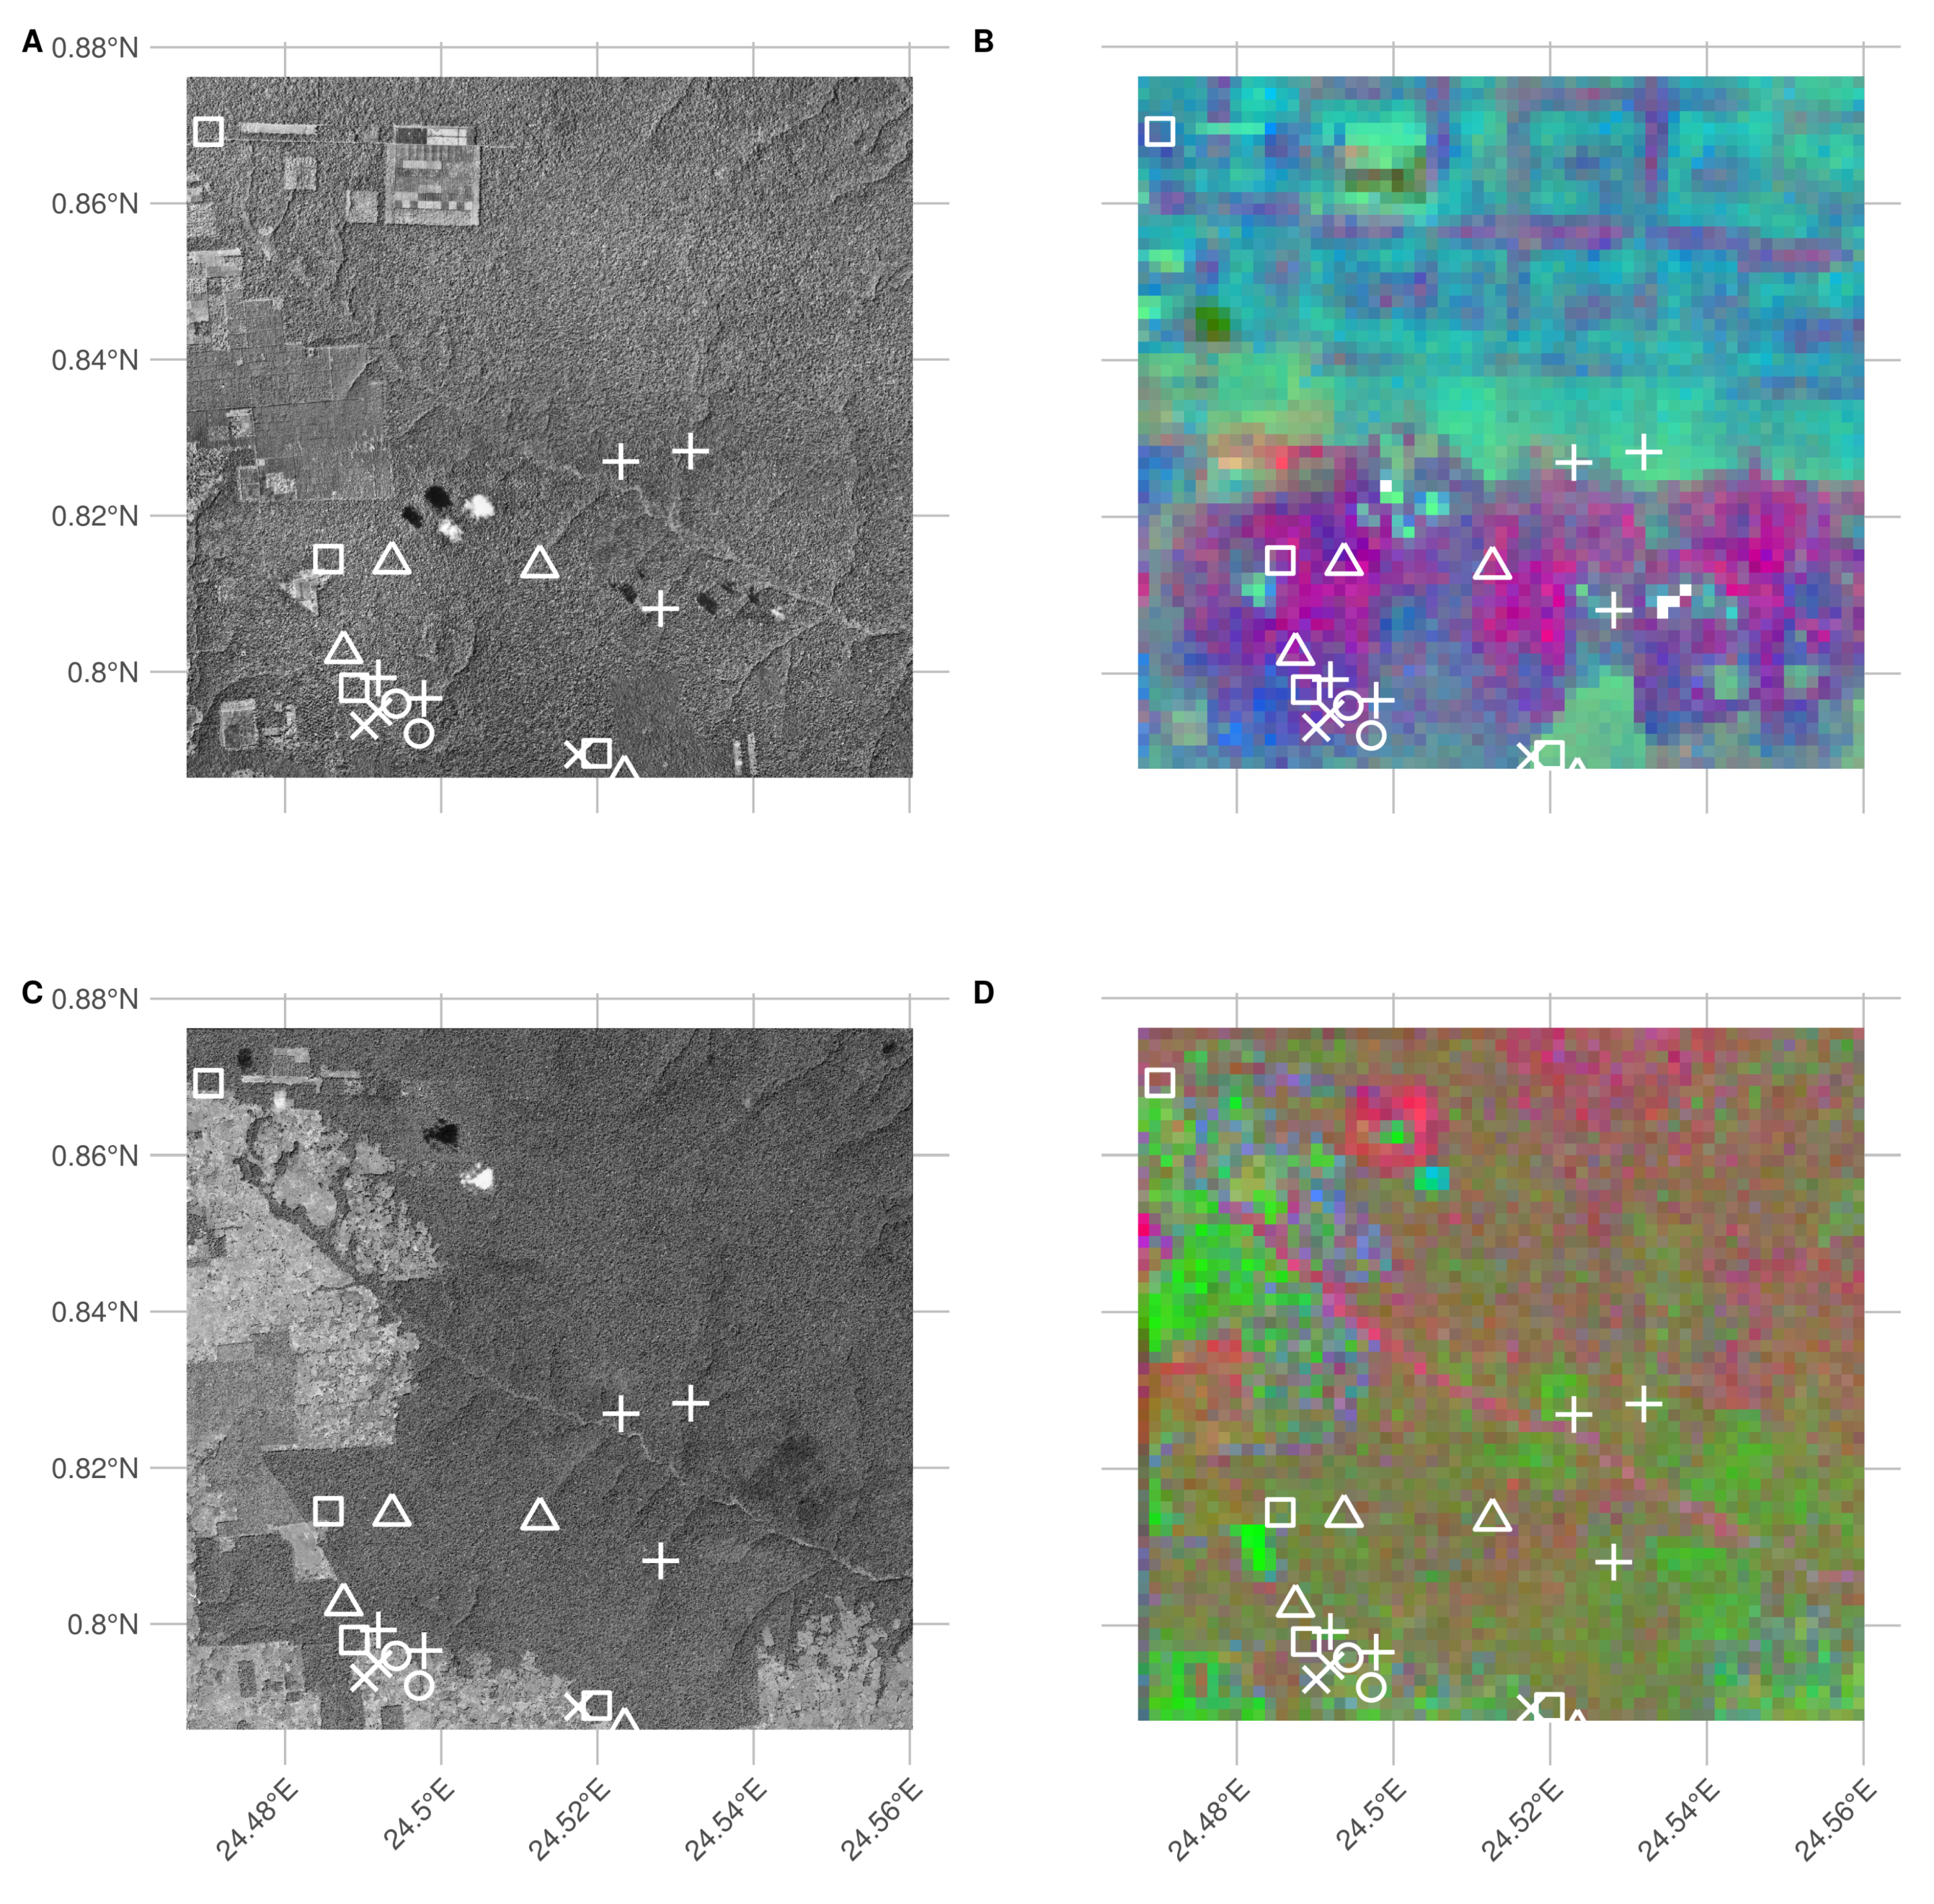
3.1. Orthomosaic Construction
3.2. Land-Use and Land-Cover Classification
CNN Model Validation
3.3. Long-Term Changes in LULC and Aboveground Carbon
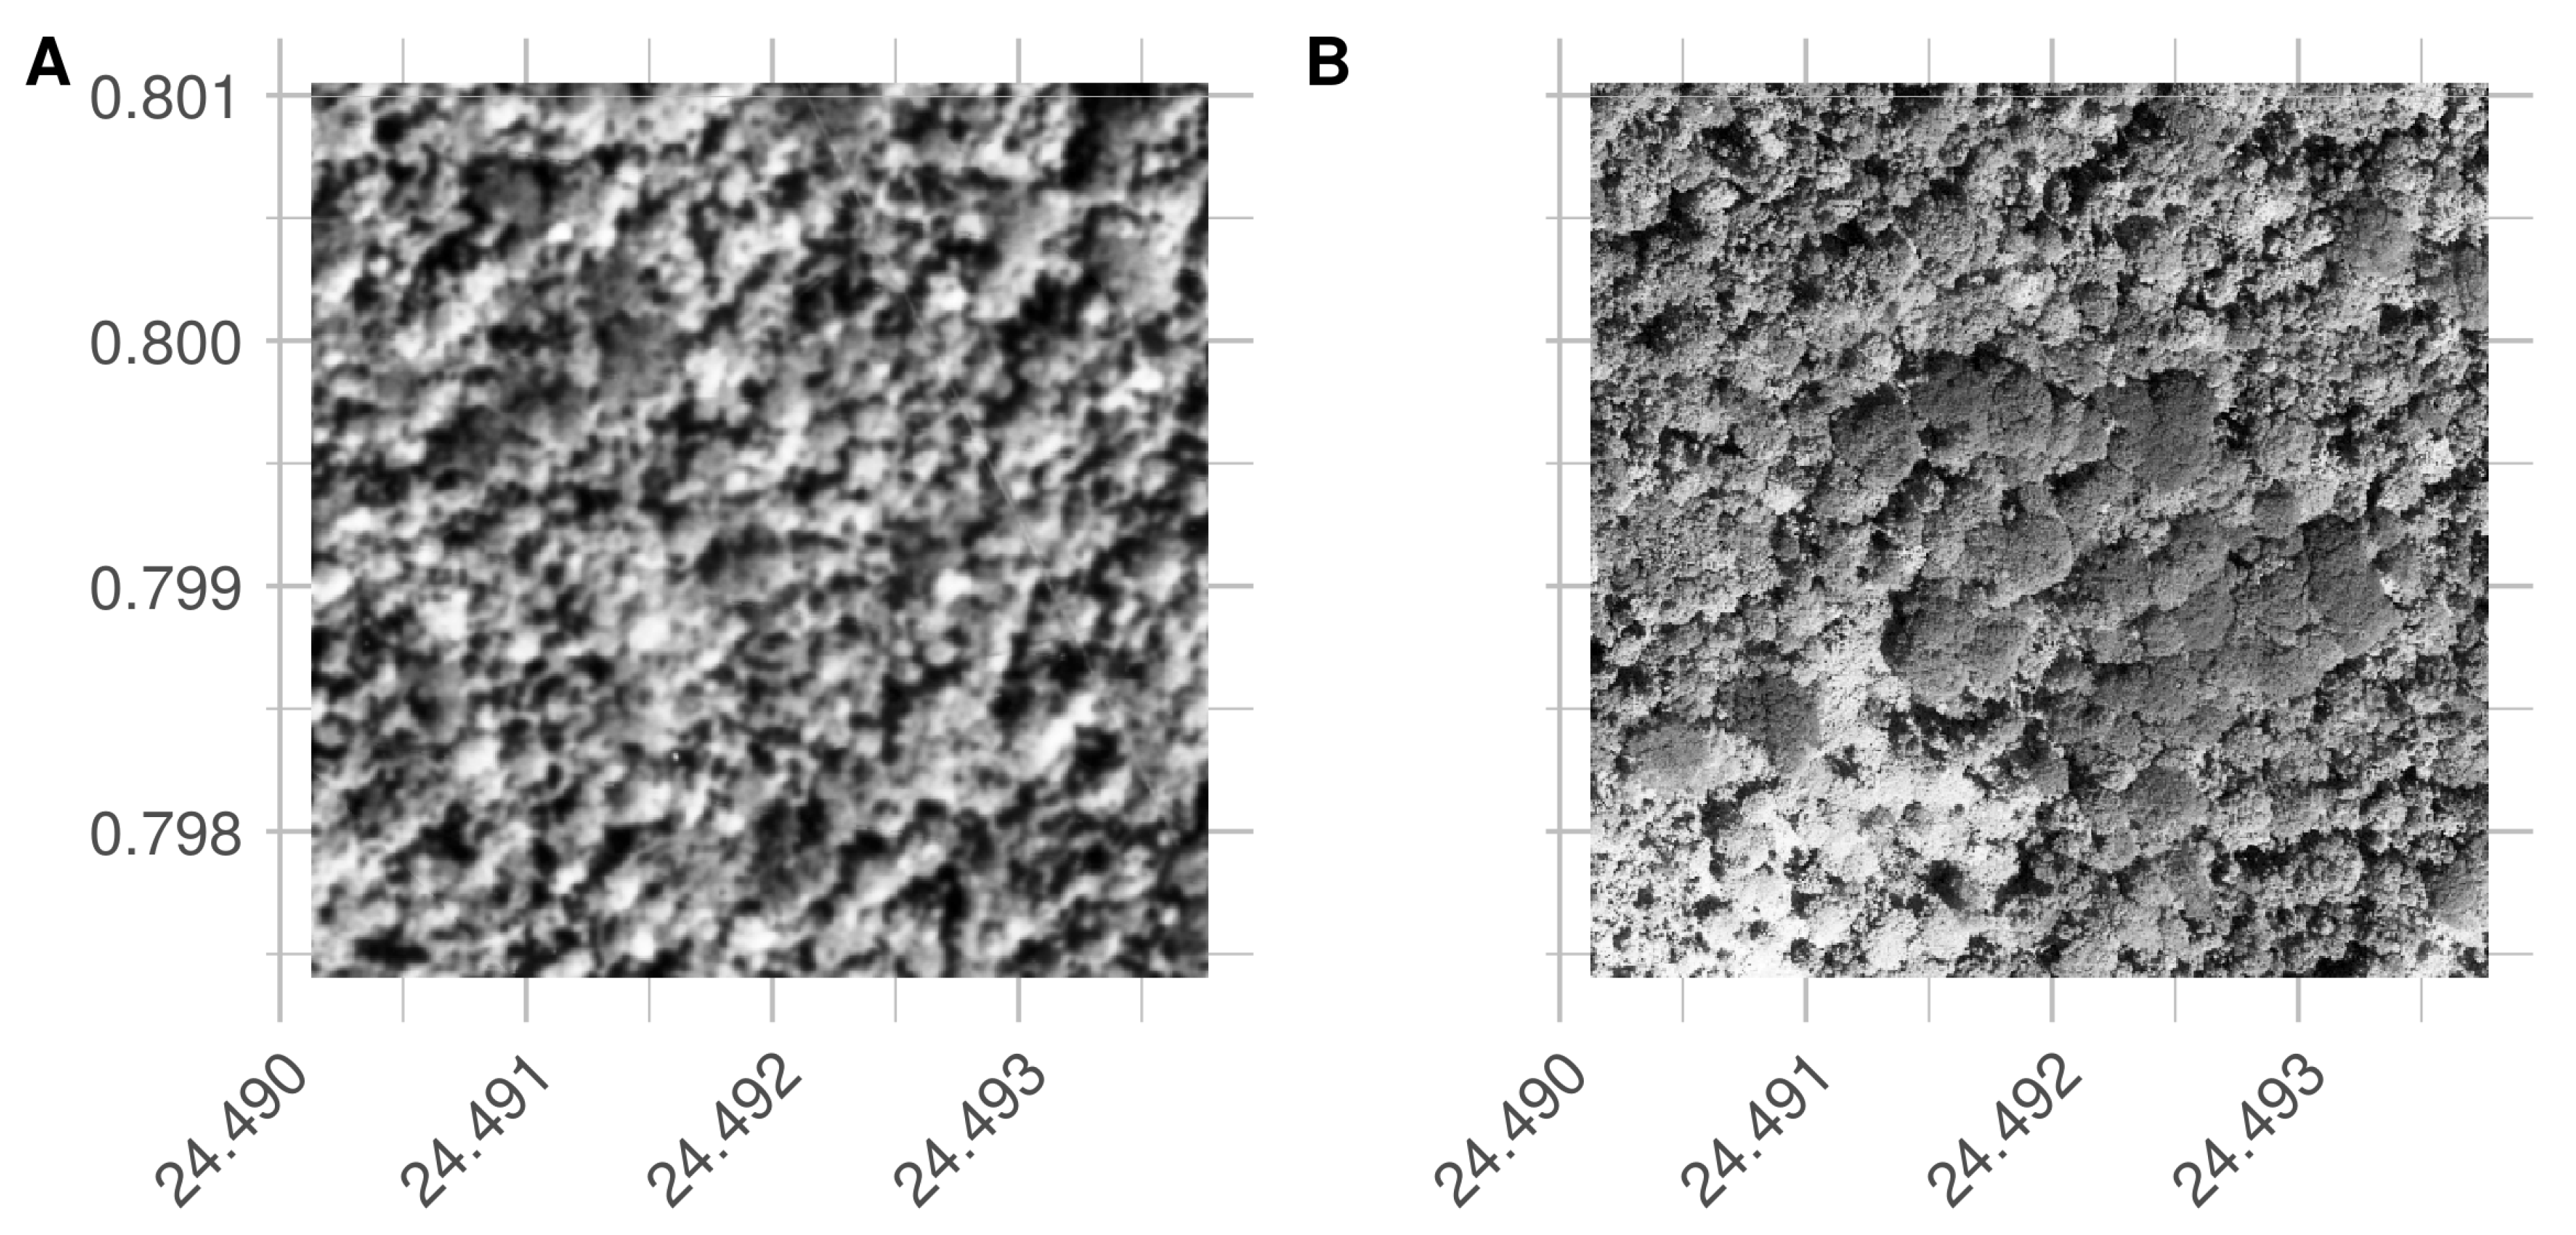
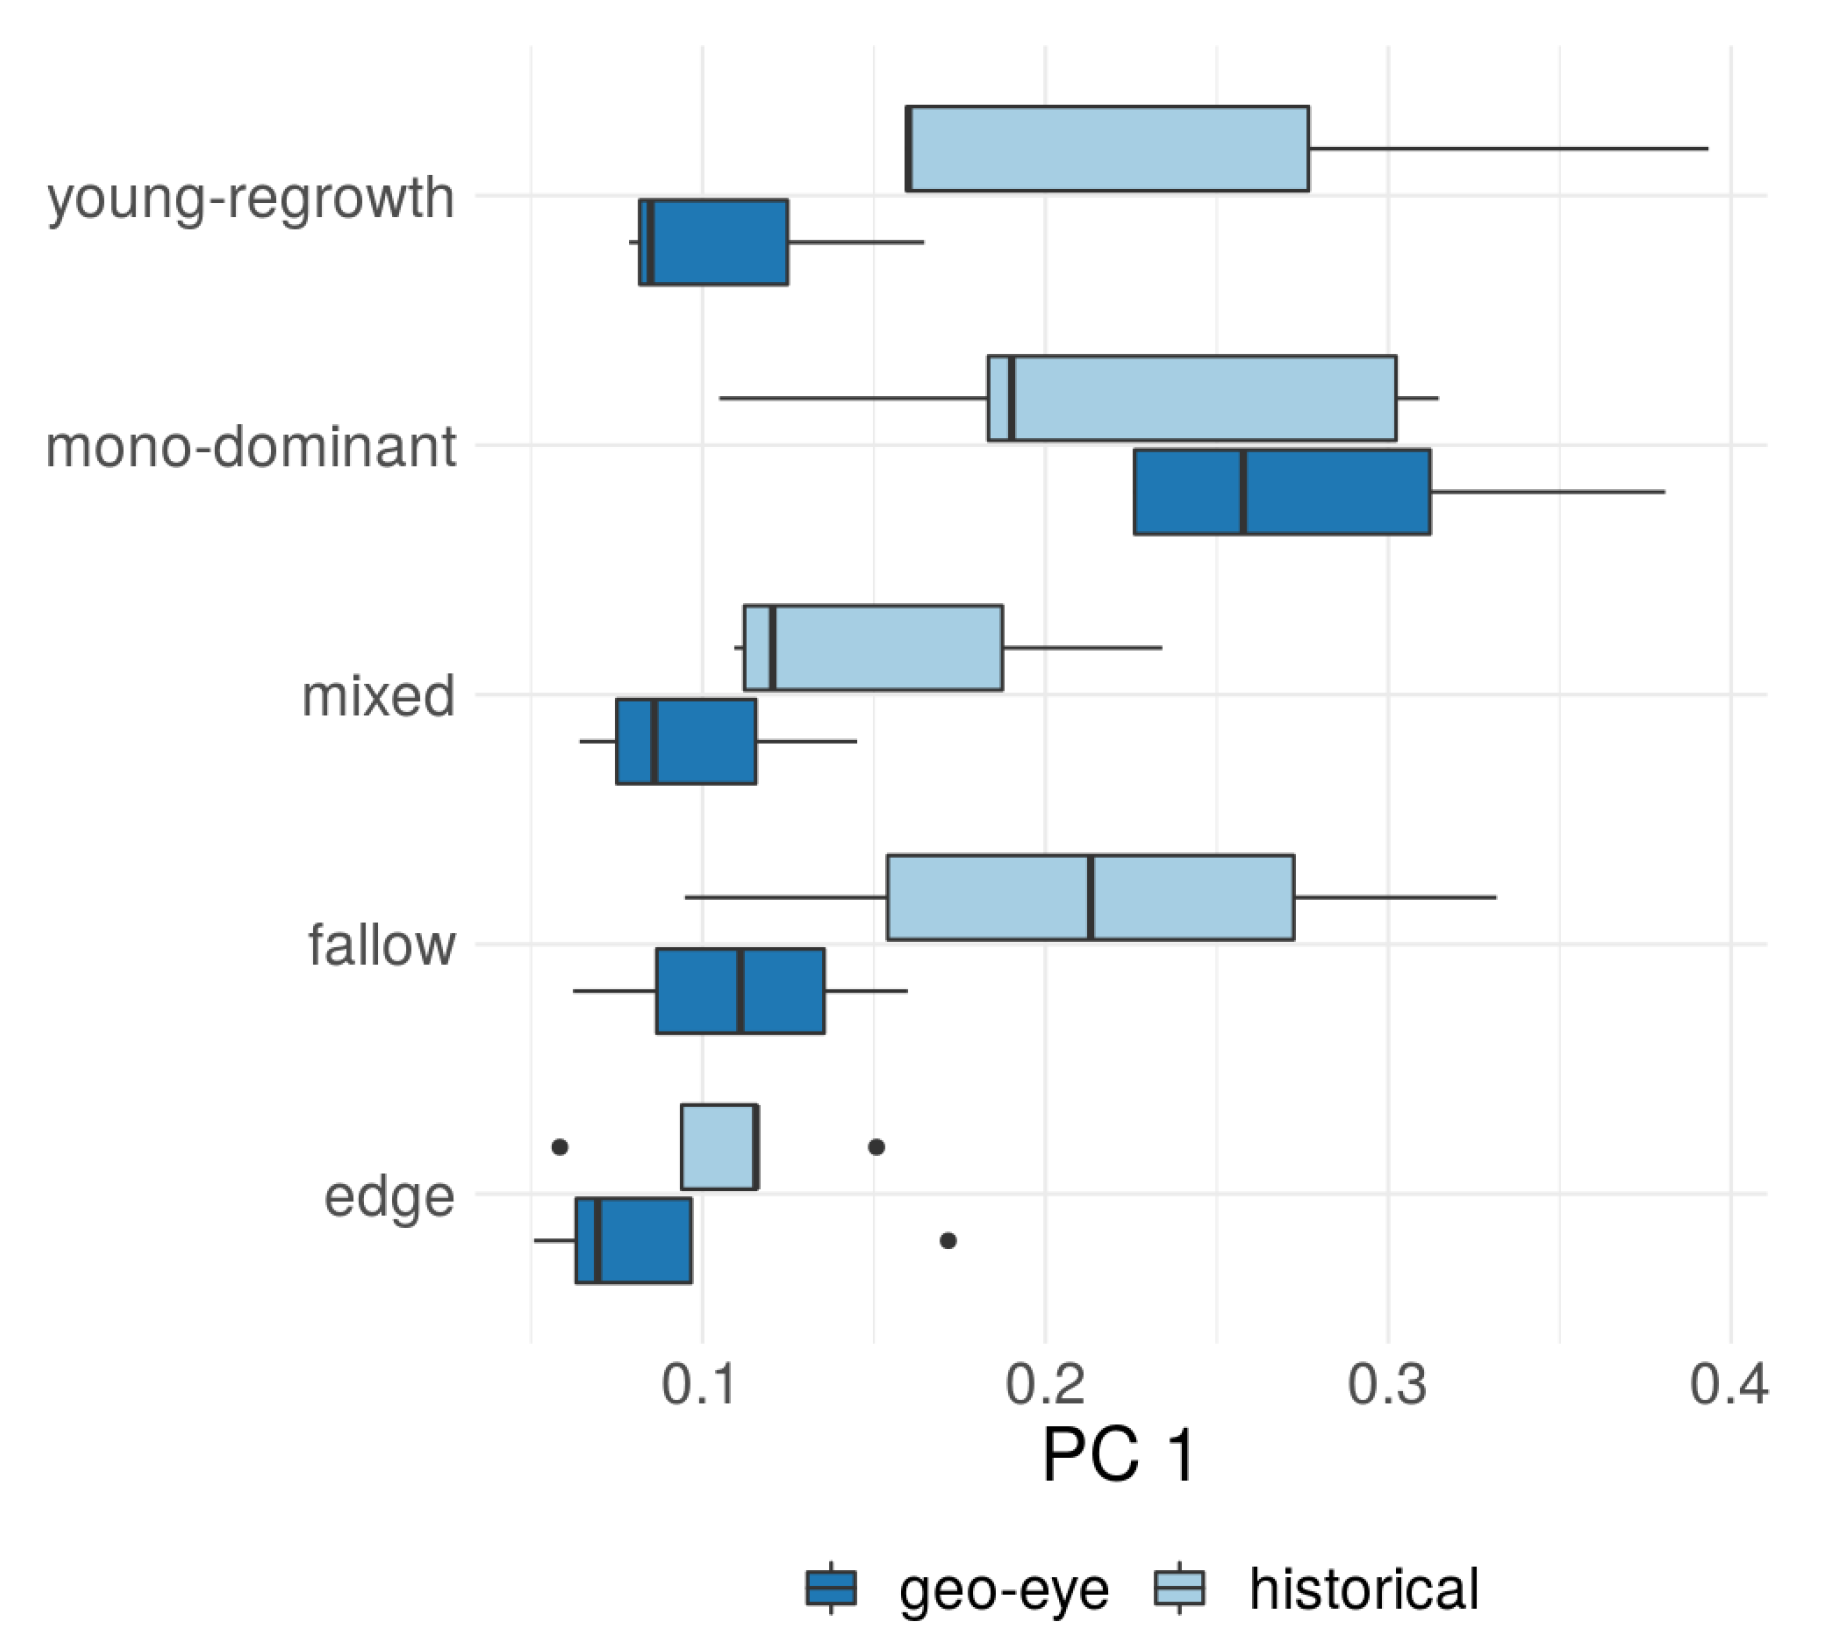
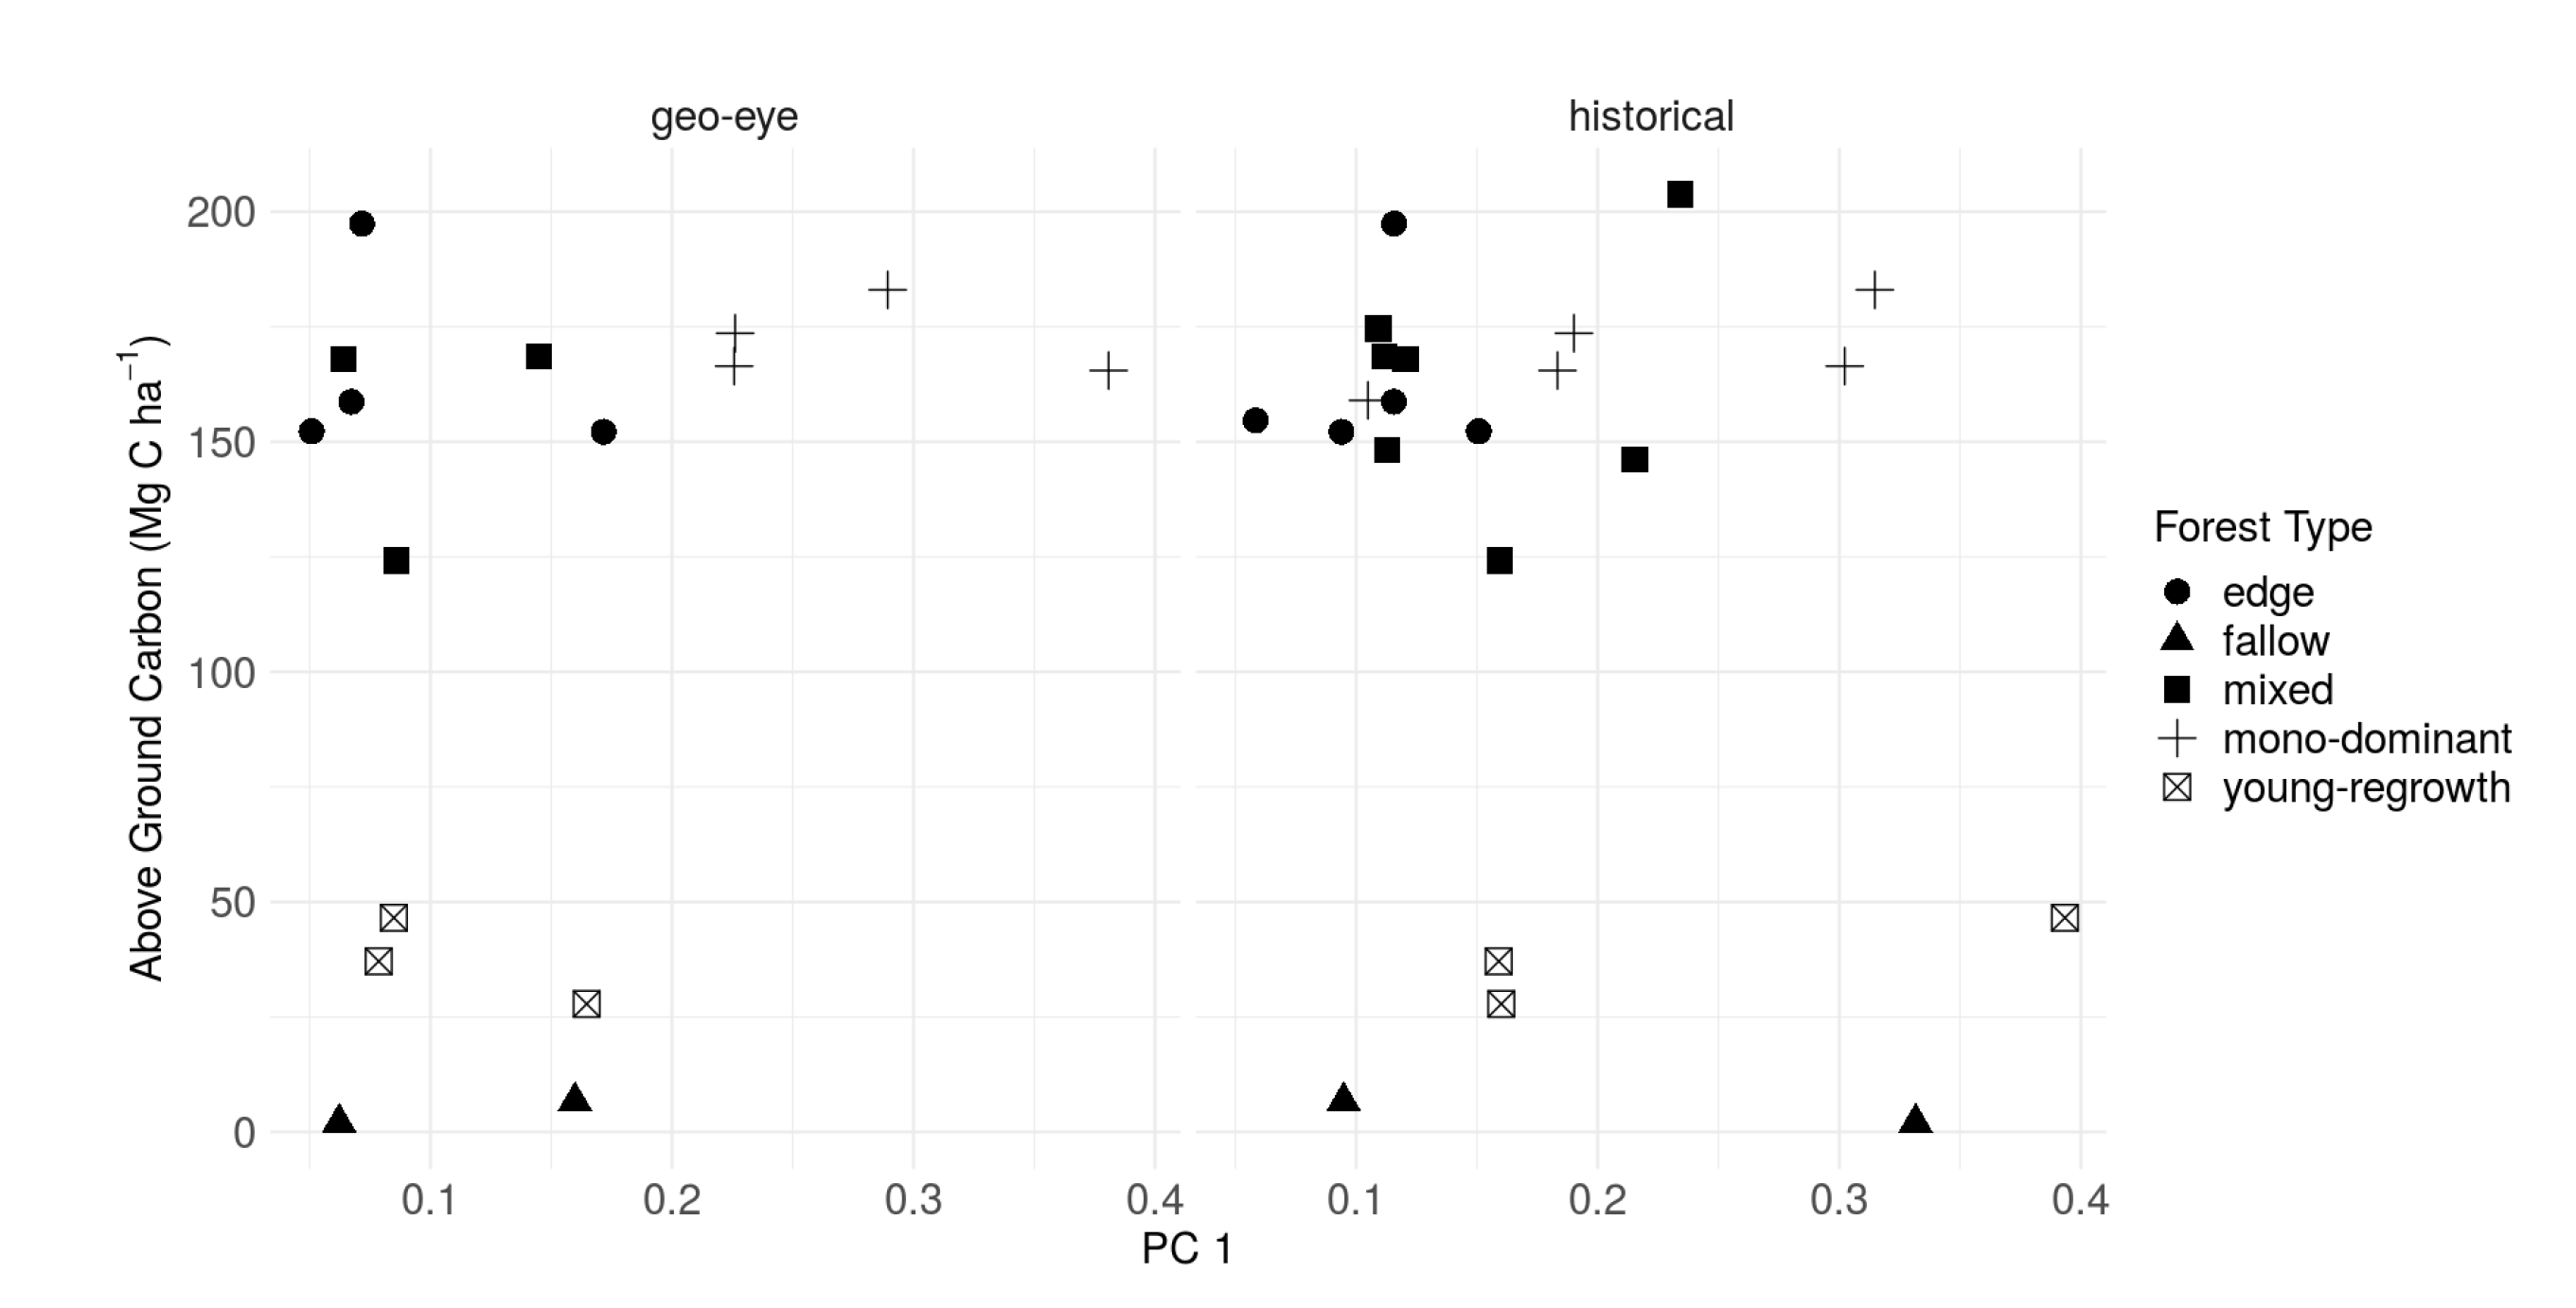
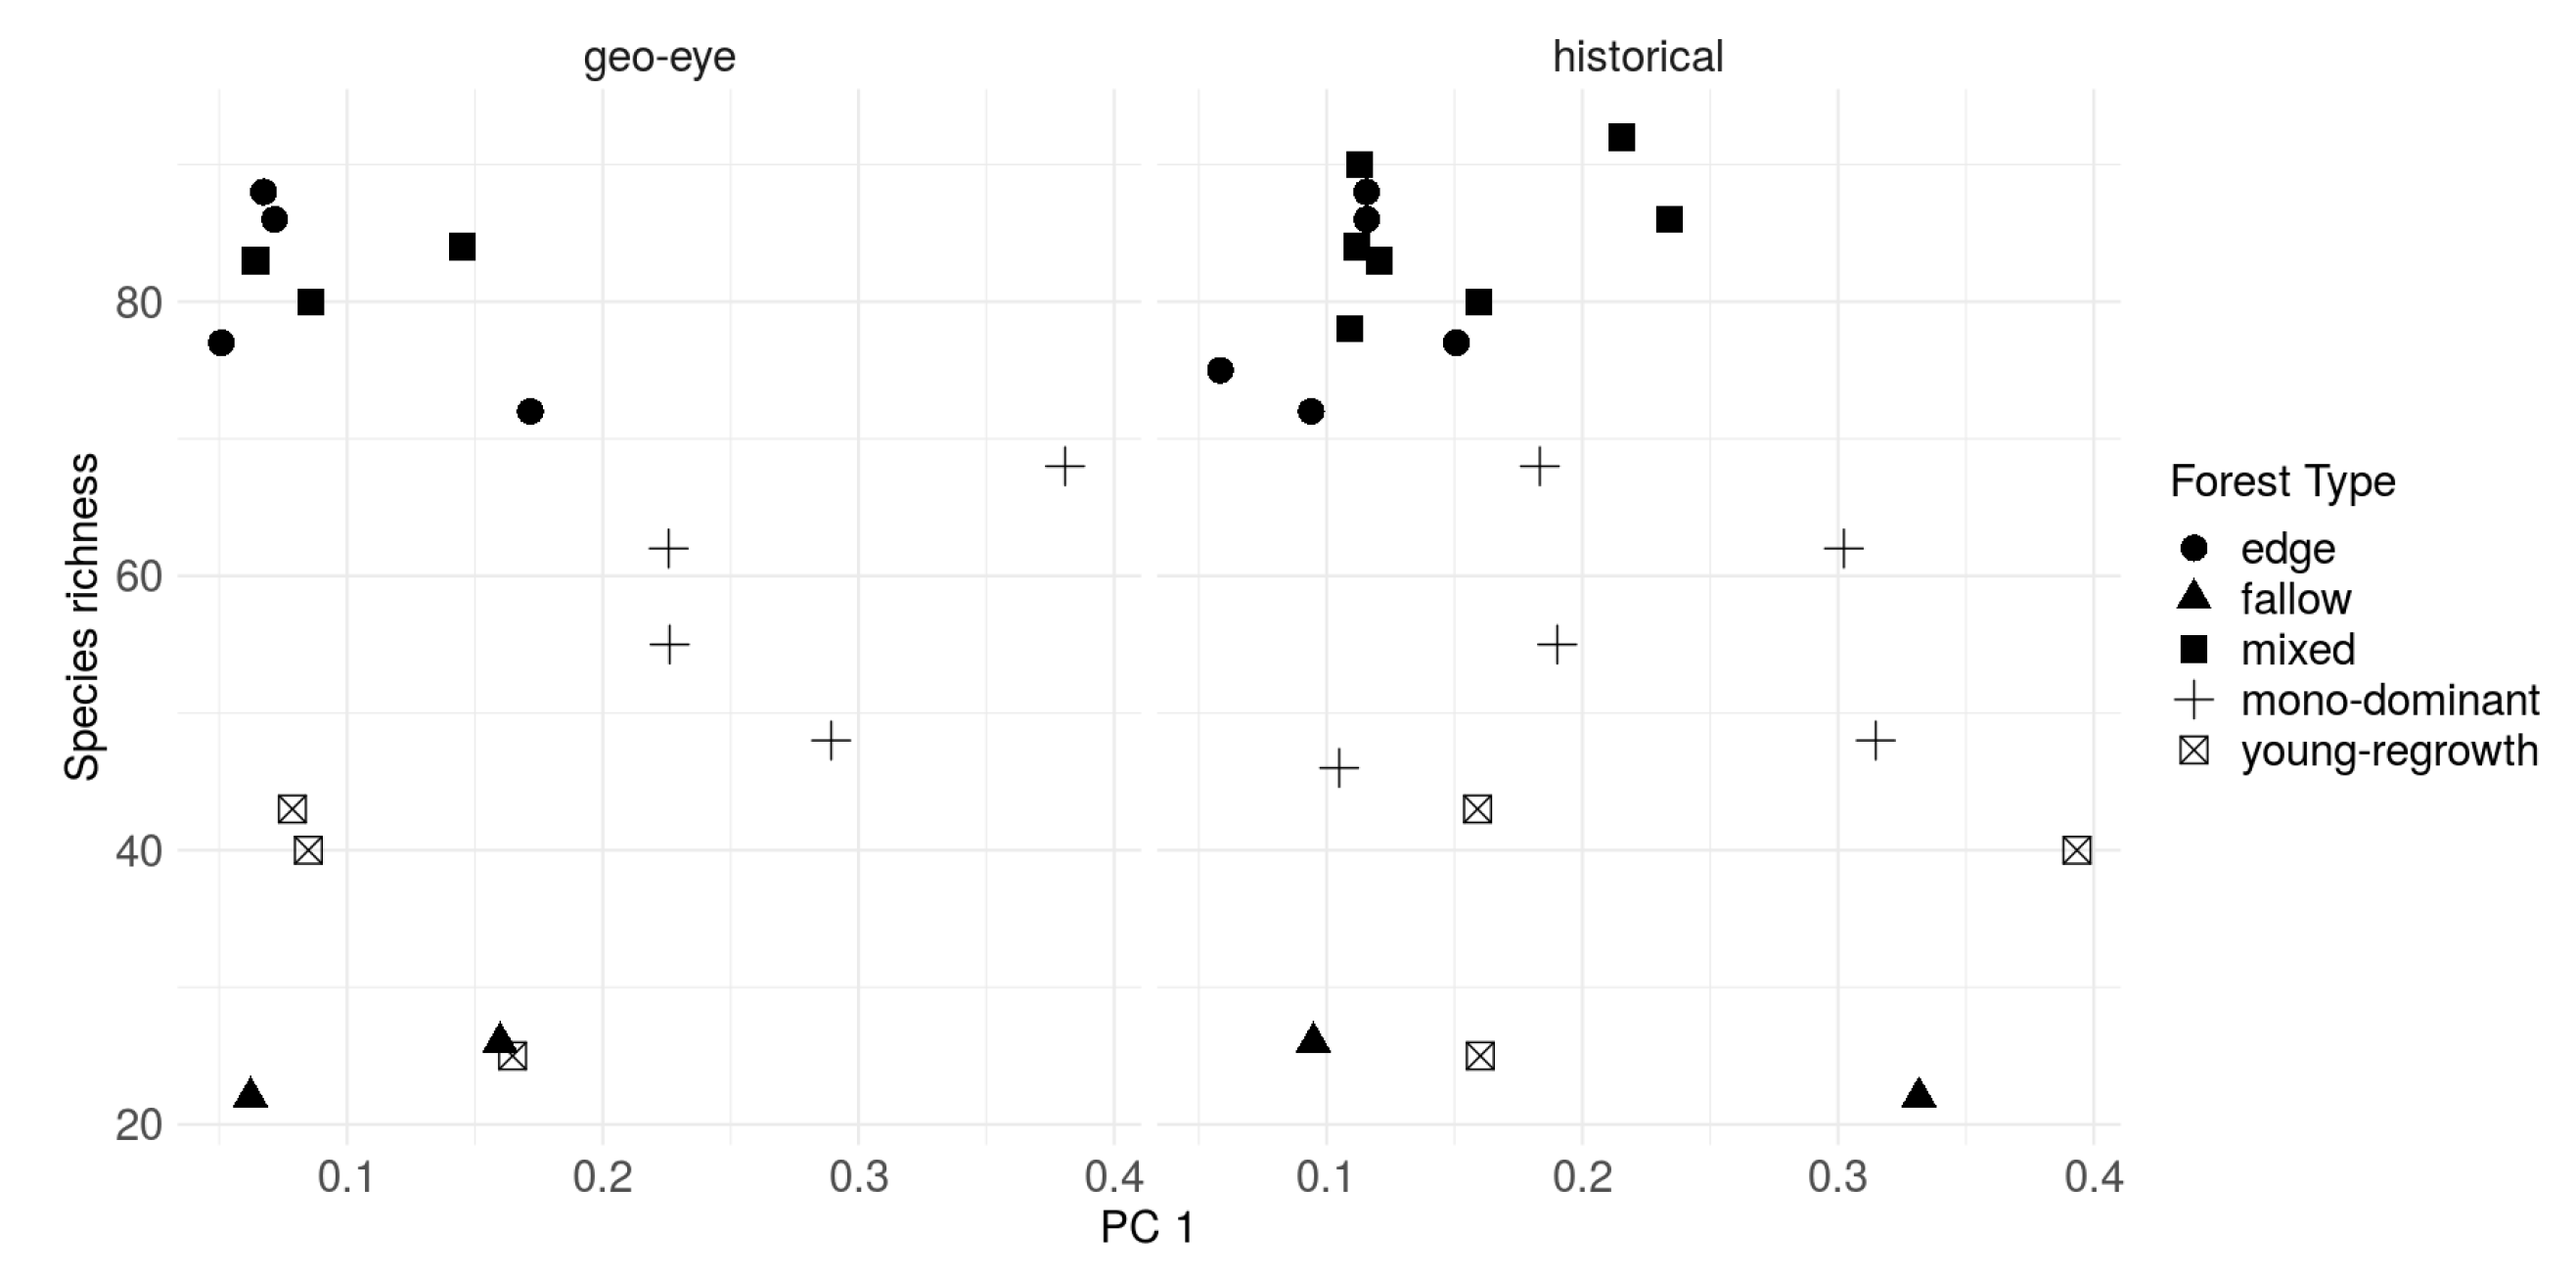
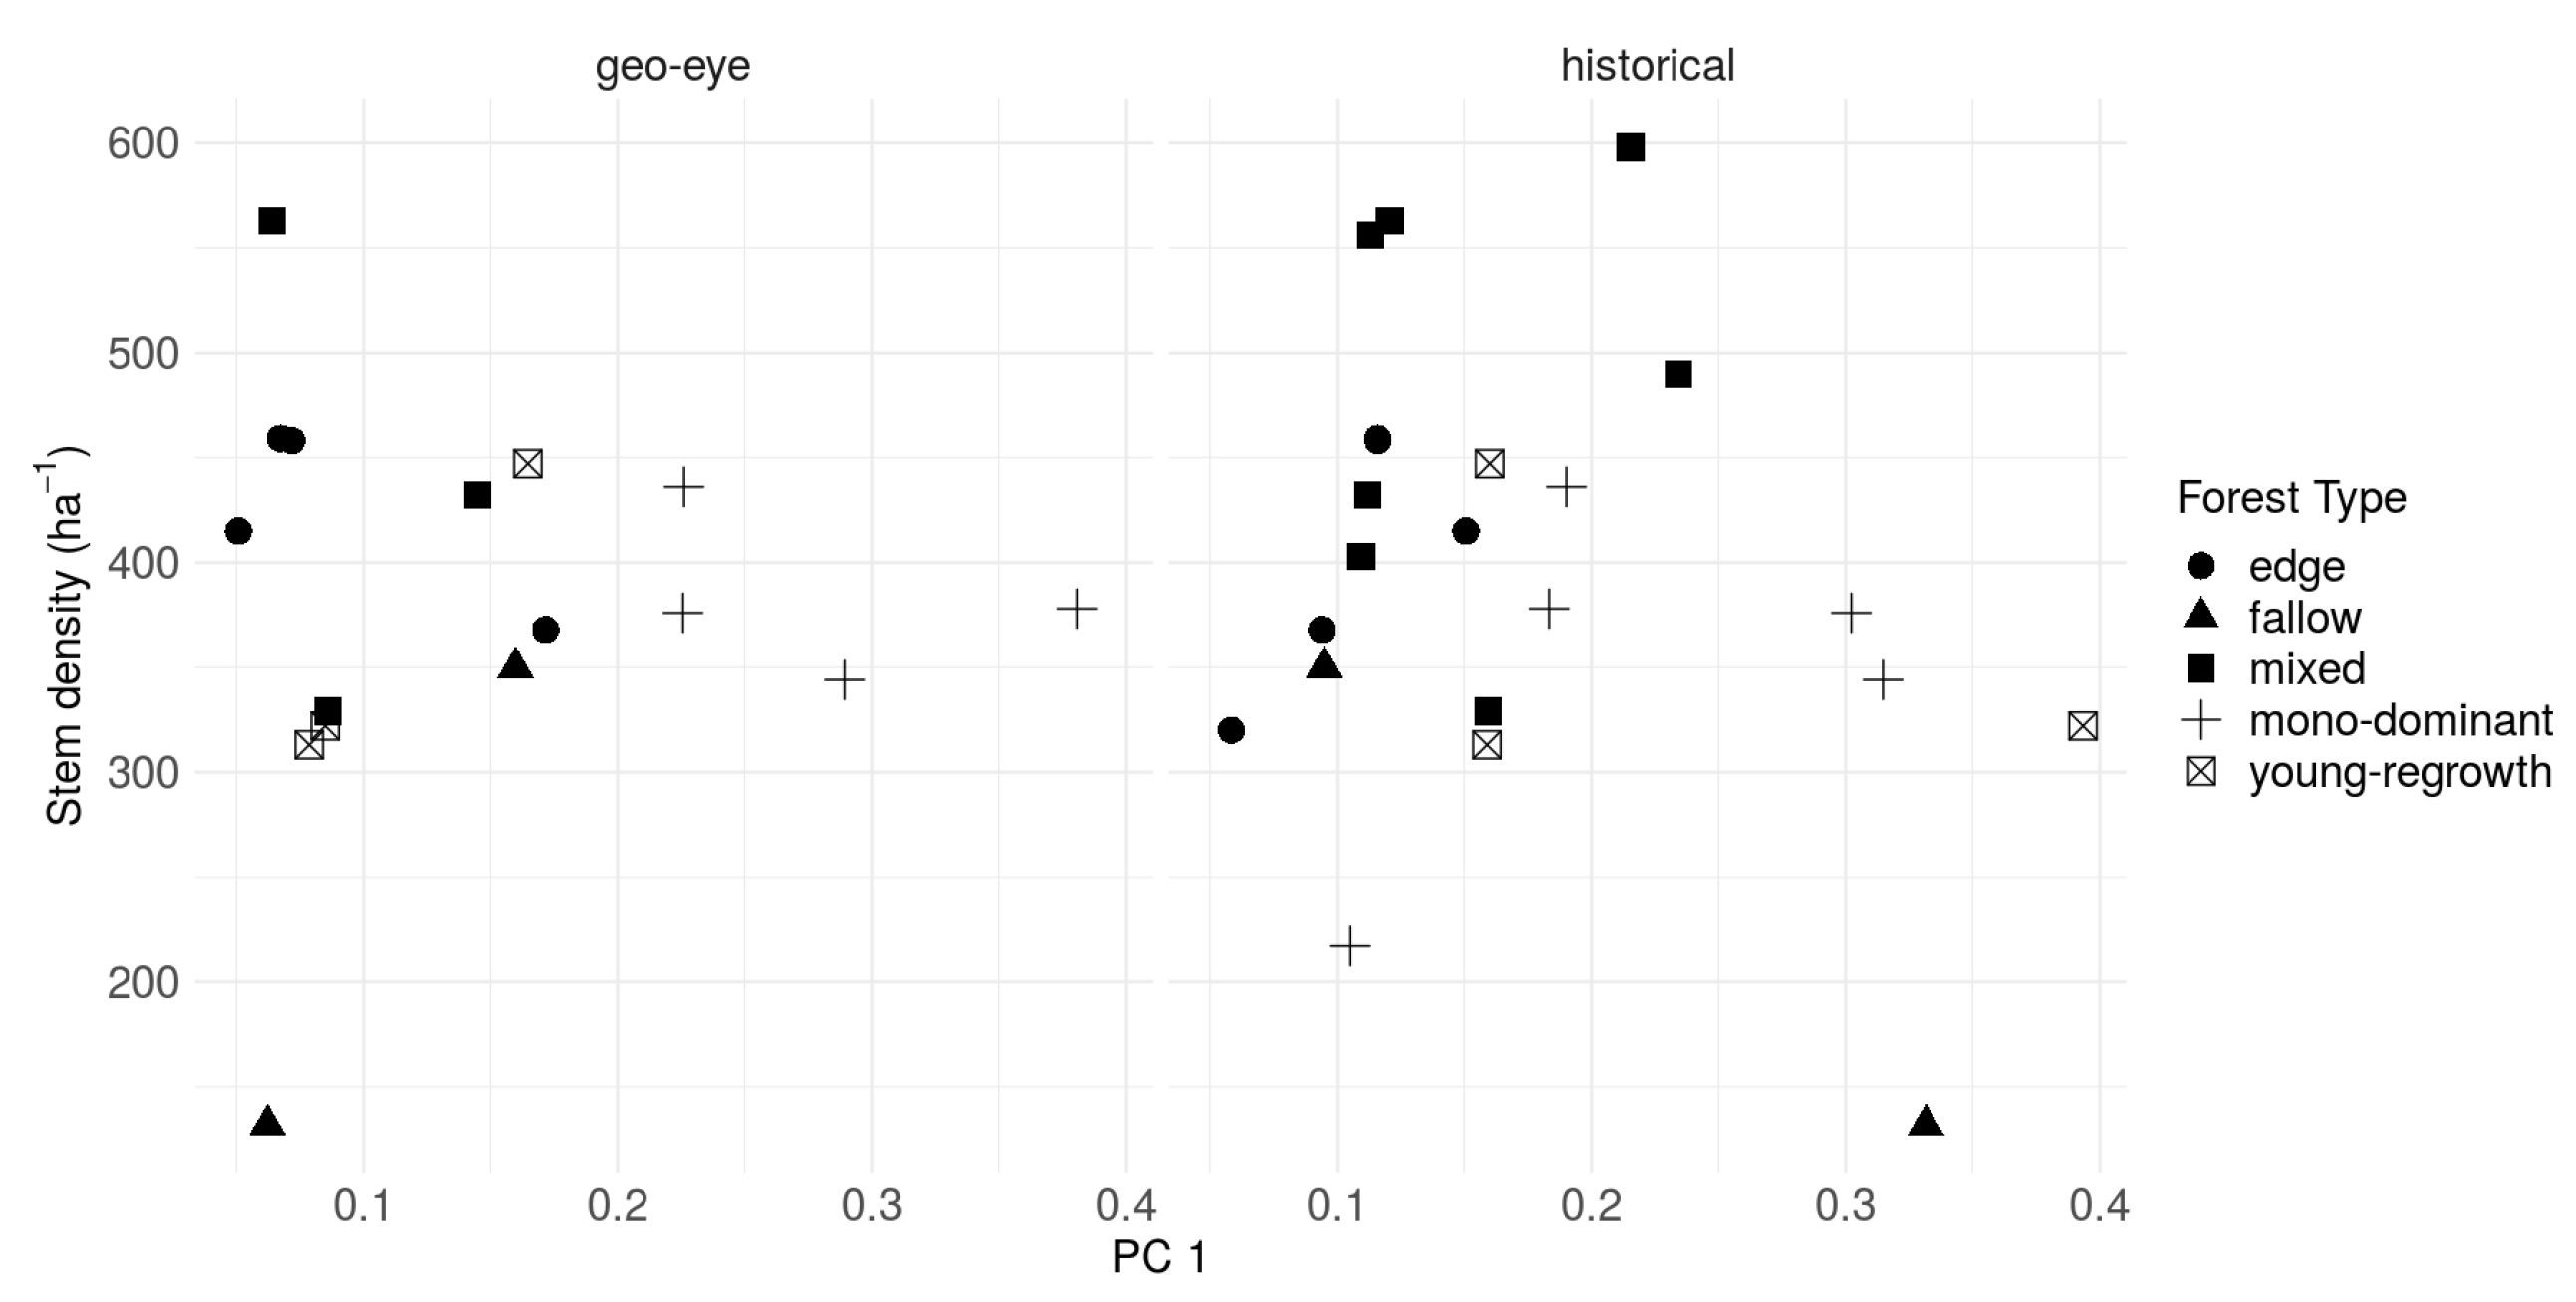
3.4. Canopy Structure and FOTO Texture Analysis
4. Discussion
4.1. Methodological Considerations
4.1.1. Data Recovery Challenges
4.1.2. LULC Classification and Validation
4.1.3. Scaling Opportunities
4.2. Research Context
4.2.1. Long Term Changes in LULC and Aboveground Carbon
4.2.2. Canopy Structure and FOTO Texture Analysis
5. Conclusions
6. Additional Information and Declarations
6.1. Data Availability
6.2. Code Availability
Author Contributions
Acknowledgments
Conflicts of Interest
Appendix A

| Path | Direction | Image # | Start (H:M:S) | End (H:M:S) |
|---|---|---|---|---|
| 1 | W – E | 04 / 78 – 04 / 127 | 10:15:00 | 10:40:00 |
| 2 | W – E | 05 / 01 – 05 / 56 | 10:15:00 | 10:40:00 |
| 3 | W – E | 06 / 01 – 06 / 48 | 08:55:00 | 09:20:00 |
| 4 | W – E | 07 / 01 – 07 / 20 | 09:30:00 | 09:45:00 |
| 5 | W – E | 05 / 167 – 05 / 187 | 08:55:00 | 09:10:00 |
| 6 | W – E | 07 / 67 – 07 / 82 | 10:50:00 | 11:00:00 |
| 7 | E – W | 06 / 49 – 06 / 95 | 09:35:00 | 10:05:00 |
| 8 | E – W | 05 / 57 – 05 / 103 | 10:20:00 | 10:50:00 |
| 9 | E – W | 04 / 128 – 04 / 176 | 10:50:00 | 11:10:00 |
| 10 | W – E | 08 / 01 – 08 / 27 | 09:05:00 | 09:20:00 |
| 11 | W – E | 06 / 96 – 06 / 139 | 10:25:00 | 10:45:00 |
| Type | nr | Latitude | Longitude | Stem Density (ha−1) | Basal Area (m2 ha−1) | AGC (Mg C ha−1) | Species Richness | LULCC Class Coverage (%) |
|---|---|---|---|---|---|---|---|---|
| fallow | 1 | 0.7959139 | 24.49423 | 350 | 5.39000 | 6.7000 | 26 | 37 (1), 63 (3) |
| fallow | 2 | 0.7921028 | 24.49717 | 132 | 2.06000 | 2.0400 | 22 | 68 (1), 32 (3) |
| young-regrowth | 1 | 0.7894028 | 24.51755 | 322 | 20.44000 | 46.5600 | 40 | 68 (1), 32 (3) |
| young-regrowth | 2 | 0.7948806 | 24.49193 | 447 | 16.63000 | 27.8300 | 25 | 56 (1), 44 (3) |
| young-regrowth | 3 | 0.7931083 | 24.49013 | 313 | 17.80000 | 37.1000 | 43 | 51 (1), 49 (3) |
| old-regrowth | 1 | 0.8824444 | 24.49614 | 384 | 19.48000 | 81.7800 | 92 | 100 (1) |
| mixed | 1 | 0.8135486 | 24.51264 | 563 | 34.81000 | 168.0400 | 83 | 100 (1) |
| mixed | 2 | 0.7805000 | 24.52109 | 403 | 35.25000 | 174.5800 | 78 | 100 (1) |
| mixed | 3 | 0.7866181 | 24.52349 | 367 | 30.69000 | 150.3000 | 75 | 100 (1) |
| mixed | 4 | 0.8140333 | 24.49370 | 432 | 33.01000 | 168.6100 | 84 | 100 (1) |
| mixed | 5 | 0.8025611 | 24.48750 | 329 | 25.20000 | 124.1800 | 80 | 100 (1) |
| mixed | 6 | 0.9925556 | 24.53906 | 490 | 32.63000 | 203.8100 | 86 | 100 (1) |
| mixed | 7 | 0.9898056 | 24.53853 | 598 | 31.47000 | 146.1100 | 92 | 100 (1) |
| mixed | 8 | 0.9866111 | 24.53856 | 556 | 29.20000 | 148.2100 | 90 | 100 (1) |
| mono-dominant | 1 | 0.8269306 | 24.52303 | 344 | 31.80000 | 183.0100 | 48 | 100 (1) |
| mono-dominant | 2 | 0.8282708 | 24.53196 | 436 | 32.06000 | 173.5800 | 55 | 100 (1) |
| mono-dominant | 3 | 0.7965903 | 24.49779 | 376 | 30.57000 | 166.4400 | 62 | 100 (1) |
| mono-dominant | 4 | 0.8080889 | 24.52811 | 374 | 27.69000 | 145.5500 | 46 | 100 (1) |
| mono-dominant | 5 | 0.8682806 | 24.45655 | 217 | 27.19000 | 159.0000 | 46 | 95 (1), 5 (2) |
| mono-dominant | 6 | 0.7992278 | 24.49195 | 378 | 33.95000 | 165.4800 | 68 | 100 (1) |
| edge | 1 | 0.7895486 | 24.51990 | 415 | 30.93601 | 152.2792 | 77 | 100 (1) |
| edge | 2 | 0.7979472 | 24.48885 | 368 | 31.82097 | 152.1736 | 72 | 95 (1), 5 (3) |
| edge | 3 | 0.8144250 | 24.48555 | 458 | 35.79959 | 197.4022 | 86 | 100 (1) |
| edge | 4 | 0.7659306 | 24.51125 | 320 | 29.72547 | 154.6380 | 75 | 98 (1), 2 (3) |
| edge | 5 | 0.8691778 | 24.47019 | 459 | 33.72462 | 158.6934 | 88 | 100 (1) |
| Forest Type | AGC (Mg C ha−1) | Stem Density (ha−1) | Basal Area (m2 ha−1) | nr. plots |
|---|---|---|---|---|
| edge | 163.04 ± 19.39 | 404 ± 60.03 | 32.4 ± 2.39 | 5 |
| fallow | 4.37 ± 3.3 | 241 ± 154.15 | 3.72 ± 2.35 | 2 |
| mixed | 160.48 ± 23.84 | 467.25 ± 99.42 | 31.53 ± 3.26 | 8 |
| mono-dominant | 165.51 ± 12.75 | 354.17 ± 73.56 | 30.54 ± 2.64 | 6 |
| old-regrowth | 81.78 | 384 | 19.48 | 1 |
| young-regrowth | 37.16 ± 9.37 | 360.67 ± 74.9 | 18.29 ± 1.95 | 3 |


References
- Hansen, M.C.; Potapov, P.V.; Moore, R.; Hancher, M.; Turubanova, S.A.; Tyukavina, A.; Thau, D.; Stehman, S.V.; Goetz, S.J.; Loveland, T.R.; et al. High-Resolution Global Maps of 21st-Century Forest Cover Change. Science 2013, 342, 850–853. [Google Scholar] [CrossRef]
- Houghton, R.A.; House, J.I.; Pongratz, J.; van der Werf, G.R.; DeFries, R.S.; Hansen, M.C.; Le Quéré, C.; Ramankutty, N. Carbon emissions from land use and land-cover change. Biogeosciences 2012, 9, 5125–5142. [Google Scholar] [CrossRef]
- Tyukavina, A.; Baccini, A.; Hansen, M.C.; Potapov, P.V.; Stehman, S.V.; Houghton, R.A.; Krylov, A.M.; Turubanova, S.; Goetz, S.J. Aboveground carbon loss in natural and managed tropical forests from 2000 to 2012. Environ. Res. Lett. 2015, 10, 074002. [Google Scholar] [CrossRef]
- Van der Werf, G.R.; Morton, D.C.; DeFries, R.S.; Olivier, J.G.J.; Kasibhatla, P.S.; Jackson, R.B.; Collatz, G.J.; Randerson, J.T. CO2 emissions from forest loss. Nat. Geosci. 2009, 2, 737–738. [Google Scholar] [CrossRef]
- Fauset, S.; Gloor, M.U.; Aidar, M.P.M.; Freitas, H.C.; Fyllas, N.M.; Marabesi, M.A.; Rochelle, A.L.C.; Shenkin, A.; Vieira, S.A.; Joly, C.A. Tropical forest light regimes in a human-modified landscape. Ecosphere 2017, 8, e02002. [Google Scholar] [CrossRef] [PubMed]
- Brinck, K.; Fischer, R.; Groeneveld, J.; Lehmann, S.; Dantas De Paula, M.; Pütz, S.; Sexton, J.O.; Song, D.; Huth, A. High resolution analysis of tropical forest fragmentation and its impact on the global carbon cycle. Nat. Commun. 2017, 8. [Google Scholar] [CrossRef] [PubMed]
- Didham, R.K. Edge Structure Determines the Magnitude of Changes in Microclimate and Vegetation Structure in Tropical Forest Fragments. Biotropica 1999, 31, 17–30. [Google Scholar] [CrossRef]
- Laurance, W.F.; Delamônica, P.; Laurance, S.G.; Vasconcelos, H.L.; Lovejoy, T.E. Rainforest fragmentation kills big trees. Nature 2000, 404, 836. [Google Scholar] [CrossRef]
- Magnago, L.F.S.; Magrach, A.; Laurance, W.F.; Martins, S.V.; Meira-Neto, J.A.A.; Simonelli, M.; Edwards, D.P. Would protecting tropical forest fragments provide carbon and biodiversity cobenefits under REDD+? Glob. Chang. Biol. 2015, 21, 3455–3468. [Google Scholar] [CrossRef]
- Poorter, L.; Bongers, F. Leaf traits are good predictors of plant performance across 53 rain forest species. Ecology 2006, 87, 1733–1743. [Google Scholar] [CrossRef]
- Barlow, J.; Lennox, G.D.; Ferreira, J.; Berenguer, E.; Lees, A.C.; Nally, R.M.; Thomson, J.R.; Ferraz, S.F.d.B.; Louzada, J.; Oliveira, V.H.F.; et al. Anthropogenic disturbance in tropical forests can double biodiversity loss from deforestation. Nature 2016, 535, 144–147. [Google Scholar] [CrossRef] [PubMed]
- Van de Perre, F.; Willig, M.R.; Presley, S.J.; Bapeamoni Andemwana, F.; Beeckman, H.; Boeckx, P.; Cooleman, S.; de Haan, M.; De Kesel, A.; Dessein, S.; et al. Reconciling biodiversity and carbon stock conservation in an Afrotropical forest landscape. Sci. Adv. 2018, 4, eaar6603. [Google Scholar] [CrossRef]
- Mitchard, E.T.A. The tropical forest carbon cycle and climate change. Nature 2018, 559, 527–534. [Google Scholar] [CrossRef]
- Ploton, P.; Pélissier, R.; Proisy, C.; Flavenot, T.; Barbier, N.; Rai, S.N.; Couteron, P. Assessing aboveground tropical forest biomass using Google Earth canopy images. Ecol. Appl. 2012, 22, 993–1003. [Google Scholar] [CrossRef]
- Couteron, P.; Pelissier, R.; Nicolini, E.A.; Paget, D. Predicting tropical forest stand structure parameters from Fourier transform of very high-resolution remotely sensed canopy images. J. Appl. Ecol. 2005, 42, 1121–1128. [Google Scholar] [CrossRef]
- Barbier, N.; Couteron, P.; Proisy, C.; Malhi, Y.; Gastellu-Etchegorry, J.P. The variation of apparent crown size and canopy heterogeneity across lowland Amazonian forests. Glob. Ecol. Biogeogr. 2010, 19, 72–84. [Google Scholar] [CrossRef]
- DeFries, R.S.; Houghton, R.A.; Hansen, M.C.; Field, C.B.; Skole, D.; Townshend, J. Carbon emissions from tropical deforestation and regrowth based on satellite observations for the 1980s and 1990s. Proc. Natl. Acad. Sci. USA 2002, 99, 14256–14261. [Google Scholar] [CrossRef]
- Achard, F.; Beuchle, R.; Mayaux, P.; Stibig, H.J.; Bodart, C.; Brink, A.; Carboni, S.; Desclée, B.; Donnay, F.; Eva, H.D.; et al. Determination of tropical deforestation rates and related carbon losses from 1990 to 2010. Glob. Chang. Biol. 2014, 20, 2540–2554. [Google Scholar] [CrossRef]
- Ramankutty, N.; Foley, J.A. Estimating historical changes in global land cover: Croplands from 1700 to 1992. Glob. Biogeochem. Cycles 1999, 13, 997–1027. [Google Scholar] [CrossRef]
- Sader, S.A.; Joyce, A.T. Deforestation Rates and Trends in Costa Rica, 1940 to 1983. Biotropica 1988, 20, 11. [Google Scholar] [CrossRef]
- Willcock, S.; Phillips, O.L.; Platts, P.J.; Swetnam, R.D.; Balmford, A.; Burgess, N.D.; Ahrends, A.; Bayliss, J.; Doggart, N.; Doody, K.; et al. Land cover change and carbon emissions over 100 years in an African biodiversity hotspot. Glob. Chang. Biol. 2016, 22, 2787–2800. [Google Scholar] [CrossRef] [PubMed]
- Song, D.X.; Huang, C.; Sexton, J.O.; Channan, S.; Feng, M.; Townshend, J.R. Use of Landsat and Corona data for mapping forest cover change from the mid-1960s to 2000s: Case studies from the Eastern United States and Central Brazil. ISPRS J. Photogram. Remote Sens. 2015, 103, 81–92. [Google Scholar] [CrossRef]
- Nita, M.D.; Munteanu, C.; Gutman, G.; Abrudan, I.V.; Radeloff, V.C. Widespread forest cutting in the aftermath of World War II captured by broad-scale historical Corona spy satellite photography. Remote Sens. Environ. 2018, 204, 322–332. [Google Scholar] [CrossRef]
- Buitenwerf, R.; Bond, W.J.; Stevens, N.; Trollope, W.S.W. Increased tree densities in South African savannas: >50 years of data suggests CO2 as a driver. Glob. Chang. Biol. 2012, 18, 675–684. [Google Scholar] [CrossRef]
- Hudak, A.T.; Wessman, C.A. Textural Analysis of Historical Aerial Photography to Characterize Woody Plant Encroachment in South African Savanna. Remote Sens. Environ. 1998, 66, 317–330. [Google Scholar] [CrossRef]
- Frankl, A.; Seghers, V.; Stal, C.; De Maeyer, P.; Petrie, G.; Nyssen, J. Using image-based modelling (SfM–MVS) to produce a 1935 ortho-mosaic of the Ethiopian highlands. Int. J. Digit. Earth 2015, 8, 421–430. [Google Scholar] [CrossRef][Green Version]
- Nyssen, J.; Petrie, G.; Mohamed, S.; Gebremeskel, G.; Seghers, V.; Debever, M.; Hadgu, K.M.; Stal, C.; Billi, P.; Demaeyer, P.; et al. Recovery of the aerial photographs of Ethiopia in the 1930s. J. Cult. Herit. 2016, 17, 170–178. [Google Scholar] [CrossRef]
- Lewis, S.L.; Lopez-Gonzalez, G.; Sonké, B.; Affum-Baffoe, K.; Baker, T.R.; Ojo, L.O.; Phillips, O.L.; Reitsma, J.M.; White, L.; Comiskey, J.A.; et al. Increasing carbon storage in intact African tropical forests. Nature 2009, 457, 1003–1006. [Google Scholar] [CrossRef]
- Butsic, V.; Baumann, M.; Shortland, A.; Walker, S.; Kuemmerle, T. Conservation and conflict in the Democratic Republic of Congo: The impacts of warfare, mining, and protected areas on deforestation. Biol. Conserv. 2015, 191, 266–273. [Google Scholar] [CrossRef]
- Kearsley, E.; de Haulleville, T.; Hufkens, K.; Kidimbu, A.; Toirambe, B.; Baert, G.; Huygens, D.; Kebede, Y.; Defourny, P.; Bogaert, J.; et al. Conventional tree height-diameter relationships significantly overestimate aboveground carbon stocks in the Central Congo Basin. Nat. Commun. 2013, 4, 2269. [Google Scholar] [CrossRef]
- Lewis, S.L.; Maslin, M.A. Defining the Anthropocene. Nature 2015, 519, 171–180. [Google Scholar] [CrossRef] [PubMed]
- Bauters, M.; Ampoorter, E.; Huygens, D.; Kearsley, E.; De Haulleville, T.; Sellan, G.; Verbeeck, H.; Boeckx, P.; Verheyen, K. Functional identity explains carbon sequestration in a 77-year-old experimental tropical plantation. Ecosphere 2015, 6, art198. [Google Scholar] [CrossRef]
- Zuiderveld, K. Contrast Limited Adaptive Histogram Equalization. In Graphics GEMs IV; Academic Press: San Diego, CA, USA, 1994; pp. 474–485. [Google Scholar]
- Ullman, S. The Interpretation of Structure from Motion. Proc. R. Soc. Lond. Ser. B Biol. Sci. 1979, 203, 405–426. [Google Scholar]
- QGIS Development team. QGIS Geographic Information System; 2018. Available online: https://www.scirp.org/%28S%28vtj3fa45qm1ean45vvffcz55%29%29/reference/ReferencesPapers.aspx?ReferenceID=1515458 (accessed on 14 February 2020).
- Ronneberger, O.; Fischer, P.; Brox, T. U-Net: Convolutional Networks for Biomedical Image Segmentation. In Medical Image Computing and Computer-Assisted Intervention – MICCAI 2015; Navab, N., Hornegger, J., Wells, W.M., Frangi, A.F., Eds.; Springer International Publishing: Cham, Switzerland, 2015; Volume 9351, pp. 234–241. [Google Scholar] [CrossRef]
- Chollet, F. Keras, 2015. Available online: https://github.com/fchollet/keras (accessed on 14 February 2020).
- Yakubovskiy, P. Segmentation Models, 2019. Available online: https://awesomeopensource.com/project/qubvel/segmentation_models (accessed on 14 February 2020).
- Abadi, M.; Agarwal, A.; Barham, P.; Brevdo, E.; Chen, Z.; Citro, C.; Corrado, G.S.; Davis, A.; Dean, J.; Devin, M.; et al. TensorFlow: Large-Scale Machine Learning on Heterogeneous Systems; 2015. Available online: https://arxiv.org/abs/1603.04467 (accessed on 14 February 2020).
- Kingma, D.P.; Ba, J. Adam: A Method for Stochastic Optimization. arXiv 2017, arXiv:1412.6980. [Google Scholar]
- Dice, L.R. Measures of the Amount of Ecologic Association Between Species. Ecology 1945, 26, 297–302. [Google Scholar] [CrossRef]
- Dale, M.R.T. Spatial Pattern Analysis in Plant Ecology; Cambridge studies in ecology; Cambridge University Press: Cambridge, UK ; New York, NY, USA, 1999. [Google Scholar]
- Hesselbarth, M.H.K.; Sciaini, M.; With, K.A.; Wiegand, K.; Nowosad, J. landscapemetrics: an open-source R tool to calculate landscape metrics. Ecography 2019, 42, 1648–1657. [Google Scholar] [CrossRef]
- Li, B.L. Fractal geometry applications in description and analysis of patch patterns and patch dynamics. Ecol. Model. 2000, 132, 33–50. [Google Scholar] [CrossRef]
- Mandelbrot, B.B. Fractals: Form, Chance and Dimension; W.H. Freeman and Co.: New York, NY, USA, 1977. [Google Scholar]
- Bustillo, E.; Raets, L.; Beeckman, H.; Bourland, N.; Rousseau, M.; Hubau, W.; De Mil, T. Evaluation du Potentiel énergétique de la Biomasse Aérienne Ligneuse des Anciennes Plantations de l’INERA Yangambi; Technical Report; CIFOR: 2018. Available online: https://www.cifor.org/forets/wp-content/uploads/sites/36/2018/11/13-Flyer-DEVELOPPEMENT-DE-L-ENERGIE-DE-LA-BIOMASSE_fr.pdf (accessed on 14 February 2020).
- Couteron, P. Quantifying change in patterned semi-arid vegetation by Fourier analysis of digitized aerial photographs. Int. J. Remote Sens. 2002, 23, 3407–3425. [Google Scholar] [CrossRef]
- Wilcoxon, F. Individual comparisons by ranking methods. Biometrics 1945, 1, 80–83. [Google Scholar] [CrossRef]
- Kadmon, R.; Harari-Kremer, R. Studying Long-Term Vegetation Dynamics Using Digital Processing of Historical Aerial Photographs. Remote Sens. Environ. 1999, 68, 164–176. [Google Scholar] [CrossRef]
- Peres, C.A.; Barlow, J.; Laurance, W.F. Detecting anthropogenic disturbance in tropical forests. Trends Ecol. Evol. 2006, 21, 227–229. [Google Scholar] [CrossRef] [PubMed]
- Verhoeven, G. BRDF and its Impact on Aerial Archaeological Photography: BRDF and its impact on aerial archaeological photography. Archaeol. Prospect. 2017, 24, 133–140. [Google Scholar] [CrossRef]
- Park, J.Y.; Muller-Landau, H.C.; Lichstein, J.W.; Rifai, S.W.; Dandois, J.P.; Bohlman, S.A. Quantifying Leaf Phenology of Individual Trees and Species in a Tropical Forest Using Unmanned Aerial Vehicle (UAV) Images. Remote Sens. 2019, 11, 1534. [Google Scholar] [CrossRef]
- Simini, F.; Anfodillo, T.; Carrer, M.; Banavar, J.R.; Maritan, A. Self-similarity and scaling in forest communities. Proc. Natl. Acad. Sci. USA 2010, 107, 7658–7662. [Google Scholar] [CrossRef] [PubMed]
- Sole, R.V.; Manrubia, S.C. Self-similarity in rain forests: evidence for a critical state. Phys. Rev. E 1995, 51, 6250–6253. [Google Scholar] [CrossRef]
- Hughes, M.L.; McDowell, P.F.; Marcus, W.A. Accuracy assessment of georectified aerial photographs: Implications for measuring lateral channel movement in a GIS. Geomorphology 2006, 74, 1–16. [Google Scholar] [CrossRef]
- Buscombe, D.; Ritchie, A. Landscape Classification with Deep Neural Networks. Geosciences 2018, 8, 244. [Google Scholar] [CrossRef]
- Gascon, C.; Williamson, G.B.; Fonseca, G.A.B.D. Receding Forest Edges and Vanishing Reserves. Sci. New Ser. 2000, 288, 1356–1358. [Google Scholar]
- Phillips, O.L.; Rose, S.; Mendoza, A.M.; Vargas, P.N. Resilience of Southwestern Amazon Forests to Anthropogenic Edge Effects. Conserv. Biol. 2006, 20, 1698–1710. [Google Scholar] [CrossRef]
- Reinmann, A.B.; Hutyra, L.R. Edge effects enhance carbon uptake and its vulnerability to climate change in temperate broadleaf forests. Proc. Natl. Acad. Sci. USA 2017, 114, 107–112. [Google Scholar] [CrossRef]
- Arima, E.Y.; Walker, R.T.; Perz, S.; Souza, C. Explaining the fragmentation in the Brazilian Amazonian forest. J. Land Use Sci. 2015, 1–21. [Google Scholar] [CrossRef]
- Arima, E.Y.; Barreto, P.; Araújo, E.; Soares-Filho, B. Public policies can reduce tropical deforestation: Lessons and challenges from Brazil. Land Use Policy 2014, 41, 465–473. [Google Scholar] [CrossRef]
- Larson, A.M. Forest tenure reform in the age of climate change: Lessons for REDD+. Glob. Environ. Chang. 2011, 21, 540–549. [Google Scholar] [CrossRef]
- Gourlet-Fleury, S.; Mortier, F.; Fayolle, A.; Baya, F.; Ouédraogo, D.; Bénédet, F.; Picard, N. Tropical forest recovery from logging: A 24 year silvicultural experiment from Central Africa. Philos. Trans. R. Soc. B Biol. Sci. 2013, 368, 20120302. [Google Scholar] [CrossRef] [PubMed]
- Solórzano, J.V.; Gallardo-cruz, J.A.; González, E.J.; Peralta-carreta, C.; Hernández-gómez, M.; Oca, A.F.M.D.; Cervantes-jiménez, L.G.; Solórzano, J.V.; Gallardo-cruz, J.A.; González, E.J.; et al. Contrasting the potential of Fourier transformed ordination and gray level co-occurrence matrix textures to model a tropical swamp forest’ s structural and diversity attributes. J. Appl. Remote Sens. 2018, 12, 036006. [Google Scholar] [CrossRef]
- R Core Team. R: A Language and Environment for Statistical Computing; R Foundation for Statistical Computing: Vienna, Austria, 2019. [Google Scholar]
- Hijmans, R.J. Raster: Geographic Data Analysis and Modeling, 2019. Available online: https://rdrr.io/cran/raster/ (accessed on 14 February 2020).
- Leutner, B.; Horning, N.; Schwalb-Willmann, J. RStoolbox: Tools for Remote Sensing Data Analysis, 2019. Available online: https://bleutner.github.io/RStoolbox/ (accessed on 14 February 2020).
- Wickham, H. Tidyverse: Easily Install and Load the ‘Tidyverse’, 2017. Available online: https://tidyverse.tidyverse.org/ (accessed on 14 February 2020).
- Arnold, J.B. Ggthemes: Extra Themes, Scales and Geoms for ‘ggplot2’, 2019. Available online: https://rdrr.io/cran/ggthemes/ (accessed on 14 February 2020).
- Wickham, H. Scales: Scale Functions for Visualization, 2018. Available online: https://cran.r-project.org/web/packages/scales/index.html (accessed on 14 February 2020).
- Wilke, C.O. Cowplot: Streamlined Plot Theme and Plot Annotations for ‘ggplot2’, 2019. Available online: https://rdrr.io/cran/cowplot/ (accessed on 14 February 2020).
- Pebesma, E. Simple Features for R: Standardized Support for Spatial Vector Data. R J. 2018, 10, 439–446. [Google Scholar] [CrossRef]
- South, A. Rnaturalearth: World Map Data from Natural Earth, 2017. Available online: https://cran.r-project.org/web/packages/rnaturalearth/rnaturalearth.pdf (accessed on 14 February 2020).


| Training | Testing | Validation | |
|---|---|---|---|
| forest | 300 | 100 | 100 |
| non-forest | 294 | 92 | 84 |
| CNN | Geo-Eye (Full Scene) | Aerial Survey (All Polygons) | Aerial Survey (Validation Polygons) | |||
|---|---|---|---|---|---|---|
| Non-Forest | Forest | Non-Forest | Forest | Non-Forest | Forest | |
| non-forest | 10.17 | 8.55 | 97.4 | 0.19 | 98.59 | 0.0 |
| forest | 3.75 | 77.52 | 2.6 | 99.81 | 1.41 | 100.0 |
| Accuracy | ||||||
| 87.70 | 98.61 | 99.3 | ||||
| AGC | ||
|---|---|---|
| ha | Gg C | |
| Total scene area | 93,431 | |
| Non-forest cover (1958) | 16,200 | |
| Forest cover | 68,455 | |
| - of which forest edges | 13,151 | |
| reforestation >1958 | 9918 | 811–1592 |
| deforestation >2000 | 8776 | 1408 ± 209 |
| deforestation >1958 (permanent) | 6282 | 1008 ± 150 |
| Perimeter (m) | Area (ha) | Ratio (m−1) | Fractal Dimension | |
|---|---|---|---|---|
| historical | 1451.58 ± 943.27 | 5.25 ± 5.02 | 0.03 ± 0.01 | 1.09 ± 0.04 |
| contemporary | 921.74 ± 362.59 | 1.86 ± 0.75 | 0.05 ± 0.01 | 1.1 ± 0.05 |
© 2020 by the authors. Licensee MDPI, Basel, Switzerland. This article is an open access article distributed under the terms and conditions of the Creative Commons Attribution (CC BY) license (http://creativecommons.org/licenses/by/4.0/).
Share and Cite
Hufkens, K.; de Haulleville, T.; Kearsley, E.; Jacobsen, K.; Beeckman, H.; Stoffelen, P.; Vandelook, F.; Meeus, S.; Amara, M.; Van Hirtum, L.; et al. Historical Aerial Surveys Map Long-Term Changes of Forest Cover and Structure in the Central Congo Basin. Remote Sens. 2020, 12, 638. https://doi.org/10.3390/rs12040638
Hufkens K, de Haulleville T, Kearsley E, Jacobsen K, Beeckman H, Stoffelen P, Vandelook F, Meeus S, Amara M, Van Hirtum L, et al. Historical Aerial Surveys Map Long-Term Changes of Forest Cover and Structure in the Central Congo Basin. Remote Sensing. 2020; 12(4):638. https://doi.org/10.3390/rs12040638
Chicago/Turabian StyleHufkens, Koen, Thalès de Haulleville, Elizabeth Kearsley, Kim Jacobsen, Hans Beeckman, Piet Stoffelen, Filip Vandelook, Sofie Meeus, Michael Amara, Leen Van Hirtum, and et al. 2020. "Historical Aerial Surveys Map Long-Term Changes of Forest Cover and Structure in the Central Congo Basin" Remote Sensing 12, no. 4: 638. https://doi.org/10.3390/rs12040638
APA StyleHufkens, K., de Haulleville, T., Kearsley, E., Jacobsen, K., Beeckman, H., Stoffelen, P., Vandelook, F., Meeus, S., Amara, M., Van Hirtum, L., Van den Bulcke, J., Verbeeck, H., & Wingate, L. (2020). Historical Aerial Surveys Map Long-Term Changes of Forest Cover and Structure in the Central Congo Basin. Remote Sensing, 12(4), 638. https://doi.org/10.3390/rs12040638