Hailstorm Detection by Satellite Microwave Radiometers
Abstract
1. Introduction
2. Data Selection
2.1. The MicroWave Cloud Classification (MWCC) Method
3. The Hail Detection Model
3.1. The MWCC Training Dataset
3.2. AMSU-B Matchup Data
3.3. The Hail Detection Model
4. Validation
5. Application Examples
6. Summary and Conclusions
Author Contributions
Funding
Acknowledgments
Conflicts of Interest
Abbreviations
| AMSU-B | Advanced Microwave Sounding Unit-B |
| AR | Argentina |
| ATMS | Advanced Technology Microwave Sounder |
| BTD | Brightness Temperature Difference |
| CONUS | Conterminous United States |
| DPR | Dual-frequency Precipitation Radar |
| ESSL | European Severe Storms Laboratory |
| EU | Europe |
| FOV | Field of View |
| IFOV | Instantaneous FOV |
| IR | InfraRed |
| GMI | GPM Microwave Imager |
| GPM | Global Precipitation Measurement mission |
| MHS | Microwave Humidity Sounder |
| MWCC | MicroWave Cloud Classification method |
| NOAA | National Oceanic and Atmospheric Administration |
| PMW | Passive Microwave |
| PMWCC | Perturbation of MWCC |
| SPC | Storm Prediction Center |
| SSM/I | Special Sensor Microwave/Imager |
| SSMIS | Special Sensor Microwave Imager/Sounder |
| TB | Brightness Temperature |
| TRMM | Tropical Rainfall Measuring Mission |
| US | United States of America |
| VIS | Visible |
| 183-WSL | Water vapor Strong Lines at 183 GHz algorithm |
References
- Ferraro, R.R.; Weng, F.; Grody, N.; Zhao, L.; Meng, H.; Kongoli, C.; Pellegrino, P.; Qiu, S.; Dean, C. NOAA operational hydrological products derived from the advanced atmospheric sounding unit. IEEE Trans. Geosci. Remote Sens. 2005, 43, 1036–1049. [Google Scholar] [CrossRef]
- Staelin, D.H.; Chen, F.W. Precipitation observations near 54 and 183 GHz using the NOAA-15 satellite. IEEE Trans. Geosci. Remote Sens. 2000, 38, 2322–2332. [Google Scholar] [CrossRef]
- Sanò, P.; Panegrossi, G.; Casella, D.; Marra, A.C.; D’Adderio, L.P.; Rysman, J.F.; Dietrich, S. The passive microwave neural network precipitation retrieval (PNPR) algorithm for the CONICAL scanning Global Microwave Imager (GMI) radiometer. Remote Sens. 2018, 10, 1122. [Google Scholar] [CrossRef]
- Laviola, S.; Levizzani, V. The 183-WSL fast rainrate retrieval algorithm. Part I: Retrieval design. Atmos. Res. 2011, 99, 443–461. [Google Scholar] [CrossRef]
- Laviola, S.; Levizzani, V.; Cattani, E.; Kidd, C. The 183-WSL fast rainrate retrieval algorithm. Part II: Validation using ground radar measurements. Atmos. Res. 2013, 134, 77–86. [Google Scholar] [CrossRef]
- Hong, G.; Heygster, G. Detection of deep convective clouds from AMSU-B water vapor channels measurements. J. Geophys. Res. 2005, 110, D05205. [Google Scholar] [CrossRef]
- Laviola, S.; Levizzani, V. Observing precipitation by means of water vapor absorption lines: A first check of the retrieval capabilities of the 183-WSL rain retrieval method. Ital. J. Remote Sens. 2009, 41, 39–49. [Google Scholar] [CrossRef]
- Funatsu, B.M.; Claud, C.; Chaboureau, J.-P. Potential of Advanced Microwave Sounding Unit to identify precipitating systems and associated upper-level features in the Mediterranean region: Case studies. J. Geophys. Res. 2007, 112, D17113. [Google Scholar] [CrossRef]
- Levizzani, V.; Laviola, S.; Cattani, E.; Costa, M.J. Extreme precipitation on the Island of Madeira on 20 February 2010 as seen by satellite passive microwave sounders. Eur. J. Remote Sens. 2013, 46, 475–489. [Google Scholar] [CrossRef]
- Bauer-Messmer, B.; Waldvogel, A. Satellite data detection and prediction of hail. Atmos. Res. 1997, 43, 217–231. [Google Scholar] [CrossRef]
- De Coning, E.; Gijben, M.; Maseko, B.; van Hemert, L. Using satellite data to identify and track intense thunderstorms in South and southern Africa. S. Afr. J. Sci. 2015, 111, 2014-0402. [Google Scholar] [CrossRef][Green Version]
- Rosenfeld, D.; Woodley, W.L.; Lerner, A.; Kelman, G.; Lindsey, D.T. Satellite detection of severe convective storms by their retrieved vertical profiles of cloud particle effective radius and thermodynamic phase. J. Geophys. Res. 2008, 113, D04208. [Google Scholar] [CrossRef]
- Mecikalski, J.R.; Watts, P.D.; Koenig, M. Use of Meteosat Second Generation optimal cloud analysis fields for understanding physical attributes of growing cumulus clouds. Atmos. Res. 2011, 102, 175–190. [Google Scholar] [CrossRef]
- Merino, A.; López, L.; Sánchez, J.L.; García-Ortega, E.; Cattani, E.; Levizzani, V. Daytime identification of summer hailstorm cells from MSG data. Nat. Hazards Earth Syst. Sci. 2014, 14, 1017–1033. [Google Scholar] [CrossRef]
- Sánchez, J.L.; Gil-Robles, B.; Dessens, J.; Martin, E.; López, L.; Marcos, J.L.; Berthet, C.; Fernández, J.T.; García-Ortega, E. Characterization of hailstone size spectra in hailpad networks in France, Spain, and Argentina. Atmos. Res. 2009, 93, 641–654. [Google Scholar] [CrossRef]
- Prein, A.; Holland, G.J. Global estimates of damaging hail hazard. Weather Clim. Extrem. 2018, 22, 10–23. [Google Scholar] [CrossRef]
- Cintineo, J.L.; Smith, T.M.; Lakshmanan, V.; Brooks, H.E.; Ortega, K.L. An objective high-resolution hail climatology of the contiguous United States. Weather Forecast. 2012, 27, 1235–1248. [Google Scholar] [CrossRef]
- Nisi, L.; Martius, O.; Kunz, M.; Germann, U. Spatial and temporal distribution of hailstorms in the Alpine region: A long-term, high resolution, radar-based analysis. Quart. J. R. Meteorol. Soc. 2016, 142, 1590–1604. [Google Scholar] [CrossRef]
- Smith, T.M.; Lakshmanan, V.; Stumpf, G.J.; Ortega, K.L.; Hondl, K.; Cooper, K.; Calhoun, K.M.; Kingfield, D.M.; Manross, K.L.; Toomey, R.; et al. Multi-Radar Multi-Sensor severe weather and aviation products: Initial operating capabilities. Bull. Am. Meteorol. Soc. 2016, 97, 1617–1630. [Google Scholar] [CrossRef]
- Punge, H.J.; Bedka, K.M.; Kunz, M.; Werner, A. A new physically based stochastic event catalog for hail in Europe. Nat. Hazards 2014, 73, 1625–1645. [Google Scholar] [CrossRef]
- Warren, R.A.; Ramsay, H.A.; Siems, S.T.; Manton, M.J.; Peter, J.R.; Protat, A.; Pillalamarri, A. Radar-based climatology of damaging hailstorms in Brisbane and Sydney, Australia. Quart. J. R. Meteorol. Soc. 2019. [Google Scholar] [CrossRef]
- Ajvazyan, H.M.; Ajvazyan, H.H. Hail embryons detection in clouds using passive and active radars in millimeter and submillimeter wave bands. Int. J. Infrared Millim. Waves 1993, 14, 1155–1174. [Google Scholar] [CrossRef]
- Spencer, R.W.; Olson, W.S.; Rongzhang, W.; Martin, D.W.; Weinman, J.A.; Santek, D.A. Heavy thunderstorms observed over land by the Nimbus-7 scanning multichannel microwave radiometer. J. Clim. Appl. Meteorol. 1983, 22, 1041–1046. [Google Scholar] [CrossRef][Green Version]
- Spencer, R.W.; Howland, M.R.; Santek, D.A. Severe storm identification with satellite microwave radiometry: An initial investigation with Nimbus-7 SMMR data. J. Clim. Appl. Meteorol. 1987, 26, 749–754. [Google Scholar] [CrossRef]
- Spencer, R.W.; Santek, D.A. Measuring the global distribution of intense convection over land with passive microwave radiometry. J. Clim. Appl. Meteorol. 1985, 24, 860–864. [Google Scholar] [CrossRef][Green Version]
- Cecil, D.J. Passive microwave brightness temperatures as proxies for hailstorms. J. Appl. Meteorol. Climatol. 2009, 48, 1281–1286. [Google Scholar] [CrossRef]
- Cecil, D.J. Relating passive 37-GHz scattering to radar profiles in strong convection. J. Appl. Meteorol. Climatol. 2011, 50, 233–240. [Google Scholar] [CrossRef]
- Cecil, D.J.; Blankenship, C.B. Toward a global climatology of severe hailstorms as estimated by satellite passive microwave imagers. J. Clim. 2012, 25, 687–703. [Google Scholar] [CrossRef]
- Ferraro, R.R.; Beauchamp, J.; Cecil, D.J.; Heymsfield, G. A prototype hail detection algorithm and climatology developed with the Advanced Microwave Sounding Unit (AMSU). Atmos. Res. 2015, 163, 24–35. [Google Scholar] [CrossRef]
- Ni, X.; Liu, C.; Zhang, Q.; Cecil, D.J. Properties of hail storms over China and the United States from the Tropical Rainfall Measuring Mission. J. Geophys. Res. 2016, 121, 12031–12044. [Google Scholar] [CrossRef]
- Ni, X.; Liu, C.; Cecil, D.J.; Zhang, Q. On the detection of hail using satellite microwave radiometers and precipitation radar. J. Appl. Meteorol. Climatol. 2017, 56, 2693–2709. [Google Scholar] [CrossRef]
- Marra, A.C.; Porcù, F.; Baldini, L.; Petracca, M.; Casella, D.; Dietrich, S.; Mugnai, A.; Sanò, P.; Vulpiani, G.; Panegrossi, G. Observational analysis of an exceptionally intense hailstorm over the Mediterranean area: Role of the GPM Core Observatory. Atmos. Res. 2017, 192, 72–90. [Google Scholar] [CrossRef]
- Mroz, K.; Battaglia, A.; Lang, T.J.; Cecil, D.J.; Tanelli, S.; Tridon, F. Hail-detection algorithm for the GPM Core Observatory satellite sensors. J. Appl. Meteorol. Climatol. 2017, 56, 1939–1957. [Google Scholar] [CrossRef]
- Mroz, K.; Battaglia, A.; Lang, T.J.; Tanelli, S.; Sacco, G.F. Global Precipitation Measuring Dual-Frequency Precipitation Radar observations of hailstorm vertical structure: Current capabilities and drawbacks. J. Appl. Meteorol. Climatol. 2018, 57, 2161–2178. [Google Scholar] [CrossRef]
- Bang, S.D.; Cecil, D.J. Constructing a multifrequency passive microwave hail retrieval and climatology in the GPM domain. J. Appl. Meteorol. Climatol. 2019, 58, 1889–1904. [Google Scholar] [CrossRef]
- Leppert, K.D., II; Cecil, D.J. Signatures of hydrometeor species from airborne passive microwave data for frequencies 10-183 GHz. J. Appl. Meteorol. Climatol. 2015, 54, 1313–1334. [Google Scholar] [CrossRef]
- Bauer, P.; Moreau, E.; Di Michele, S. Hydrometeor retrieval accuracy using microwave window and sounding channel observations. J. Appl. Meteorol. 2005, 44, 1016–1032. [Google Scholar] [CrossRef]
- Bennartz, R.; Bauer, P. Sensitivity of microwave radiances at 85–183 GHz to precipitating ice particles. Radio Sci. 2003, 38, 8075. [Google Scholar] [CrossRef]
- Skofronick-Jackson, G.M.; Gasiewski, A.J.; Wang, J.R. Influence of microphysical cloud parameterizations on microwave brightness temperatures. IEEE Trans. Geosci. Remote Sens. 2002, 40, 187–196. [Google Scholar] [CrossRef]
- Hong, G.; Heygster, G. Sensitivity of microwave brightness temperatures to hydrometeors in a tropical deep convective cloud system at 89–190 GHz. Radio Sci. 2005, 40, RS4003. [Google Scholar] [CrossRef]
- Wang, J.R.; Zhan, J.; Racette, P. Storm-associated microwave radiometric signatures in the frequency range of 90–220 GHz. J. Atmos. Ocean. Technol. 1997, 14, 13–31. [Google Scholar] [CrossRef]
- Karbou, F.; Prigent, C.; Eymard, L.; Pardo, J. Microwave land emissivity calculations using AMSU measurements. IEEE Trans. Geosci. Remote Sens. 2005, 43, 948–958. [Google Scholar] [CrossRef]
- Verhulst, P.-F. Recherches mathématiques sur la loi d’accroissement de la population. Nouv. Mémoires l’Académie R. Sci. Belles-Lett. Brux. 1845, 18, 14–54. Available online: http://eudml.org/doc/182533 (accessed on 12 February 2020).
- Mayer, P.S.; Ausbel, J.H. Carrying capacity: A model with logistically varying limits. Technol. Forecast. Soc. Chang. 1999, 61, 209–214. [Google Scholar] [CrossRef]
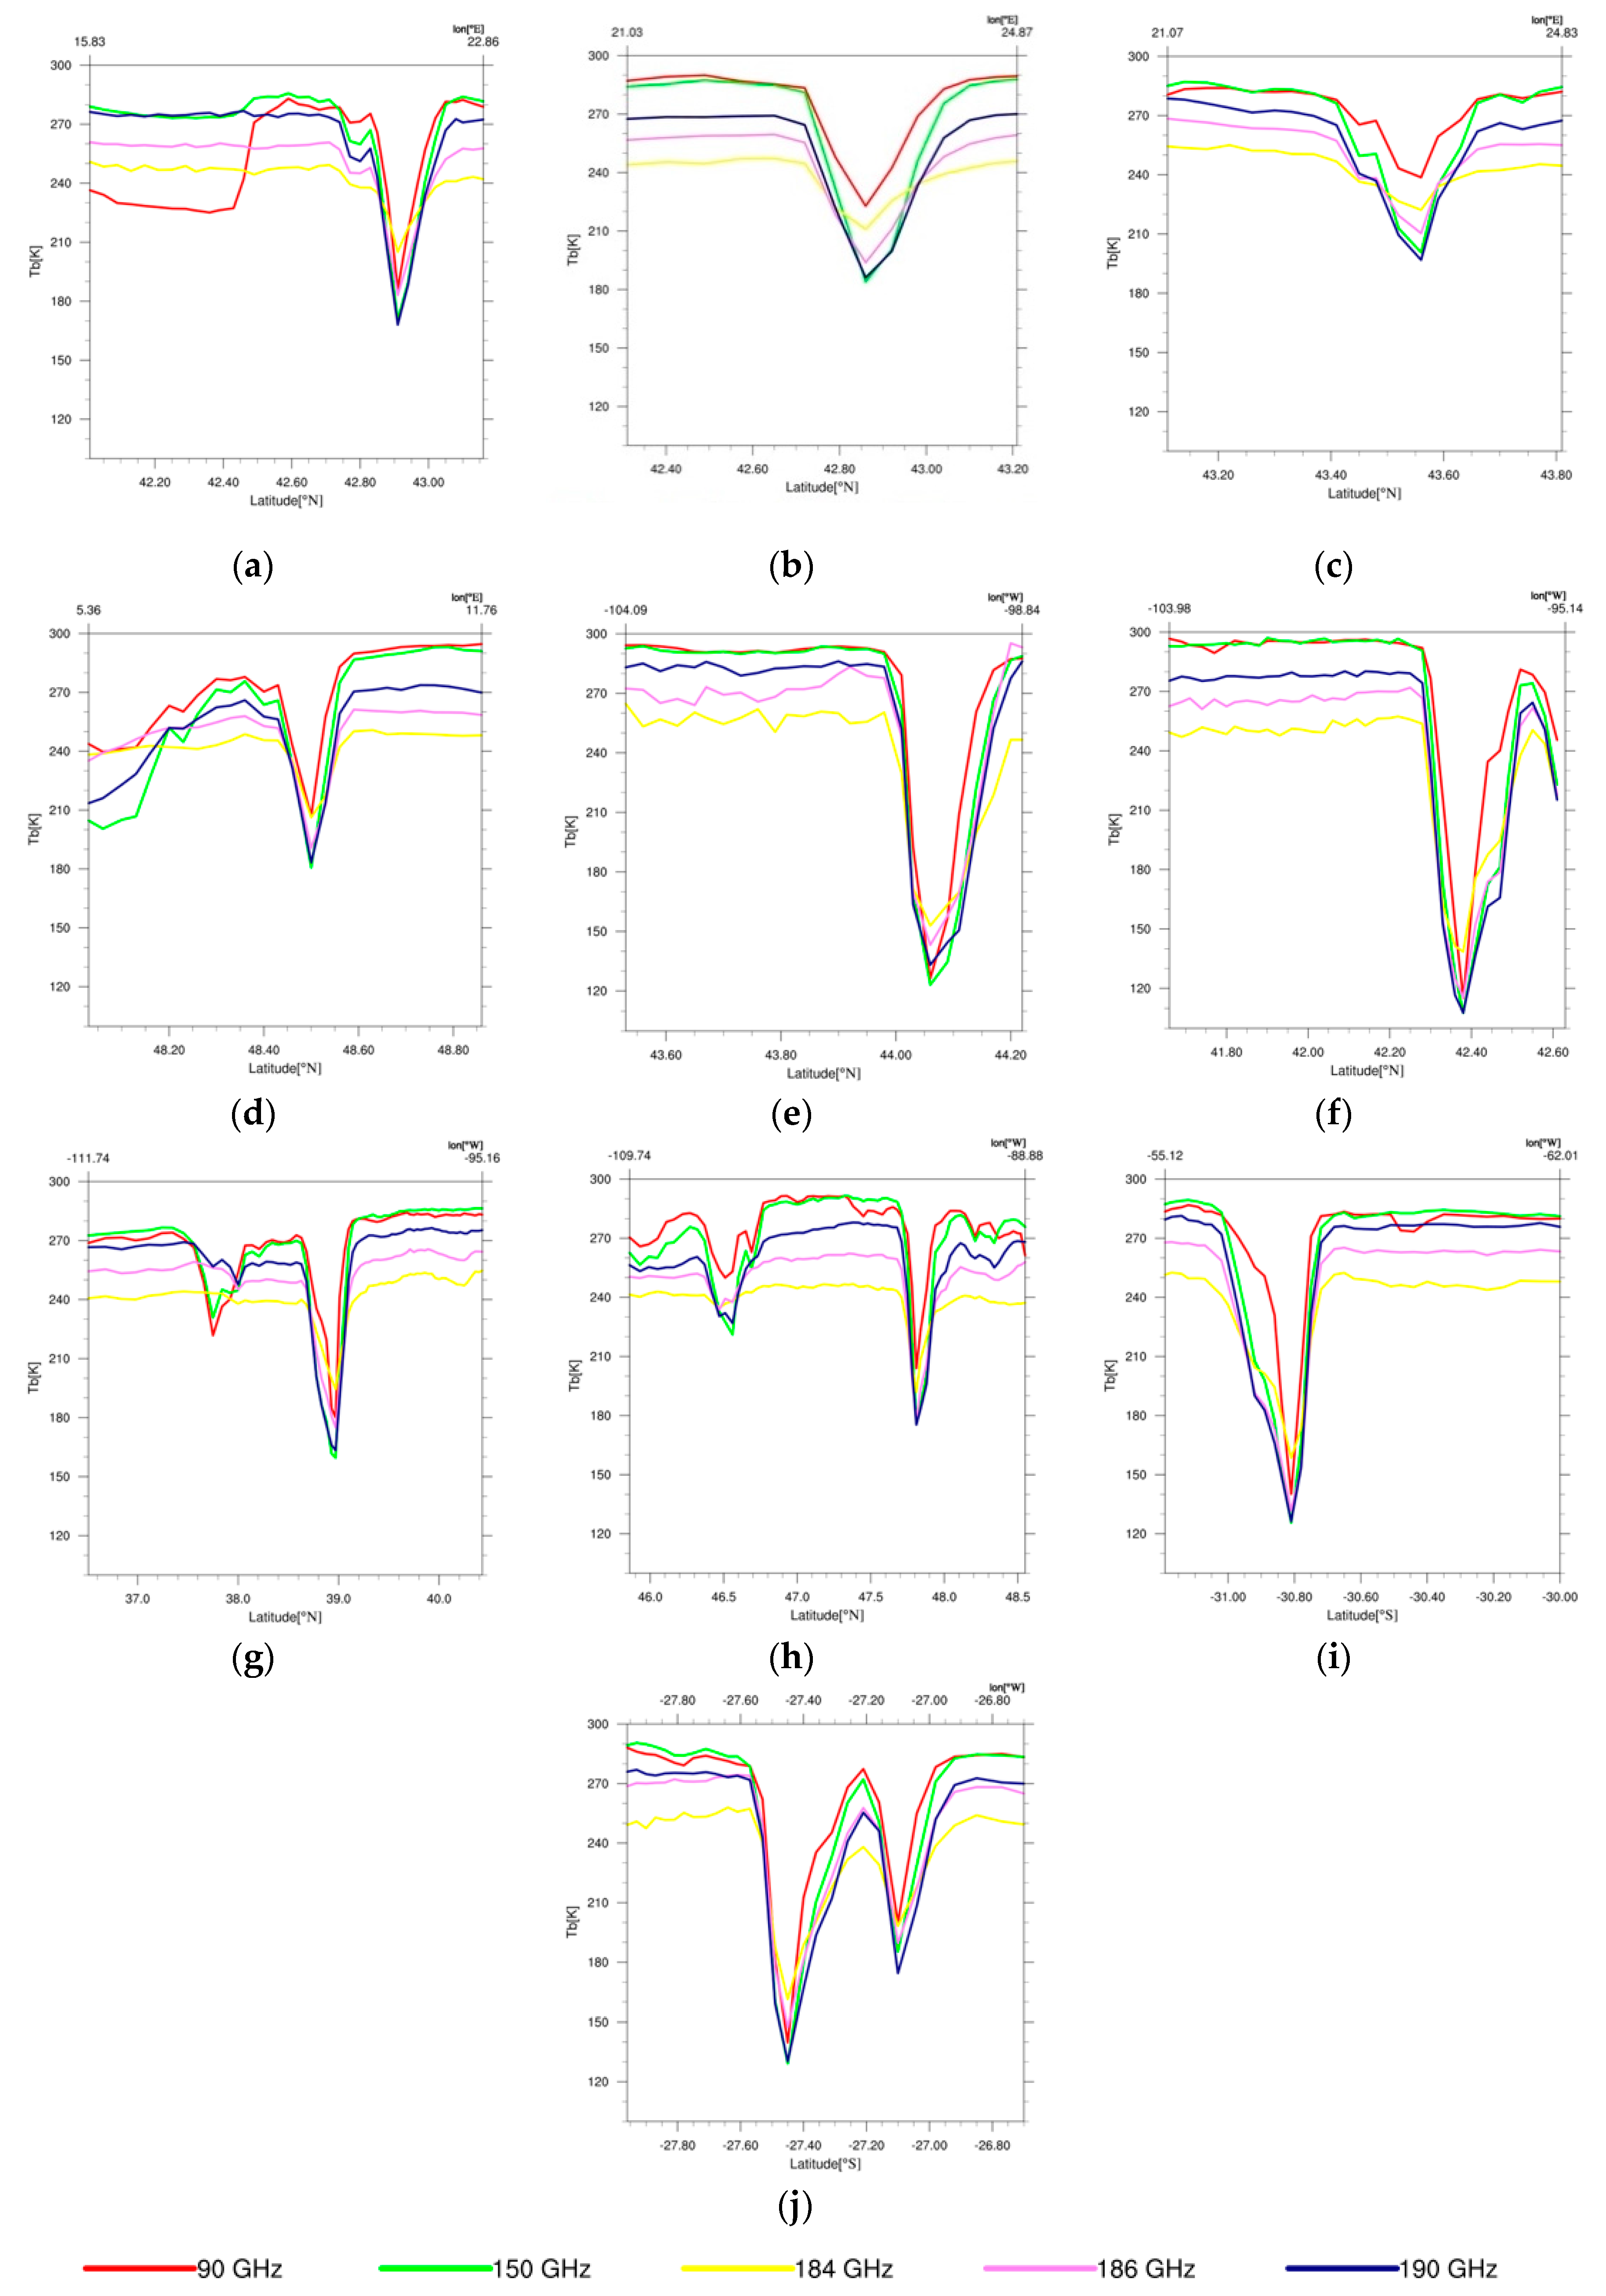
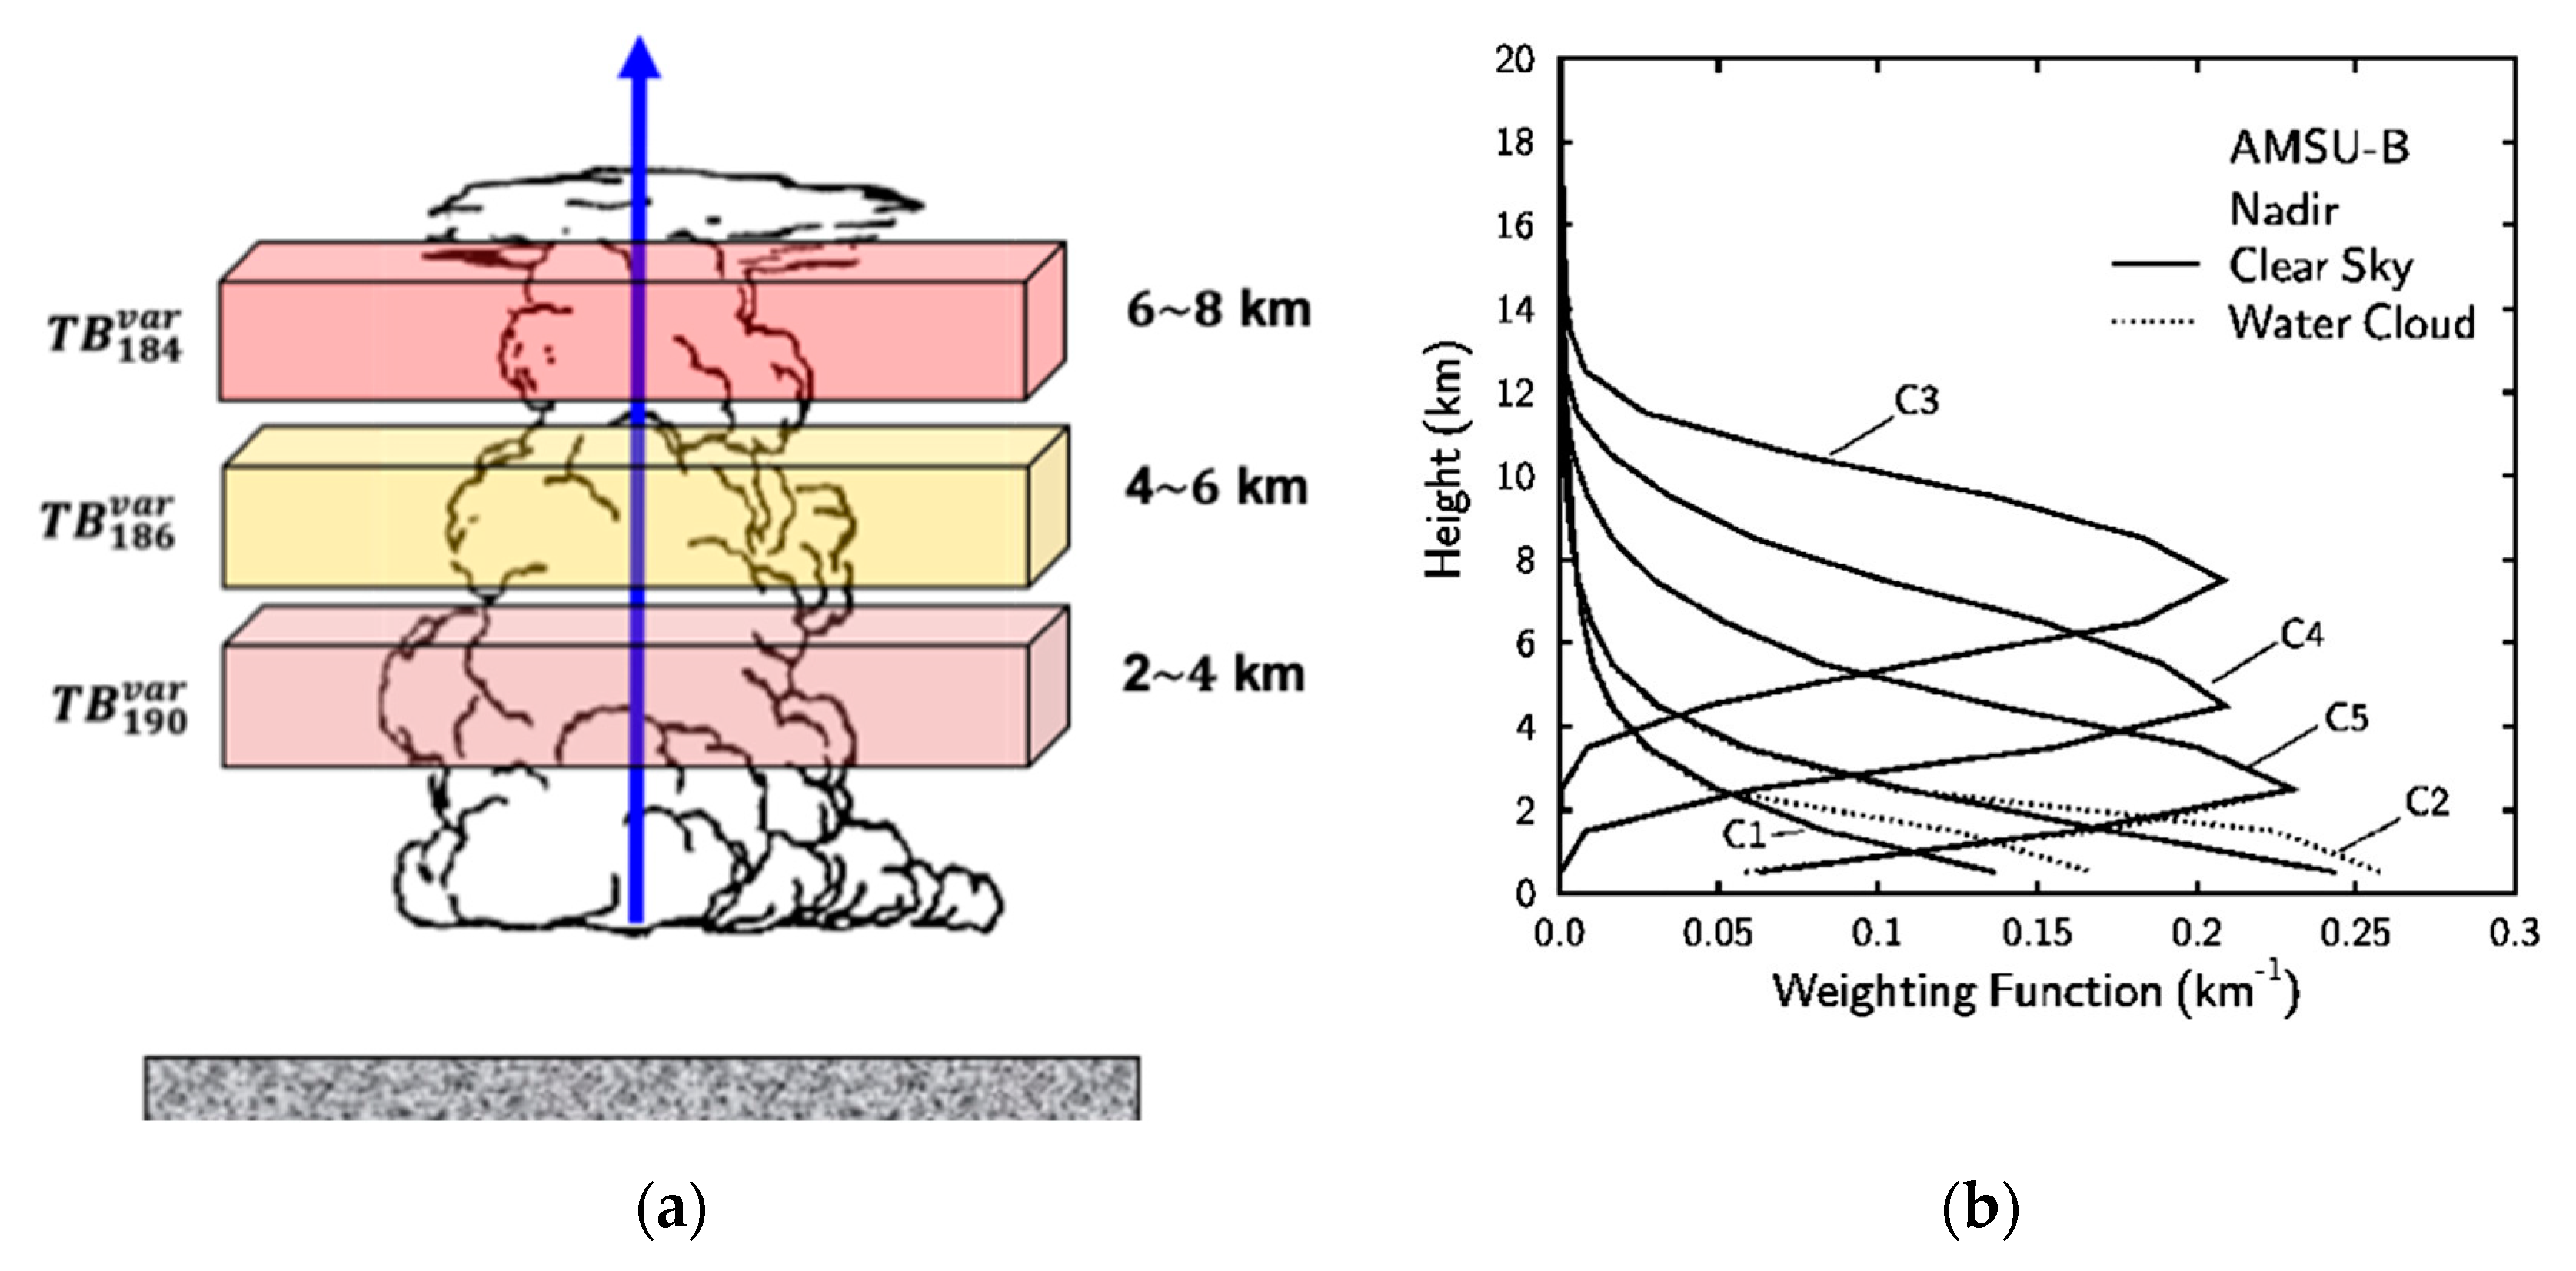
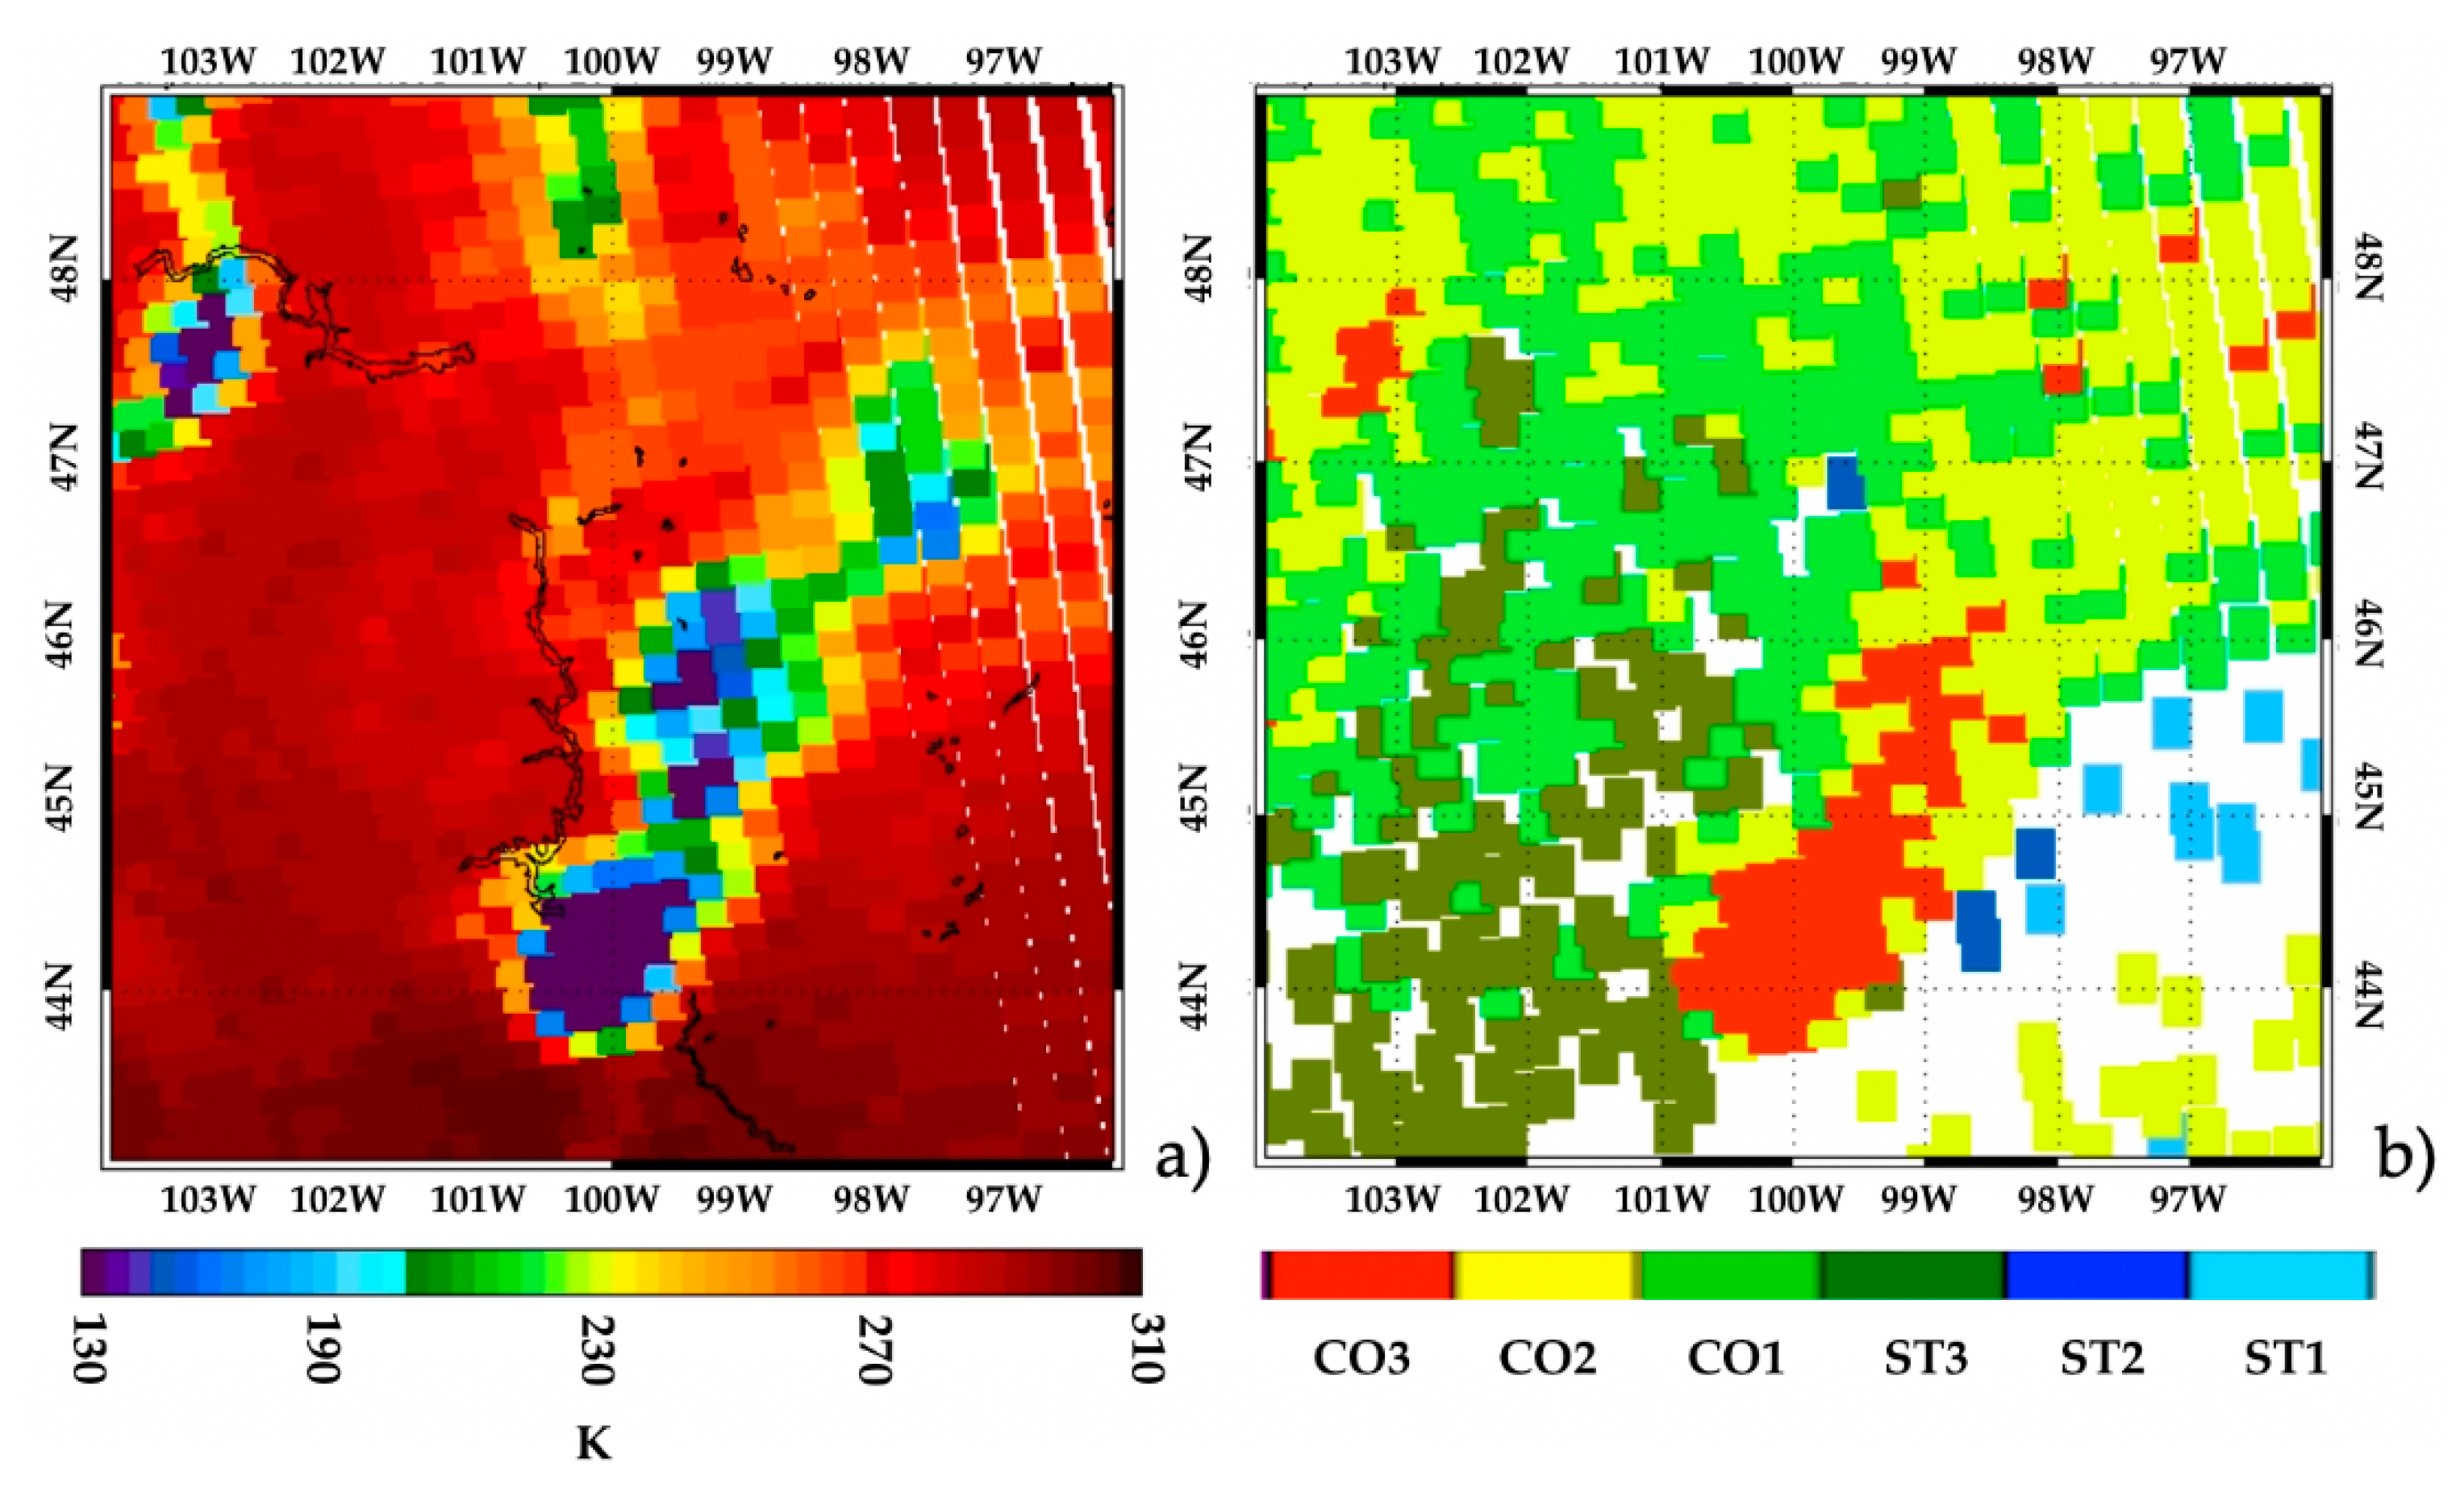
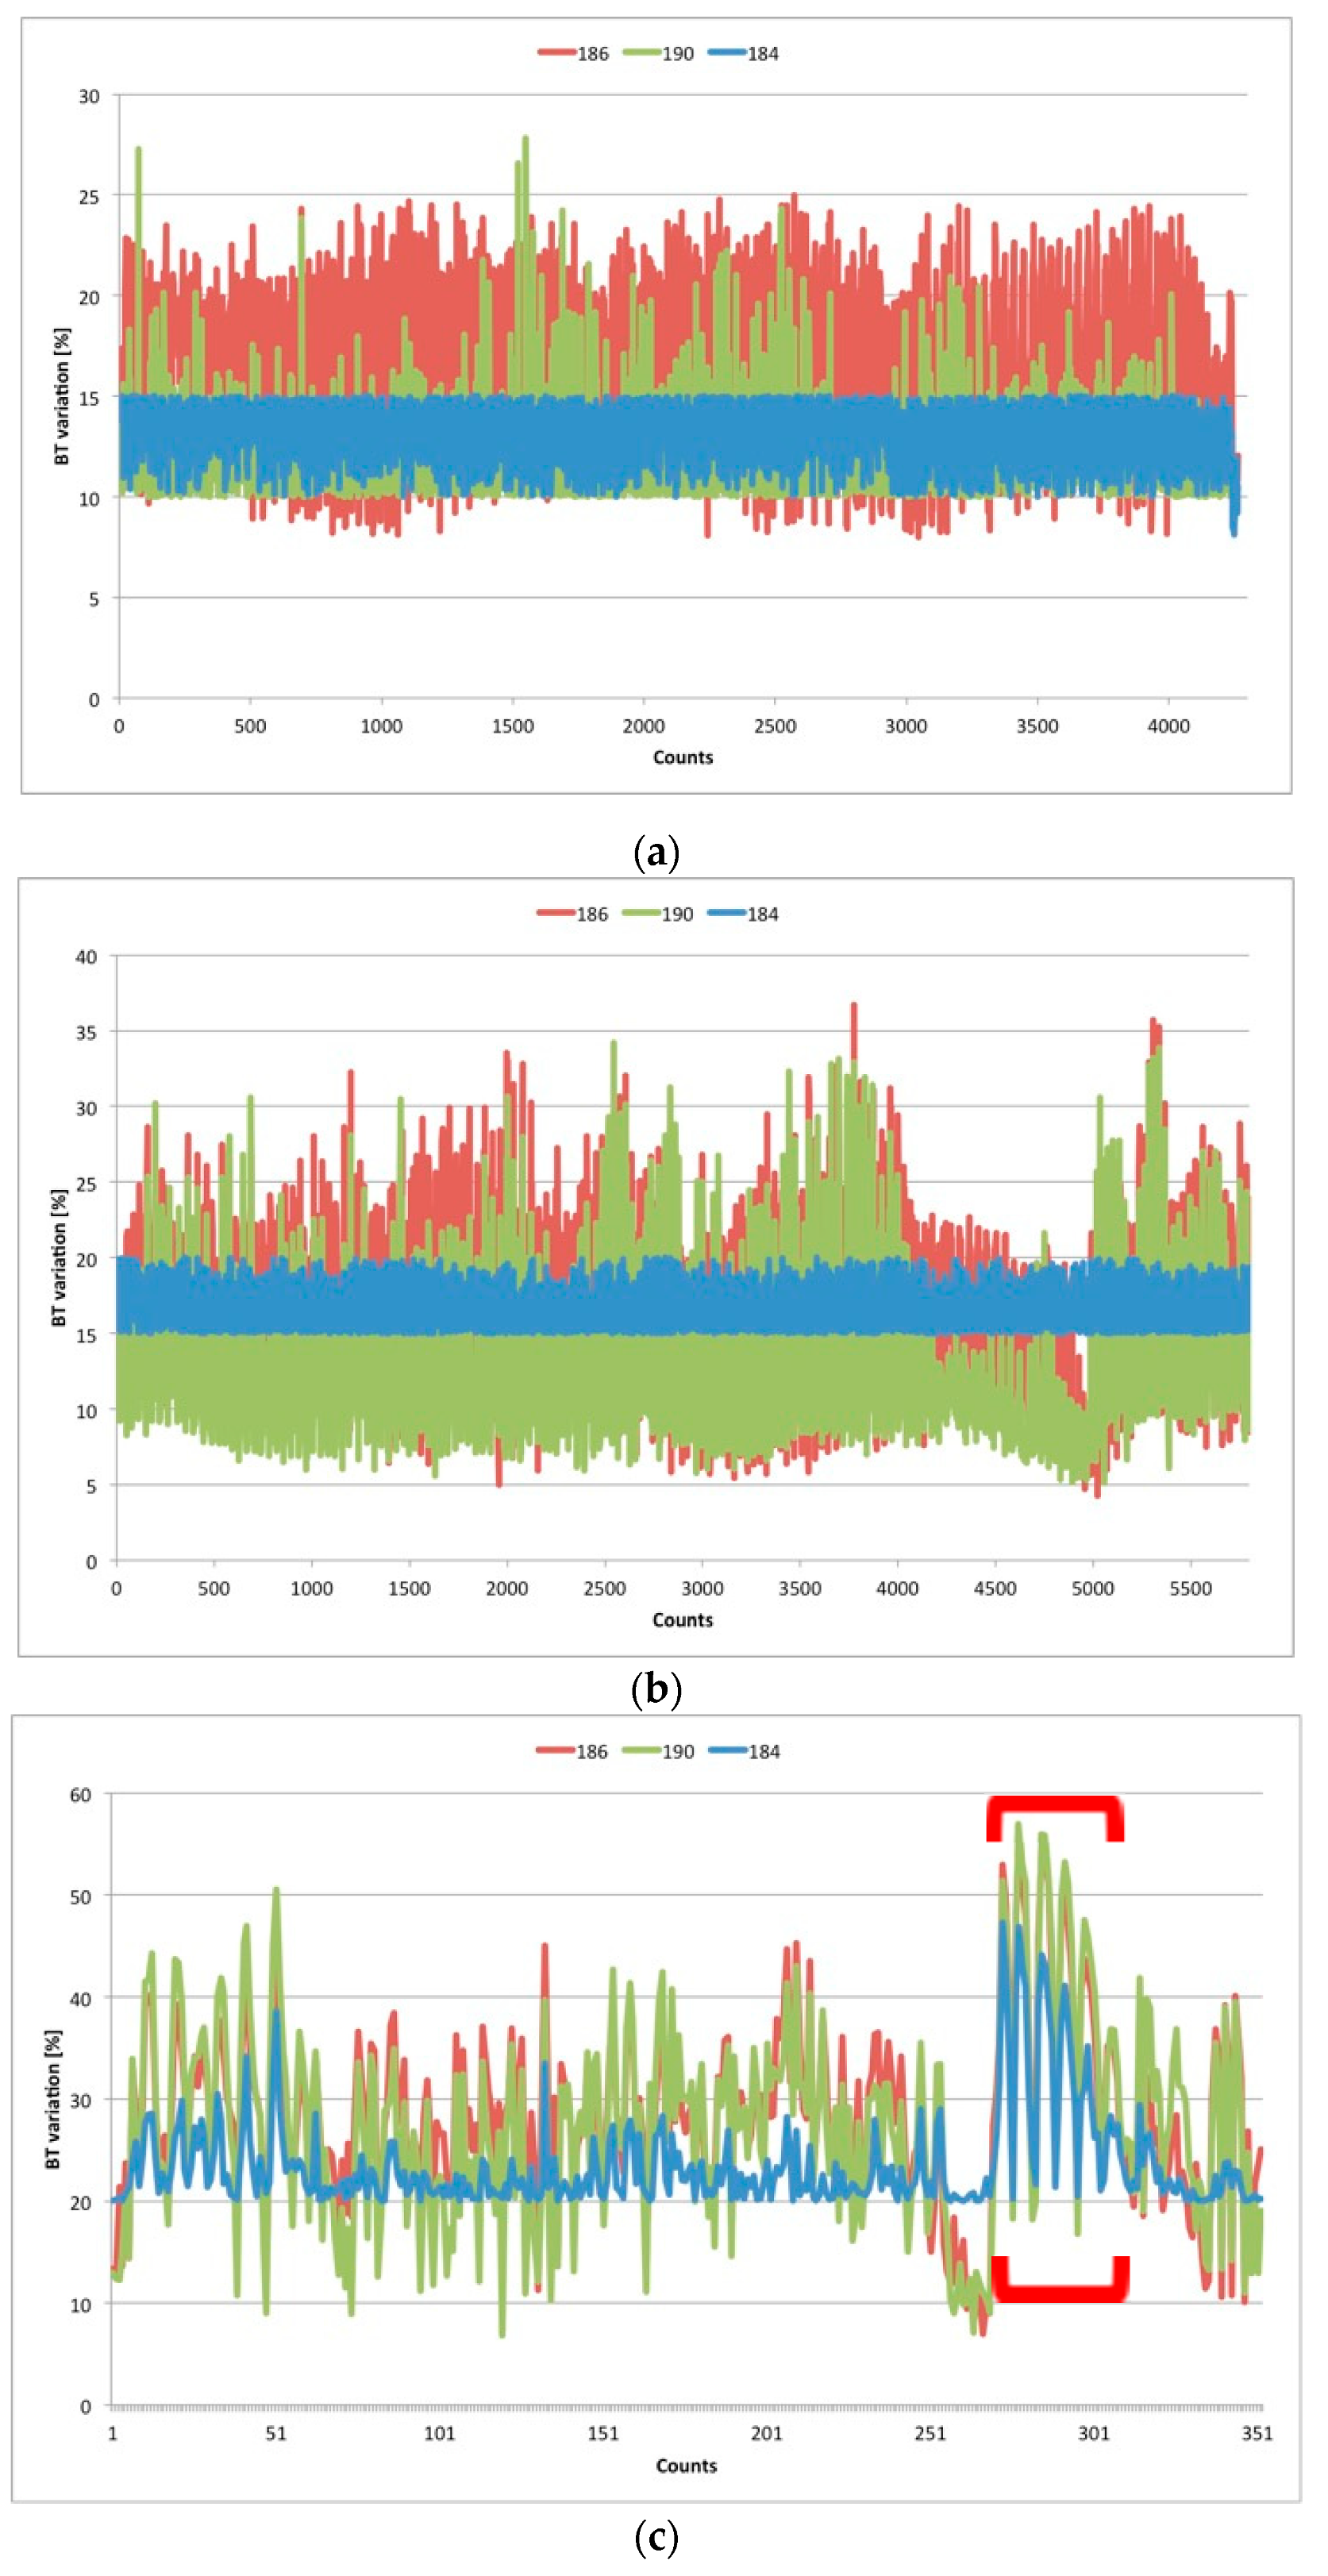
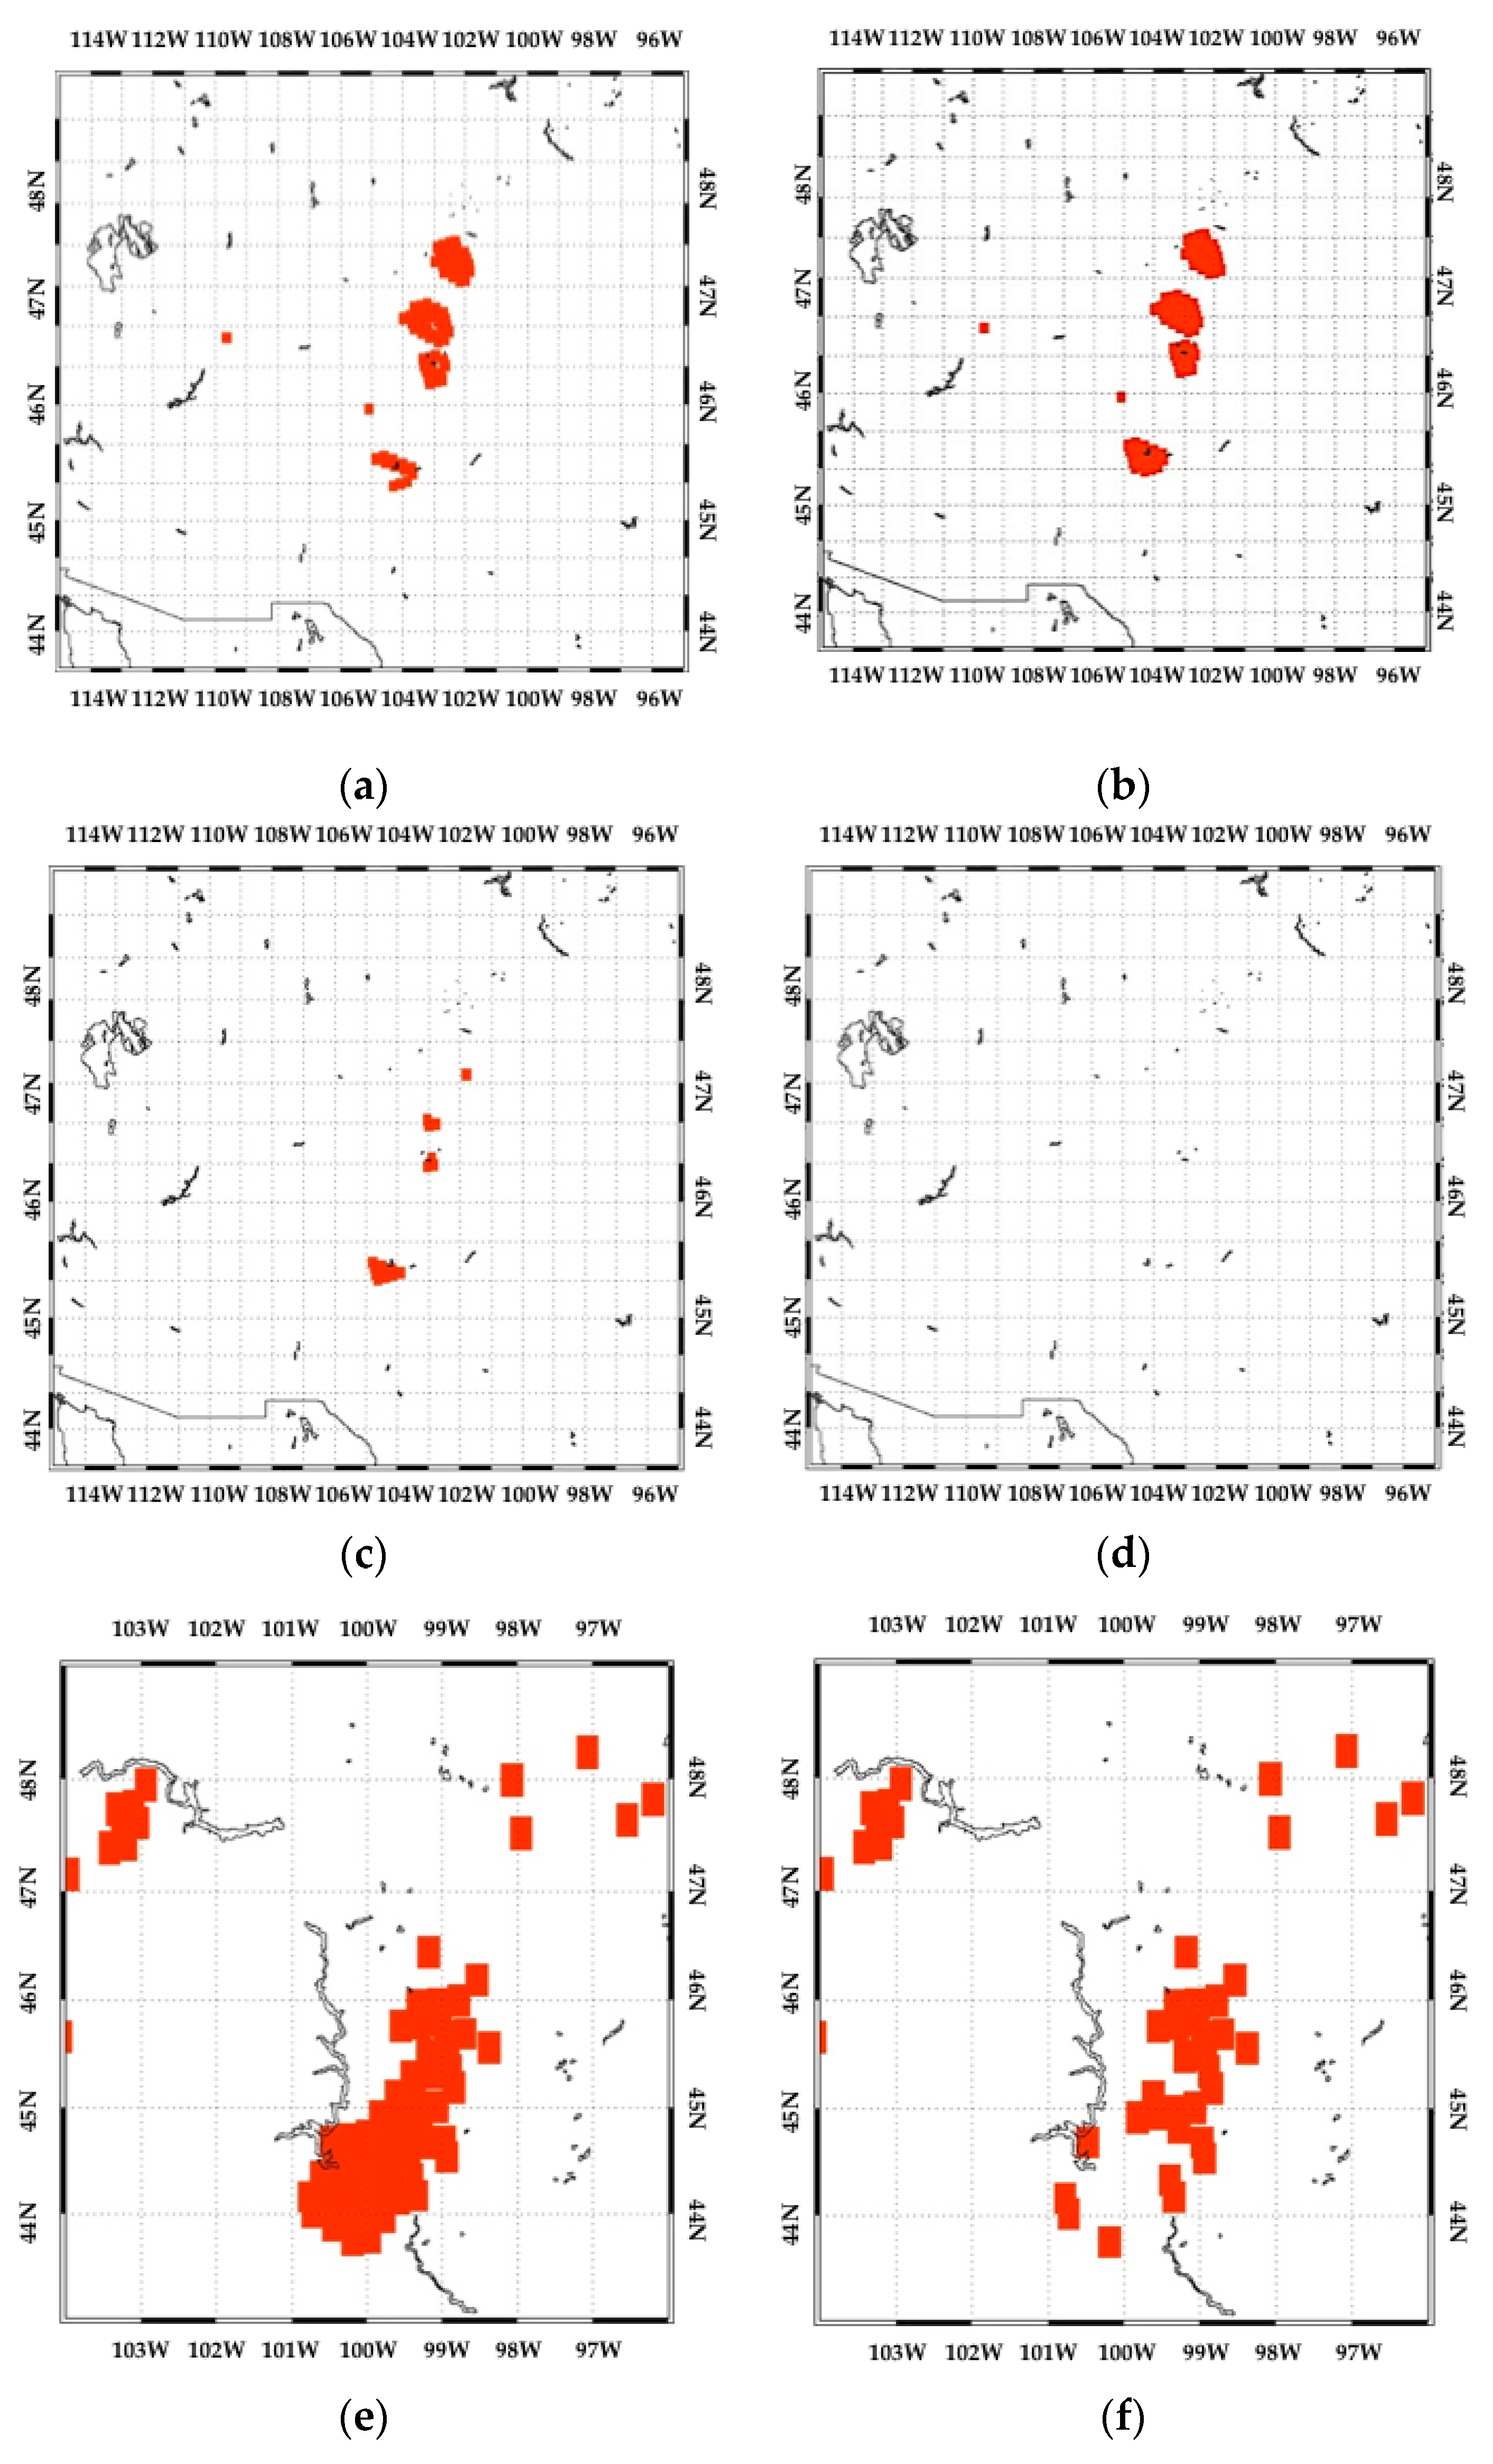
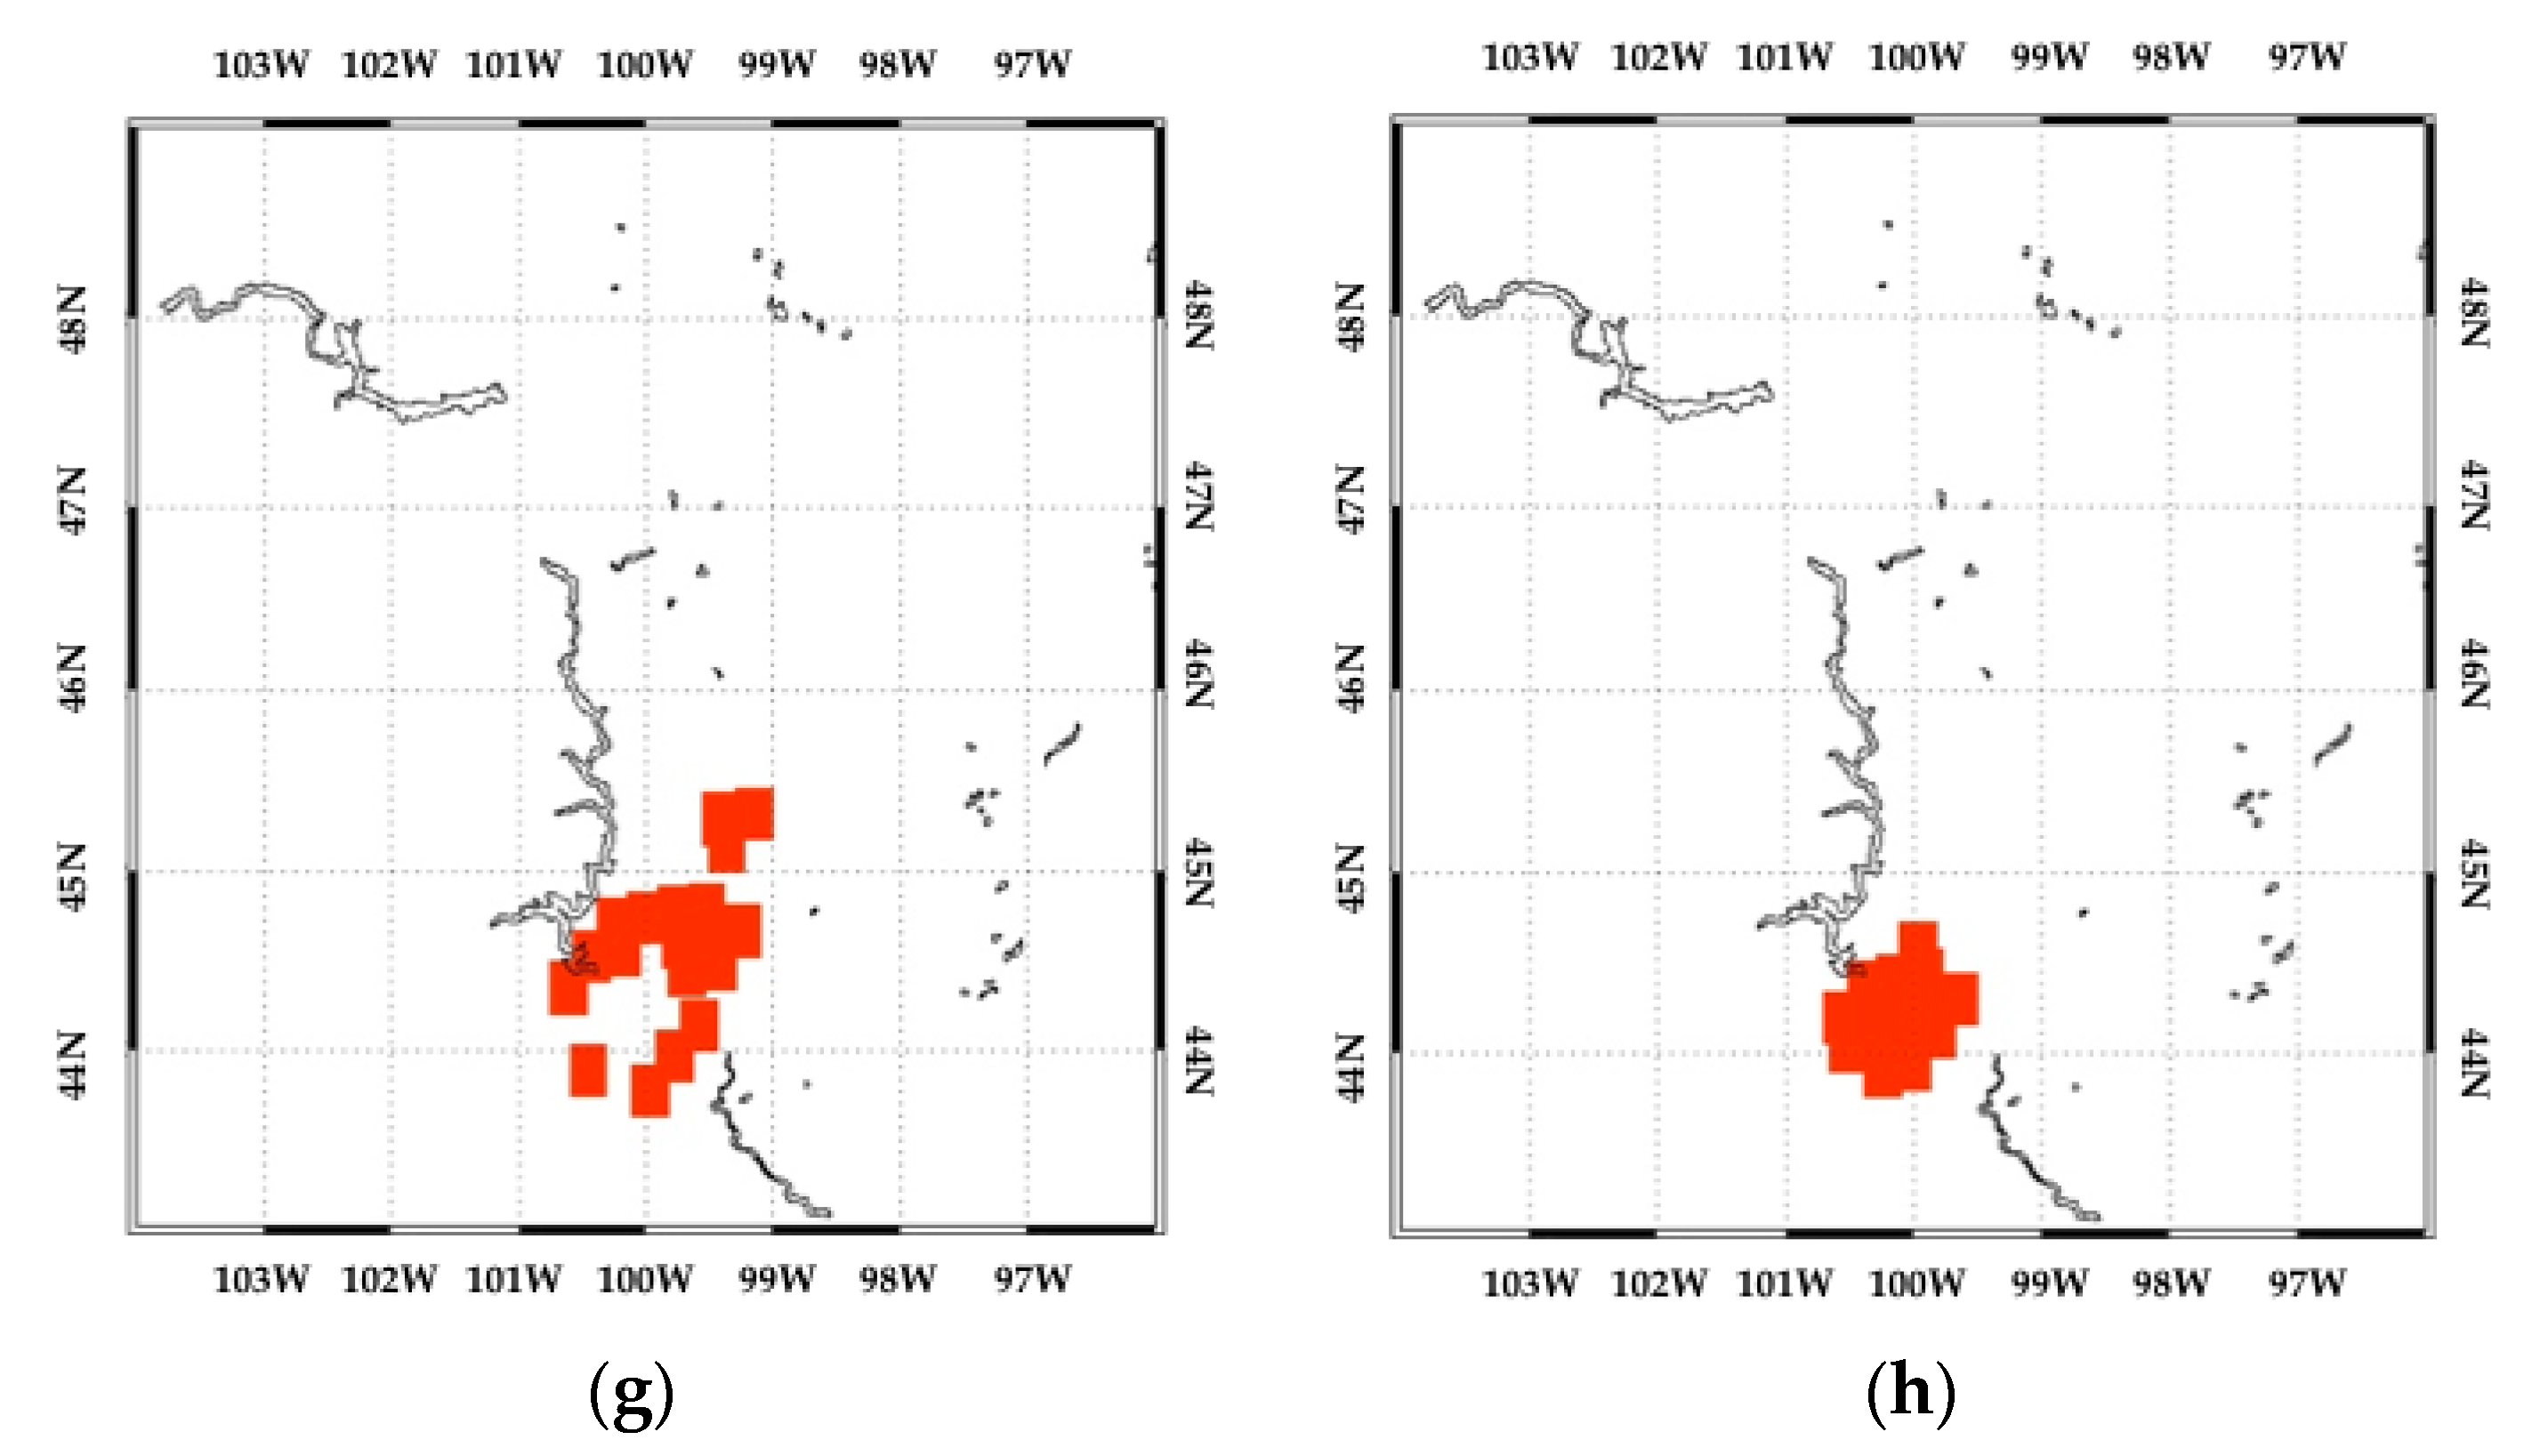
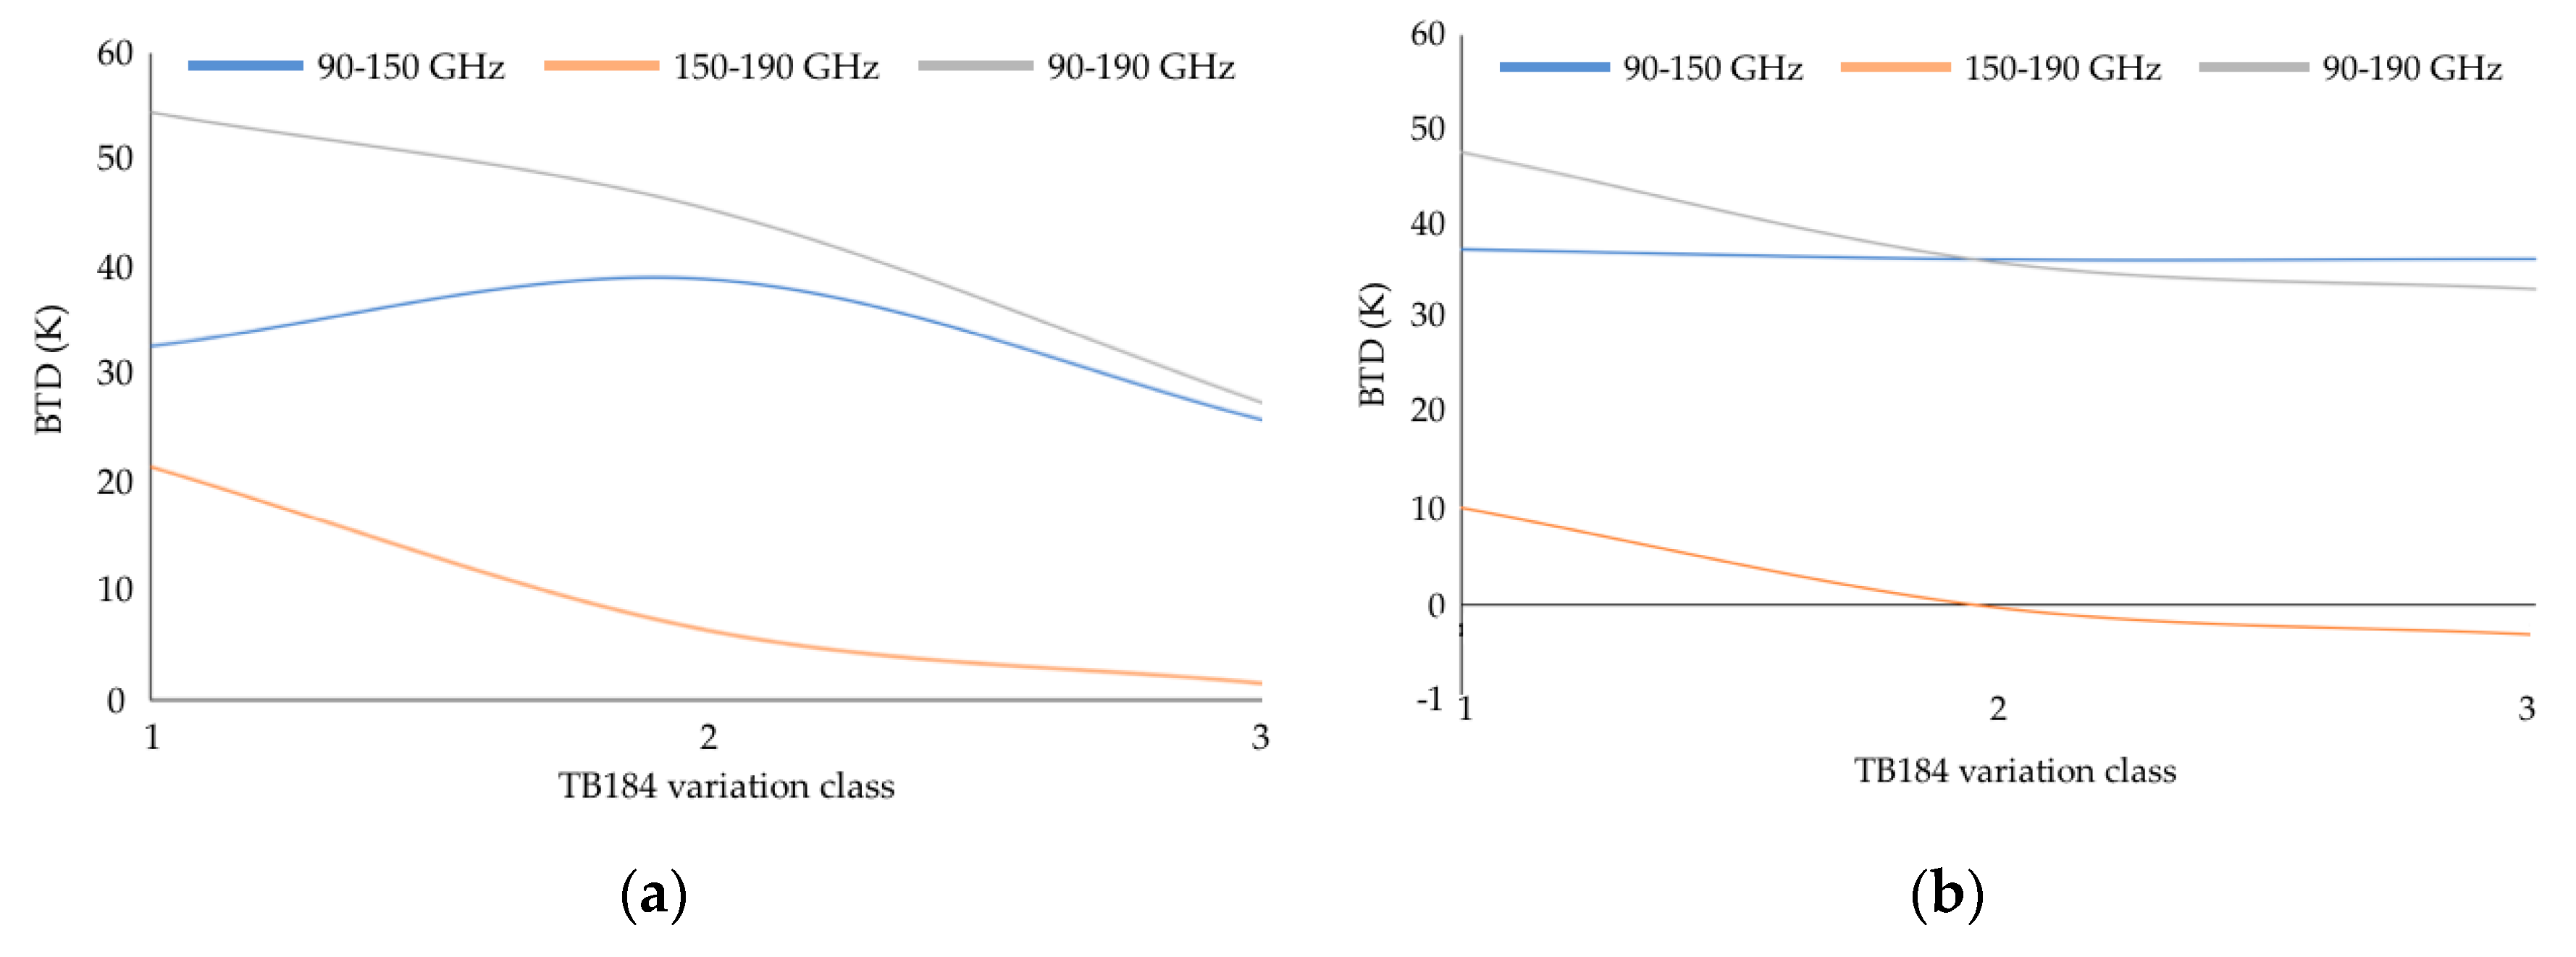


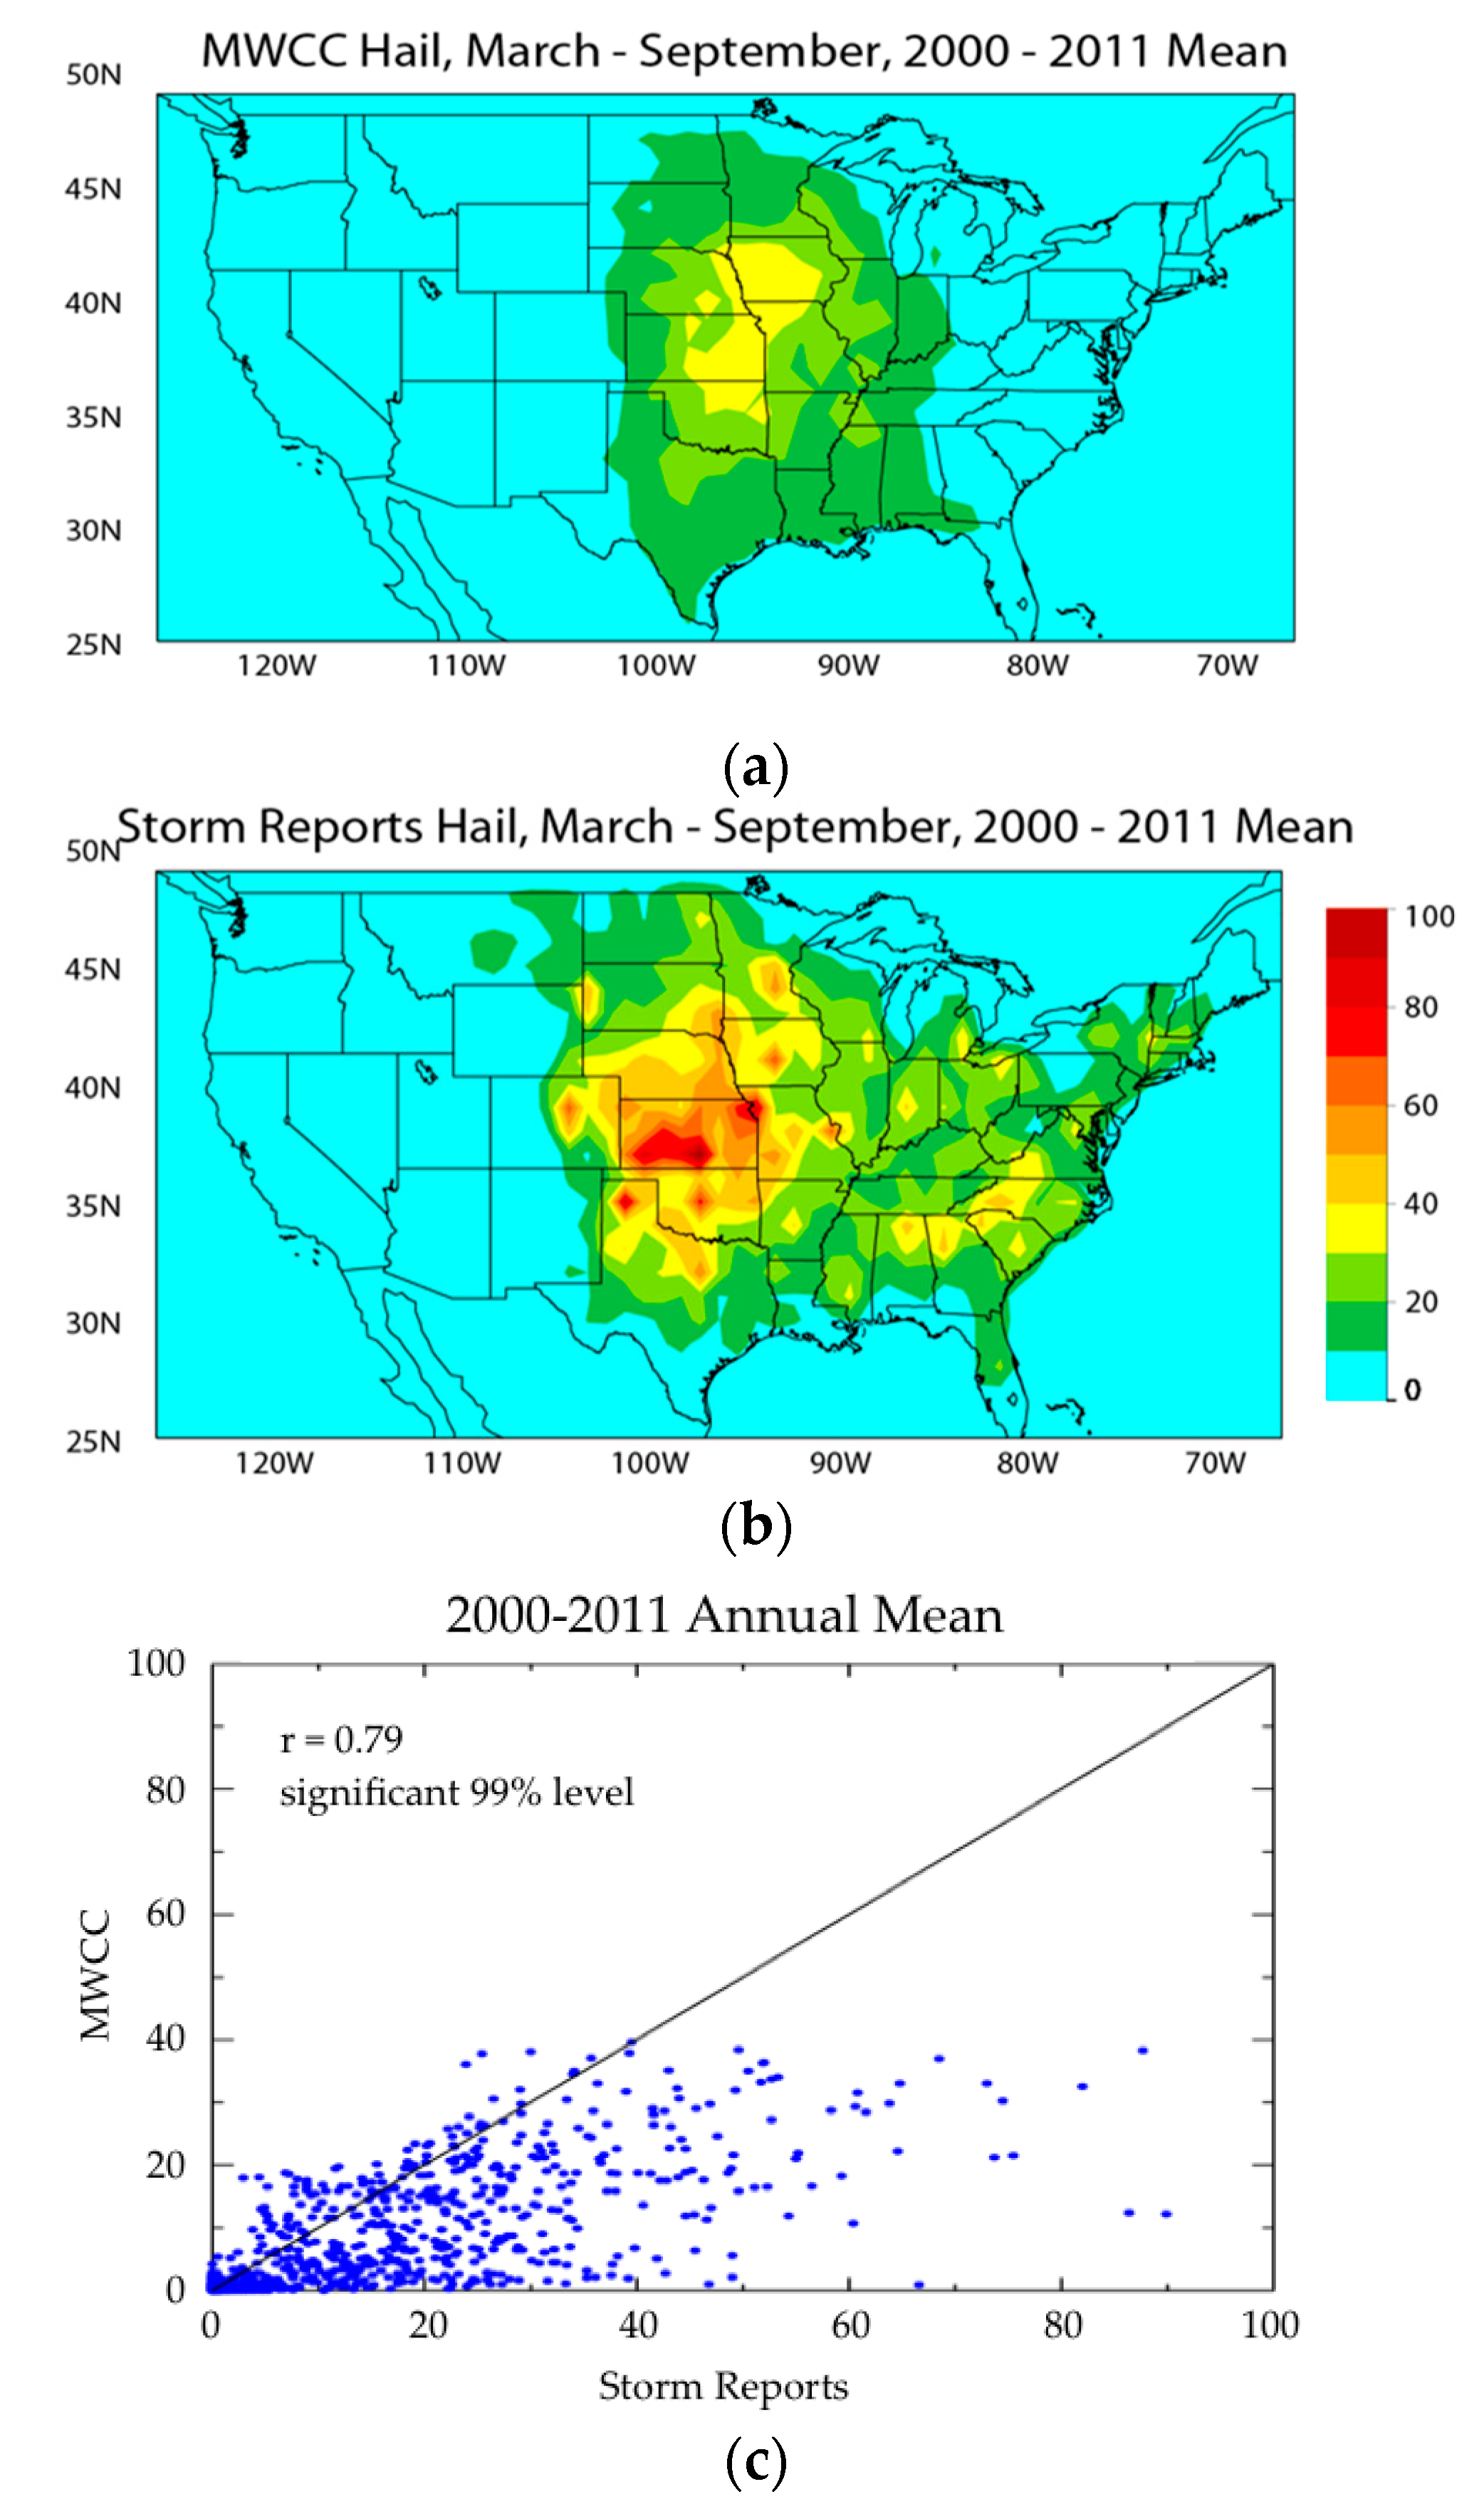
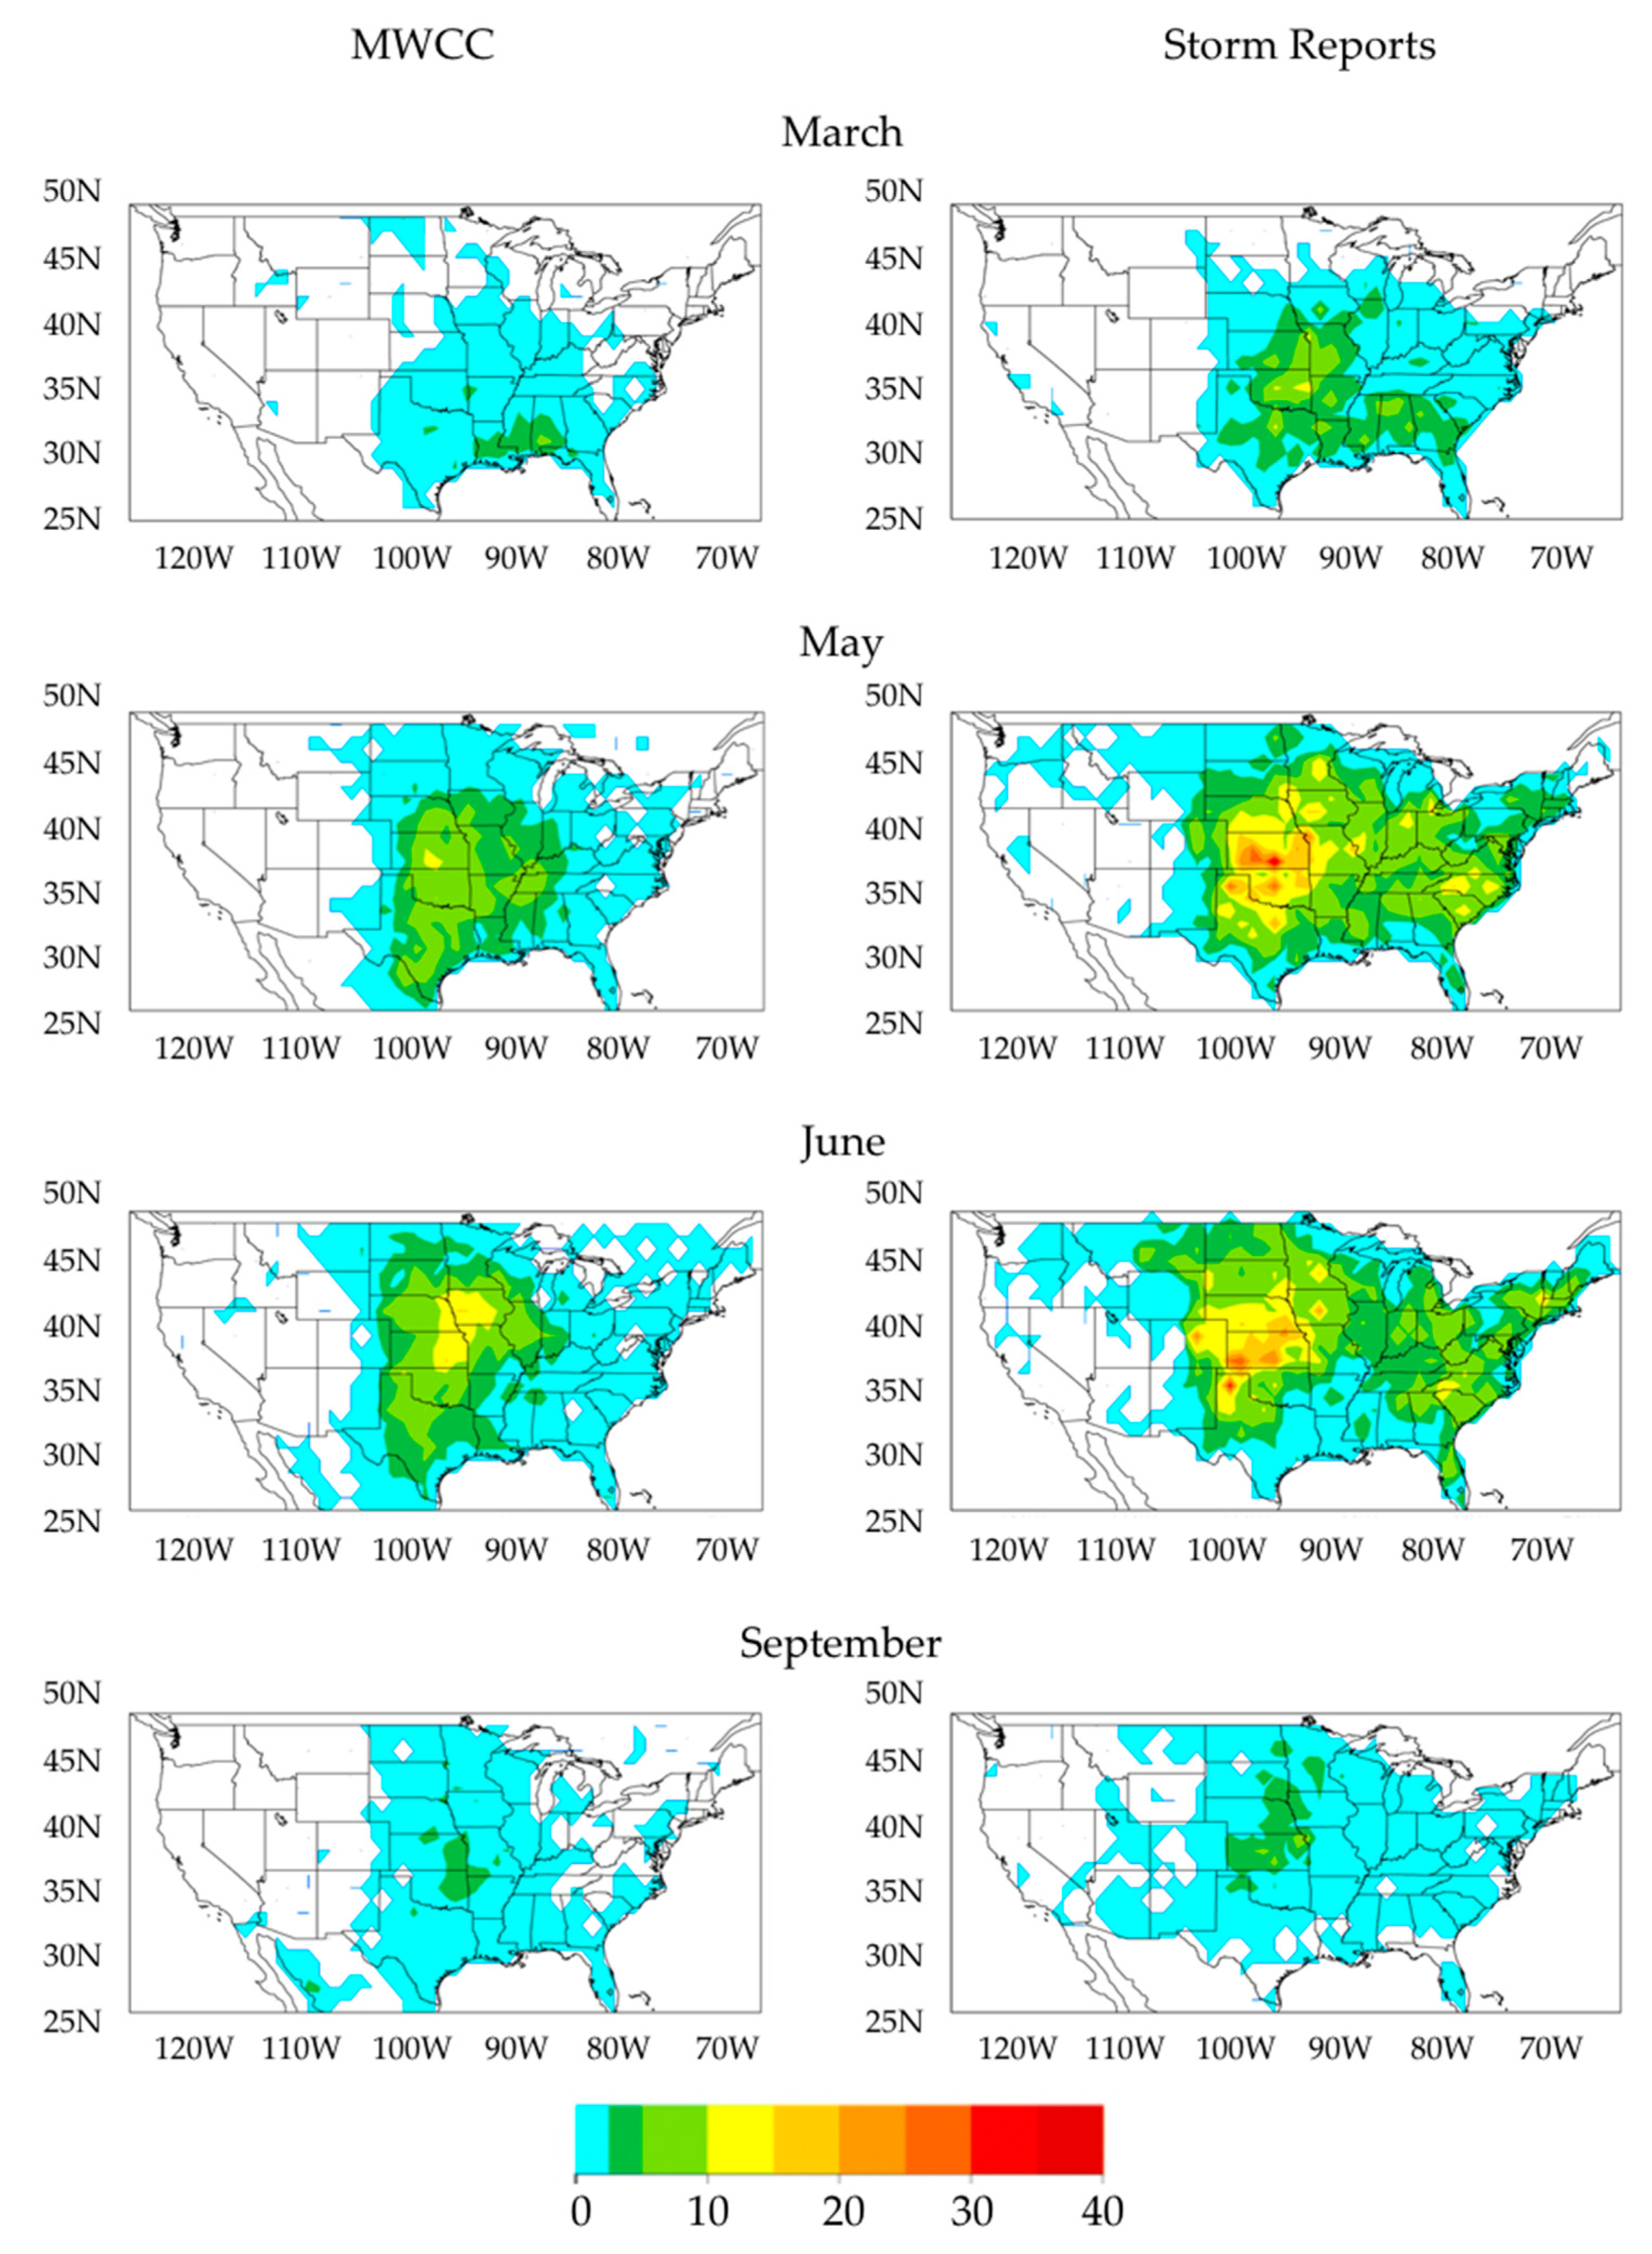
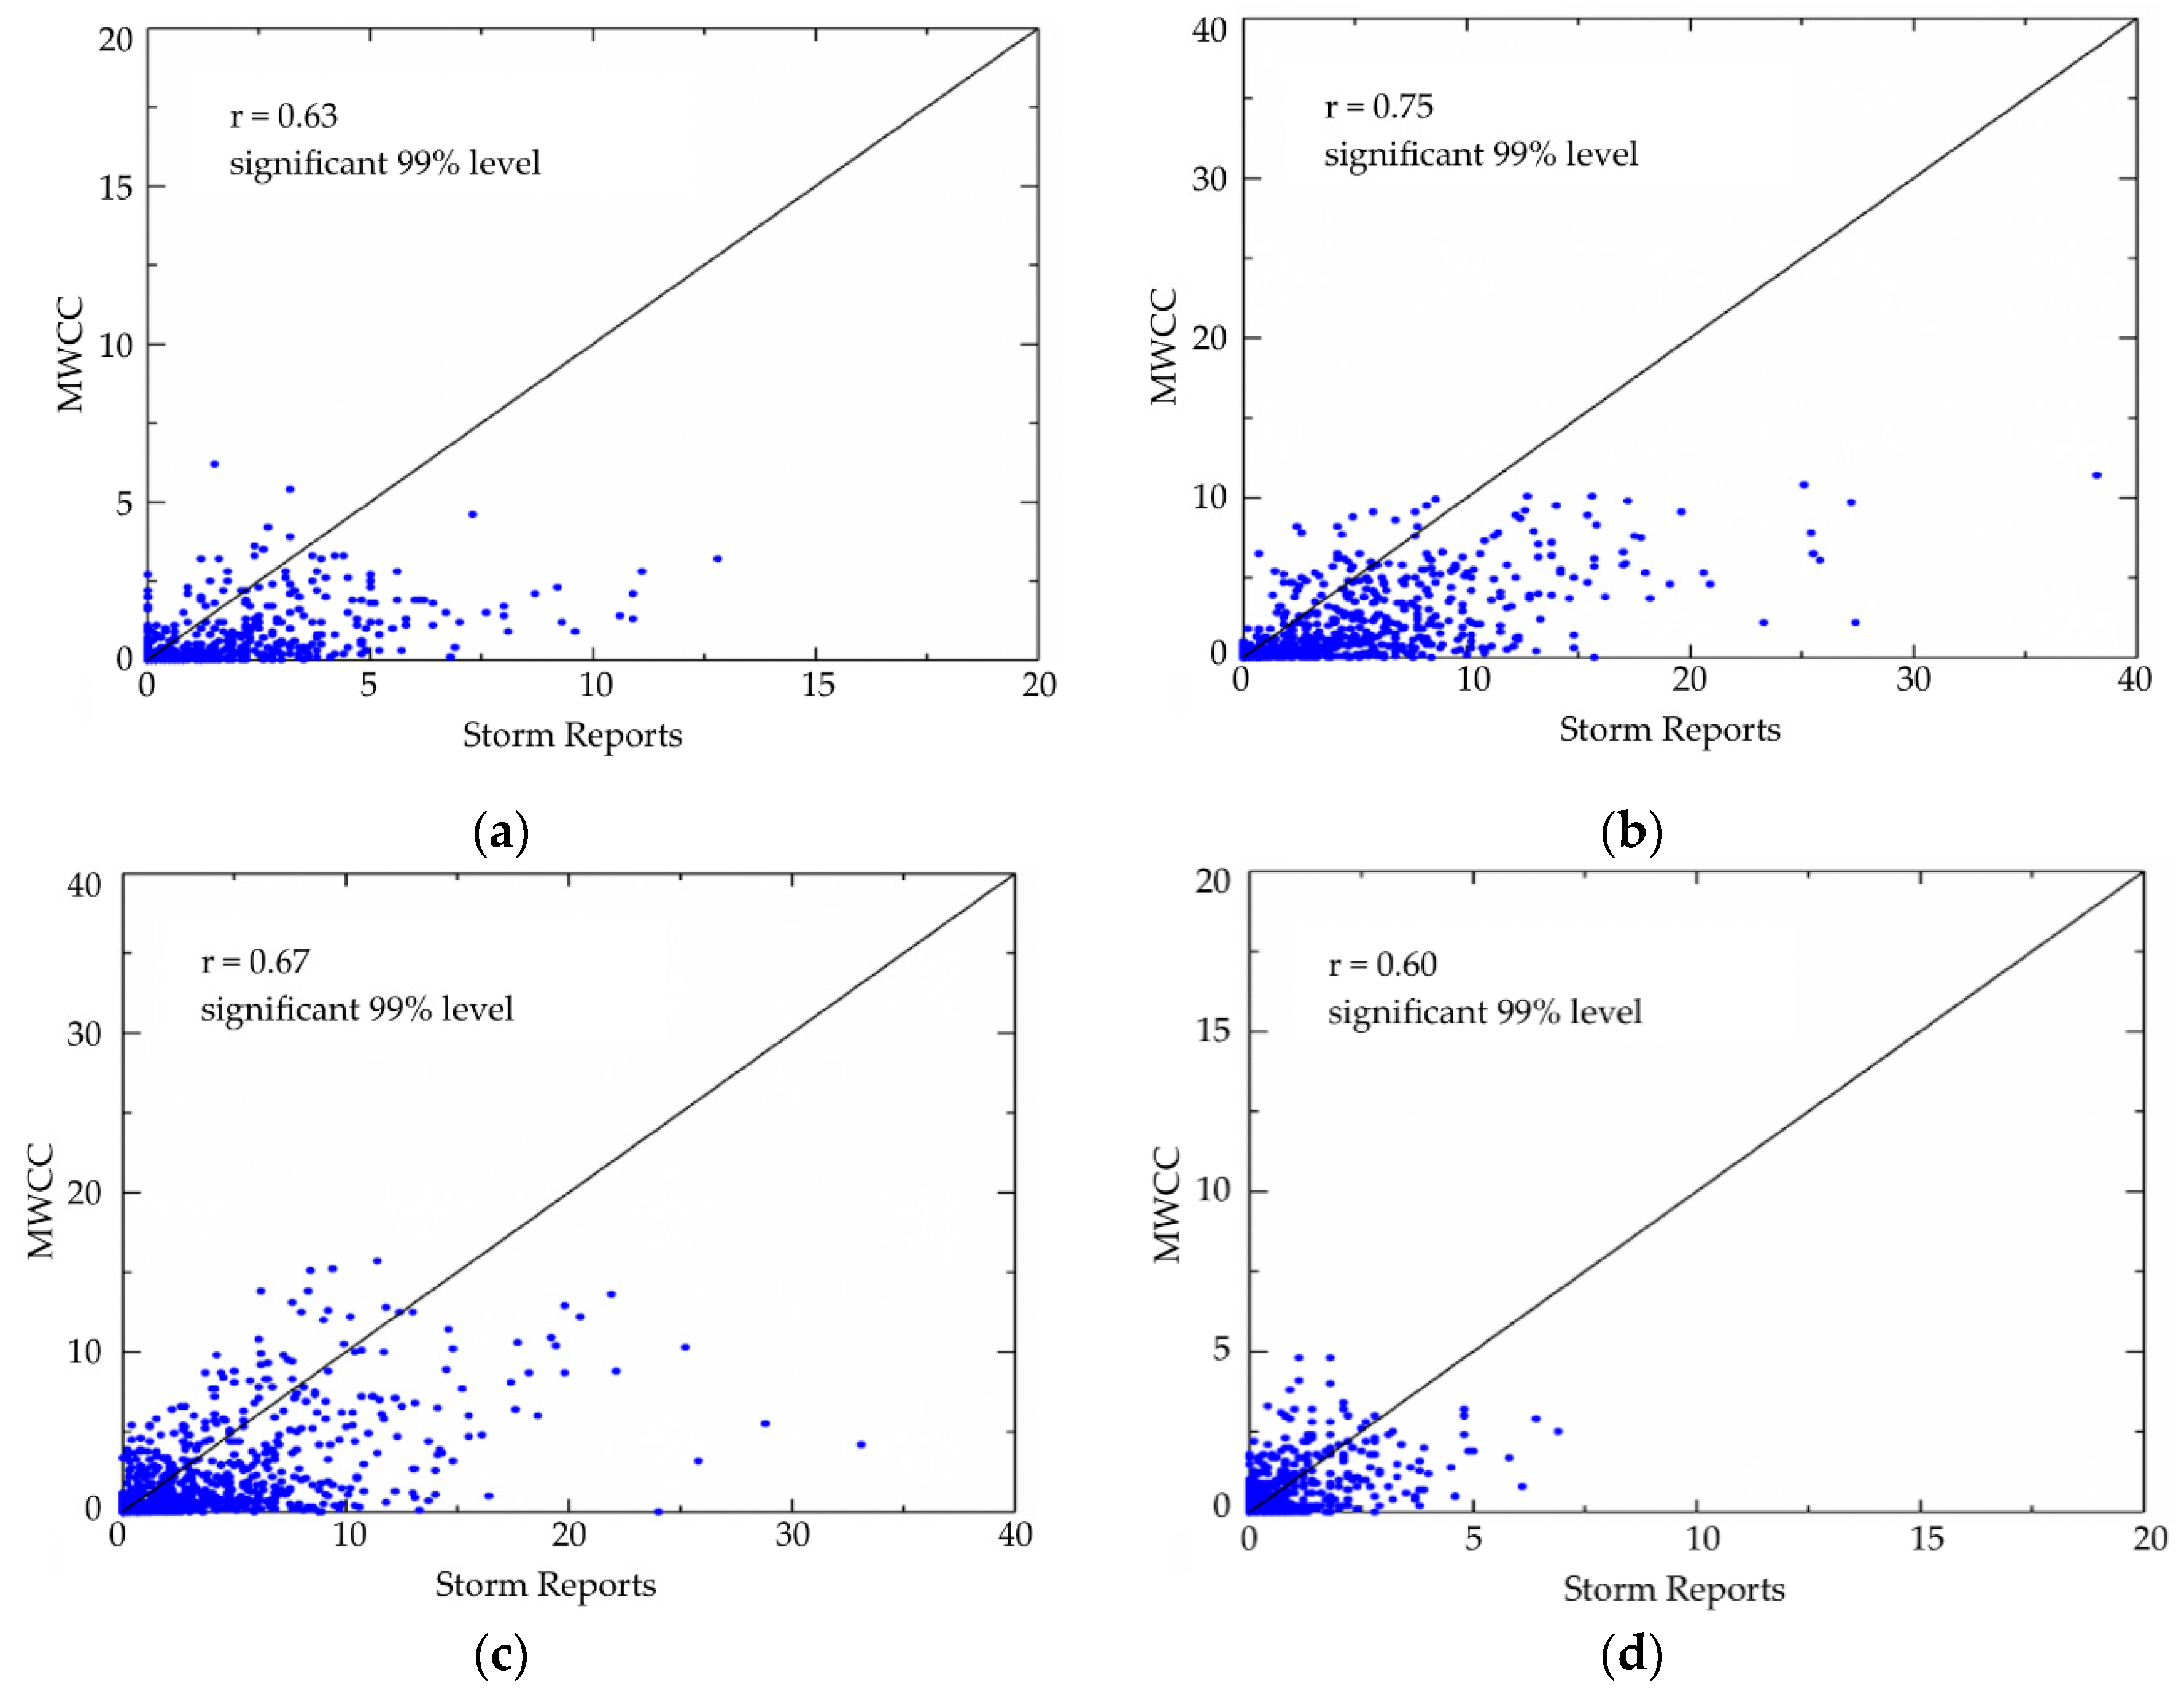
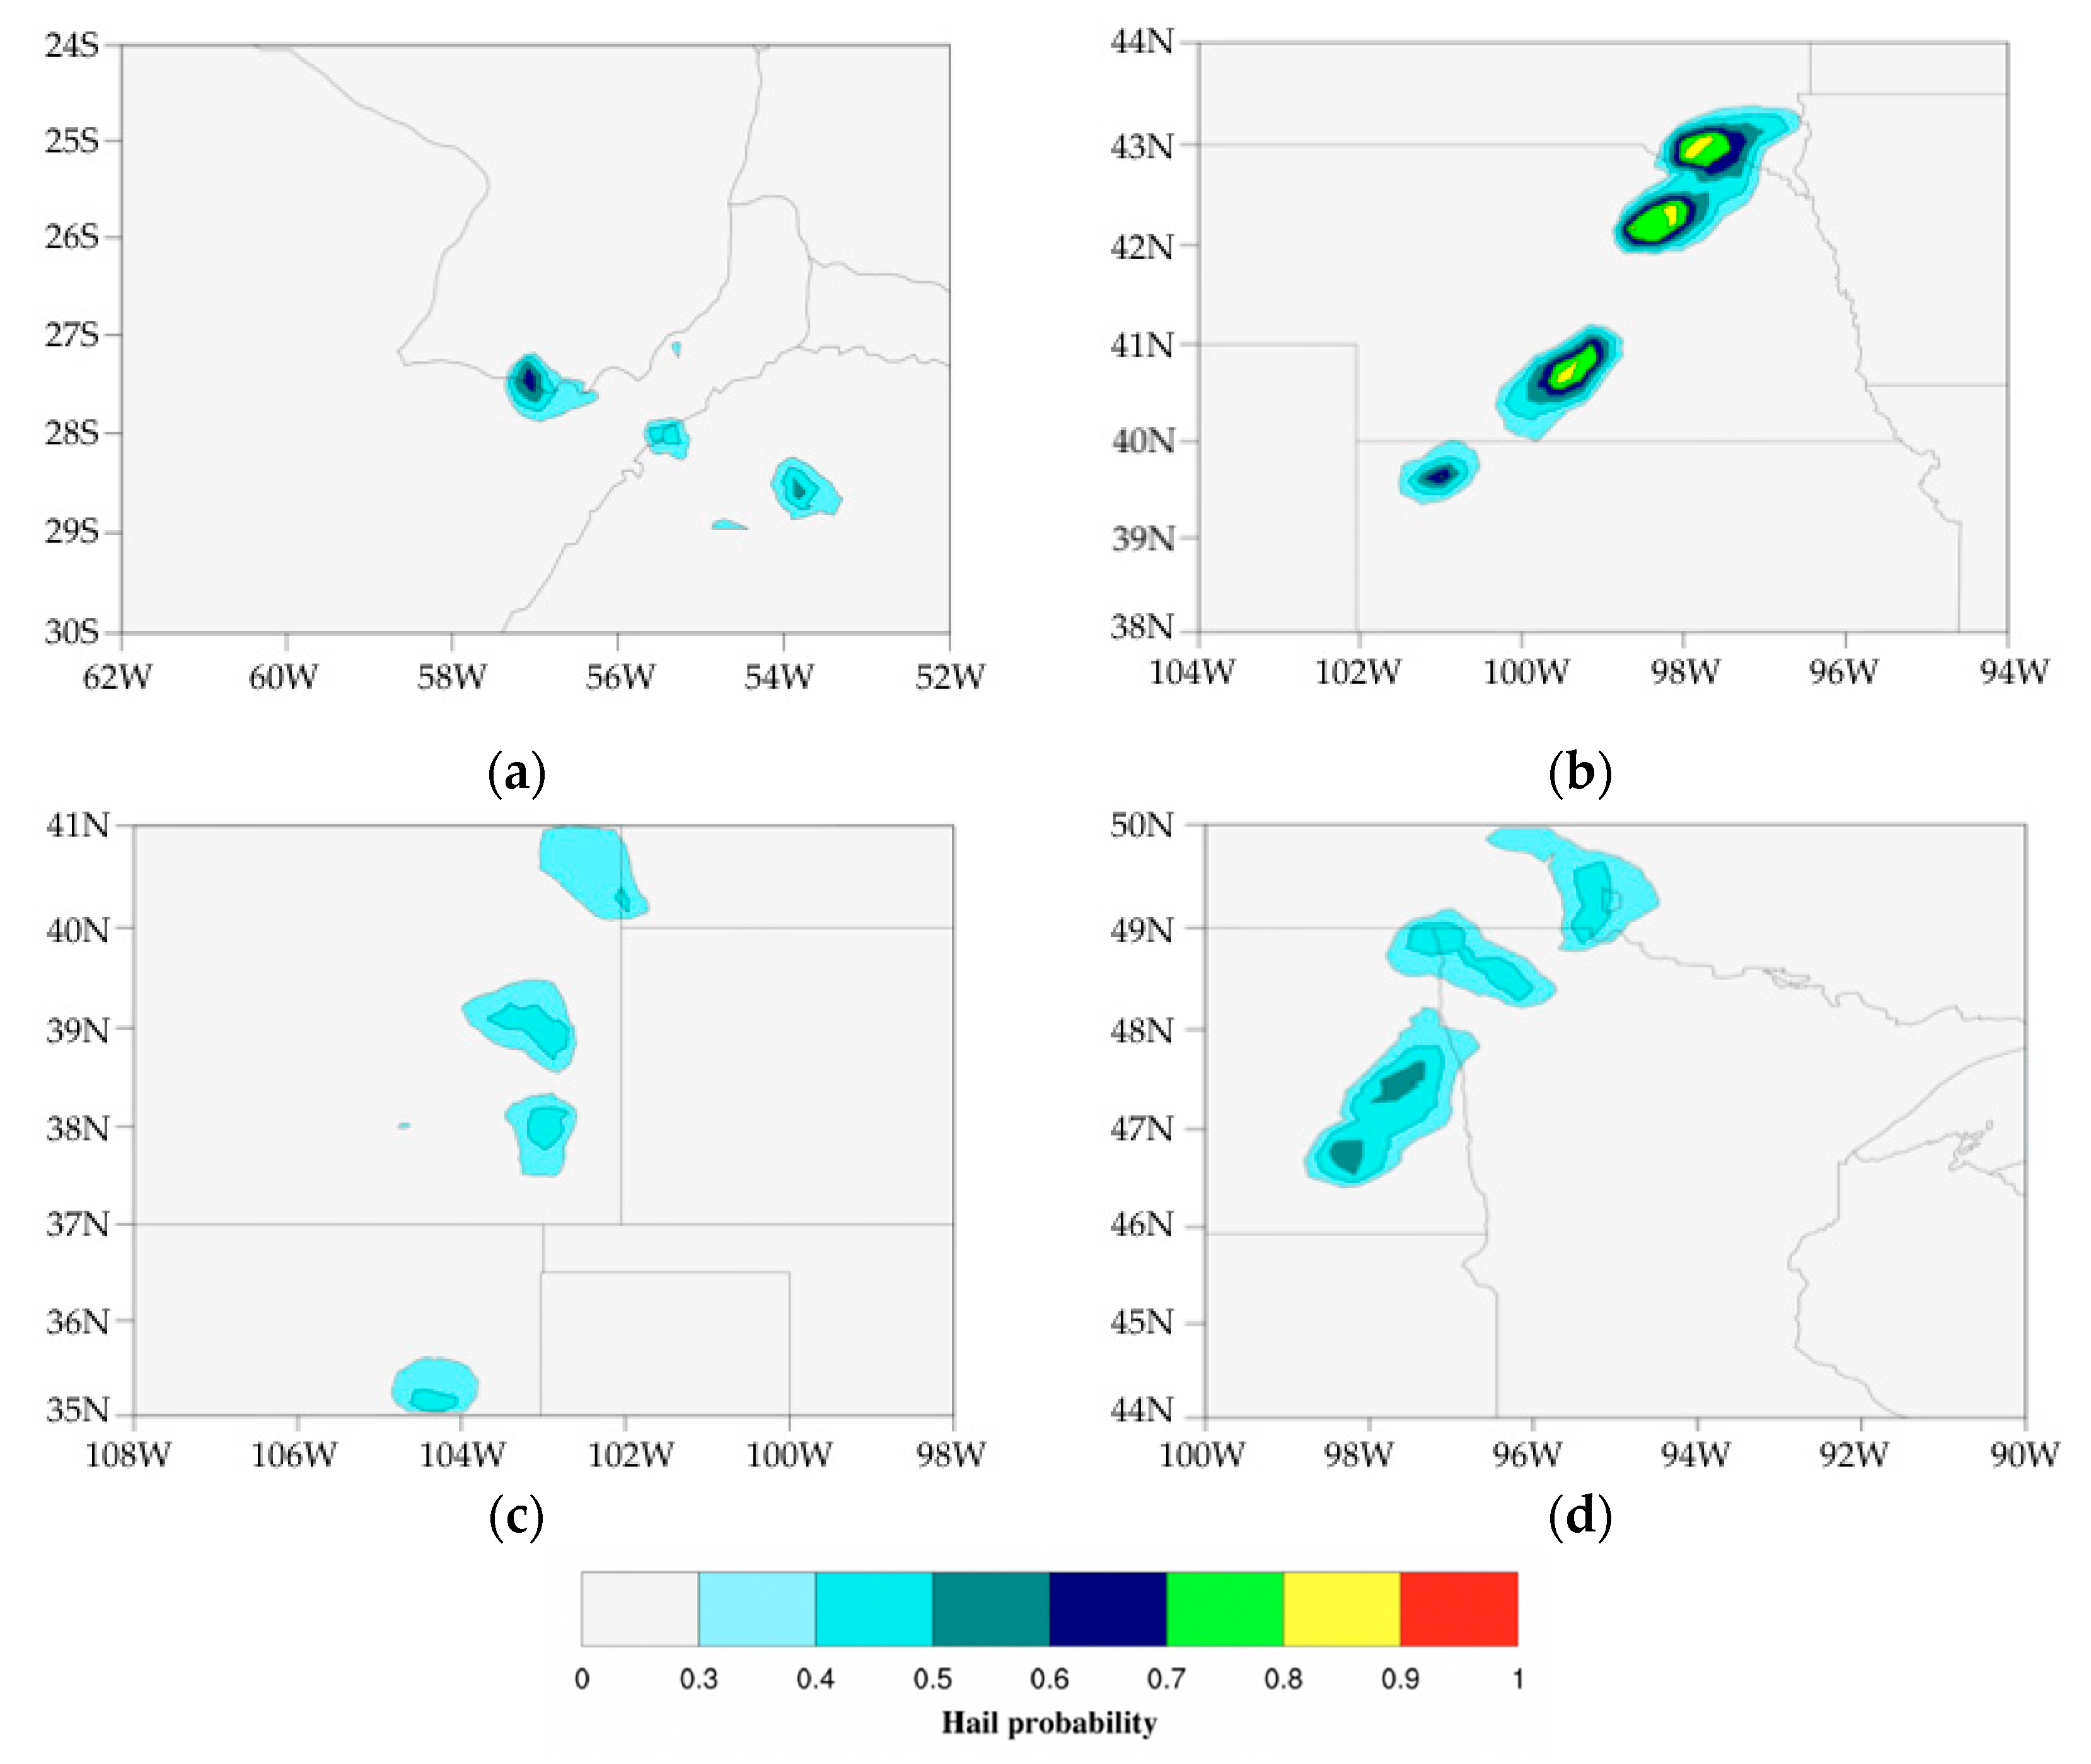
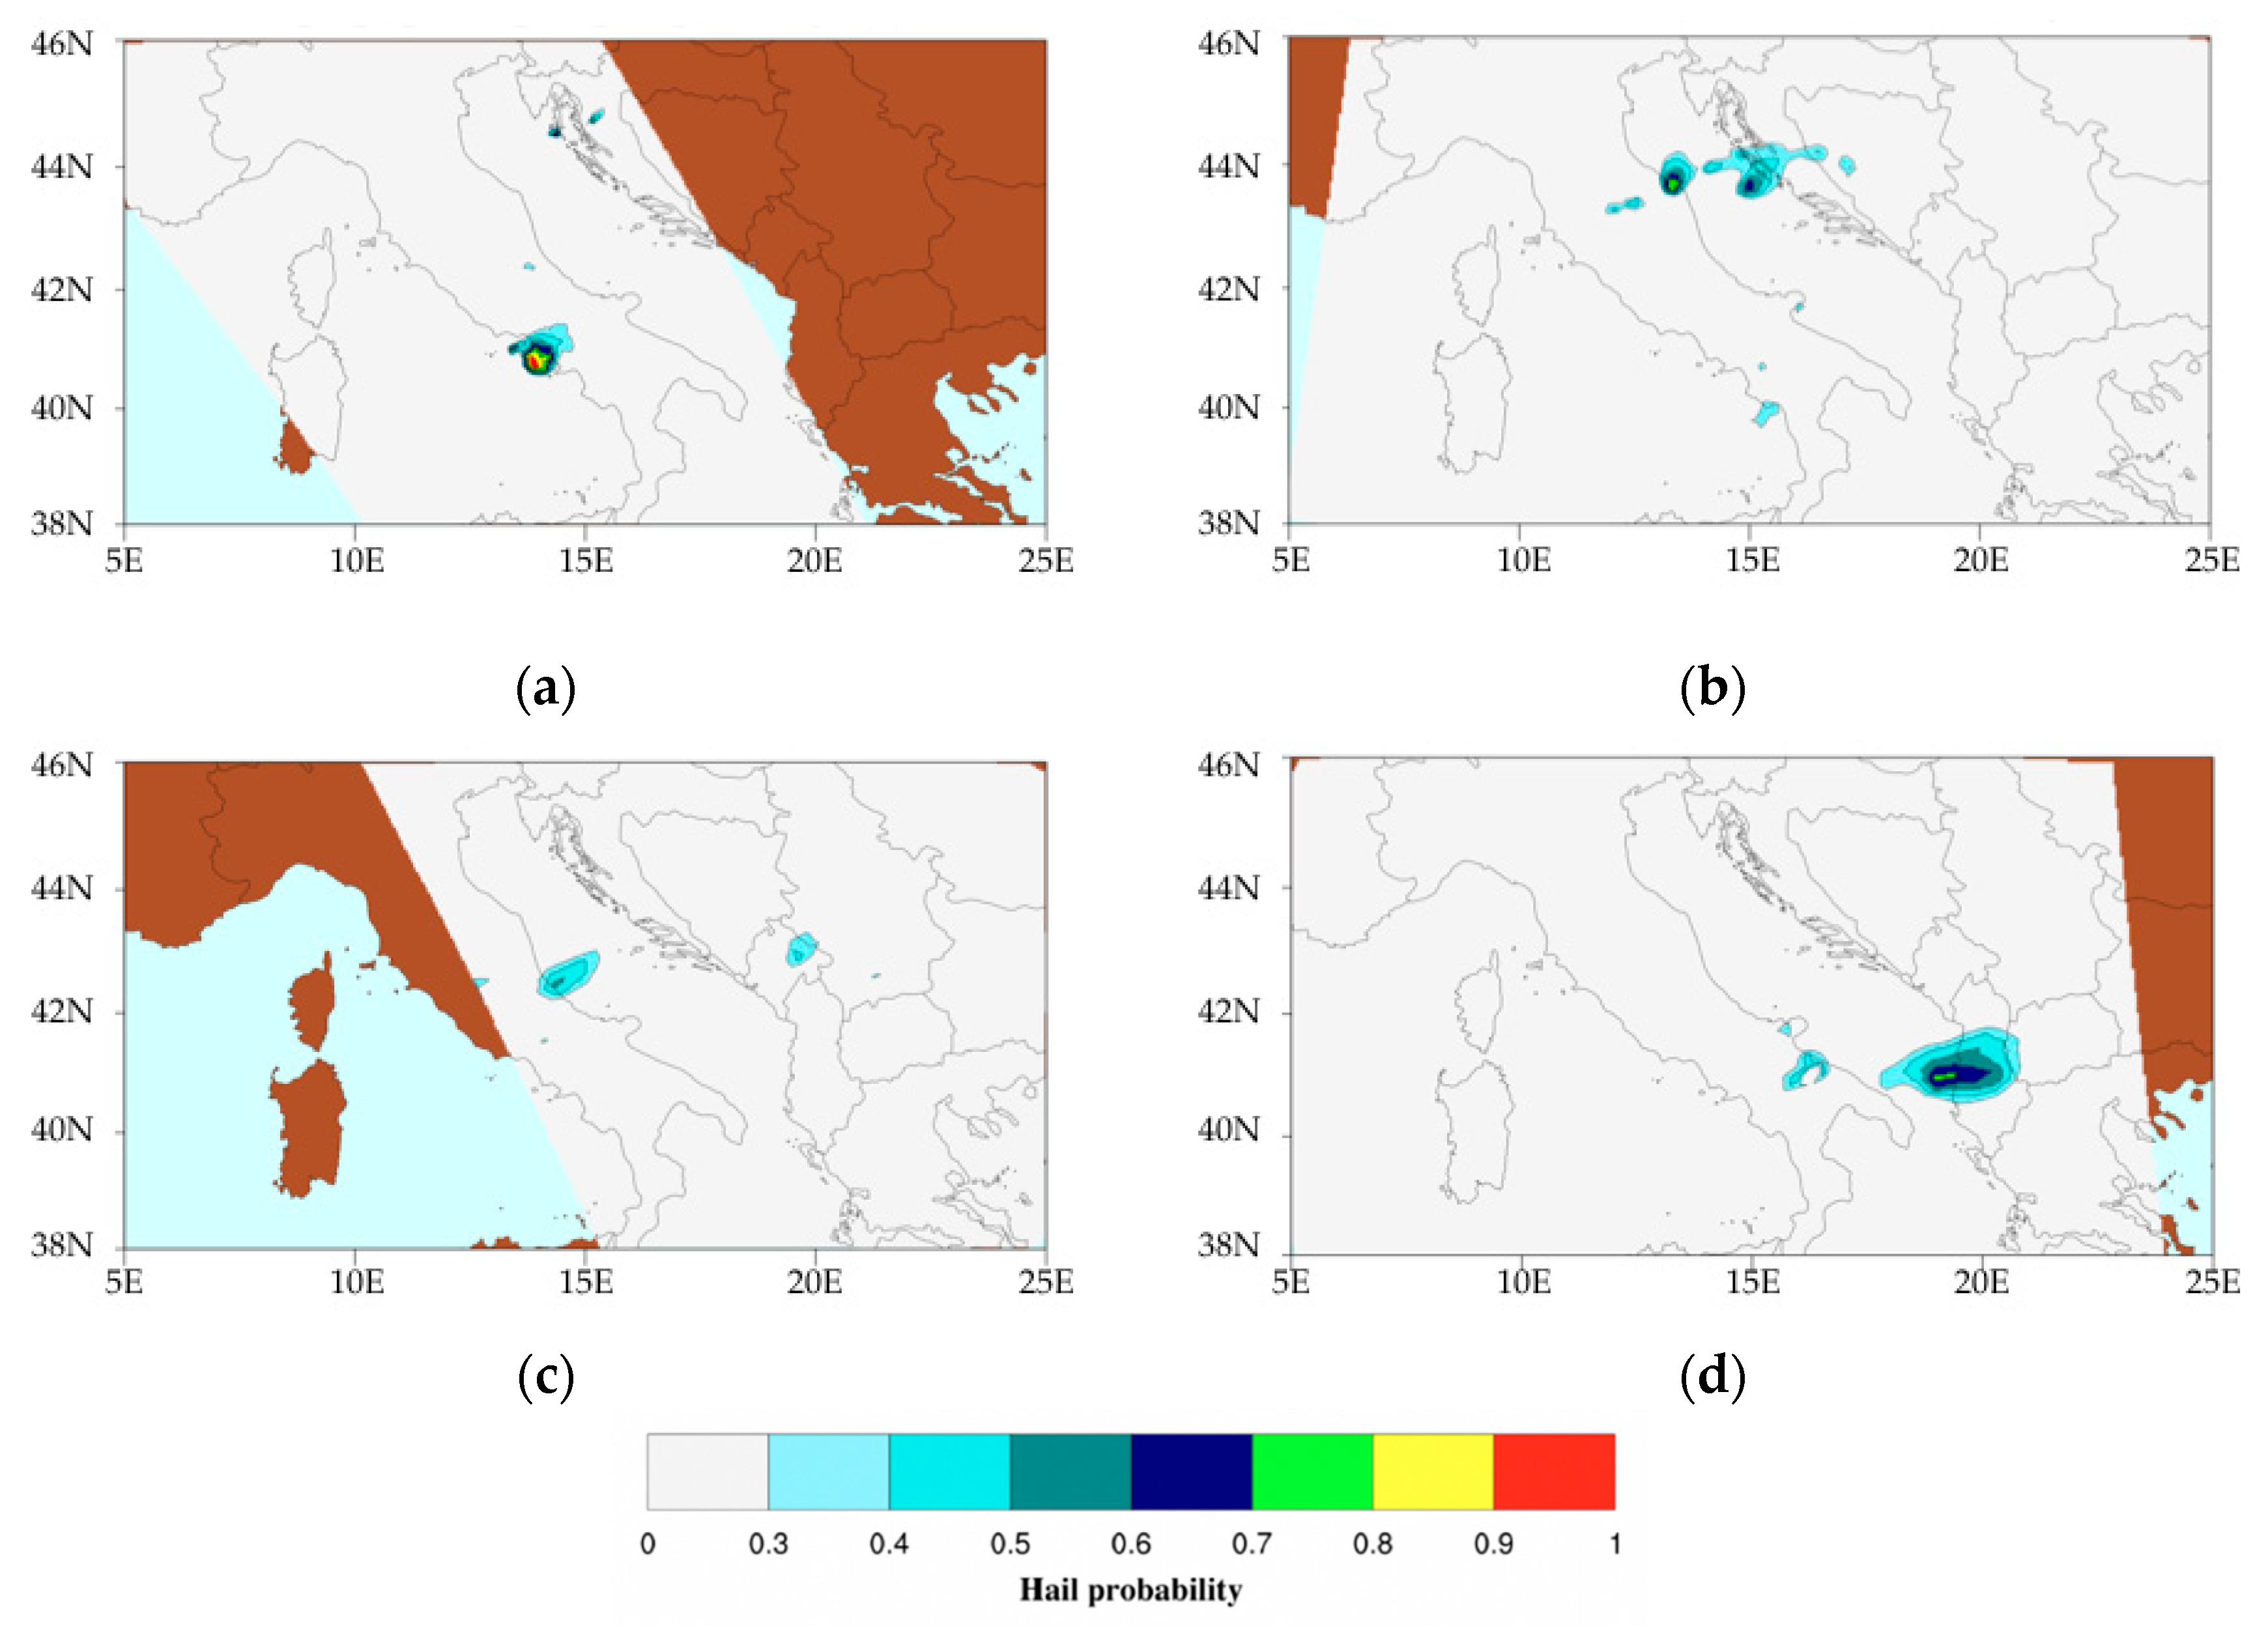
| Location | Date | Latitude (deg) | Longitude (deg) | Overpass Time (UTC) | SatID * | Hail Size (cm) |
|---|---|---|---|---|---|---|
| U.S. (Colorado, N. Mexico) | 9 May 2017 | 30.00–45.00 N | 115.00–95.00 W | 0337 | MOA | 3.5 |
| U.S. (Minnesota, N. Dakota) | 10 Jun 2017 | 40.00–50.00 N | 110.00–83.00 W | 0110/ 0237/ 0331 | N18/ MOA/ MOB | 3.5 |
| Bulgaria (Sofia) | 8 Jul 2014 | 42.00–43.00 N | 22.00–23.50 E | 1337 | N18 | 7.0 |
| Bulgaria (Montana District) | 8 Jul 2014 | 43.00–44.00 N | 23.00–24.00 E | 1928 | MOA | 4.0 |
| Germany (Reutlingen) | 28 Jul 2013 | 48.00–50.00 N | 08.00–11.00 E | 1427 | N18 | 5.0 |
| U.S. (S. Dakota, Vivian) | 23 Jul 2010 | 43.00–49.00 N | 104.00.96.00 W | 2254 | N15 | 11 |
| Argentina (Viale Entre Rios) | 7 Sep 2009 | 35.00–30.00 S | 63.00–55.00 W | 0753/ 1239 | N15/ N17 | 12 |
| Bosnia-Herzegovina (Gorazde) | 19 Jun 2007 | 43.67–43.71 N | 18.94–18.98 E | 1927/ 2018 | MOA/ N17 | 8.0 |
| U.S. (S. Dakota, Charles) | 21 Aug 2007 | 39.00–43.00 N | 104.00–95.00 W | 227/ 2341 | N16/ N15 | 14 |
| Argentina (Colonia Liebig’s) | 13 Nov 2007 | 29.00–26.00 S | 60.00–53.00 W | 2045/ 2136 | N16/ N15 | 11 |
| TB90 (K) | TB150 (K) | TB184 (K) | TB186 (K) | TB190 (K) | Hail Diameter (cm) |
|---|---|---|---|---|---|
| 199,92 (20.92) | 174,57 (17.04) | 202,94 (12.81) | 186,31 (15.35) | 175,61 (15.51) | 2 < d < 10 |
| 130,10 (12.32) | 121,37 (9.47) | 148,94 (17.06) | 134,22 (14.65) | 124,38 (11.40) | d > 10 |
| TB90 (K) | TB150 (K) | TB184 (K) | TB186 (K) | TB190 (K) | (%) (2 < d < 10) | No. of Data |
| 241.79 | 204.37 | 209.07 | 199.57 | 194.15 | 15–25 | 94 |
| 218.65 | 182.31 | 212.54 | 196.51 | 182.63 | 25–35 | 295 |
| 197.00 | 160.60 | 201.18 | 180.17 | 163.76 | >35 | 54 |
| TB90 (K) | TB150 (K) | TB184 (K) | TB186 (K) | TB190 (K) | (%) (d > 10) | No. of Data |
| 250.34 | 217.48 | 206.64 | 205.36 | 195.85 | 15–25 | 416 |
| 220.66 | 181.58 | 200.28 | 189.55 | 175.11 | 25–35 | 233 |
| 174.90 | 148.91 | 175.24 | 161.43 | 147.37 | > 35 | 91 |
| TB90 (K) | TB150 (K) | TB184 (K) | TB186 (K) | TB190 (K) | No. of Data | |
|---|---|---|---|---|---|---|
| 240.32 | 215.10 | 214.39 | 209.40 | 204.66 | 15–25 | 1814 |
| 209.88 | 180.01 | 203.00 | 188.08 | 176.53 | 25–35 | 1306 |
| 169.81 | 148.01 | 178.89 | 159.51 | 148.78 | > 35 | 903 |
| Training Datasets | ||
|---|---|---|
| 1st dataset | 528 | 145 |
| 2nd dataset | 1306 | 903 |
| TB90 (K) | TB150 (K) | TB184 (K) | TB186 (K) | TB190 (K) | No. Data | |
|---|---|---|---|---|---|---|
| 216.40 | 181.30 | 205.27 | 191.38 | 178.09 | 25–35 | 1 |
| 180.90 | 152.51 | 185.10 | 167.04 | 153.30 | > 35 | 2 |
| 114.30 | 103.70 | 122.20 | 112.00 | 107.50 | Abs. min | 3 |
© 2020 by the authors. Licensee MDPI, Basel, Switzerland. This article is an open access article distributed under the terms and conditions of the Creative Commons Attribution (CC BY) license (http://creativecommons.org/licenses/by/4.0/).
Share and Cite
Laviola, S.; Levizzani, V.; Ferraro, R.R.; Beauchamp, J. Hailstorm Detection by Satellite Microwave Radiometers. Remote Sens. 2020, 12, 621. https://doi.org/10.3390/rs12040621
Laviola S, Levizzani V, Ferraro RR, Beauchamp J. Hailstorm Detection by Satellite Microwave Radiometers. Remote Sensing. 2020; 12(4):621. https://doi.org/10.3390/rs12040621
Chicago/Turabian StyleLaviola, Sante, Vincenzo Levizzani, Ralph R. Ferraro, and James Beauchamp. 2020. "Hailstorm Detection by Satellite Microwave Radiometers" Remote Sensing 12, no. 4: 621. https://doi.org/10.3390/rs12040621
APA StyleLaviola, S., Levizzani, V., Ferraro, R. R., & Beauchamp, J. (2020). Hailstorm Detection by Satellite Microwave Radiometers. Remote Sensing, 12(4), 621. https://doi.org/10.3390/rs12040621


