Letter

Monitoring Droughts in the Greater Changbai Mountains Using Multiple Remote Sensing-Based Drought Indices

1
Key Laboratory of Geographical Processes and Ecological Security in Changbai Mountains, Ministry of Education, School of Geographical Sciences, Northeast Normal University, Changchun 130024, China
2
Institute of Earth Surface System and Hazards, Northwest University, Xi’an 710127, China
3
Department of Geological and Atmospheric Sciences, Iowa State University, Ames, IA 50011-1051, USA
*
Author to whom correspondence should be addressed.
These authors contributed equally to this work.
Remote Sens. 2020, 12(3), 530; https://doi.org/10.3390/rs12030530
Submission received: 26 December 2019 / Revised: 27 January 2020 / Accepted: 3 February 2020 / Published: 6 February 2020
(This article belongs to the Special Issue Remote Sensing Applications in Monitoring of Protected Areas)

Abstract

:
Various drought indices have been developed to monitor drought conditions. Each index has typical characteristics that make it applicable to a specific environment. In this study, six popular drought indices, namely, precipitation condition index (PCI), temperature condition index (TCI), vegetation condition index (VCI), vegetation health index (VHI), scaled drought condition index (SDCI), and temperature–vegetation dryness index (TVDI), have been used to monitor droughts in the Greater Changbai Mountains(GCM) in recent years. The spatial pattern and temporal trend of droughts in this area in the period 2001–2018 were explored by calculating these indices from multi-source remote sensing data. Significant spatial–temporal variations were identified. The results of a slope analysis along with the F-statistic test showed that up to 20% of the study area showed a significant increasing or decreasing trend in drought. It was found that some drought indices cannot be explained by meteorological observations because of the time lag between meteorological drought and vegetation response. The drought condition and its changing pattern differ from various land cover types and indices, but the relative drought situation of different landforms is consistent among all indices. This work provides a basic reference for reasonably choosing drought indices for monitoring drought in the GCM to gain a better understanding of the ecosystem conditions and environment.

Graphical Abstract

1. Introduction

Drought is considered an environmental disaster, and many researchers, including environmentalists, ecologists, hydrologists, meteorologists, geologists, and agricultural scientists have investigated droughts [1]. Drought causes soil degradation, desertification, water deficit, plant death, sandstorm, fire disaster, and other disaster phenomena [2]. Moreover, drought also affects crop growth, influences global food prices, and contributes to political unrest [3,4,5,6]. Therefore, monitoring drought and studying its spatiotemporal dynamics are important for improving agricultural production, protecting the environment, and promoting sustainable social economic development [7].
Traditional drought-monitoring methods are based on ground- or station-based meteorological and hydrological observations, such as precipitation, air temperature, soil moisture, evapotranspiration, and surface runoff. A series of meteorological drought indices, including the Standardized Precipitation Index (SPI) and Palmer Drought Severity Index (PDSI), were developed based on these observation data. However, it is difficult to ensure the reliability of such interpolation because of the limited spatial density and uneven distribution of the observation stations [7,8]. Therefore, there is increased focus on remote sensing for drought monitoring because of its comprehensive, fast, and dynamic features that can rapidly and accurately yield multiscale and multitemporal information [9,10,11,12,13].
Many remote sensing-based drought indices have been established to reflect drought conditions. One of the most extensively used one is the normalized difference vegetation index (NDVI). However, when conducting drought monitoring over nonhomogeneous areas, NDVI is less reliable because of the effects of geographical location, ecological systems, and soil conditions [9,10]. To overcome these problems, Kogan proposed the vegetation condition index (VCI) by normalizing NDVI values to the maximum range of a specific area [9]. The weather-related NDVI component is smaller than the one related to the ecosystem; therefore, normalization successfully minimizes the ecosystem component. The VCI has been widely applied to drought monitoring and analysis, and its reliability has been verified by many studies [14,15,16,17,18,19,20,21]. VCI can individually monitor the effect of drought on vegetation health but is insufficient because it indicates only one moisture condition [14]. Considering that temperature may also reflect drought conditions to some extent, Kogan further developed the temperature condition index (TCI) by normalizing land surface temperature (LST) values to the maximum range of a specific area as an indicator of drought [10]. The vegetation health index (VHI), which averages the sum of VCI and TCI, too was introduced by Kogan [22]. The VHI has also been frequently used for agricultural purposes, such as crop yield estimation [18,19,23]. The principle of using VHI for drought monitoring is that an assessment of temperature conditions helps identify subtle changes in vegetation health because the effect of drought is more drastic if shortage of moisture is accompanied by excessive temperatures. The feasibility of using VHI has been validated in all major agricultural countries [22]. Precipitation deficit is an important condition for drought formation; therefore, the precipitation condition index (PCI) can reflect drought conditions [24]. Since drought usually is induced by precipitation deficit and rise in temperature and poses a threat to vegetation health, the scaled drought condition index (SDCI), which combines the PCI, TCI, and VCI, was proposed [25]. The abovementioned indices can be calculated from easily available satellite remote sensing data. Other researchers proposed the temperature–vegetation dryness index (TVDI) using the spatial relationship between the LST and NDVI based on the spectral reflectance of near-infrared (NIR) and red channels to indicate drought [26] and soil moisture conditions [27]. These indices take advantage of one or more aspects of droughts to reflect drought conditions; as a result, these indices have distinct characteristics that makes them suitable for different scenarios.
Remote sensing can provide long-term series data with broad spatial coverage; hence, these data are a perfect source for Earth observation and land surface monitoring. Drought-monitoring research also benefits greatly from remote sensing techniques, which help track the long-term trend of drought condition easily. Liang et al. used the VCI to evaluate the spatiotemporal variations of drought in different regions in China based on a trend analysis of tendency rate (slope) [7]. The occurrence of drought events in Northeast China from 2001 to 2014 was also investigated using slope analysis [6]. Spatial and temporal variations of drought in Nepal were examined by trend analysis based on satellite-derived VCI [28]. The Greater Changbai Mountains (GCM) is extremely important from the ecological viewpoint for the entire Northeast Asia as well as the world owing to the well preserved and most abundant forests of different types. Therefore, understanding the drought conditions of the GCM is critical for understanding the ecosystem conditions and environment of this region.
The main objectives of this study are (1) to evaluate the six widely used drought indices (PCI, VCI, TCI, VHI, SDCI, and TVDI) for drought monitoring in the GCM, considering that they reflect three different aspects of drought, namely precipitation, temperature, and vegetation conditions, and also that their data are easily available; (2) to explore the spatiotemporal patterns and the changing trend of drought in the GCM during the period 2001–2018; and (3) to analyze the correlations of the drought indices with meteorological factors and land cover types.

2. Study Area and Data
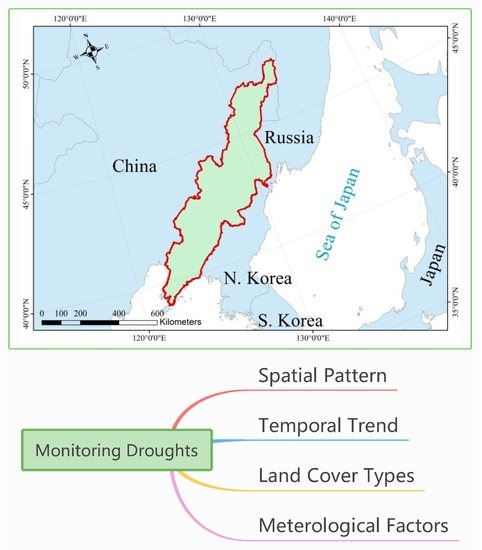
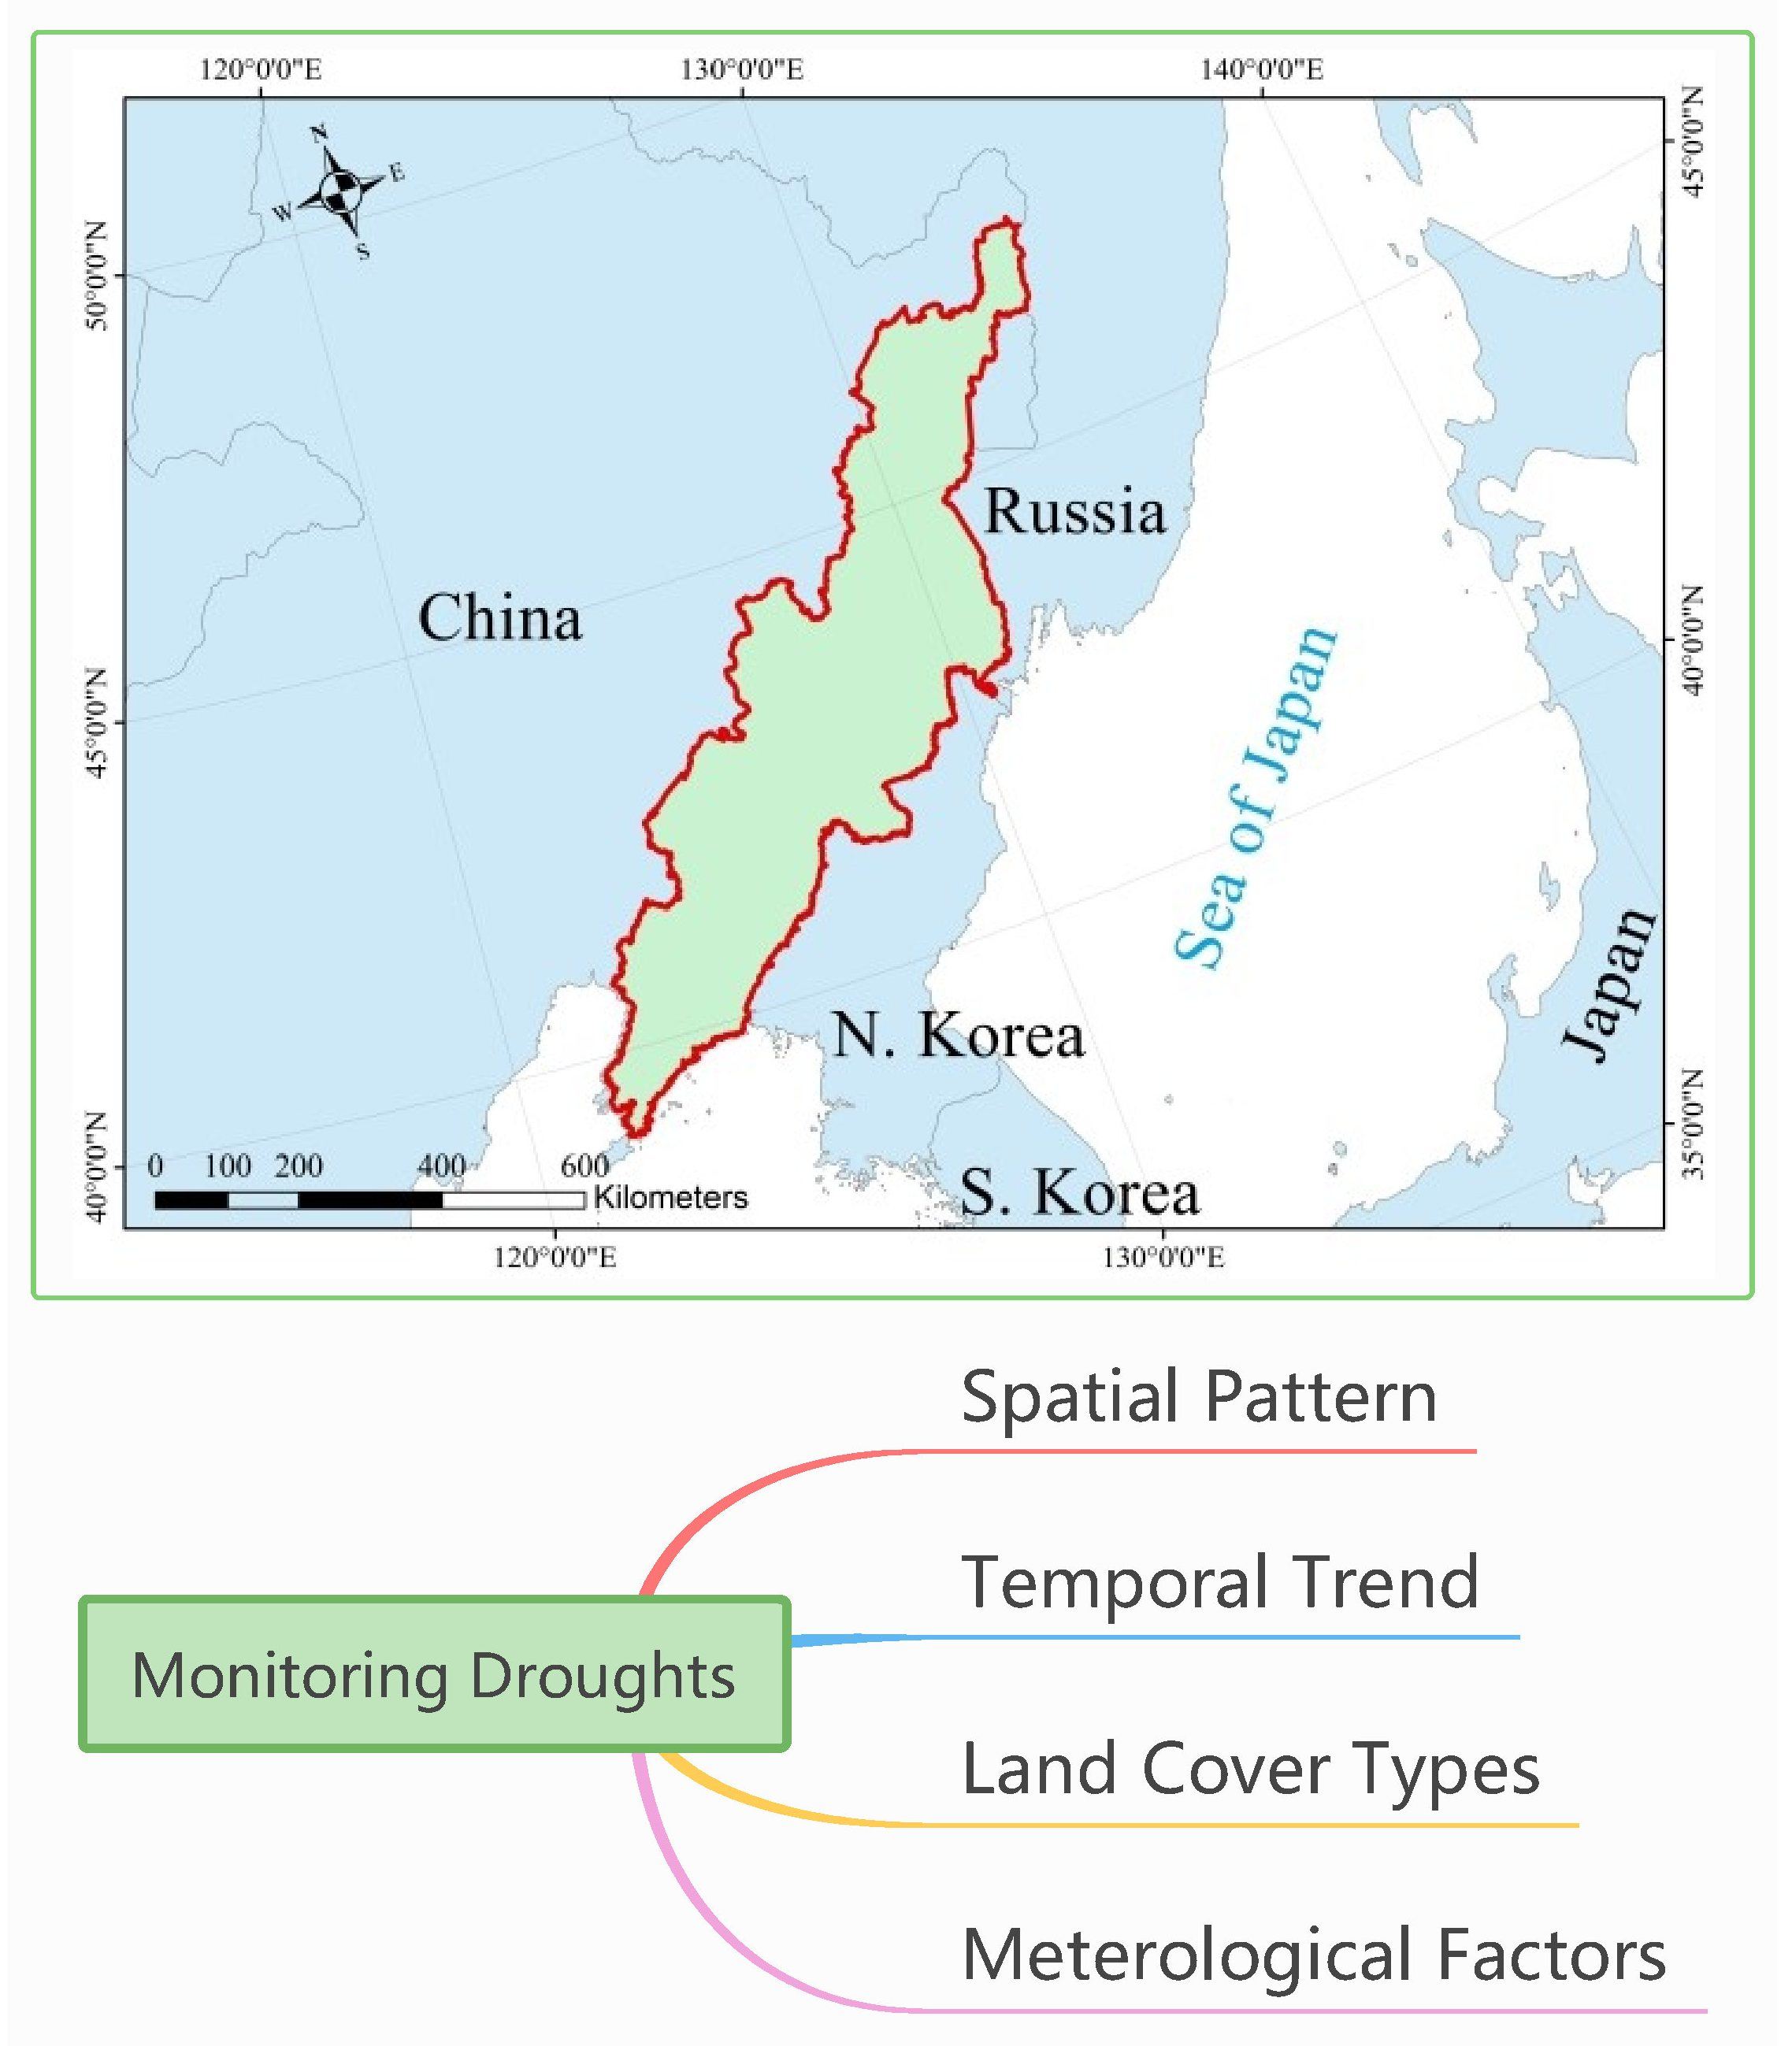
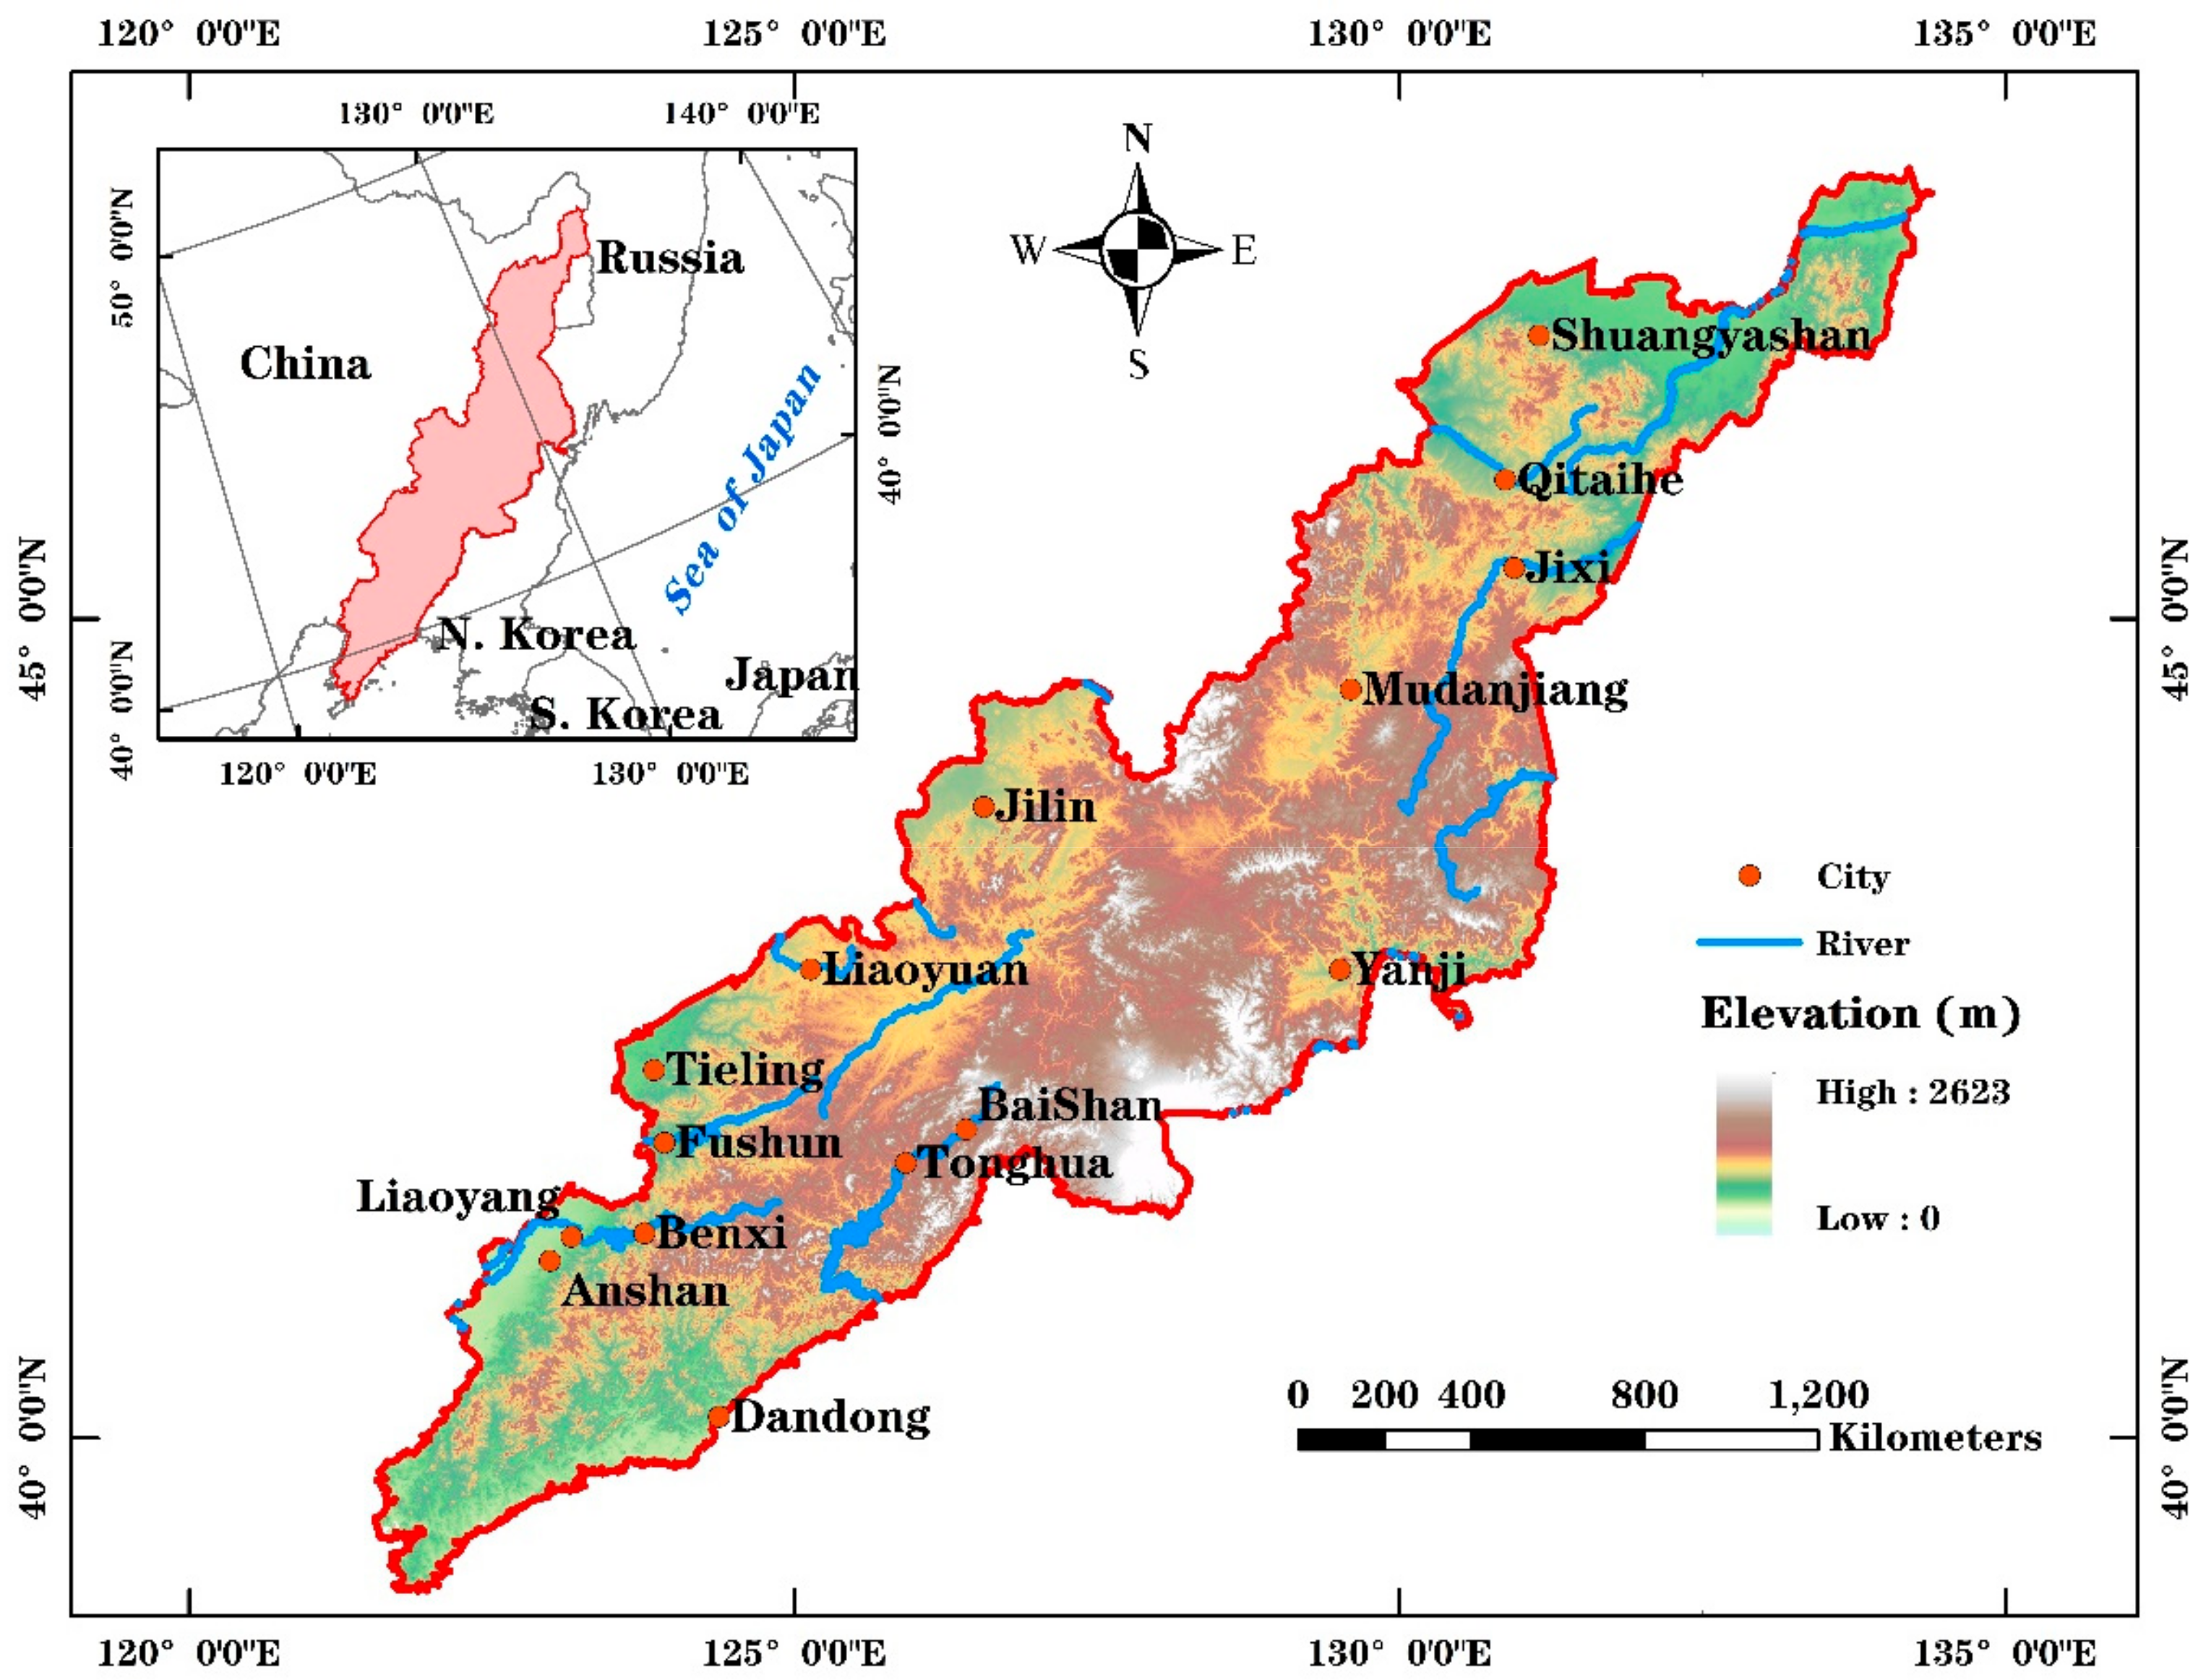
2.1. Study Area

The GCM include a part of the northeast provinces of Heilongjiang, Jilin, and Liaoning in China and have the largest protected temperate forest in Northeast Asia with many rare animal and plant resources. This area has been a focal point of ecosystem and biodiversity research based on remote sensing applications [27]. The Greater Changbai Mountains (GCM) has a northeast–southwest orientation and extends in the region 38°46′–47°30′ N latitude and 121°08′–134° E longitude (Figure 1). It mainly includes parallel fault block mountain areas, such as Changbai, Laoyeling, Zhangguangcailing, and Hadaling. It extends 1300 km from the north to the south and stretches 400 km from the east to the west. The Changbai Mountain is somewhat spindle shaped, and it has a large elevation difference. Its highest peak is located in Jilin Province and is 2670 m high. The total area of the mountains is approximately 2.8 × 10⁵ km2. The Changbai Mountain is a treasure trove of world resources as it contains all types of vegetation from temperate to polar types. It covers climatic zones ranging from warm temperate to mid-temperate and from humid to semi humid zones. The mountain also has diverse soil types and complex landform types. The Changbai Mountain has diverse variety and is rich in species. The area mainly has coniferous and broad-leaved mixed forests dominated by Korean pine; coniferous forests dominated by fir, spruce, and larch; and broad-leaved forests in the temperate zone. The Changbai Mountain has a temperate humid monsoon climate and is located on the northeastern edge of the global monsoon climate regions. The region is also affected by the continental climate. Its climate is mainly characterized by long and cold winters and cool and short summers. The climate difference between the north and south is large as the region is spread across nearly 10° latitude, and the climate types vary greatly with the terrain because of the influence of altitude.

2.2. Data

Satellite remote sensing data from the Moderate Resolution Imaging Spectroradiometer (MODIS) and Tropical Rainfall Measurement Missions (TRMM) multi-satellite precipitation analyses (TMPA) were used as the inputs to generate different drought index images. Four products including the NDVI, LST, Land cover and precipitation were employed as listed in Table 1. All data have a monthly or yearly temporal resolution. The monthly data were then aggregated to yearly data by averaging. For Land cover product (MCD12Q1), Land Cover Type 3 layer with annual Leaf Area Index classification scheme, which has 10 land cover classes, was used here. All these products have enough time scale to cover the whole of 2001–2018.
The annual average temperature and total precipitation data for 14 prefecture-level cities in the GCM area from 2001 to 2017 (data of 2018 were missing) were collected from local statistical yearbooks. They were used to explore the correlation between remotely sensed drought indices and meteorological observations.

3. Methodology

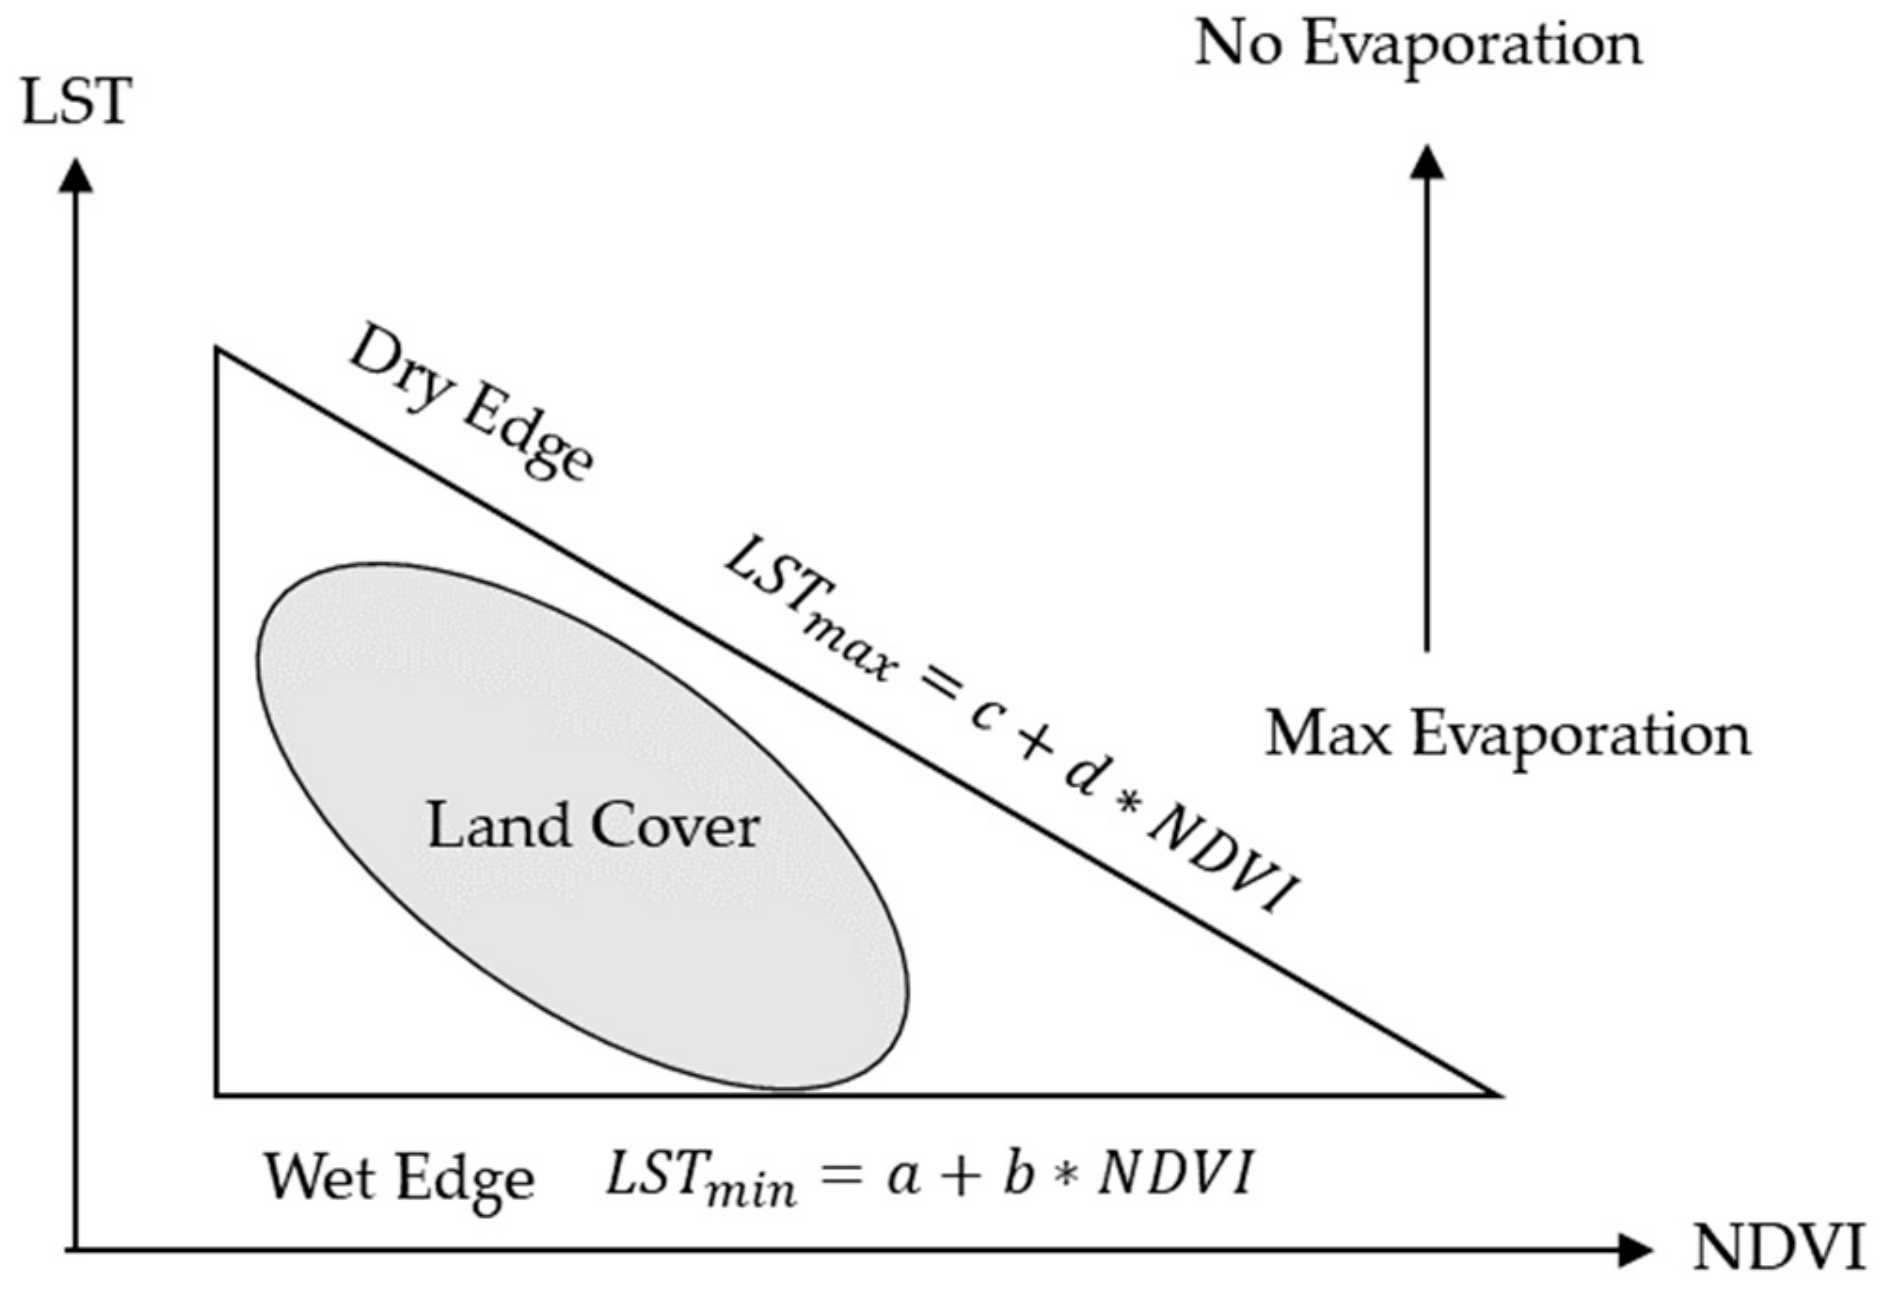
3.1. Drought Indices

These six widely used drought indices (PCI, VCI, TCI, VHI, SDCI, and TVDI) can be categorized into three types. One type comprises a single-factor index, including PCI, TCI, and VCI, calculated only from one of the three—precipitation, LST, and NDVI (Table 2). The second type is an index comprising a combination of factors; examples of this type are the VHI and SDCI, which are calculated from weighted combinations of multiple single-factor indices (Table 3). The other one is TVDI, which employs the spatial relationship between LST and NDVI to reflect drought information (Equation (1)).
TVDI = L S T L S T m i n L S T m a x     L S T m i n
L S T m i n = a + b × N D V I
L S T m a x = c + d × N D V I
In Equation (1), L S T is the observed surface temperature at a given pixel; L S T m i n , the minimum surface temperature in the triangle for a given N D V I defining the wet edge (Equation (2)); and L S T m a x , the maximum surface temperature in the triangle for a given N D V I defining the dry edge (Equation (3)) [27]. Their coefficients (a, b, c, and d) can be estimated by fitting the dry and wet edges of the triangle (Figure 2).
MODIS and TRMM datasets were acquired and processed as the inputs to generate six drought indices. The values of each of these indices range from 0 to 1, with a higher value indicating less drought for most indices. However, for TVDI, a higher value indicates a more severe drought. Table 4 lists the classification scheme of these indices for drought levels according to [34].

3.2. Trend Analysis

To reveal the trend of the drought condition from 2001 to 2018, a temporal trend analysis based on the ordinary least squares (OLS) regression was conducted for each drought index (DI) pixel. Then, a linear equation of a DI was fit as a function of the variable “YEAR” to calculate the slope (Equation (4)). An image of the changing slope over the period 2001–2018 was thus obtained.
S L O P E = n × i = 1 n i × D I i i = 1 n i i = 1 n D I i n × i = 1 n i 2 i = 1 n i 2
In Equation (4), n represents the total number of observation years (n = 18). DIi represents the mean value of drought index for the ith year. SLOPE > 0 represents an increasing trend of DI from 2001 to 2018. Conversely, SLOPE < 0 represents a decreasing trend. F-statistics were conducted to determine the significance of the fitted linear regression model.

4. Results

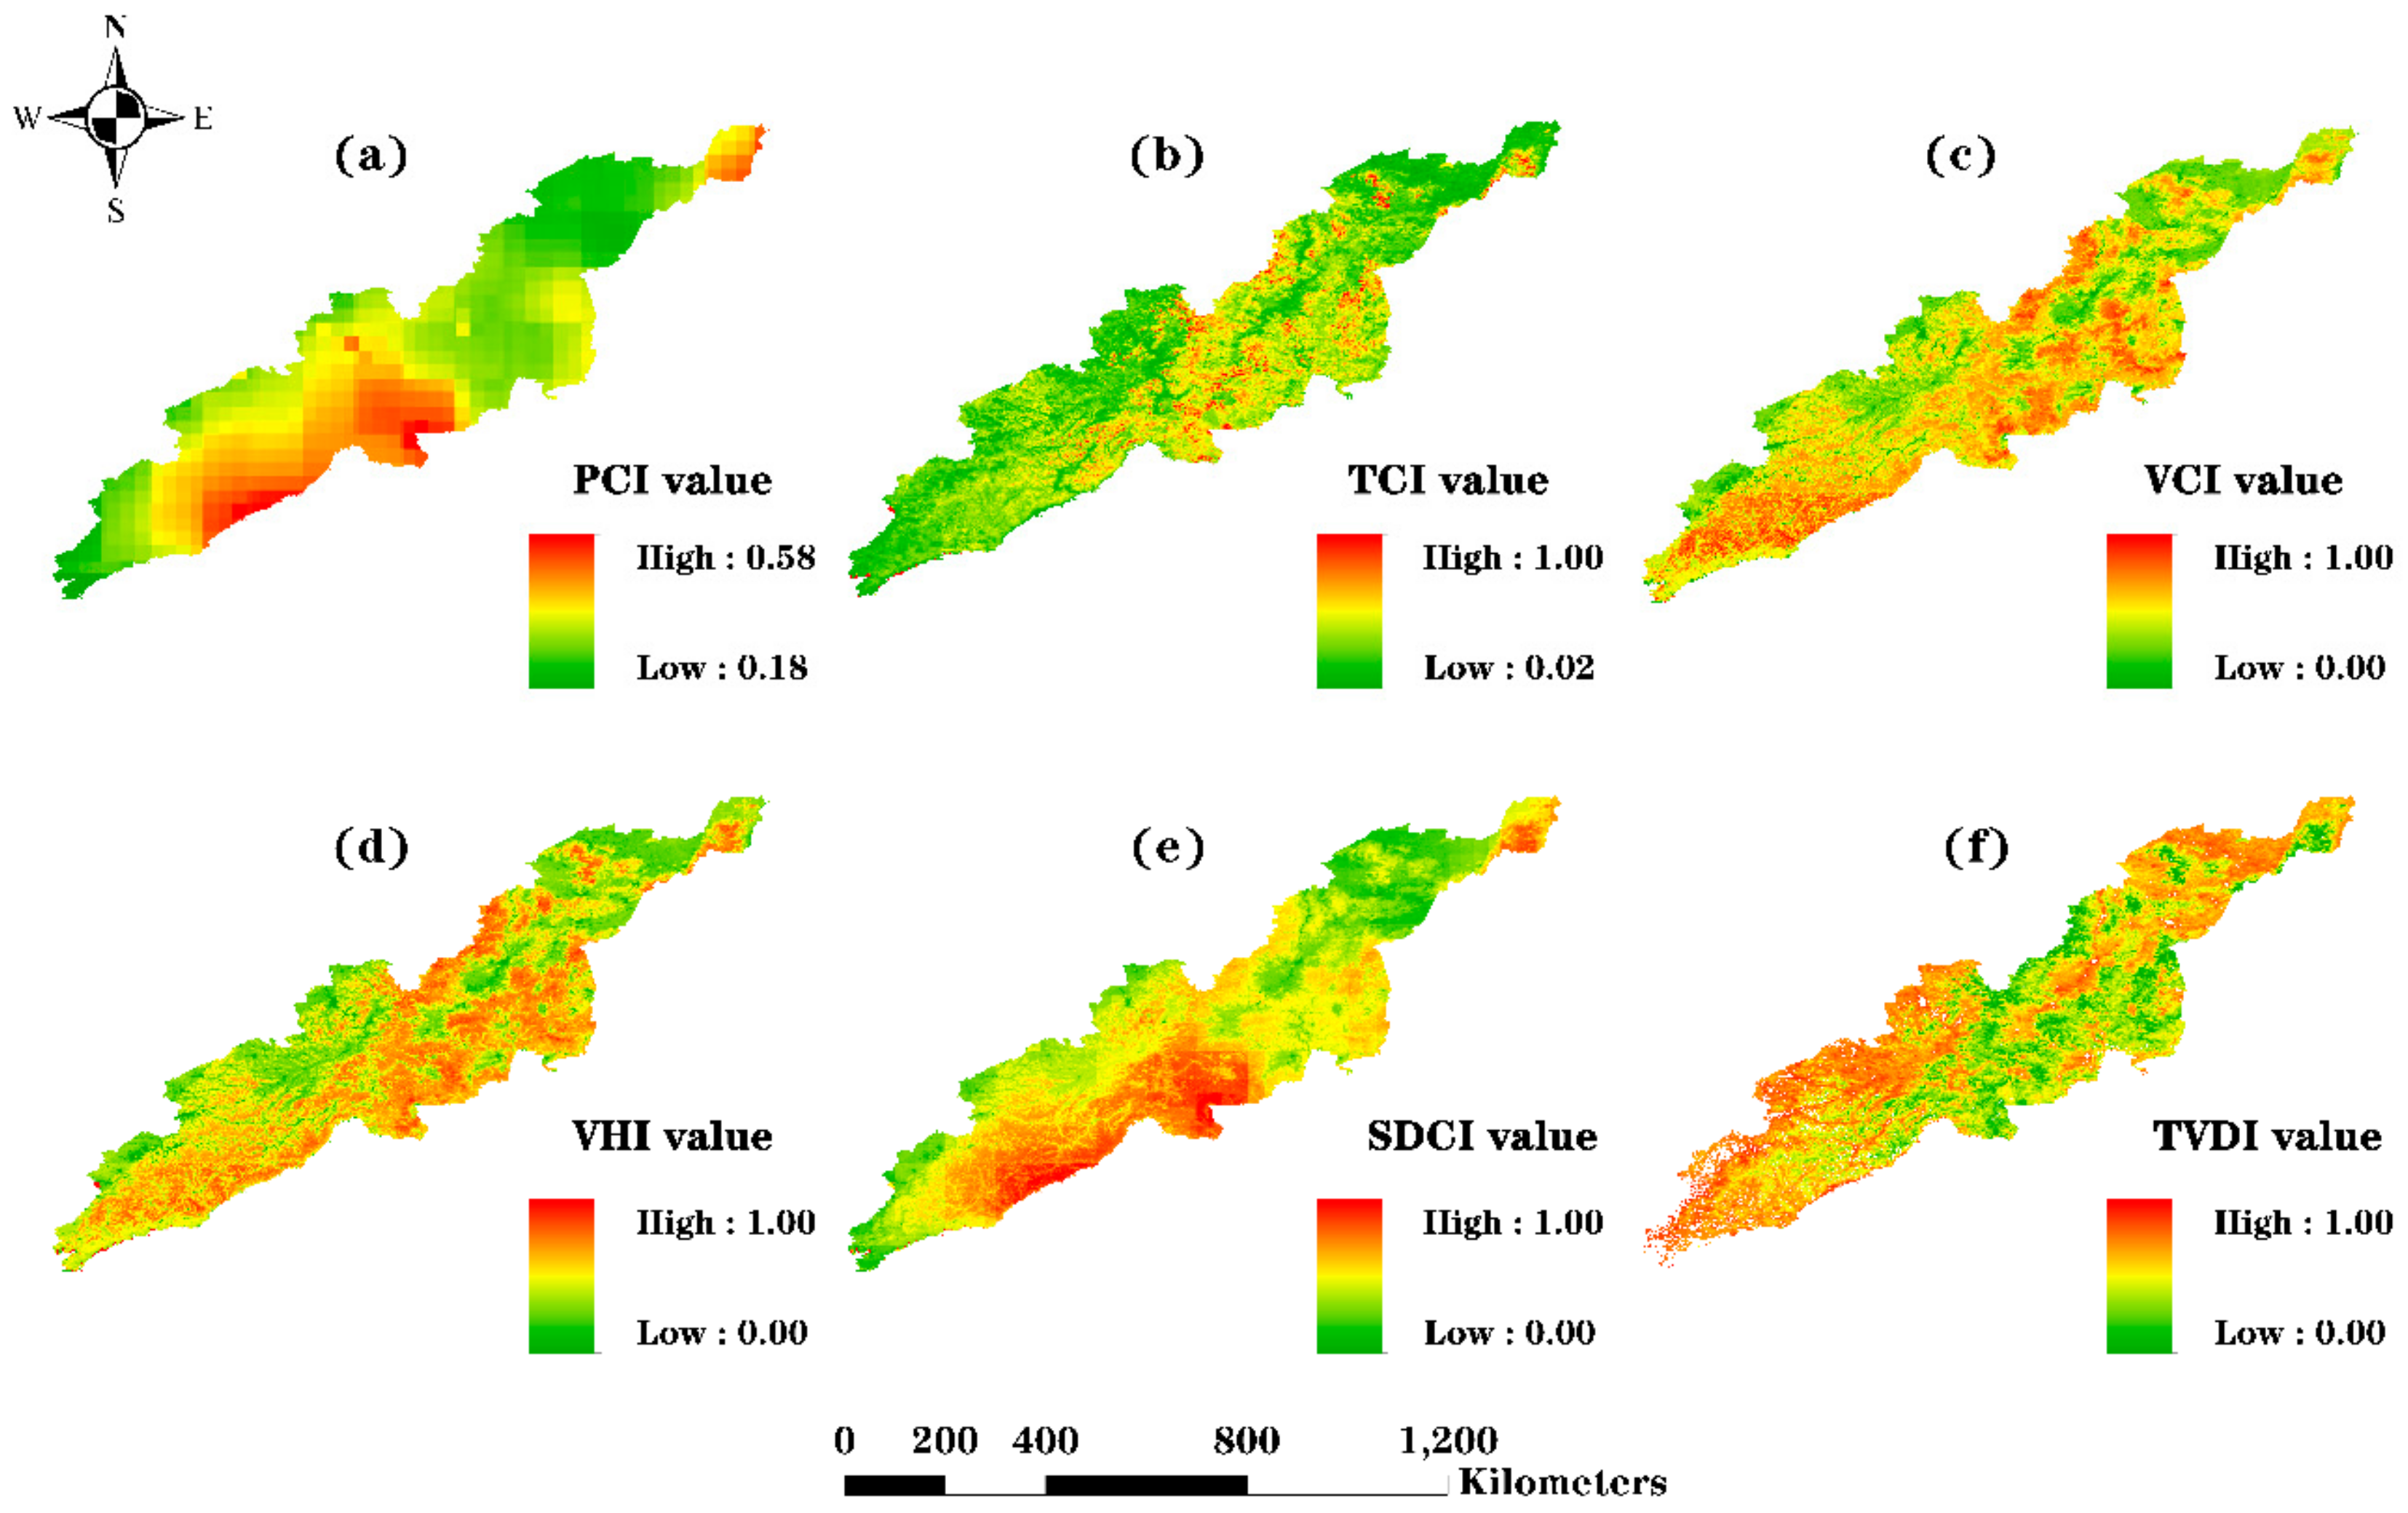
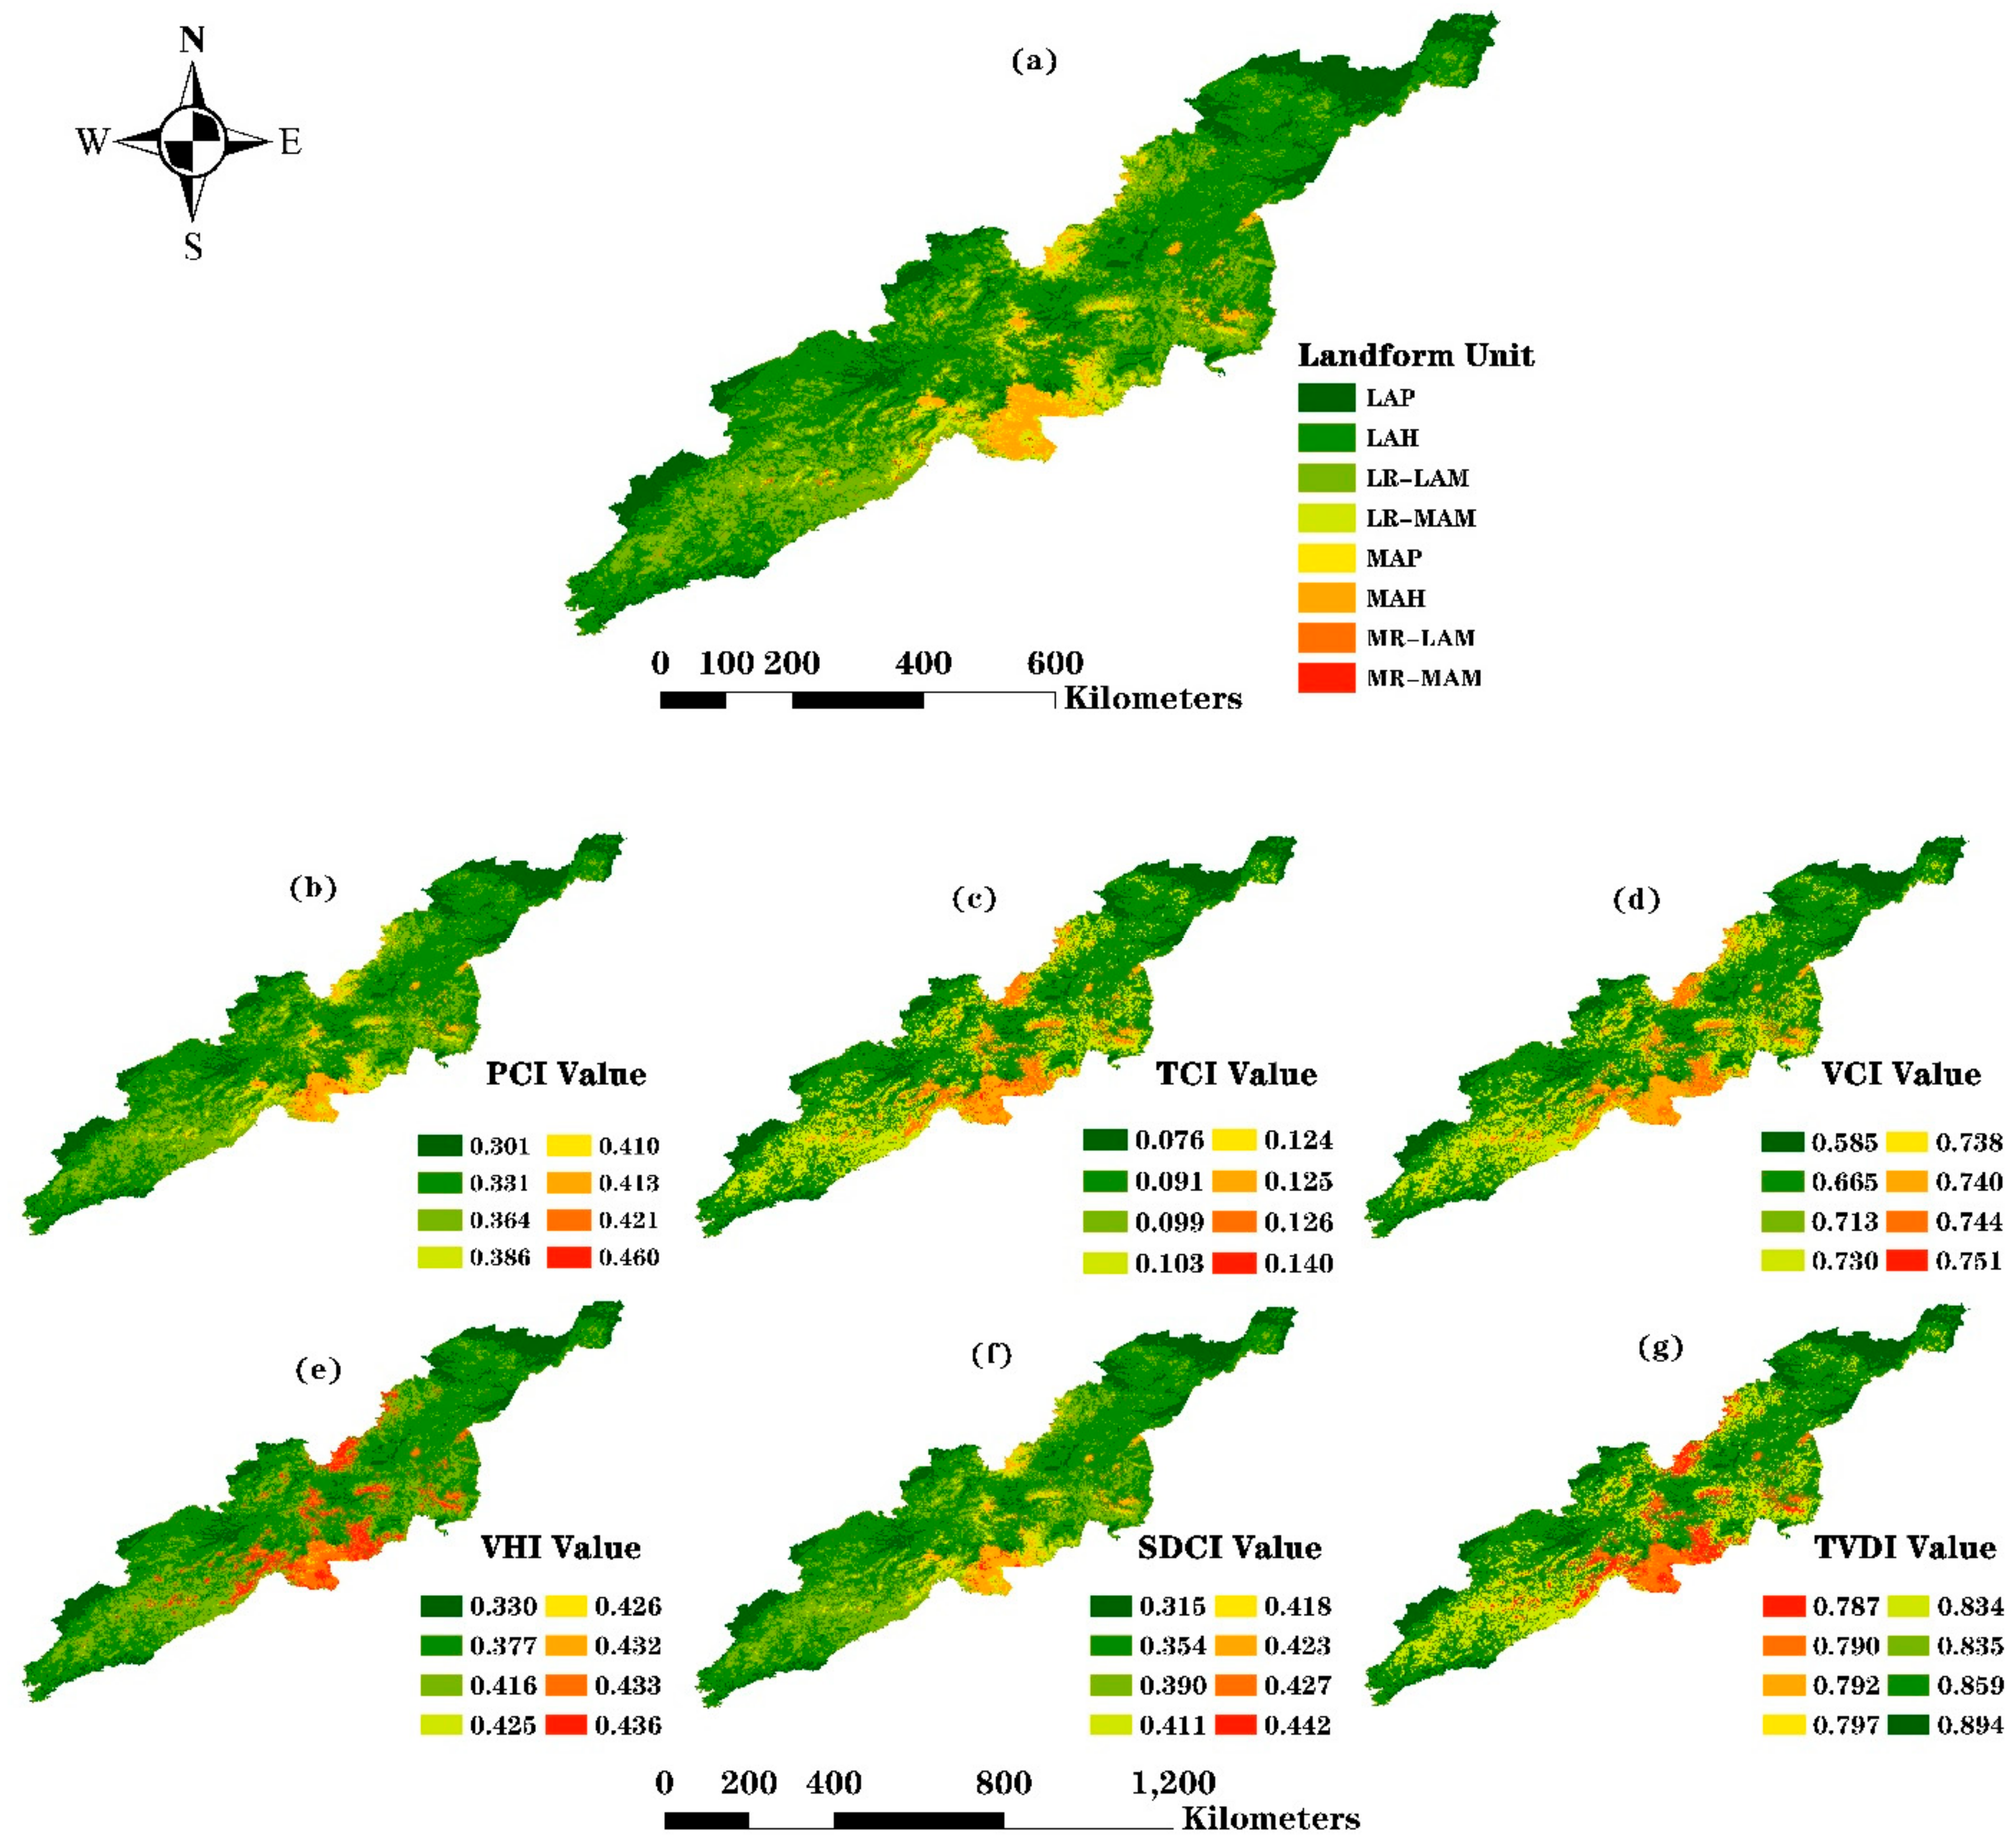
4.1. Spatial Pattern
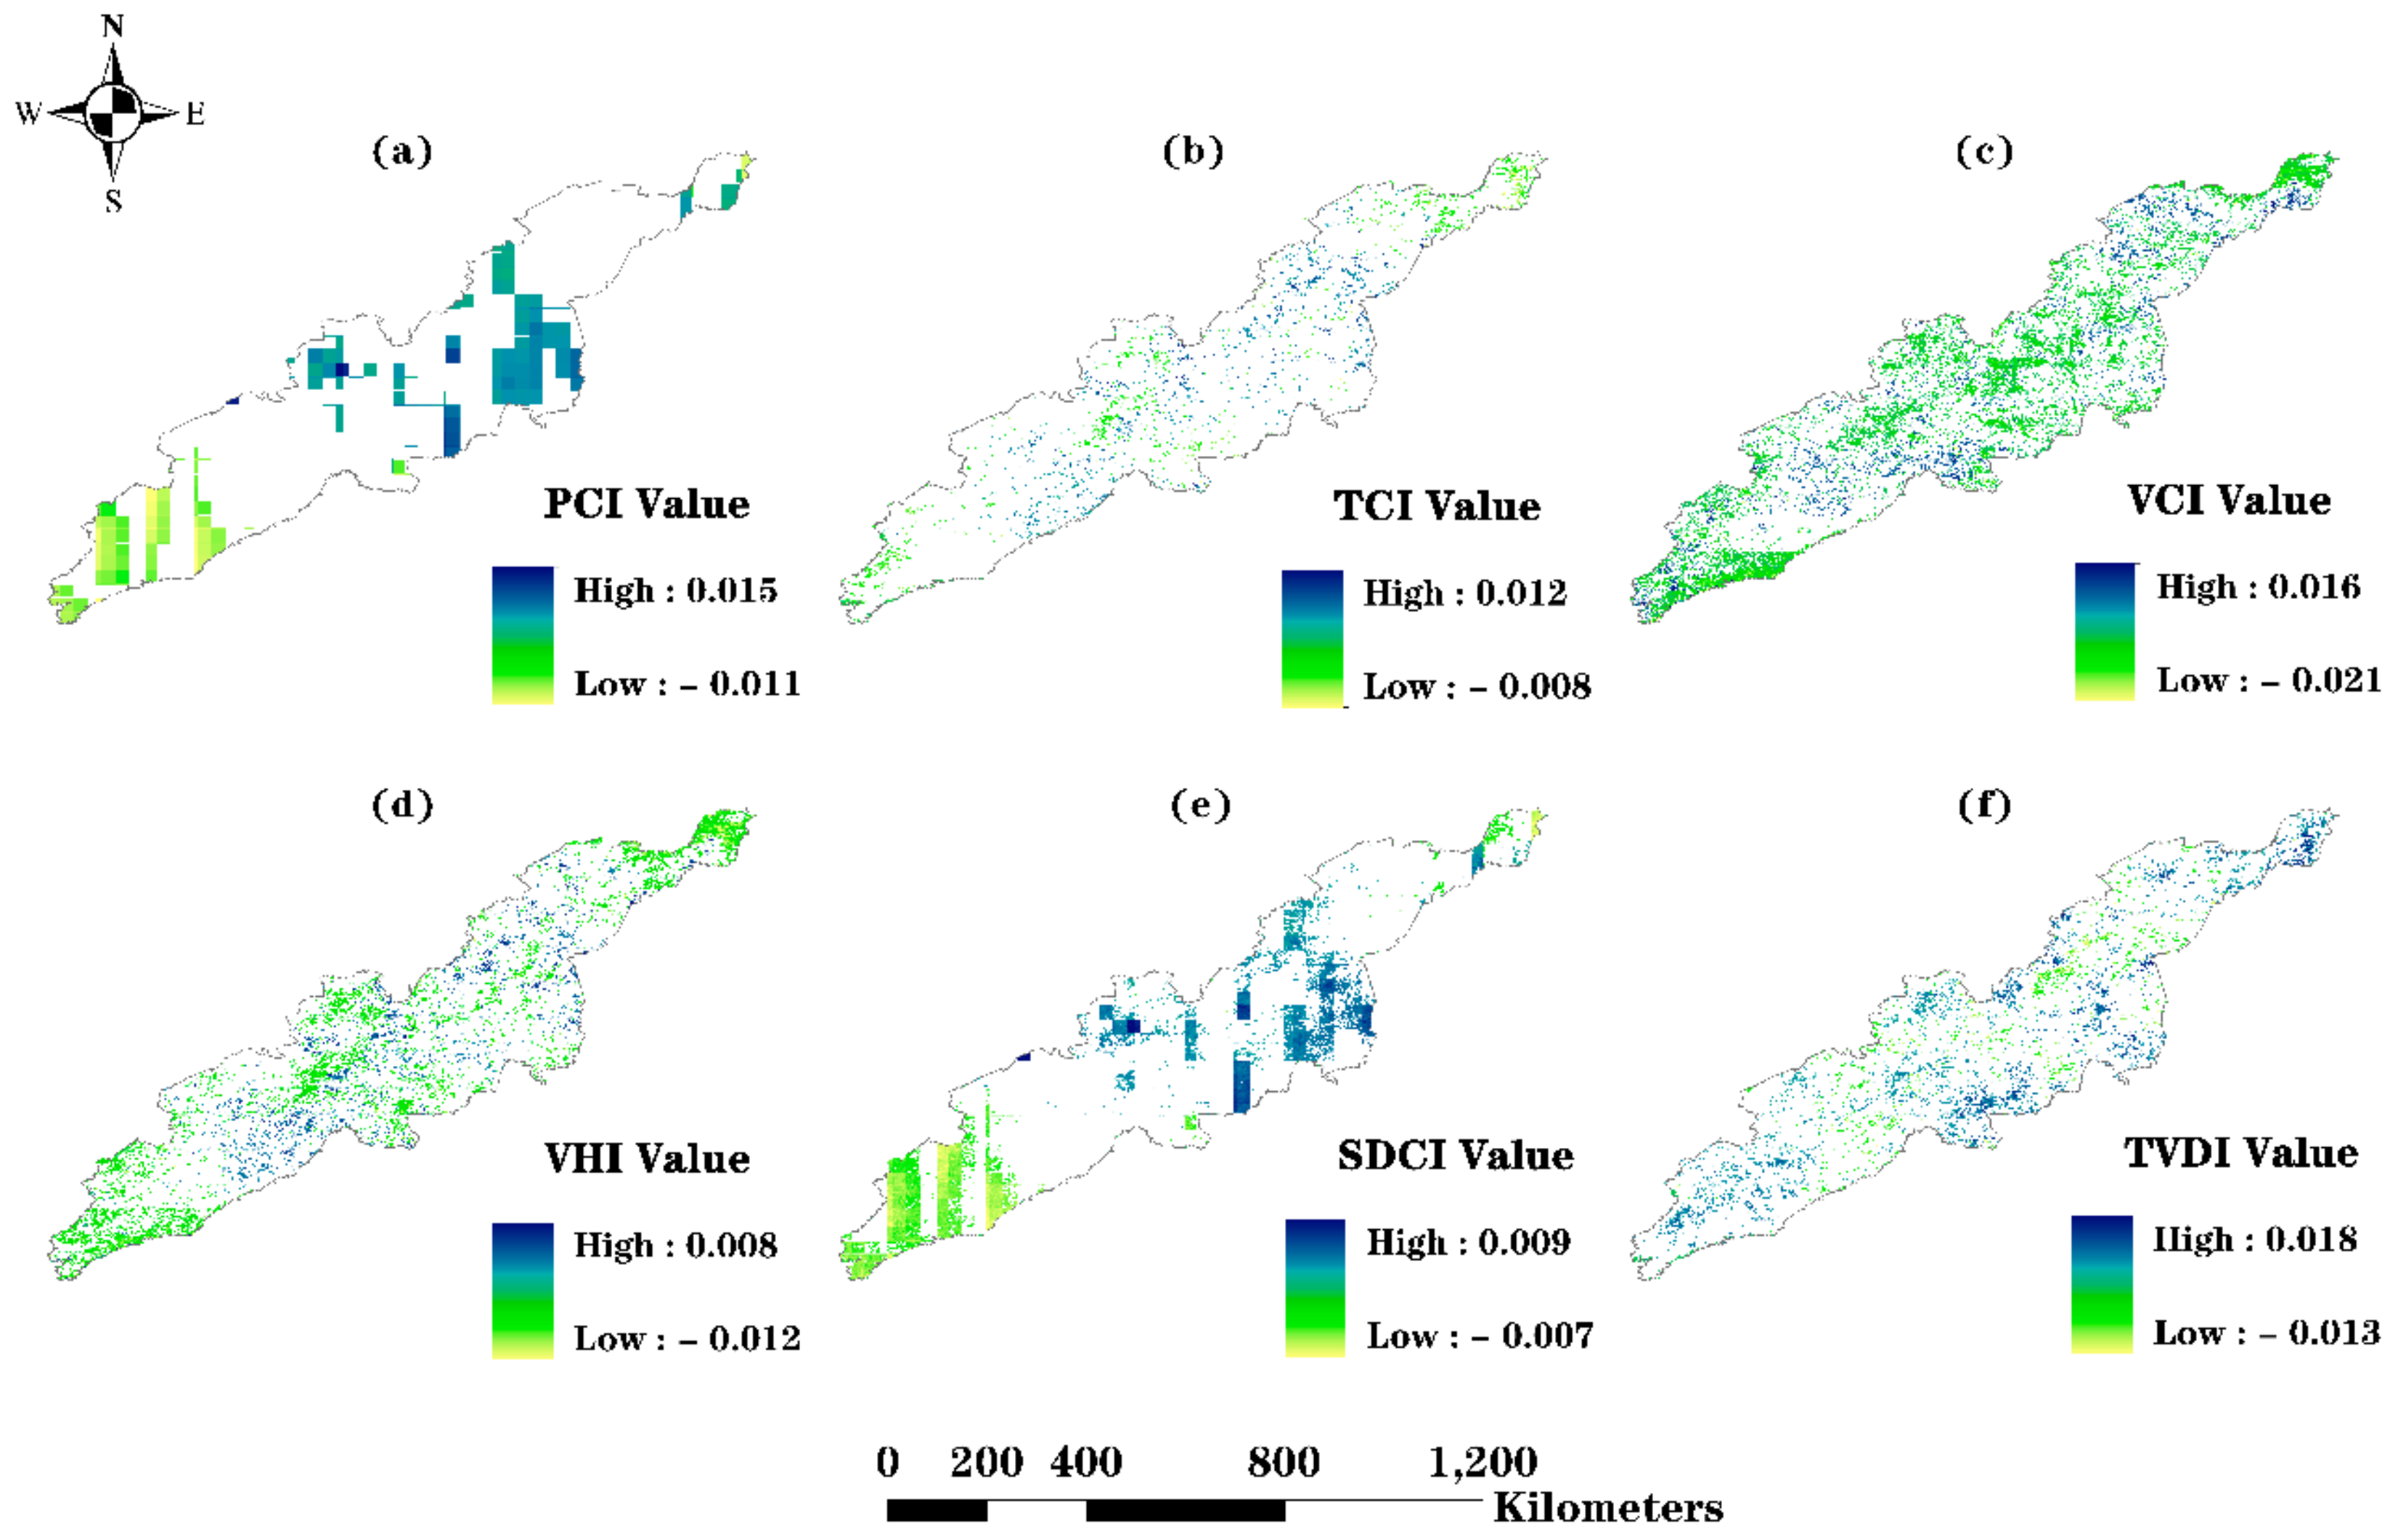
Figure 3 shows six DI maps that were averaged based on the annual draught indices from 2001 to 2018. Figure 3a–e presents those drought indices whose lower values indicate severe drought, while Figure 3f shows the TVDI map for which a higher value indicates severe drought.
According to the PCI shown in Figure 3a and the classification scheme presented in Table 4, the southeast area of the GCM region where Baishan, Tonghua, and Dandong Cities are located, exhibits no drought conditions, whereas the northeast area (ShuangyaShan) has a low PCI value, indicating obvious drought conditions. Most of the remaining areas had slight or no drought. The TCI and VCI maps show slightly different drought patterns. According to the TCI map, most of the GCM area experienced drought conditions, except for the mountains in the central region. The VCI map indicates that most of the area experienced slight or no drought, except for the low-lying areas in the southwest and northeast. Since the TCI is related to LST, and the VCI is related to NDVI, the conflict between the TCI and VCI suggests that vegetation flourished in the mountains despite the high LST, indicating that the vegetation in the GCM area has high drought endurance. The VHI is high (no drought/wet conditions) in the southeast area with high elevation, while low (drought conditions) in the low-lying southwest and northeast areas. The other area has moderate VHI values, indicating mild drought conditions according to the classification in Table 4. The SDCI map shows a pattern similar to that of the PCI map, largely because the PCI is an important factor in the SDCI. According to the TVDI map, no drought conditions occurred in the southeast area with high elevation. The remaining parts of the region exhibited slight to moderate drought conditions. The spatial pattern of the TVDI was similar to that of the VHI. Thus, these six indices exhibit different drought information for the GCM area. This is mainly because they are calculated from different combinations of precipitation, LST, and vegetation status. Thus far, we cannot conclude which index is more reliable because they all try to reflect one or more aspects of drought conditions. The differences among the index maps also suggests that the method for drought monitoring should be selected carefully.

4.2. Temporal Trend

Trend analyses were conducted for the annual index images using the aforementioned OLS regression and F-statistics. On the basis of the calculated slopes and significant levels, the trends of changes in the drought indices were classified into seven categories: (1) highly significant decrease (SLOPE < 0, p ≤ 0.01), (2) significant decrease (SLOPE < 0, 0.01 < p ≤ 0.05), (3) moderately significant decrease (SLOPE < 0, 0.05 < p ≤ 0.1), (4) no significant change (p > 0.1), (5) moderately significant increase (SLOPE < 0, 0.05 < p ≤ 0.1), (6) significant increase (SLOPE > 0, 0.01 < p ≤ 0.05), and (7) highly significant increase (SLOPE > 0, p ≤ 0.01) [35], as shown in Figure 4. Figure 4 shows a significant PCI decrease for 8.8% of the study area and a significant increase for 13.6% of the area. The remaining area exhibited no significant change during the last 18 years. The area with a significant increase in the PCI is mainly located near Mudanjiang, Jilin, and Yanji City, while the area with significantly decreasing PCI is mainly distributed near Liaoyang, Anshan, and Dandong City. For TCI, 3.3% of the area experienced a significant increase and 3.3% of the area witnessed a significant decrease. The area with a significant decrease was distributed near the north of Shuangyashan and Qitaihe City and south of Anshan City, suggesting that these areas experienced very severe droughts in the recent 18 years. The positive trend was mainly observed in Mudanjiang and Tonghua City. With regard to the VCI, a significant increase was seen for 5.3% of the study area, whereas a significant decrease was seen for 21.3%, indicating that a larger area tended to experience very severe droughts recently. The areas with a significant decrease in the VCI are mostly located in the southern coastal region, Yanji in Jilin, and the northern part of Shuangyashan. The rest of Shuangyashan and Baishan exhibited an increase in the VCI. VHI trend analysis showed that 4.9% of the GCM area experienced a significant drought alleviation, whereas 14.1% experienced a significant drought aggravation. The spatial pattern of the VHI trend is similar to that of the VCI trend. SDCI trend analysis revealed that about 11% of the central area of the GCM experienced a significant increase (i.e., drought condition is relieving); meanwhile, almost an identical extent in the southwest experienced drought aggravation. TVDI trend analysis showed that a sparse area of 9.0% of the GCM experienced a significant increase, whereas 3.5% of the area experienced a significant decrease. The region with the decreasing TVDI was mostly distributed near Mudanjiang, Liaoyuan, and Tonghua.
Thus, the trend analyses indicate different drought trends for different indices. For the GCM, both PCI and SDCI show similar patterns that the central area is getting wetter and the southwest area is getting drier. VCI and VHI exhibit similar patterns showing sparse areas with decrease (drying) and overwhelming increase (wetting).

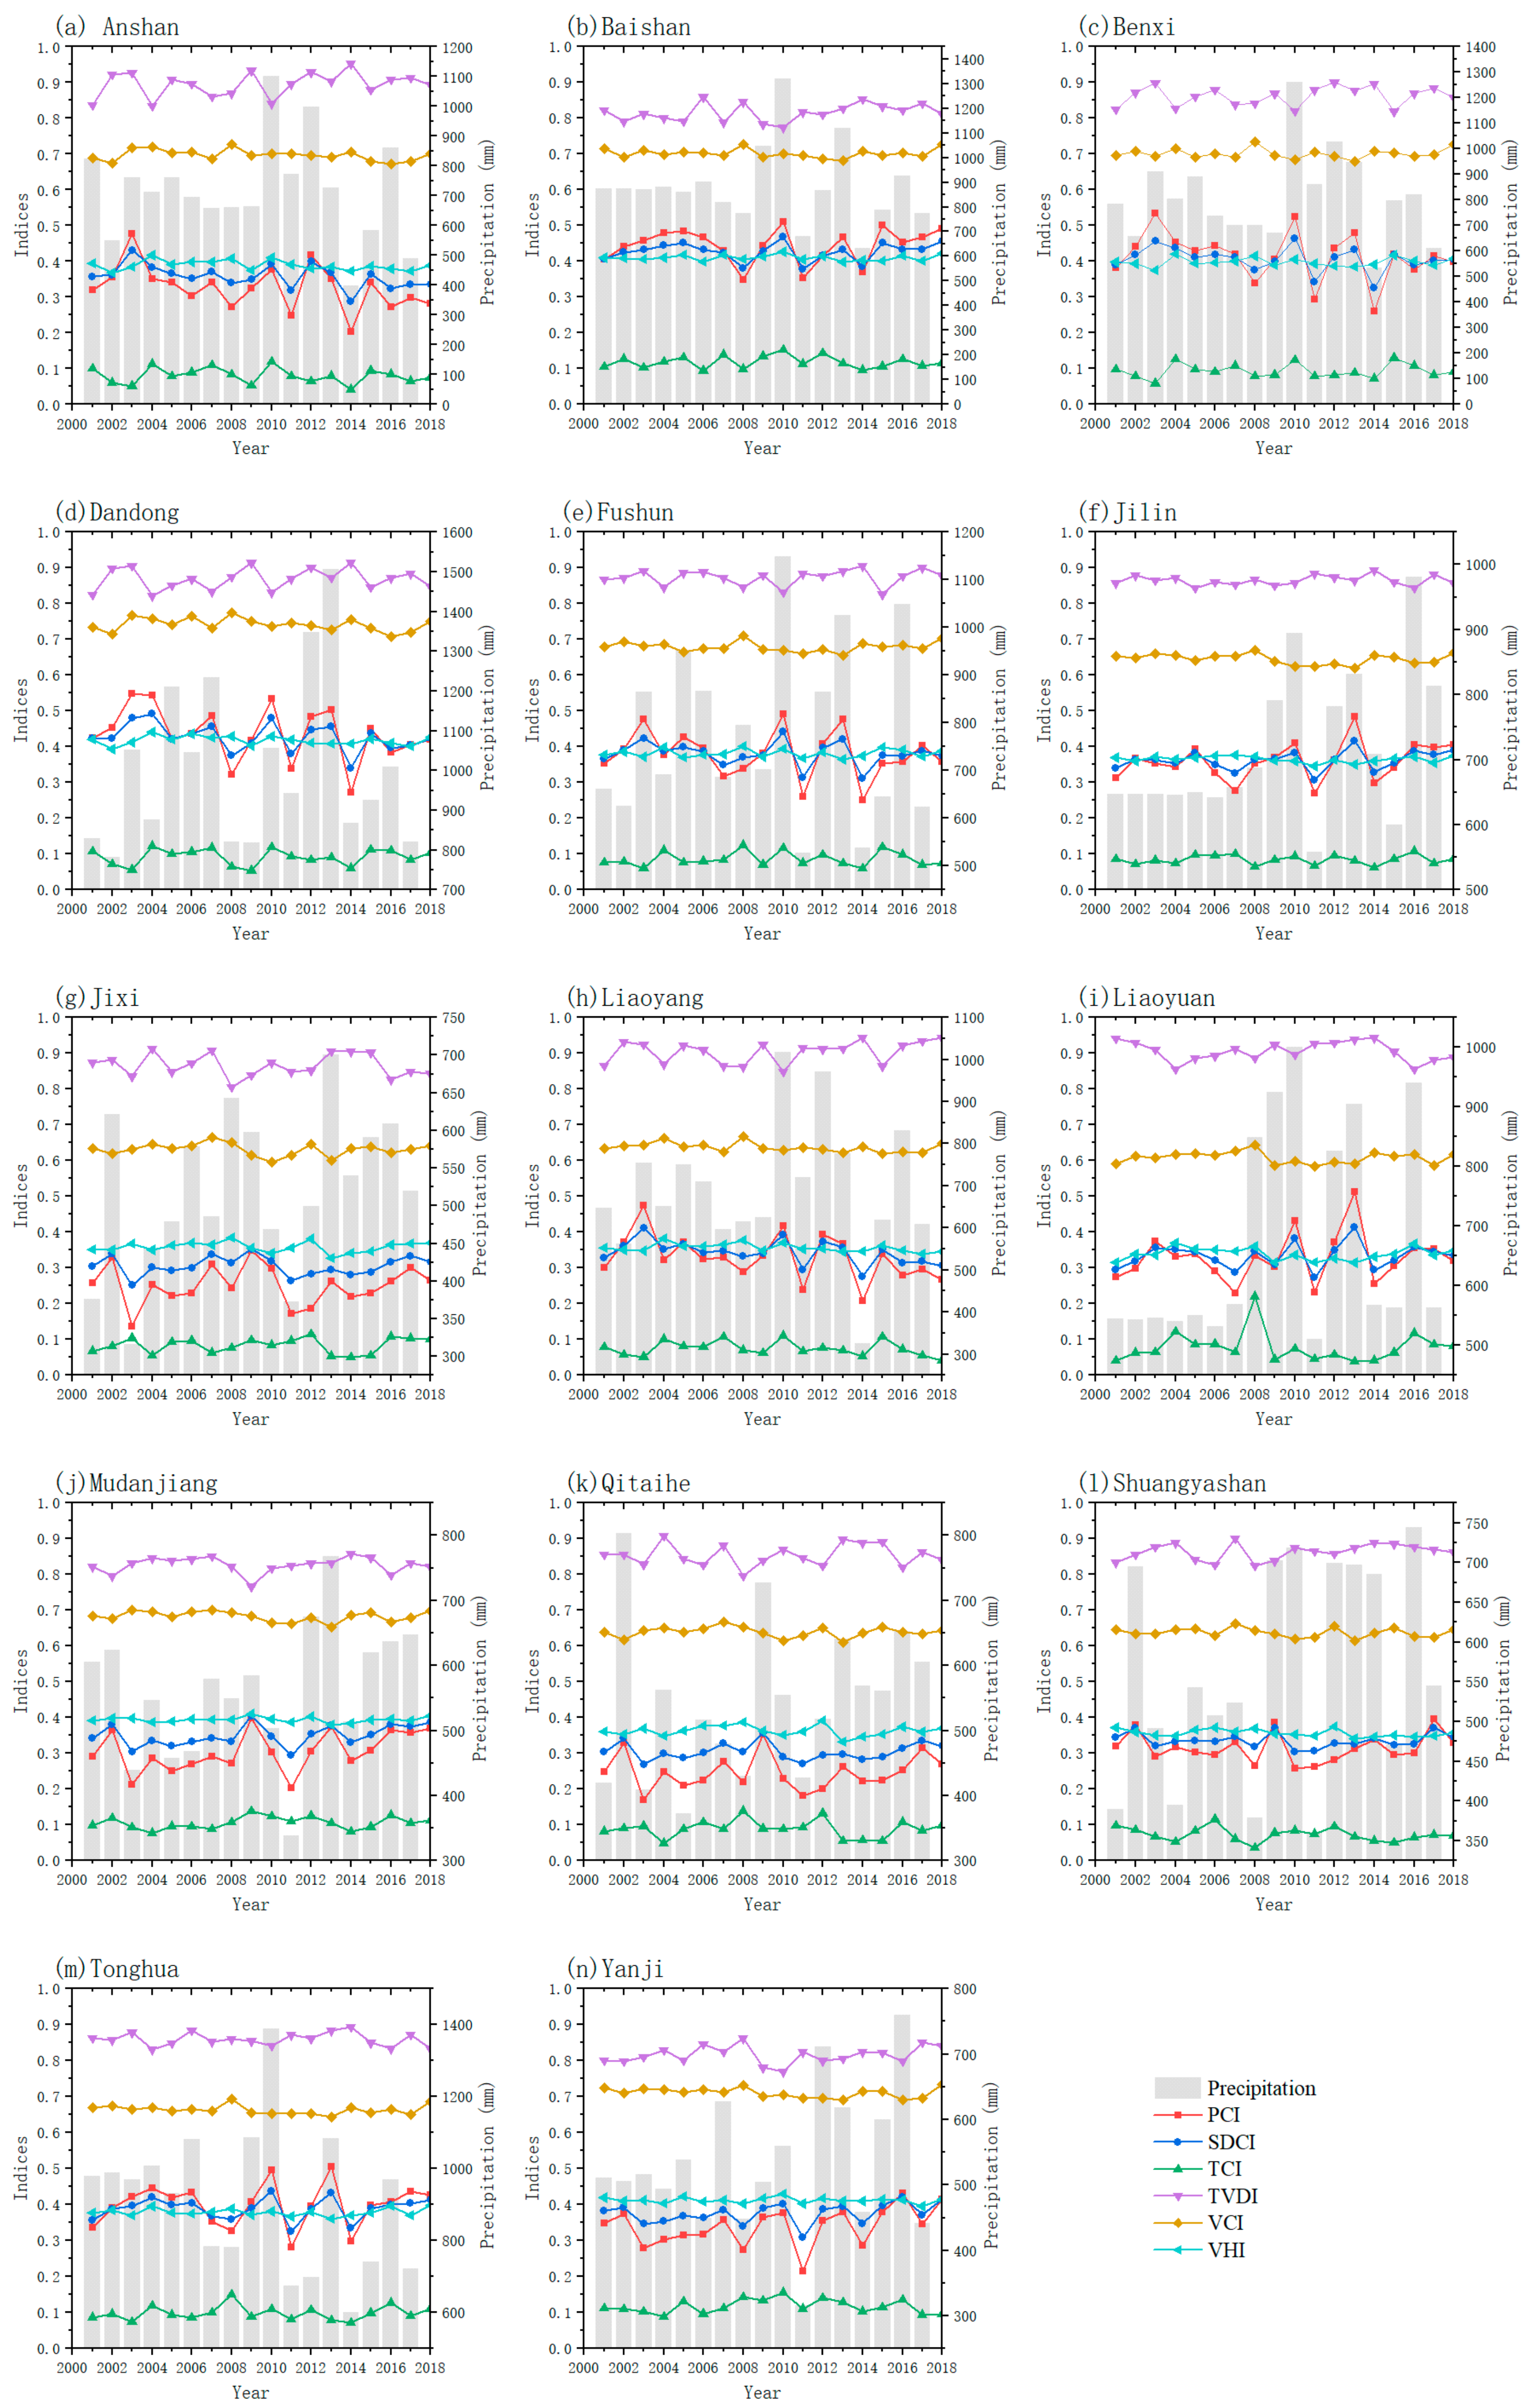
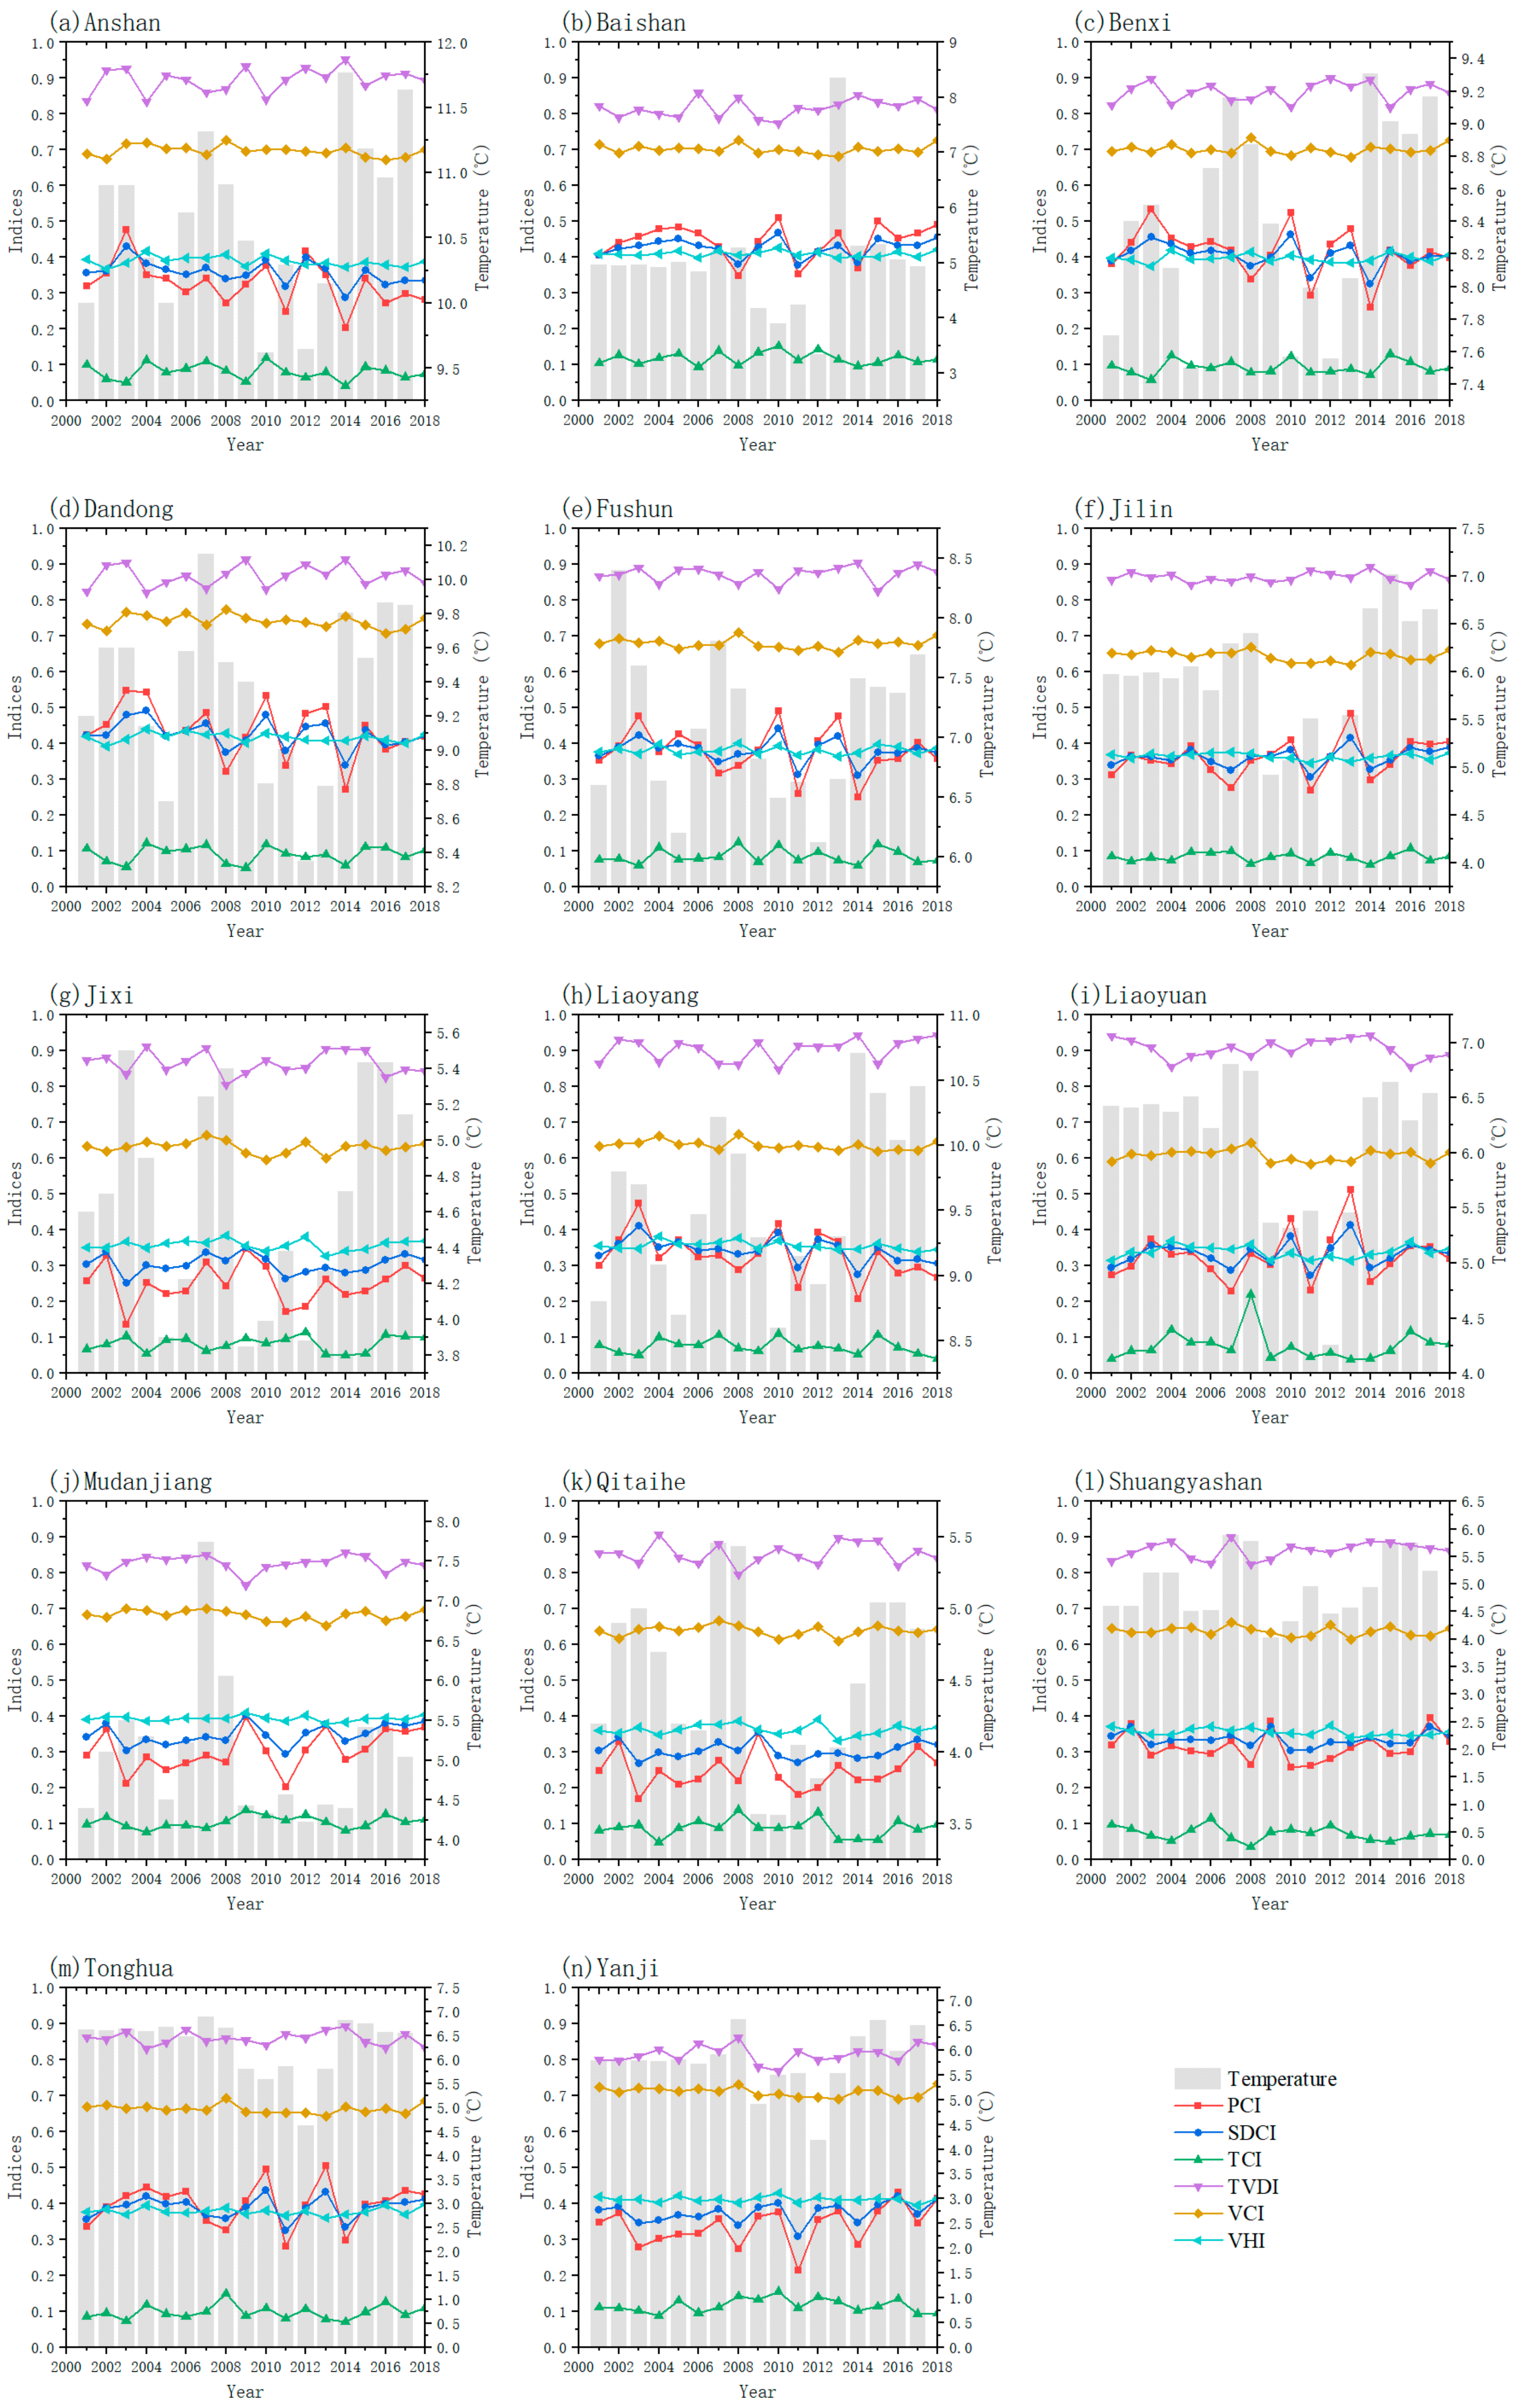
4.3. Correlations between Drought Indices and Meterological Factors

The annual average precipitation and temperature were collected from 14 prefecture-level cities in the GCM. Six annual drought indices were plotted for these cities, as shown in Figure 5 and Figure 6. As shown in Figure 5, PCI and SDCI both show similar annual patterns with precipitation. This is because precipitation is an important input for both these indices. The other four indices (VCI, TCI, TVDI, and VHI) do not show any clear relation with annual precipitation. TCI mainly reflects the surface temperature variation, while for the other three indices, NDVI is an important input.
Dandong has a relatively larger precipitation volume with high variations from 2001 to 2018 because of its special geolocation. Its forest coverage is as high as 65%, endowing the region with high water-holding capacity. Precipitation-based drought indices in this area indicate clearly humid characteristics. For example, the precipitation was very high in 2012 and 2013, and the average annual temperature was lower (Figure 6d). Therefore, most of the indices identified the lack of a drought condition in these 2 years. Benxi, which is a city neighboring Dandong, had slightly lower annual average temperature and precipitation. Its drought condition was similar to Dandong according to different indices. Anshan and Liaoyang are located inland and receive less precipitation than Dandong and Benxi. In particular, in 2014, the precipitation of Liaoyang was only 300 mm, and the average temperature was higher than 10 °C, which was significantly higher than that in the other years. PCI and SDCI clearly indicate the drought situation in Liaoyang. Anshan received precipitation as low as approximately 400 mm in 2014, and the average annual temperature was higher than 11 °C. PCI and SDCI also reflected the drought situation of Anshan correctly. Fushun received an annual precipitation exceeding 1,000 mm in 2010 and 2013, and its average annual temperature was between 5.5 °C and 6 °C; meanwhile, in 2011 and 2014, it received a very low precipitation of 500 mm, and the PCI and SDCI values clearly reflect these changes. Baishan and Tonghua are located close to the Changbai Mountain Nature Reserve. The annual precipitation and temperature were relatively stable from 2001 to 2018. The drought indices also tended to vary smoothly. Jilin and Liaoyuan experienced similar annual precipitation variations in the recent years. In 2011, their annual precipitation was the lowest, only about 500 mm, which was captured by PCI and SDCI. Yanji, Jixi, Mudanjiang, Qitaihe, and Shuangyashan are located inland north of the Changbai Mountain Nature Reserve and have high latitudes, low annual average temperatures, and annual precipitations less than 800 mm. Their PCI, TCI, VCI, VHI, and SDCI values are lower than those in other regions. In the GCM, the TVDI, VCI, TCI, and VHI values also exhibit distinct annual patterns that do not appear to be related to the annual precipitation and temperature. This may because these indices do not consider precipitation, and indicate droughts based on the LST anomalies and vegetation health. The annual average temperature is usually not sensitive enough to reflect LST anomalies; hence, LST-based indices fail to show consistency with annual average temperature variations. Further, vegetation health may be sometimes affected by factors besides drought, and there is usually a time lag before drought can cause deterioration of vegetation health. This may be the reason why vegetation-based indices also fail to show consistency with the precipitation and temperature patterns.

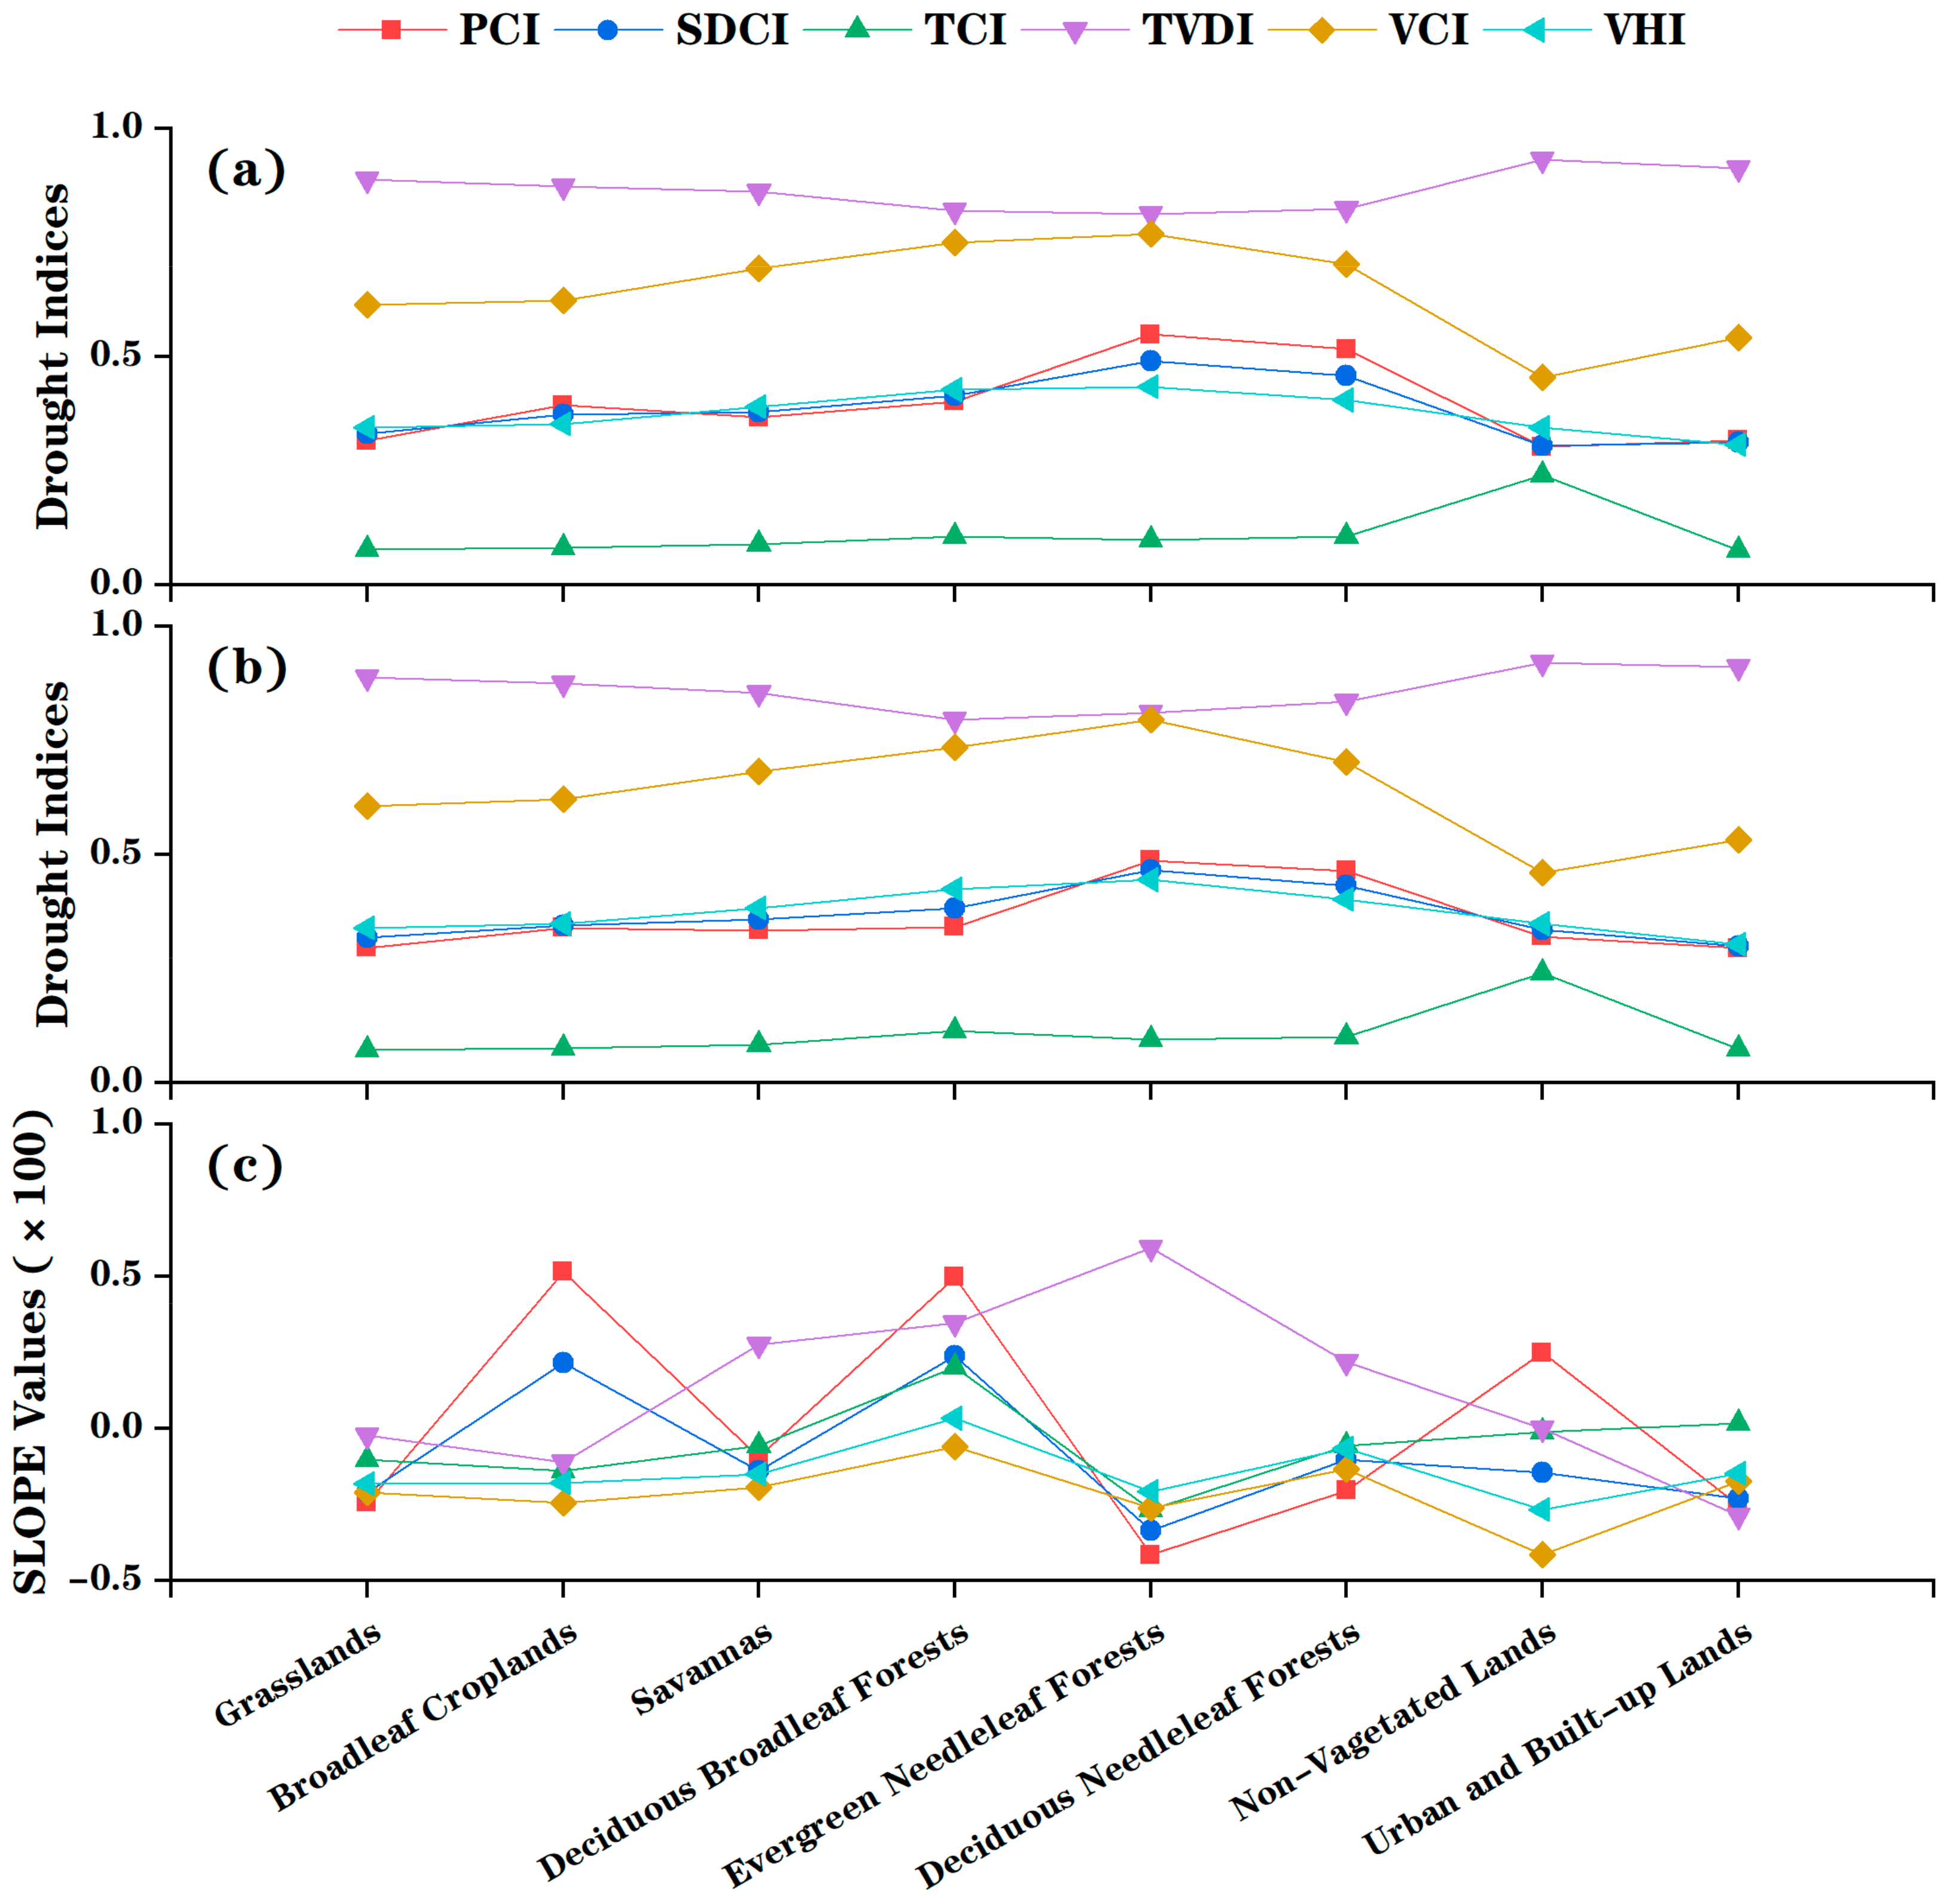
4.4. Correlations between Drought Indices and Land Cover Types

An examination of the annual land cover data from 2001 to 2018 revealed very little land cover change over these years. Therefore, in this study, we assumed that there was no land cover change, and we used the land cover map of 2018 as the current condition of land cover to investigate the correlations between drought indices and land cover types. According to the 2018 land cover map, in the GCM, deciduous broadleaf forests, grasslands, and savannas accounted for 46.8%, 30.4%, and 18.1%, respectively. The other seven land cover types account for less than 5%.
The distribution of vegetation types has a strong relationship with regional climatic factors, and surface temperature is an important climatic factor that affects the zonal distribution of vegetation types. Temperature is an important limiting factor for plant growth in the GCM; forest vegetation types, in particular, have distinct vertical zonal distribution characteristics. NDVI represents vegetation characteristics, and there exists a clear relationship between NDVI and LST. Le Page et al. [36] found that the negative correlation between NDVI and LST in agricultural area is due to drastic evaporation that decreases LST. However, there exists a positive correlation between NDVI and LST in the northeastern part of the study area, and this correlation is explained by the simultaneous forest leaf loss and fall in surface temperature (the coldest months). Figure 7a,b present the mean values of the six drought indices for different land cover types in 2018 and 2001. For the NDVI-based index (i.e., VCI) and the LST-based index (TCI), when the land cover changes from deciduous needleleaf forests to unvegetated lands, VCI decreases, while TCI increases. These two indices exhibit distinct patterns in different land cover types. The variability in the slope of the inverse LST–NDVI relationship in association with local topographic and environmental conditions has been assessed in previous studies [37]. The validity of VHI as a drought detection tool relies on the assumption that the NDVI and LST at a given pixel vary inversely over time with variations in VCI and TCI driven by local moisture conditions. However, over vast areas and long periods, the LST–NDVI relationship is nonunique and often nonnegative [37,38,39]. According to [37,38,39], NDVI and LST are positively related usually in energy-limited ecosystems, which implies that high temperature promotes the growth of vegetation. In this case, VHI and TVDI may not be appropriate for indicating drought conditions. However, for water-limited ecosystems, where high temperature may inhibit vegetation growth, NDVI has a negative relation with LST, conforming with the assumption of TVDI. In this case, TVDI and VHI are applicable for indicating drought conditions. Since the water-holding capacity of deciduous broadleaf forests is stronger than that of grasslands, deciduous broadleaf forests generally are more humid than grasslands. This is reflected by almost all the drought indices. Savannas comprise a mixed forest–grassland type of vegetation and have drought indices intermediate between those of the deciduous forests and grasslands.
We examined the zonal statistic to the slope value based on land cover types. Figure 7c shows the mean SLOPE values (scaled by 100) of drought indices from 2001 to 2018 for different land cover types. The TVDI SLOPE values of evergreen needleleaf forests is the highest among all land cover types; the SLOPE values of the other five indices are low and negative. This suggests that evergreen needleleaf forests in the GCM clearly have experienced severe drought conditions. Savannas and deciduous needleleaf forests also have similar but weaker changing patterns with positive slope for TVDI but negative slope for the other indices, which is similar to Zribi et al. [40], who analyzed drought affection on vegetation coverage based on time series Vegetation Anomaly Index (VAI). Our analysis of slope and land cover types showed that VCI and VHI have negative values with similar variation patterns across different land cover types. This means that the VCI and VHI decreased from 2001 to 2018, indicating an overall drying trend. The sharpest trend occurs in the case of unvegetated Lands. Since PCI is a precipitation-based index, when the precipitation increases, the slope of PCI is positive, indicating a wetting situation. Broadleaf croplands and deciduous broadleaf forests, which together account for a large proportion of the GCM, have high water-holding capacity. Figure 7c shows that the slope values for these types is positive, indicating a wetting situation.

5. Discussion

Spatiotemporal analyses of DI values showed that approximately 80% of the GCM experienced stable drought conditions without significant changes over the last 18 years. In general, precipitation-based indices (PCI and SDCI) showed similar spatiotemporal patterns, while two vegetation-based indices (VCI and VHI) exhibited similar patterns. The other two indices based on LST revealed vague changing patterns of drought, with pixels indicating significant changes distributed sparsely across the whole study area. This may be because the LST is extremely sensitive to location and land cover type and varies with time. By comparing the annual pattern of change of drought indices with the meteorological factors such as precipitation and temperature, we found that the LST-based indices (TCI and TVDI) were not closely related to either annual average precipitation or temperature. Analysis of the relationship of the land cover type with drought indices as well as their slope showed that grasslands are more easily affected by droughts than are deciduous broadleaf forests. The changing rates of the drought situation of three forests (i.e., evergreen needleleaf forests, deciduous broadleaf forests, and deciduous needleleaf forests) are clearly greater than those of the other land cover types.
As the GCM is a mountainous area, the terrain too may affect the drought situation. We extracted landforms of the GCM based on the terrain information extracted from Shuttle Radar Topography Mission digital elevation model according to [41]. Eight geomorphic units with different combinations of altitude and relief were determined. Relief is the difference between the maximum and minimum altitude in a landform unit. It is usually calculated in square or circular sampling units. These units include the low-altitude plain (LAP), low-altitude hill (LAH), low-relief and low-altitude mountain (LR-LAM), middle-relief and low-altitude mountain (MR-LAM), middle-altitude plain, middle-altitude hill (MAH), low-relief and middle-altitude mountain (LR-MAM), and middle-relief and middle-altitude mountain (MR-MAM) (Figure 8a). Zonal statistics of the six DI maps of 2018, shown in Figure 8, were obtained based on the geomorphic unit map in order to calculate the mean DI values in different units. The relative drought situation was consistent regardless of the index used. Overall, the MR-MAM and MAH have smaller TVDI values and higher values for the other five indices, indicating a mild drought condition; this may be a result of the higher altitude of the MR-MAM and MAH along with the lower temperature and the generally greater precipitation and better forest coverage in these regions. Drier areas generally correspond to the geomorphic units of LAP and LAH, which have low altitude and poorer vegetation coverage compared to high-altitude areas.

6. Conclusions

In this study, six widely used drought indices (PCI, VCI, TCI, VHI, SDCI, and TVDI) were used for monitoring drought in the GCM from the viewpoints of temperature, precipitation, and vegetation condition. Unlike the remote sensing products such as LST, precipitation, and vegetation indices, which provide absolute information, the aforementioned indices are computed for a certain area based on one or more of the remote sensing products, to reflect drought conditions. The spatiotemporal variations of drought were examined using the annual series of these indices from 2001 to 2018. The drought trends may be different for different indices. This indicates that the applicability of different indices differs with the location within the study area itself. Both PCI and SDCI show similar patterns, indicating that the central region of the GCM is getting wetter and the southwestern area is getting drier. VCI and VHI exhibit similar patterns with more drying trends. The correlations between these drought indices and meteorological factors were discussed to reveal that different indices are affected differently by precipitation and temperature variations. This is because these indices focus on different aspects of drought causes and symptoms, namely, precipitation, LST, and vegetation health. A comparison of the time series of the indices with precipitation and temperature showed that some drought indices cannot be explained by meteorological observations probably because of the time lag between meteorological drought and vegetation response. In particular, VHI and SDCI were generally employed for agricultural drought monitoring based on empirical weights. Note that the weights of these indices are adjustable. They may help us gain a better judgment about the drought conditions in different study areas. For this purpose, in situ observations can be employed in the future.
An examination of the slope of changes in drought for the different land cover types showed that the evergreen needleleaf forests in the GCM experienced increasingly severe drought conditions in recent years. Similar patterns with weaker changes were obtained for savannas and deciduous needleleaf forests. VCI and VHI exhibited similar variation patterns across different land cover types. The slopes of VCI and VHI for all land cover types are negative, indicating an overall drying trend. Note that the trend of vegetation-based indices may be affected by the long-term physical changes in vegetation.
The terrain is regarded an important factor for drought conditions. Based on the statistical analysis of drought patterns in different landforms, it was found that although different indices indicate distinct drought conditions, the relative drought situation of different landforms is consistent regardless of the index. This implies that the landform type may be important ancillary information for drought monitoring.
Note that many drought indices and drought-monitoring methods were not considered in this study. From the perspective of drought consequences, soil moisture is a direct indicator for drought and has been adopted in several drought indices. Our future work is to adopt the indices related to soil moisture for a more comprehensive study in order to propose the most appropriate method for monitoring drought in the GCM. Nevertheless, the results of this study so far have preliminarily demonstrated the convenience of using remote sensing product-based indices for drought monitoring in the GCM as well as the differences between these indices. The results are expected to provide guidance for drought monitoring to help understand and monitor the ecosystem conditions and the environment in this region.

Author Contributions

Conceptualization, Y.H. and Z.L.; methodology, Y.H., and Z.L.; software, Z.L.; validation, Z.L., Y.H. and T.H.; formal analysis, Z.L. and Y.H.; investigation, H.N. and H.Y.; resources, Z.L., Y.H. and S.Z.; data curation, Z.L., H.N. and H.Y.; writing—original draft preparation, Y.H. and Z.L.; writing—review and editing, Y.H., Z.L., C.H. and Y.Z.; visualization, Y.H. and Z.L.; supervision, Y.H., C.H. and Y.Z.; project administration, Y.H. and C.H.; funding acquisition, Y.H. All authors have read and agreed to the published version of the manuscript.

Funding

This research was supported by the Fundamental Research Funds for the Central Universities (2412018ZD012); National Natural Science Foundation of China (41301364; 41630749).

Acknowledgments

The authors are grateful to three anonymous reviewers for their helpful comments. We also want to thank Y. Wang, H. Du, S. Liu and Z. Liu for the constructive suggestions.

Conflicts of Interest

The authors declare no conflict of interest.

References

  1. Mishra, A.K.; Singh, V.P. A review of drought concepts. J. Hydrol. 2010, 391, 204–216. [Google Scholar] [CrossRef]
  2. Guo, E.L.; Liu, X.P.; Zhang, J.Q.; Wang, Y.F.; Wang, C.L.; Wang, R.; Li, D.J. Assessing spatiotemporal variation of drought and its impact on maize yield in Northeast China. J. Hydrol. 2017, 553, 231–247. [Google Scholar] [CrossRef]
  3. Wu, J.J.; Zhou, L.; Liu, M.; Zhang, J.; Leng, S.; Diao, C.Y. Establishing and assessing the Integrated Surface Drought Index (ISDI) for agricultural drought monitoring in mid-eastern China. Int. J. Appl. Earth Obs. Geoinf. 2013, 23, 397–410. [Google Scholar] [CrossRef]
  4. Kelley, C.P.; Mohtadi, S.; Cane, M.A.; Seager, R.; Kushnir, Y. Climate change in the Fertile Crescent and implications of the recent Syrian drought. Proc. Natl. Acad. Sci. USA 2015, 112, 3241–3246. [Google Scholar] [CrossRef] [Green Version]
  5. Zhang, J.; Mu, Q.; Huang, J. Assessing the remotely sensed Drought Severity Index for agricultural drought monitoring and impact analysis in North China. Ecol. Indic. 2016, 63, 296–309. [Google Scholar] [CrossRef]
  6. Cong, D.; Zhao, S.; Chen, C.; Duan, Z. Characterization of droughts during 2001–2014 based on remote sensing: A case study of Northeast China. Ecol. Inform. 2017, 39, 56–67. [Google Scholar] [CrossRef]
  7. Liang, L.; Sun, Q.; Luo, X.; Wang, J.H.; Zhang, L.P.; Deng, M.X.; Di, L.P.; Liu, Z.X. Long-term spatial and temporal variations of vegetative drought based on vegetation condition index in China. Ecosphere 2017, 8. [Google Scholar] [CrossRef]
  8. Mirabbasi, R.; Anagnostou, E.N.; Fakheri-Fard, A.; Dinpashoh, Y.; Eslamian, S. Analysis of meteorological drought in northwest Iran using the Joint Deficit Index. J. Hydrol. 2013, 492, 35–48. [Google Scholar] [CrossRef]
  9. Kogan, F.N. Droughts of the Late 1980s in the United States as Derived from NOAA Polar-Orbiting Satellite Data. Bull. Am. Meteorol. Soc. 1995, 76. [Google Scholar] [CrossRef] [Green Version]
  10. Kogan, F.N. Application of Vegetation Index and Brightness Temperature for Drought Detection. Adv. Space Res. 1995, 15, 91–100. [Google Scholar] [CrossRef]
  11. Kogan, F.N. Global Drought Watch from Space. Bull. Am. Meteorol. Soc. 1997, 78. [Google Scholar] [CrossRef]
  12. Liang, L.; Qin, Z.; Zhao, S.; Di, L.; Zhang, C.; Deng, M.; Lin, H.; Zhang, L.; Wang, L.; Liu, Z. Estimating crop chlorophyll content with hyperspectral vegetation indices and the hybrid inversion method. Int. J. Remote Sens. 2016, 37, 2923–2949. [Google Scholar] [CrossRef]
  13. Liang, L.; Di, L.; Zhang, L.; Deng, M.; Qin, Z.; Zhao, S.; Lin, H. Estimation of crop LAI using hyperspectral vegetation indices and a hybrid inversion method. Remote Sens. Environ. 2015, 165, 123–134. [Google Scholar] [CrossRef]
  14. Jiao, W.Z.; Zhang, L.F.; Chang, Q.; Fu, D.J.; Cen, Y.; Tong, Q.X. Evaluating an Enhanced Vegetation Condition Index (VCI) Based on VIUPD for Drought Monitoring in the Continental United States. Remote Sens. 2016, 8, 21. [Google Scholar] [CrossRef] [Green Version]
  15. Wang, K.Y.; Li, T.J.; Wei, J.H. Exploring Drought Conditions in the Three River Headwaters Region from 2002 to 2011 Using Multiple Drought Indices. Water 2019, 11, 20. [Google Scholar] [CrossRef] [Green Version]
  16. Liu, W.; Wang, S.; Zhou, Y.; Wang, L.; Zhu, J.; Wang, F. Lightning-caused forest fire risk rating assessment based on case-based reasoning: a case study in DaXingAn Mountains of China. Nat. Hazards 2016, 81, 347–363. [Google Scholar] [CrossRef]
  17. Li, X.; He, B.B.; Quan, X.W.; Liao, Z.M.; Bai, X.J. Use of the Standardized Precipitation Evapotranspiration Index (SPEI) to Characterize the Drying Trend in Southwest China from 1982–2012. Remote Sens. 2015, 7, 10917–10937. [Google Scholar] [CrossRef] [Green Version]
  18. Kogan, F.; Salazar, L.; Roytman, L. Forecasting crop production using satellite-based vegetation health indices in Kansas, USA. Int. J. Remote Sens. 2012, 33, 2798–2814. [Google Scholar] [CrossRef]
  19. Salazar, L.; Kogan, F.; Roytman, L. Using vegetation health indices and partial least squares method for estimation of corn yield. Int. J. Remote Sens. 2008, 29, 175–189. [Google Scholar] [CrossRef]
  20. Bayarjargal, Y.; Karnieli, A.; Bayasgalan, M.; Khudulmur, S.; Gandush, C.; Tucker, C.J. A comparative study of NOAA-AVHRR derived drought indices using change vector analysis. Remote Sens. Environ. 2006, 105, 9–22. [Google Scholar] [CrossRef]
  21. Unganai, L.S.; Kogan, F.N. Drought monitoring and corn yield estimation in southern Africa from AVHRR data. Remote Sens. Environ. 1998, 63, 219–232. [Google Scholar] [CrossRef]
  22. Kogan, F.N. World droughts in the new millennium from AVHRR-based vegetation health indices. Eos Trans. Am. Geophys. Union 2002, 83, 557, 562–563. [Google Scholar] [CrossRef]
  23. Bokusheva, R.; Kogan, F.; Vitkovskaya, I.; Conradt, S.; Batyrbayeva, M. Satellite-based vegetation health indices as a criteria for insuring against drought-related yield losses. Agric. For. Meteorol. 2016, 220, 200–206. [Google Scholar] [CrossRef] [Green Version]
  24. Zhang, A.Z.; Jia, G.S. Monitoring meteorological drought in semiarid regions using multi-sensor microwave remote sensing data. Remote Sens. Environ. 2013, 134, 12–23. [Google Scholar] [CrossRef]
  25. Rhee, J.; Im, J.; Carbone, G.J. Monitoring agricultural drought for arid and humid regions using multi-sensor remote sensing data. Remote Sens. Environ. 2010, 114, 2875–2887. [Google Scholar] [CrossRef]
  26. Sandholt, I.; Rasmussen, K.; Andersen, J. A simple interpretation of the surface temperature/vegetation index space for assessment of surface moisture status. Remote Sens. Environ. 2002, 79, 213–224. [Google Scholar] [CrossRef]
  27. Han, Y.; Wang, Y.; Zhao, Y. Estimating Soil Moisture Conditions of the Greater Changbai Mountains by Land Surface Temperature and NDVI. IEEE Trans. Geosci. Remote Sens. 2010, 48, 2509–2515. [Google Scholar] [CrossRef]
  28. Baniya, B.; Tang, Q.H.; Xu, X.M.; Haile, G.G.; Chhipi-Shrestha, G. Spatial and Temporal Variation of Drought Based on Satellite Derived Vegetation Condition Index in Nepal from 1982–2015. Sensors 2019, 19. [Google Scholar] [CrossRef] [Green Version]
  29. MOD13A3 MODIS/Terra vegetation Indices Monthly L3 Global 1km SIN Grid V006. Available online: https://lpdaac.usgs.gov/products/mod13a3v006/ (accessed on 14 July 2019).
  30. MYD11C3 MODIS/Aqua Land Surface Temperature/Emissivity Monthly L3 Global 0.05Deg CMG V006. Available online: https://lpdaac.usgs.gov/products/myd11c3v006/ (accessed on 14 July 2019).
  31. MCD12Q1 MODIS/Terra+Aqua Land Cover Type Yearly L3 Global 500m SIN Grid V006. Available online: https://lpdaac.usgs.gov/products/mcd12q1v006/ (accessed on 14 July 2019).
  32. TRMM (TMPA/3B43) Rainfall Estimate L3 1 Month 0.25 Degree x 0.25 Degree V7. Available online: https://pmm.nasa.gov/data-access/downloads/trmm (accessed on 14 July 2019).
  33. Du, L.T.; Tian, Q.J.; Yu, T.; Meng, Q.Y.; Jancso, T.; Udvardy, P.; Huang, Y. A comprehensive drought monitoring method integrating MODIS and TRMM data. Int. J. Appl. Earth Obs. Geoinf. 2013, 23, 245–253. [Google Scholar] [CrossRef]
  34. Zhang, L.F.; Jiao, W.Z.; Zhang, H.M.; Huang, C.P.; Tong, Q.X. Studying drought phenomena in the Continental United States in 2011 and 2012 using various drought indices. Remote Sens. Environ. 2017, 190, 96–106. [Google Scholar] [CrossRef]
  35. Huang, F.; Xu, S.L. Spatio-Temporal Variations of Rain-Use Efficiency in the West of Songliao Plain, China. Sustainability 2016, 8. [Google Scholar] [CrossRef] [Green Version]
  36. Le Page, M.; Zribi, M. Analysis and Predictability of Drought In Northwest Africa Using Optical and Microwave Satellite Remote Sensing Products. Sci. Rep. 2019, 9, 1466. [Google Scholar] [CrossRef] [PubMed] [Green Version]
  37. Karnieli, A.; Agam, N.; Pinker, R.T.; Anderson, M.; Imhoff, M.L.; Gutman, G.G.; Panov, N.; Goldberg, A. Use of NDVI and Land Surface Temperature for Drought Assessment: Merits and Limitations. J. Clim. 2010, 23, 618–633. [Google Scholar] [CrossRef]
  38. Karnieli, A.; Bayasgalan, M.; Bayarjargal, Y.; Agam, N.; Khudulmur, S.; Tucker, C.J. Comments on the use of the Vegetation Health Index over Mongolia. Int. J. Remote Sens. 2006, 27, 2017–2024. [Google Scholar] [CrossRef]
  39. Garcia, M.; Fernández, N.; Villagarcía, L.; Domingo, F.; Puigdefábregas, J.; Sandholt, I. Accuracy of the Temperature–Vegetation Dryness Index using MODIS under water-limited vs. energy-limited evapotranspiration conditions. Remote Sens. Environ. 2014, 149, 100–117. [Google Scholar] [CrossRef]
  40. Zribi, M.; Dridi, G.; Amri, R.; Lili-Chabaane, Z. Analysis of the Effects of Drought on Vegetation Cover in a Mediterranean Region through the Use of SPOT-VGT and TERRA-MODIS Long Time Series. Remote Sens. 2016, 8. [Google Scholar] [CrossRef] [Green Version]
  41. Long, E.; Cheng, W.-M.; Zhou, C.-H.; Yao, Y.-H.; Liu, H.-J. Extraction of landform information in Changbai Mountains based on Srtm-DEM and TM data. In In Proceedings of the 2007 IEEE International Geoscience and Remote Sensing Symposium, IGARSS, Barcelona, Spain, 23–28 July 2007. [Google Scholar]
Figure 1. Location map of the Greater Changbai Mountains (GCM).
Remotesensing 12 00530 g001
Figure 2. Simplified land surface temperature (LST)- normalized difference vegetation index (NDVI) triangle (Adopted from [27]).
Remotesensing 12 00530 g002
Figure 3. Six drought indices averaged over 18 years for the Greater Changbai Mountains (GCM). (a) Precipitation condition index (PCI), (b) temperature condition index (TCI), (c) vegetation condition index (VCI), (d) vegetation health index (VHI), (e) scaled drought condition index (SDCI), and (f) temperature–vegetation dryness index (TVDI).
Remotesensing 12 00530 g003
Figure 4. Slopes of drought indices during 2001–2018. (a) PCI, (b) TCI, (c) VCI, (d) VHI, (e) SDCI, and (f) TVDI.
Remotesensing 12 00530 g004
Figure 5. Relationship between annual drought indices and precipitation in the GCM. (an) are the 14 prefecture-level cities. (a) Anshan; (b) Baishan; (c) Benxi; (d) Dandong; (e) Fushun; (f) Jilin; (g) Jixi; (h) Liaoyang; (i) Liaoyuan; (j) Mudanjiang; (k) Qitaihe; (l) Shuangyashan; (m) Tonghua; (n) Yanji.
Remotesensing 12 00530 g005
Figure 6. Relationship between annual drought indices and temperature in the GCM. (an) are the 14 prefecture-level cities. (a) Anshan; (b) Baishan; (c) Benxi; (d) Dandong; (e) Fushun; (f) Jilin; (g) Jixi; (h) Liaoyang; (i) Liaoyuan; (j) Mudanjiang; (k) Qitaihe; (l) Shuangyashan; (m) Tonghua; (n) Yanji.
Remotesensing 12 00530 g006
Figure 7. Drought indices and their changing slopes for different land cover types: (a) Drought indices in 2018; (b) drought indices in 2001; and (c) slopes (×100) of drought indices from 2001 to 2018.
Remotesensing 12 00530 g007
Figure 8. (a) Landforms of the GCM; (bg) Mean values of drought indices in different geomorphic units (b: PCI; c: TCI; d: VCI; e: VHI; f: SDCI; and g: TVDI).
Remotesensing 12 00530 g008
Table 1. Satellite remote sensing products used in this study
Satellite MissionProductData TypeSpatial Resolution (m)Temporal ResolutionSource
MODISMOD13A3.006NDVI1,000monthly[29]
MYD11C3.006LST500monthly[30]
MCD12Q1.006Land cover500yearly[31]
TMPATRMM 3B43Precipitation~25,000monthly[32]
Table 2. Single-factor drought indices*.
Drought IndexData SourceFormulaReference
PCITRMM PCI = T R M M i T R M M m i n T R M M m a x T R M M m i n [33]
TCIMODIS TCI = L S T m a x L S T i L S T m a x L S T m i n [10]
VCIMODIS VCI = N D V I i N D V I m i n N D V I m a x N D V I m i n [9]
* The minimum and maximum values in these formulas were selected for the whole 2001–2018 period over the whole study area
Table 3. Drought indices based on a combination of factors.
Drought IndexFormulaWeightsWeight Determination MethodReference
VHI VHI = α TCI + β VCI α = 0.5, β = 0.5Empirical weights[11]
SDCI SDCI = α TCI + β VCI + γ PCI α = 0.25, β = 0.25, γ = 0.5Empirical weights[25]
Table 4. Classification scheme of the drought indices employed in this study [34].
Name of ClassPCITCIVCISDCIVHITVDI
Extreme drought0–0.10–0.10–0.10–0.20–0.1
Severe drought0.1–0.20.1–0.20.1–0.20.2–0.30.1–0.20.8–1
Moderate drought0.2–0.30.2–0.30.2–0.30.3–0.40.2–0.30.6–0.8
Mild drought0.3–0.40.3–0.40.3–0.40.4–0.50.3–0.40.4–0.6
Abnormal drought0.4–0.50.4–0.50.4–0.5
No drought0.5–10.5–10.5–10.5–10.4–10–0.4

