Article

Oil Spill Discrimination by Using General Compact Polarimetric SAR Features

1
School of Computer and Communication Engineering, University of Science and Technology Beijing, Beijing 100083, China
2
Department of Electronic Engineering, Tsinghua University, Beijing 100084, China
3
National Key Lab of Microwave Imaging Technology, Institute of Electronics, Chinese Academy of Sciences, Beijing 100190, China
4
Shanghai Institute of Satellite Engineering, Shanghai 200240, China
*
Author to whom correspondence should be addressed.
Remote Sens. 2020, 12(3), 479; https://doi.org/10.3390/rs12030479
Submission received: 31 December 2019 / Revised: 24 January 2020 / Accepted: 27 January 2020 / Published: 3 February 2020
(This article belongs to the Special Issue Remote Sensing of the Oceans: Blue Economy and Marine Pollution)

Abstract

:
Ocean surveillance is one of the important applications of synthetic aperture radar (SAR). Polarimetric SAR provides multi-channel information and shows great potential for monitoring ocean dynamic environments. Oil spills are a form of pollution that can seriously affect the marine ecosystem. Dual-polarimetric SAR systems are usually used for routine ocean surface monitoring. The hybrid dual-pol SAR imaging mode, known as compact polarimetry, can provide more information than the conventional dual-pol imaging modes. However, backscatter measurements of the hybrid dual-pol mode depend on the transmit wave polarization, which results in lacking consistent interpretation for various compact polarimetric (CP) images. In this study, we will explore the capability of different CP modes for oil spill detection and discrimination. Firstly, we introduce the general CP formalism method to formulate an arbitrary CP backscattered wave, such that the target scattering vector is characterized in the same framework for all CP modes. Then, a recently proposed CP decomposition method is investigated to reveal the backscattering properties of oil spills and their look-alikes. Both intensity and polarimetric features are studied to analyze the optimal CP mode for oil spill observation. Spaceborne polarimetric SAR data sets collected over natural oil slicks and experimental biogenic slicks are used to demonstrate the capability of the general CP mode for ocean surface surveillance.

Graphical Abstract

1. Introduction

Marine oil spills have been of tremendous concern due to the adverse impact on ocean economic and ecological systems. It results in serious effects on coastal fisheries, sea creatures, seabirds, and eco-environment regeneration. Oil spills are, regrettably, common around the world; e.g., the 2010 Deepwater Horizon oil spill in the Gulf of Mexico, oil leakage from the Penglai 19-3 oil rig platform in 2011 in Bohai Bay, and the Rena oil spill that occurred off a coast in New Zealand in 2011. The rapid increase in oil spill pollution is primarily due to increased ocean activities by humans. The spatial distribution of the spills showed that the most frequent occurrence of oil spills takes place along the main tanker routes, near offshore oil platform positions, as well as in the large ports. Optical and microwave remote sensing techniques are mostly used to monitor marine oil spills, with microwave sensing having significant capability for observing ocean ecosystems [1,2].
Synthetic aperture radar (SAR) has all-day and all-weather imaging capabilities, where the satellite systems can provide periodical observations of high-risk areas. Polarimetric SAR (PolSAR) offers multi-channel polarimetric information, and the fully or quad-polarimetric (quad-pol) SAR system allows the complete backscattering characterization. It has been widely demonstrated that polarimetric information greatly improves the performance of SAR systems [3]. The quad-pol system, alternatively transmitting two orthogonal polarizations and receiving in both polarizations simultaneously, has many advantages but suffers from system complexity, data volume, and limited imaging swath compared to the SAR systems, which transmit only a single polarization. The dual-pol system is a compromise for the trade-off between imaging spatial coverages and observation dimensionality. The hybrid dual-pol or the named compact polarimetric (CP) SAR refers to a unique polarization in transmission and coherent orthogonal polarizations in reception. At present, the Indian RISAT-1 (2012), Japan JAXA (Japan Aerospace Exploration Agency) ALOS/PALSAR-2 (2014), Argentine SAOCOM-1A (2018), and the Canadian RADARSAT Constellation Mission (RCM, 2019) have CP imaging modes. In the future, CP modes have also been planned for SAOCOM-1B.
The techniques of processing CP images are categorized into two groups. One is to reconstruct the pseudo quad-pol data from compact polarimetry [4,5,6,7,8,9,10], and then quad-pol methods can be applied to the reconstructed data for various applications. The other is to extract target scattering parameters directly from the backscattered waves [11,12,13,14,15,16]. In this study, we focus on the detection of oil spills by using polarimetric features measured by CP modes. Radar backscatter is sensitive to the ocean capillary–gravity waves [17,18,19]. Under low to moderate sea conditions with intermediate radar incidence angles ranging from 20° to 60°, the scattering mechanism of the sea surface is often predominated by Bragg resonant scattering [3,20]. Any process that affects the ocean surface roughness can be imaged with SAR. Oil slicks not only damp the ocean capillary and gravity waves, but also reduce the surface tension and friction between the wind and liquid surface [21]. Therefore, oil slicks have a low backscattering signature [17,18,19,22]; i.e., oil slicks appear as distinguishable dark patches compared to the ambient areas. However, low backscatter features could also be created by other ocean phenomena, known as look-alikes, such as biogenic films, low wind regions, rain affects, sea ice, and upwellings, etc. It is crucial to distinguish between oil slicks and their look-alikes, because false alarms could initiate the costly manual activities and more seriously delay the cleaning activities of the spills. The fully polarimetric features, such as the polarimetric signature and pedestal height [23], the Mueller matrix-based filter [24,25,26], and the co-polarized phase difference (CPD) [27], have been investigated for oil spill observation and discrimination. In compact polarimetry, the performance of the degree of polarization ( m ) were studied for both oil spill and ship detections under several typical dual-pol modes [16], but analysis related to oil look-alikes was not included. CP feature extraction methods mainly have the m δ decomposition [11,13], the m χ decomposition [12], and the m α s decomposition [14]. These methods were proposed based on the circular CP mode, not applicable to other CP modes without any modification. In [10], we extended the m α s decomposition to the linear π/4 mode.
In fact, there are numerous possibilities of transmit wave ellipses on the polarization plane, and thus theoretically we have numerous hybrid dual-pol imaging modes. However, the hybrid dual-pol features were only studied under the conventional HH/VH and HV/VV polarizations, as well as the circular and linear π/4 CP modes. In the open literature, there are no studies that investigate the general CP mode for ocean target characterization. In [28], we demonstrated that scattering characterization under compact polarimetry should be described in the same framework for the purpose that unified algorithms applicable for all CP modes can be developed. A formalism method was first proposed for the CP backscattered vector, and then a polarization ratio-based target decomposition method was developed to represent the scattering mechanism and the scattering randomness of targets for an arbitrary hybrid dual-pol mode [28]. In this paper, the performances of the general CP features for oil spill detection and discrimination are analyzed and the optimal CP mode for ocean environment monitoring is studied. The organization is given as follows. In Section 2, the formalism of the general CP descriptors and the CP decomposition method are introduced. In Section 3, data sets of RADARSAT-2, SIR-C/X-SAR, and ALOS/PALSAR-1 are analyzed to show the ability of different CP modes to distinguish between oil spills and biogenic look-alikes. Finally, conclusions are given in Section 4.

2. The General Compact Polarimetric Features

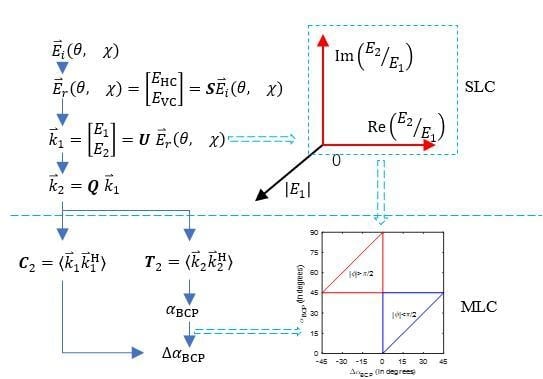
2.1. Formalism of the General CP Descriptors

For an arbitrary transmitting electromagnetic (EM) wave, the CP measurements are a function of both the target and the transmit wave polarization. The backscattered wave is represented by a Jones vector [29], which is a 2-dimensional complex vector. It can be formulated by an absolute coefficient and a complex channel ratio, which represents the vector nature (or the polarimetric property) of the backscattered wave to characterize target scattering mechanisms. Suppose the transmit transverse EM wave is
E i ( θ , χ ) = [ a b ] = [ cos θ sin θ sin θ cos θ ] [ cos χ j sin χ ] = [ cos θ cos χ j sin θ sin χ sin θ cos χ + j cos θ sin χ ]
where θ and χ are the ellipse orientation and ellipticity angles, and a and b are the complex transmitting wave elements with | a | 2 + | b | 2 = 1 . For a given target S , the received CP (or hybrid dual-pol) signal is totally dependent on a and b (or θ and χ ), as follows:
E r ( θ , χ ) = S E i ( θ , χ ) = [ S HH S HV S VH S VV ] [ a b ] = [ a S HH + b S HV b S VV + a S VH ] .
This formula is represented in the linear H/V polarization basis. It should note that the CP measurements are independent of the receiving polarization coordinates. Equation (2) shows that the complex vector direction of the scattering wave is highly affected by the transmit wave E i = [ a b ] T . When a = 0 or b = 0 , E r corresponds to the conventional HV/VV or HH/VH dual-pol case. We only consider the general CP mode. When a 0 as well as b 0 , the backscattered wave E r can be projected to another space by a scaling transformation as
k 1 = [ E 1 E 2 ] = [ a 1 0 0 b 1 ] E r ( θ , χ ) = [ S HH + b a S HV S VV + a b S VH ] ,
where k 1 is the formalized CP vector, which is the sum of the co-polarized and cross-polarized components. Compared to E r , in which both the co-polarized and cross-polarized terms are affected by the transmitting wave’s polarization, k 1 has a fixed term [ S HH S VV ] T to characterize the scattering properties of a target under all CP modes. Another vector can thus be obtained from (3) by a unitary transform:
k 2 = 1 2 [ 1 1 1 1 ] [ E 1 E 2 ] = 1 2 [ E 1 + E 2 E 1 E 2 ] .
Then, the second-order products, named as the formalized CP covariance and coherency matrices, are accordingly obtained to describe the stochastic backscattering process.
C 2 = k 1 k 1 H = [ | E 1 | 2 E 1 E 2 * E 2 E 1 * | E 2 | 2 ]
T 2 = k 2 k 2 H = [ | E 1 + E 2 | 2 2 ( E 1 + E 2 ) ( E 1 E 2 ) * 2 ( E 1 E 2 ) ( E 1 + E 2 ) * 2 | E 1 E 2 | 2 2 ]
where H denotes the matrix conjugate transpose and · denotes the ensemble average. In [28], we discussed the sensitivity of different CP modes to the target geometrical parameters. It showed that for the surface and trihedral scatterers, the polarization ratios of the formalized vector are always distributed around (1, 0) (see Figure 1a,b in [28]). The difference between the two vectors, i.e., E r and k 1 , is schematically shown in Figure 1. For backscatter from natural areas, the cross-pol term is relatively small as compared to the co-pol terms. Suppose the term Δ is negligible for both vectors. When ( a , b ) varies, the direction of E r , determined by both [ S HH S VV ] T and ( a , b ) , can be dramatically affected by the transmitting wave’s phase δ ( δ = a n g l e ( b / a ) ). The direction of k 1 is only determined by [ S HH S VV ] T . In the real scattering case, the end point of k 1 varies around [ S HH S VV ] T , which is taken as a reference point to characterize the scattering mechanism in the formalized vector. We use real measurements for intuitive illustration. Scattering matrices from the ocean surface and oil slicks are as follows:
S sea = e j φ 1 [ 0.1555 0.0064 0.0051 i 0.0064 0.0051 i 0.1571 0.0500 i ] S oil slick = e j φ 2 [ 0.025 0.0031 0.0063 i 0.0031 0.0063 i 0.0595 0.0114 i ] ,
which are randomly selected from the test data used in the experiments. Figure 2 shows variation in the polarization ratios of E r and k 1 with the varying CP modes ( θ = π / 4 , χ [ π / 4 π / 4 ] ) for the scattering types in (7). It shows that with the formalized scattering vector, the effect of the transmitted polarization on the backscattered wave is greatly reduced, especially for the ocean surface. To distinguish between oil slicks and the sea surface in different CP modes, multiple thresholds or a nonlinear curve are needed when E r is used to represent the target features, while only one threshold is needed when k 1 is used. Polarimetric properties of targets can be explained consistently for all CP modes with k 1 , which facilitate developing unified explanation algorithms for target characterization.

2.2. Polarization Ratio-Based Decomposition for the General CP Images

By using the CP descriptors presented in (3)–(6), we proposed a polarization ratio-based decomposition method [28]. Polarization ratio is a fundamental parameter in revealing target scattering mechanisms. This idea was also employed for the Δ α B / α B method [30,31] in fully polarimetric imagery. The fully polarimetric and the general CP Δ α B / α B methods are mathematically equal, but there is difference in the physical interpretations. From matrix T 2 , we can define parameter α BCP as
α BCP = atan ( | E 1 E 2 | 2 | E 1 + E 2 | 2 )
where α BCP [ 0 ° 90 ° ] is used to describe the average scattering mechanism. For deterministic scatterers without obvious rotation, the cross-polarized term S HV is usually small compared with the co-polarized terms. Then, by (3) and (8) it is easily known that when the transmitted wave is balanced in the channel amplitudes, i.e., | a | | b | (equivalent to θ ± π / 4 or χ ± π / 4 ), for surface scattering dominated areas, α BCP is close to 0 ° ; for double-bounce scattering dominated areas, α BCP is close to 90 ° ; and for random volume scattering, α BCP is close to 45 ° . When the wave channel amplitudes are imbalanced, i.e., | a | | b | or | a | | b | , the cross-polarized term will gradually play a leading role in determining the scattering mechanism with the imbalance increasing.
For the single-look data, α BCP is equivalent to E 2 / E 1 . For the multi-look data, α BCP is a function of the multi-look polarization ratio ρ CP and the channel correlation coefficient | r CP | [28]. We defined another parameter to measure the effect of | r CP | on α BCP , as follows:
Δ α BCP = α BCP α 0 CP
where
α 0 CP = atan ( | 1 ρ CP | 2 | 1 + ρ CP | 2 ) and ρ CP = | E 2 | 2 | E 1 | 2 e j angle ( E 2 E 1 * ) .
α 0 CP is only determined by the averaged polarization ratio ρ CP . We use the distance between α BCP and α 0 CP to measure the scattering randomness. For all CP modes, Δ α BCP was distributed in the interval [ 45 ° 45 ° ] and a larger | Δ α BCP | indicates a more random scattering process. The properties of α BCP and Δ α BCP has been discussed in [28]. A diagram can be constructed as shown in Figure 3. The pixel distribution depends on the polarization phase difference, i.e., ϕ = angle ( E 2 E 1 * ) .

3. Experiments

3.1. Test Data Sets

To analyze the performances of various CP modes for oil spill detection and discrimination, data acquired by C-band RADARSAT-2, C-band SIR-C/X-SAR, as well as L-band ALOS/PALSAR-1 over oil slicks and biogenic slicks were used. The biogenic slicks were simulated using Oleyl Alcohol (OLA) by controlled experiments [26]. Data sets are specified in Table 1, in which the oil spills originated from oil platforms, such as the Penglai 19-3 oil slicks, as well as tanker accidents, such as the ALOS/PALSAR-1 data [25]. Figure 4 shows the Pauli-basis images. Before carrying out the analysis, polarimetric images were filtered by a sliding window for speckle reduction. Pixel spacing was in general taken into account for selection of the window size. However, it was found that when analyzing the scattering mechanisms, the filter window size does not affect the results too much if it varies within a small range, at least for the test data in this study. Thus, an appropriate and applicable window size of 5 was set for the experiments.

3.2. Oil Spill Detection

Radar signatures of natural slicks and oil spills are interpreted as dark patches in SAR images. The characteristic dark feature is a primary indicator for detection and mapping of potential oil spills. For various CP modes, the total backscattered energy varies with the transmit wave. The damping ratio has been widely used in SAR images for identification of surface slicks, including oil spills. For the hybrid dual-pol backscatter, we used the total intensity to define the contrast between the ocean surface and surface slicks as follows:
r r a t i o = T r ( C 2 ) s l i c k f r e e T r ( C 2 ) o b s e r v e d   a r e a
where T r ( · ) is the trace of a matrix. In damping ratio images, sea surface slicks will appear as bright spots against the dark background of water. We used SIR-C/X-SAR data with p.n. 49939 and 41370 for illustration. The damping ratio under the left circular mode in Figure 5a,b, i.e., ( θ , χ ) = ( [ π / 2 π / 2 ] , π / 4 ) , shows that the signature of the surface slicks is evident in the CP images. We used the areas outlined in Figure 5a,b to show the variations of the damping ratio with the transmitted wave polarizations, given in Figure 5c,d. The damping ratio in full polarimetry is also given, calculated based on the total backscattered energy, which was 2.63 ± 0.62 for the oil slicks and 2.59 ± 0.67 for OLA. It shows that when the transmitted wave approaches the conventional dual-pol modes, the contrast between the oil slicks and ocean surface is very small, which is not favorable to predict the surface slicks because it can generate missed detections. When the transmitting wave’s polarization deviates from the H and V polarizations, the damping ratio increases and reaches its maximum at θ = ± π / 4 . Comparison of Figure 5c,d shows that the damping ratio is greatly affected by the ellipse orientation angle and that it varies only a little with the ellipticity angle. When the transmitting wave’s channel amplitude is balanced, i.e., θ = ± π / 4 or χ = ± π / 4 , the oil slick always has a larger contrast with the ambient water than the OLA slick. Damping ratios of oil slicks and OLA at the linear π / 4 and the left circular modes are almost the same. When χ varies, the maximum difference between the damping ratios of oil slicks and OLA takes place at ( θ , χ ) = ( π / 4 , π / 8 ) . However, the overall difference is not significant.
The above analysis shows that low backscattered features are still visible in CP imagery. When the transmitted wave is balanced in the channel amplitude, i.e., | a | = | b | , the slicks that cause a dampening of the surface waves have a maximum contrast with the background surface. After the dark patches are detected, further analysis is needed to refine the results such that the possibility of false oil spill detection can be reduced. Next, the general CP features were analyzed to distinguish between oil slicks and OLA. α BCP describes the physical scattering mechanism of targets in compact polarimetry, and Δ α BCP relates to the scattering randomness. The left circular mode is used as an example. The general CP features for the test data sets are shown in Figure 6, where the Δ α BCP / α BCP scatter diagram is also given by using pixels of the outlined areas. The areas are only depicted in the α BCP images for simplicity. It is observed that parameters Δ α BCP and α BCP can distinguish oil slicks from the background ocean surface for data of all the three sensors. The ocean surface always has small α BCP and Δ α BCP values, and oil slicks have relatively larger α BCP and | Δ α BCP | values. The oil slick images in Figure 6 indicate that in CP imagery, oil slicks and ocean surface can be discriminated by polarimetric features. We also observe that OLA and the ocean surface have very similar Δ α BCP and α BCP values. These two scattering types could not be separated in the Δ α BCP / α BCP diagram. The two-pixel groups overlap each other, indicating that OLA and the ocean surface have similar backscattering mechanisms in the circular CP mode.
In [15], under the circular CP mode, we proposed a parameter ρ CTLR (see (10) in [15]), which is a special case for α BCP . It was shown that the performance of α BCP in the circular mode is quite similar to that of α B in the full-pol mode (see Figure 5a in [15]) for ocean surface characterization. For the test data sets in this study, experimental results show that the Δ α BCP / α BCP scatter plots in the circular CP modes have a good overall agreement with the FP Δ α B / α B distributions.
We further consider an arbitrary CP mode in the formalized vector to evaluate the effects of the transmitted wave’s ellipticity and orientation angles on the surface slick representation. The data sets demonstrated in Figure 5 are used to keep the experimental analysis consistent. Averaged FP α B and Δ α B values of the outlined ocean surface, oil slick, and OLA areas in Figure 5, and their corresponding standard deviations, are given in Table 2. Variations of the CP α BCP and Δ α BCP values with the varying transmitted wave polarizations are shown in Figure 7. Table 2 shows the ocean surface and oil slicks have large differences in α B and Δ α B . The averaged differences in both parameters for the two scatterers are about 15°. In contrast, the two parameters do not exhibit significant differences for ocean surface and OLA slicks. It is observed from Figure 7 that when the transmitted wave’s amplitude is balanced in H and V polarization channels, variation trends of oil slicks, ocean surface, and OLA are very similar. When the transmitted wave is more circularly polarized, the difference between the oil slicks and ocean surface becomes larger with α BCP . In the linear π / 4 mode, the difference in α BCP values is 6.5°, while in the circular mode, the difference increases to 15°. However, standard deviations of Δ α BCP for oil slicks also increases with the increased polarization circularity. For all CP modes with the balanced channel amplitudes, the scattering mechanisms of ocean surface and OLA have little differences, with 1° on average in α BCP and 1° on average in Δ α BCP . For the linearly polarized transmitted waves, the difference between the oil slicks and the ocean surface achieves its maximum when the wave orientation angle is at ± 45 ° , indicating that when the transmit wave is with | a | = | b | (equivalent to χ = ± π / 4 or θ = ± π / 4 ), oil slicks could be better detected from the ocean background. Differences between ocean surface and OLA slicks are very small with the varying wave orientation angles, indicating that ocean surface and OLA have a similar scattering mechanism. Figure 7 also shows that the scattering mechanisms of targets are greatly affected by transmitting wave orientations and less sensitive to wave ellipticity angles. When the wave orientation angle varies, a maximum change of 35° can be found in α BCP and 15° in Δ α BCP for ocean surface. While the maximum changes within both parameters for ocean surface are 5° with the varying ellipticity angles.
In Table 2 and Figure 7, target scattering mechanisms in polarimetric modes are analyzed based on 2 representative data sets. To further validate the performances of the CP parameters for surface slick characterization, results of the other six data sets in Table 1 are also given. Table 3 shows the averaged FP α B and Δ α B values for the ocean surface, oil-slick, and OLA areas outlined in Figure 6. Variations of the CP parameters with the varying transmit polarizations for these areas are shown in Figure 8. From Table 3 and Figure 8, similar analysis results can be observed as those from Table 2 and Figure 7, verifying that the CP Δ α BCP and α BCP is effective in differentiating target scattering mechanisms, and CP modes with balanced transmit channel amplitudes are better for detection of oil spills.
Finally, an example carried out in the circular and linear π / 4 CP modes is given for an intuitive visualization of the oil spill detection results. Both the characteristic low backscattered feature and polarimetric features are utilized. The experiment follows steps as follows. First, the damping ratio is used to detect surface slicks, where the Parzen window with a Gaussian Kernel is employed to model the ocean clutter. Low backscattered features are detected based on a given false alarm rate, which is set to p f a = 0.5 % in this example. Then, the α BCP and Δ α BCP parameters are used to discriminate between oil slicks and OLA. We simply use the Euclidean distance to measure the dissimilarity of a detected slick and ocean surface. According to Table 2 and Table 3 and Figure 7 and Figure 8, we set the threshold as 5°, which is the median value of the distances between oil slicks and ocean surface and the distances between OLA and ocean surface. Detection results are shown in Figure 9. The detected oil spills are shown in yellow and the detected low backscatter features are shown in green. Figure 9 shows that in compact polarimetry, oil slicks and OLA can be distinguished from the ocean surface by combining polarimetric features and the backscattered intensity. Detection results of the circular and linear π/4 CP modes are quite similar, but comparatively the circular CP mode can detect more areas of oil spills. Both modes can discriminate oil slicks from OLA.

4. Conclusions

Oil spill detection is a very important step for ocean environment managing. In this paper, the general compact polarimetric (CP) mode, which refers to a coherent dual-pol system with an arbitrary transmitted elliptical polarized wave, was first analyzed to observe oil spills and biogenic slicks. A previously proposed formalism method is employed to describe the general CP measurement. We showed that the formalized vector is better in characterizing target scattering mechanism for ocean surface with and without slicks as compared with the original scattering vector. Both the backscattered intensity, which is favorable in detection of surface slicks due to their characteristic dark signatures in SAR images, and polarimetric parameters, which can discriminate between scattering mechanisms, are analyzed. Polarimetric SAR data from C-band SIR-C/X-SAR and RADARSAT-2, as well as L-band ALOS/PALSAR-1 were used in experiments. Results demonstrated the effectiveness of the general CP parameters, i.e., α BCP and Δ α BCP , for oil spill detection. Analysis of these two parameters showed that the scattering mechanism of the ocean surface is very similar to that of the OLA slicks but different from that of oil spills. The CP modes for which the transmit wave amplitude is balanced in the H and V coordinates, i.e., θ = ± π / 4 or χ = ± π / 4 , enable better detection performances. Compared to the linear π / 4 mode, the circular mode is better in preserving the integrity of the detected oil spill areas.

Author Contributions

Conceptualization and methodology, J.Y.; validation, J.Y.; investigation, L.Z. and L.X. All authors have read and agreed to the published version of the manuscript.

Funding

This work was funded in part by NSFC under Grant 61771043, NSFC under Grant 61490693, the National Key R&D Program of China under Grant 2017YFB0502703, the Fundamental Research Funds for the Central Universities under Grant FRF-IDRY-19-008 and FRF-TP-18-013A2, the USTB-NTUT Joint Research Program under Grant TW2019010, and the foundation SAST2018-037 of CASC.

Conflicts of Interest

The authors declare no conflict of interest.

References

  1. Sandven, S.; Hamre, T.; Babiker, M.; Kloster, K.; Hansen, M.; Wåhlin, J.; Kudryavtsev, V.; Myasoedov, A.G.; Alexandrov, V.; Melentyev, V.V.; et al. MONRUK SAR Data Analysis Report; NERSC Technical Report no. 310; Nansen Environmental and Remote Sensing Center: Bergen, Norway, 2005–2007.
  2. Alpers, W.; Espedal, H.A. Chapter 11 oils and surfactants. In Synthetic Aperture Radar Marine User’s Manual; NOAA: Washington, DC, USA, 2004; pp. 263–277. [Google Scholar]
  3. Crisp, D.J. The State-Of-The-Art In Ship Detection In Synthetic Aperture Radar Imagery; Defence Science and Technology Organization (DSTO), Information Sciences Laboratory: Edinburgh, SA, Australia, 2004. [Google Scholar]
  4. Souyris, J.C.; Imbo, P.; Fjørtoft, R.; Mingot, S.; Lee, J.-S. Compact polarimetry based on symmetry properties of geophysical media: the π/4 mode. IEEE Trans. Geosci. Remote Sens. 2005, 43, 634–646. [Google Scholar] [CrossRef]
  5. Nord, M.; Ainsworth, T.; Lee, J.-S.; Stacy, N. Comparison of compact polarimetric synthetic aperture radar modes. IEEE Trans. Geosci. Remote Sens. 2009, 47, 174–188. [Google Scholar] [CrossRef]
  6. Collins, M.; Denbina, M.; Atteia, G. On the reconstruction of quad-pol SAR data from compact polarimetry data for ocean target detection. IEEE Trans. Geosci. Remote Sens. 2013, 51, 591–600. [Google Scholar] [CrossRef]
  7. Li, Y.; Zhang, Y.; Chen, J.; Zhang, H. Improved compact polarimetric SAR quad-pol reconstruction algorithm for oil spill detection. IEEE Geosci. Remote Sens. Lett. 2014, 11, 1139–1142. [Google Scholar] [CrossRef]
  8. Yin, J.; Yang, J. Multi-polarization reconstruction from compact polarimetry based on modified four-component scattering decomposition. J. Syst. Eng. Electron. 2014, 25, 399–410. [Google Scholar] [CrossRef]
  9. Yin, J.; Moon, W.M.; Yang, J. Model-based pseudo-quad-pol reconstruction from compact polarimetry and its application to oil-spill observation. J. Sens. 2015, 2015, 1–8. [Google Scholar] [CrossRef]
  10. Yin, J.; Papathanassiou, K.; Yang, J.; Chen, P. Least-squares estimation for pseudo quad-pol image reconstruction from linear compact polarimetric SAR. IEEE J. Sel. Topics Appl. Earth Observ. Remote Sens. 2019, 12, 3746–3758. [Google Scholar] [CrossRef]
  11. Raney, R.K. Hybrid-polarity SAR architecture. IEEE Trans. Geosci. Remote Sens. 2007, 45, 3397–3404. [Google Scholar] [CrossRef] [Green Version]
  12. Raney, R.K.; Cahil, J.T.S.; Patterson, G.W.; Bussey, D.B.J. The M-Chi decomposition of hybrid dual-polarimetric radar data. In Proceedings of the IEEE International Geoscience and Remote Sensing Symposium, Munich, Germany, 22–27 July 2012; pp. 5093–5096. [Google Scholar]
  13. Charbonneau, F.J.; Brisco, B.; Raney, R.K.; McNairn, H.; Liu, C.; Vachon, P.W.; Shang, J.; DeAbreu, R.; Champagne, C.; Merzouki, A.; et al. Compact polarimetry overview and applications assessment. Can. J. Remote Sens. 2010, 36, S298–S315. [Google Scholar] [CrossRef]
  14. Cloude, S.; Goodenough, D.; Chen, H. Compact decomposition theory. IEEE Geosci. Remote Sens. Lett. 2012, 9, 28–32. [Google Scholar] [CrossRef]
  15. Yin, J.; Yang, J.; Zhou, Z.-S.; Song, J. The extended Bragg scattering model-based method for ship and oil-spill observation using compact polarimetric SAR. IEEE J. Sel. Top. Appl. Earth Obs. Remote Sens. 2015, 8, 3760–3772. [Google Scholar] [CrossRef]
  16. Shirvany, R.; Chabert, M.; Tourneret, J.-Y. Ship and oil-spill detection using the degree of polarization in linear and hybrid/compact dual-pol SAR. IEEE J. Sel. Top. Appl. Earth Observ. Remote Sens. 2012, 5, 885–892. [Google Scholar] [CrossRef] [Green Version]
  17. Pablo, C.-C.; Yan, X.-H. Low-backscatter ocean features in synthetic aperture radar imagery. Johns Hopkins APL Tech. Dig. 2000, 21, 116–121. [Google Scholar]
  18. Gade, M.; Alpers, W.; Hühnerfuss, H.; Wismann, V.R.; Lange, P.A. On the reduction of the radar backscatter by oceanic surface films: scatterometer measurements and their theoretical interpretation. Remote Sens. Environ. 1998, 66, 52–70. [Google Scholar] [CrossRef]
  19. Solberg, A.H.S. Remote Sensing Of Ocean Oil-Spill Pollution; Institute of Electrical and Electronics Engineers: Piscataway, NJ, USA, 2012; Volume 100, pp. 2931–2945. [Google Scholar]
  20. Schuler, D.L.; Lee, J.-S. Mapping ocean surface features using biogenic slick-fields and SAR polarimetric decomposition techniques. IEE Proc. -Radar Sonar Navig. 2006, 153, 260–270. [Google Scholar] [CrossRef]
  21. Nunziata, F.; Sobieski, P.; Migliaccio, M. The two-scale BPM scattering model for sea biogenic slicks contrast. IEEE Trans. Geosci. Remote Sens. 2009, 47, 1949–1956. [Google Scholar] [CrossRef]
  22. Kim, D.-J.; Moon, W.M.; Kim, Y.-S. Application of TerraSAR-X data for emergent oil-spill monitoring. IEEE Trans. Geosci. Remote Sens. 2010, 48, 852–863. [Google Scholar]
  23. Migliaccio, M.; Nunziata, F.; Gambardella, A. Polarimetric signature for oil spill observation. In Proceedings of the 2008 IEEE/OES US/EU-Baltic International Symposium, Tallinn, Estonia, 27–29 May 2008; pp. 1–5. [Google Scholar]
  24. Nunziata, F.; Gambardella, A.; Migliaccio, M. On the Mueller scattering matrix for SAR sea oil slick observation. IEEE Geosci. Remote Sens. Lett. 2008, 5, 691–695. [Google Scholar] [CrossRef]
  25. Migliaccio, M.; Gambardella, A.; Nunziata, F.; Shimada, M.; Isoguchi, O. The PALSAR polarimetric mode for sea oil slick observation. IEEE Trans. Geosci. Remote Sens. 2009, 47, 4032–4131. [Google Scholar] [CrossRef]
  26. Nunziata, F. Single- and Multi-Polarization Electromagnetic Models for SAR Sea Oil Slick Observation. Ph.D. Thesis, Parthenope University of Naples, Naples, Italy, December 2008. [Google Scholar]
  27. Velotto, D.; Migliaccio, M.; Nunziata, F.; Lehner, S. Dual-polarized TerraSAR-X data for oil-spill observation. IEEE Trans. Geosci. Remote Sens. 2011, 49, 4751–4762. [Google Scholar] [CrossRef]
  28. Yin, J.; Papathanassiou, K.; Yang, J. Formalism of compact polarimetric descriptors and extension of the ∆αB/αB method for general compact-pol SAR. IEEE Trans. Geosci. Remote Sens. 2019, 57, 10322–10335. [Google Scholar] [CrossRef]
  29. Lee, J.-S.; Pottier, E. Polarimetric Radar Imaging from Basics to Applications; CRC Press: Boca Raton, FL, USA, 2009; pp. 31–98. [Google Scholar]
  30. Yin, J.; Moon, W.M.; Yang, J. Novel model-based method for identification of scattering mechanisms in polarimetric SAR data. IEEE Trans. Geosci. Remote Sens. 2016, 54, 520–532. [Google Scholar] [CrossRef]
  31. Yin, J.; Yang, J.; Zhang, Q. Assessment of GF-3 polarimetric SAR data for physical scattering mechanism analysis and terrain classification. Sensors 2017, 17, 2785. [Google Scholar] [CrossRef] [PubMed] [Green Version]
Figure 1. Schematic representation of E r and k 1 .
Remotesensing 12 00479 g001
Figure 2. Variation of the polarization ratios of E r and k 1 with the varying compact polarimetric (CP) modes ( θ = π / 4 , χ [ π / 4 , π / 4 ] ) for scatterers from the ocean surface and oil slicks.
Remotesensing 12 00479 g002
Figure 3. The Δ α BCP / α BCP plane. Pixels of all CP modes are distributed in the red and blue rectangles.
Remotesensing 12 00479 g003
Figure 4. Pauli-basis images for oil slicks and Oleyl Alcohol (OLA). (a) ALOS/PALSAR-1 data, ALPSRP031440190; (b) RADARSAT-2 data acquired over the Penglai 19-3 oil field; (ch) are SIR-C/X-SAR data sets with p.n. 17041, 44327, 49939, 41467, 11588, and 41370, respectively.
Remotesensing 12 00479 g004
Figure 5. Damping ratios of oil slicks and OLA for the C-band SIR-C/X-SAR images with p.n. 49939 and p.n. 41370. (a) Damping ratio of oil slicks in the left circular mode; (b) damping ratio of OLA in the left circular mode; (c) variation of the damping ratio with χ changing from π / 4 to π / 4 ; (d) variation of the damping ratio with θ changing from π / 2 + e p s to π / 2 e p s .
Remotesensing 12 00479 g005
Figure 6. CP parameters in the left circular mode and the Δ α BCP / α BCP scatter plots. (ah) used data from ALOS/PALSAR-1 with ALPSRP031440190, RADARSAT-2 (Penglai 19-3 oil field), and the SIR-C data sets with p.n. 17041, 44327, 49939, 41467, 11588, and 41370, respectively.
Remotesensing 12 00479 g006aRemotesensing 12 00479 g006b
Figure 7. Variation of α BCP and Δ α BCP values with varying transmitted wave polarizations for the water surface, oil slick, and OLA areas outlined in Figure 5. (a) SIR-C data with p.n. 49939. (b) SIR-C data with p.n. 41370.
Remotesensing 12 00479 g007
Figure 8. Variation of α BCP and Δ α BCP values with transmitting polarizations for the water surface, oil slick, and OLA areas outlined in Figure 6. (a) ALOS/PALSAR-1 data (ALPSRP031440190); (b) RADARSAT-2 data (Penglai 19-3 oilfield); (c) SIR-C data with p.n. 17041; (d) SIR-C data with p.n. 44327; (e) SIR-C data with p.n. 41467; (f) SIR-C data with p.n. 11588.
Remotesensing 12 00479 g008
Figure 9. An example of an oil spill and the OLA detection results. The pseudo-color composite image is fused by R = Detection of oil slicks, G = Detection of dark features, and B = Span image. (a) The left circular mode; (b) the linear π / 4 mode.
Remotesensing 12 00479 g009
Table 1. Fully polarimetric synthetic aperture radar (SAR) images. The SIR-C/X-SAR data were measured in the C-band and p.n. is the processing number.
SensorLocation or Site IdentificationPixel Spacing (in meters)Incidence Angle (in degrees)Acquisition DateObject
ALOS/PALSAR-1ALPSRP0314401904.5*9.5Center: 25.7°2006-8-27Oil slicks
RADARSAT-2Penglai 19-3 oilfield, Bohai bay4.7*5.536.5°–38.0°2011-8-19Oil slicks
SIR-C/X-SARp.n. 1704112.5*12.535.4°–40.4°1994-4-11Oil slicks
SIR-C/X-SARp.n. 4432712.5*12.544.1°–47.5°1994-10-1Oil slicks
SIR-C/X-SARp.n. 4993912.5*12.547.2°–49.9°1994-10-8Oil slicks
SIR-C/X-SARp.n. 4146712.5*12.525.8°–29.2°1994-10-4OLA
SIR-C/X-SARp.n. 1158812.5*12.519.3°–24.4°1994-4-15OLA
SIR-C/X-SARp.n. 4137012.5*12.526.2°–30.8°1994-10-1OLA
Table 2. α B and Δ α B values (in degrees) of the FP images for the outlined areas in Figure 5.
mean(·) ± std (·)SIR-C Data with p.n. 49939SIR-C Data with p.n. 41370
WaterOil SlicksWaterOLA
α B 17 ± 332 ± 73.7 ± 0.74.5 ± 1
Δ α B 12 ± 327 ± 61.8 ± 0.52.9 ± 1
Table 3. α B and Δ α B values (in degrees) of the other six FP images. Areas outlined in Figure 6 were used for calculation.
Mean (·) ± Std (·)ALPSRP031440190RADARSAT-2SIR-C (17041)SIR-C (44327)SIR-C (41467)SIR-C (11588)
WaterOil slicksWaterOil slicksWaterOil slicksWaterOil slicksWaterOLAWaterOLA
α B 4.3 ± 0.851.8 ± 57.5 ± 1.830.2 ± 68.8 ± 1.844 ± 1018 ± 4.553 ± 7.21.4 ± 0.31.8 ± 0.63 ± 0.54 ± 0.9
Δ α B 3.4 ± 0.735 ± 195.7 ± 1.628.4 ± 65.2 ± 1.528 ± 1712 ± 527 ± 231.1 ± 0.31.6 ± 0.61 ± 0.31.7 ± 0.6

