Abstract
The inner Tibetan Plateau is a glacierized region where glaciers show heterogeneous change. The Xinqingfeng and Malan ice caps are located in this region, and a transition zone exists with shifting influences between the westerlies and Indian summer monsoon. However, there is a lack of detailed information regarding glacier area and mass changes in this region before 2000. In the present study, we describe an integrated view of the glacier area and its mass changes for Mt. Xinqingfeng and Mt. Malan as derived from topographic maps, Landsat, ASTER, SRTM DEM, and TerraSAR-X/TanDEM-X from 1970 to 2012 and from 1970 to 2018, respectively. Our results show that the glaciers experienced a slight shrinkage in area by 0.09 ± 0.03% a−1 from 1970 to 2018 with a median mass loss rate of 0.22 ± 0.17 m w.e. a−1 and 0.29 ± 0.17 m w.e. a−1 between 1999 and 2012 at Mt. Xinqingfeng and Mt. Malan, respectively. The glaciers of Mt. Malan had a total mass loss of 0.19 ± 0.14 m w.e. a−1 during the period 1970–1999. A minimum of seven glaciers at Mt. Xinqingfeng and Mt. Malan showed heterogeneous variations with either surging or advancing during the observation period. Among them, the West Monuomaha Glacier, Monuomaha Glacier, and Zu Glacier were identified as surging glaciers, and the others may also be surging glaciers, although more evidence is required. These glaciers showed a long active period and low velocities. Therefore, we suggested that thermal controls are important for surge initiation and recession.
1. Introduction
Glaciers in the High Mountains Asia (HMA) region are the headwater sources for many rivers and lakes. Thus, HMA is also known as the ‘Asia Water Tower’ [1]. Due to the warming climate, many sub-regions of the HMA, such as the Himalayas, Nyainqentanglha, and Tien Shan have experienced glacier mass loss [2,3,4,5,6]. However, glaciers in Pamir, Karakoram and West Kunlun have, on average, been stable or have shown a mass gain, which was attributed to strengthening westerlies in recent years [4,7,8,9,10,11,12,13]. The very large inner Tibetan Plateau (ITP) region is located in the transition zone of the atmospheric circulation systems of monsoon and westerlies and is dominated more by continental climate conditions, with glaciers at the ITP showing heterogeneous variations. Glaciers in the eastern and southern ITP have shown significant retreating and mass loss, which is similar to that seen at the Himalayas and Nyainqentanglha, and is influenced by the weakening Indian monsoon [2,14]. However, as observed for West Kunlun, glaciers in the western ITP have remained stable or shown a slight mass gain and are influenced by strengthening westerlies [2,14]. According to glacier elevation changes and mass balance in the HMA (2000–2016) reported by Brun et al. [2], glaciers located on the north side of 32°N at the ITP showed a clear east-west direction difference, glaciers on the west side of 90°E showed near stable or slight mass gain, and glaciers on the east side showed significant retreating and mass loss. Four main clusters of glaciers, which include Kangzhag Ri, Purogangri, Xinqingfeng and Malan ice caps (collective known as XM), and Geladandong, are distributed near 90°E. Kangzhag Ri and Purogangri are located on the west side of 90°E, and XM and Geladandong are located on the east side of 90°E. The latitudes of Kangzhag Ri and XM are close to each other, as are the latitudes of Purogangri and Geladandong. Several studies have reported that glaciers at Kangzhag Ri and Purogangri experienced near stable mass (−0.04 ± 0.02 m w.e. a−1) and mass gain (+0.16 ± 0.02 m w.e. a−1) during 1999–2012, respectively [15,16]. However, glaciers at Kangzhag Ri experienced a negative mass balance (−0.34 ± 0.01 m w.e. a−1) during 1970–1999 and glaciers at Geladandong experienced a negative mass balance (–0.21 ± 0.16 m w.e. a−1) during 1969–1999, and accelerated glacier mass loss (–0.33 ± 0.38 m w.e. a−1) during 1999–2015 [17]. Therefore, how glaciers change at XM and whether these changes have been consistent with those of the glaciers at Kangzhag Ri and Purogangri is still an unresolved issue. There is little detailed analysis regarding the status of XM glaciers located to the east of Kangzhag Ri and limited knowledge regarding the glacier mass change before 1999. Glacier surging can cause hazards, such as floods and associated impacts on downstream areas [18,19]. HMA is one of the major ‘superclusters’ of glacier surge [20]. Surging glaciers in HMA have been well-documented in the Pamir [21,22,23], Karakoram [24,25,26,27] and Tian Shan [28,29]. In addition, there have been reports of surging glaciers in the ITP region, such as Aru Co, Ányêmaqên, Ulugh Muztagh, Namjagbarwa, and Geladandong [30,31,32,33,34,35]. However, no glacier surging has been recorded in XM. Consequently, more attention is urgently required to investigate the recent glacier changes at XM.
Zhou, et al. [36] reported that Xinqingfeng and Malan had mass budgets of −0.21 ± 0.10 m w.e. a−1 and −0.22 ± 0.10 m w.e. a−1, respectively, between 2000 and 2016 according to optical stereo images (SPOT-6/7) and the Shuttle Radar Topography Mission (SRTM). Geodetic mass balance measurements by optical stereo data produce good results on rough surfaces, such as debris-covered glacier surfaces; however, such measurements are difficult when there are clouds, shadow, and snow cover, which can result in high saturation or low contrast alterations. Because the Interferometric Synthetic-Aperture Radar (InSAR) is independent of visible structures and contrast of the glacier surface, it performs well in accumulation areas such as snow covered glaciers. SAR performs well in all weather conditions. The single pass configuration of TerraSAR-X and TanDEM-X ensures a high coherence on glaciers which is advantageous compared to repeat-pass InSAR. Comparison between TerraSAR-X /TanDEM-X and SRTM has been used to estimate the mass balance of glaciers after 1999/2000 in the HMA [5,10,16]. Little optical stereo data exists before 2000, which has hindered research of glacier mass changes before this time. Historical topographic maps have a high accuracy and provide a fine depiction of glacier surface topography and have been widely used for glaciological purposes, especially for glacier mass changes before 2000 [8,37,38]. In the present study, we used topographic maps, Landsat, ASTER, SRTM DEM, and TerraSAR-X/TanDEM-X images to assess the glacier area and mass changes since 1970 for Mt. Xinqingfeng and Mt. Malan in the ITP. The study aimed to fill the knowledge gap of detailed studies in this region and to provide information on the glacier change anomalies, such as advancing and surging.
2. Study Area
Xinqingfeng (also called Buka Daban Peak, see Figure 1) is located in the central Hoh Xil region of the Kunlun Mountain. It is a small ice cap that developed on the planation surface of Kunlun Mountain. The highest elevation is 6860 m above sea level (a.s.l.). According to the second Chinese glacier inventory (CGI), Xinqingfeng contained 77 glaciers with a total area of 425.4 km2 in 2006. The glaciers are distributed around the ice cap with tongues and with an average terminus altitude of approximately 5056 m. The largest glacier is located on the southeastern slope called Monuomaha Glacier (or Xinqingfeng Glacier, Glacier Number 4), with an area of 83.9 km2. The second largest glacier is located on the northwestern slope called the West Monuomaha Glacier (Glacier Number 2), with an area of 69.0 km2.
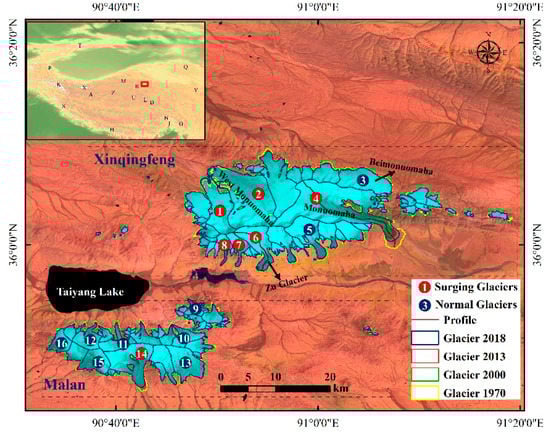
Figure 1.
Overview of the Xinqingfeng and Malan glaciers (The red rectangle denotes the study region location. Background image: Landsat 8 OLI of 31 July 2013, A: Aru Co, D: Dongkemadi, G: Kangri Karpo, H: Himalayas, J: Namjagbarwa, K: Karakoram, L: Geladandong, M:Ulugh Muztagh, N: Nyainqentangglha, P: Pamir, Q: Qilian, R: Kangzhag Ri, S: Spiti Lahaul, T: Tien Shan, U: Purogangri, X: West Kunlun, Y: Ányêmaqên, Z: Zangsar Kangri).
The Malan ice caps (Figure 1) are located on the southwest side of Xinqingfeng, where the highest elevation is 6056 m a.s.l. According to the second CGI, the Malan ice caps contain 59 glaciers with a total area of 189.7 km2. The largest glacier (Glacier Number14) is located on the southern slope, with an area of 30.4 km2.
The XM is weakly affected by the westerly circulation and monsoon circulation [39]. The mean annual air temperature is approximately −10 °C, and the annual precipitation is 173−494 mm in Hoh Xil (34°00′−36°00′N, 89°30′−93°00′E) [40]. More than 90% of the precipitation is concentrated between May and September; therefore, the glaciers in this region belong to the summer-accumulation type [40]. Xie, et al. [41] reported that the annual precipitation in the Taiyanghu basin on the side of the Malan ice caps was 170 mm, with approximately 80% of the precipitation concentrated during the warm season (from May to October). The average elevation of the snowline at Xinqingfeng was 5440 m, the annual average air temperature was −15.4 °C, and the annual precipitation was 340 mm [41]. The average elevation of the snowline at the Malan ice caps was 5445 m and the air temperature was estimated to be −11.5 °C [41]. Based on a 107.07 m ice core recorded from the Malan Ice Cap in May 1999, there has been a warming trend during the 20th century and the warmest period recorded was during the 1950s to the early 1980s. There have also been several stable colder periods during the warming period, with a colder climate during the late 1980s to 1990s [42].
3. Data and Methods
3.1. Topographic Maps
Four topographic maps with a 1:100,000 scale with sheet numbers: I-46-2, I-46-3, J-46-134 and J-46-135 that corresponded to new sheet numbers: I46D001002, I46D001003, J46D012002 and J46D012003, respectively, can be viewed at https://www.osgeo.cn/app/s3216. The maps were made from aerial photographs taken between 1970 and 1971 by the State Bureau of Surveying and Mapping of China (SBSMC) and used in glacier outlines digitized for the first CGI. The contour lines of the I-46-2, I-46-3, and J-46-135 topographic maps were obtained from the SBSMC and were georeferenced to the WGS84/EGM96 using a seven-parameter transformation method. The digital contour lines (the vertical equidistance was 40 m) were from the SBSMC, which were produced and inspected in accordance with the photogrammetric Chinese National Standard [43]. We converted these lines to Grid DEMs using the triangular irregular network (TIN) method, which produces higher accuracy while meeting the Chinese National Standard [43], and better reflects the actual mountainous terrain [44]. These DEMs (hereafter, referred to as TOPO DEMs) were resampled to a spatial resolution of 30 m, which is the same spatial resolution as SRTM. These TOPO DEMs covered the entire Malan area and a small portion of Xinqingfeng. The contour lines of the topographic maps were derived manually using an analytical plotter, and the accuracy of these was strictly controlled and verified based on the photogrammetric Chinese National Standard [43]. The vertical RMSE of these topographic maps were less than 6–10 m for flat and hilly areas and less than 16–28 m for the mountain areas and high mountain areas. Because the slopes of most of the glacierized areas in the study area were gentle (~12°), the vertical accuracy of the TOPO DEMs were better than 16 m on glaciers. Table 1 shows that TOPO DEMs were acquired during the winter season (between October and December). To accurately estimate the glacier mass balance, the possible seasonal mass changes during winter need to be corrected. However, both snowfall and melt mainly occur during summer (June to September), i.e., glaciers in XM are summer-accumulation type glaciers [41,42], and no obvious glacier mass change occurs during the winter months [45]. Consequently, we assumed that no seasonal variation occurred between October and December in our study.

Table 1.
Detailed information about the data used in this study.
3.2. ASTER
The ASTER sensor onboard the TERRA satellite platform provides a stereo pair generated by nadir-looking (3N, 0.76–0.86 μm) and backwards-looking (3B, 27.7° off-nadir) cameras with a base-to-height ratio of approximately 0.6. This value is close to ideal for generating DEMs with a variety of terrain conditions via automated techniques [46]. In this study, the ASTER DEMs for 2014 and 2018, which were generated using the DEM Extraction Model from the ENVI 5.0 software without ground control points (GCPs), were used in the glacier surge analysis.
3.3. TerraSAR-X/TanDEM-X
The TerraSAR-X was launched in June 2007 followed by its twin satellite, the TanDEM-X, in June 2010. The two satellites fly in a close orbital formation and act as a flexible baseline configuration [47]. Five pairs of TerraSAR-X/TanDEM-X (TSX/TDX) data in the experimental co-registered single look slant range complex (CoSSC) format acquired in the bistatic InSAR stripmap mode were used in our study (Table 1). The CoSSC product was focused and co-registered at the TanDEM-X Processing and Archiving Facility using an integrated TanDEM processor. GAMMA SAR and interferometric processing software were used to process the CoSS product [16]. There are two methods for calculating the elevation change when using TSX/TDX and SRTM DEM. The first method is differential interferometric SAR (D-InSAR) and the second method is DEM differencing. For the bistatic mode, neither the deformation nor the atmospheric delay phase was included in the interferogram and the phase resulting from noise was also ignored.
The SRTM 1 and TSX/TDX were co-registered before constructing the differential interferogram. This required establishing an initial look-up table based on the relationship between the map coordinates of the SRTM 1 DEM and the SAR geometry of the TSX/TDX master file. The offsets between the master image and the simulated intensity image of the SRTM 1 DEM used an optimization of the simulated SAR images by employing GAMMA’s offset_pwrm module. The SRTM 1 DEM was then transformed into a SAR geometry for the TSX/TDX master image. The simulated interferometric phase () from the SRTM 1 DEM () was subtracted from the interferometric phase of the TSX/TDX data. The D-InSAR phase () can be obtained from:
The differential interferogram was filtered using an adaptive filtering approach. The flattened differential interferogram was unwrapped using the minimum cost flow algorithm [48]. The areas of layover and shadow with low coherence (<0.3) were masked out during the unwrapping processing. The unwrapped differential phases were converted to absolute differential heights using the calculated phase-to-height sensitivity. The differential interference uncertainty caused by baseline errors was regarded as a systematic error. A two-dimensional first-order polynomial fit for the non-glacial regions was used to remove the residuals in the glacial regions. Finally, a map with a spatial resolution of 12 m from the SAR coordinates was geocoded to the geographic coordinates using a refined look-up table. During the above process, the elevation difference between SRTM and TSX/TDX was derived directly from D-InSAR. The TSX/TDX DEM was geocoded to the geographic coordinates with a grid posting of one arc second using the refined geocoding lookup table created above, and TSX/TDX DEM was produced. We calculated the DEM difference using this DEM that was compared to TOPO DEM.
3.4. SRTM and Radar Penetration
The SRTM DEM was acquired from interferometry of C-band and X-band radar from 11 to 22 February 2000. The 1″ C band DEM (SRTM 1) and the 3″ C-band DEM (SRTM 3) are freely available and cover most of the globe. The vertical accuracy of the SRTM is specified as 16 m with a 90% confidence level and varies according to the region [49]. The X-band SAR system has a narrower swath width than that of the C-band SAR and, unfortunately, we could not access any X-band SRTM DEM data in our study area. Therefore, we used the SRTM C-band DEM at EGM96 orthometric heights with a 30 m pixel resolution (SRTM 1). When the SRTM C-band DEM was used in D-InSAR or DEM differencing with TerraSAR-X/TanDEM-X, which has an X-band SAR system, the results were added with the difference between the SRTM C-band and X band DEM, assuming that no seasonal variation occurred between February and April when there was little snowfall and no obvious melt [41].
The penetration of the C-band radar into snow and ice must be considered when assessing changes in the glacier elevation determined by the difference between the SRTM C-band DEM and TOPO DEM [50]. It is difficult to accurately estimate the penetration depth of the C-band radar into snow and ice for XM glaciers. In our study, the C-band radar penetration was estimated by comparing the SRTM C-band with the X-band, assuming that the penetration depth of the X-band is negligible [11] in two regions near our study region (northeast by 45 km and southeast by 25 km, Figure S1a) where the glaciers are at an elevation of 4930–5950 m a.s.l. Nearly 92% of the glacial region in the XM is in this elevation range. We also estimated the penetration for of the C-band radar at elevation higher than 5950 m a.s.l. or lower than 4950 m a.s.l. using the observed value for 5950 m a.s.l. and 4950 m a.s.l. (Figure S1b).
3.5. Glacier Velocity Data
To investigate the dynamic behavior of the surging glacier, we used the glacier velocity acquired from the Inter-Mission Time Series of Land Ice Velocity and Elevation (ITS_LIVE) and the Global Land Ice Velocity Extraction from Landsat 8 (GoLIVE) dataset. In addition, we supplemented some data from 2008 to 2009 using ENVI add-on COSI-Corr derived from Landsat TM images. Landsat level 1T data were assumed to be quasi-coregistered due to the same sets of GCPs and vertical references used for orthorectification [51]. We selected a signal-to-noise ratio > 0.9 to filter obvious outliers and errors caused by clouds and topography, and low image contrast was removed from the matching result.
The ITS_LIVE data product is a set of regional compilations of annual mean surface velocities for major glacier-covered regions, spanning the period from 1985 to 2018, and is subject to image availability and quality. Surface velocities were derived from Landsat 4, 5, 7, and 8 imagery using the auto-RIFT feature tacking processing chain described in Gardner, et al. [52]. Data scarcity and/or low radiometric quality were significant limiting factors for many regions in the earlier product years. Annual coverage is nearly complete for the years following the Landsat 8 launch in 2013.
GoLIVE is a compilation of ice velocities derived from the cross-correlation of pixel positions in pairs of panchromatic Landsat 8 images acquired from May 2013 to the present [53]. We considered only the velocities of the peak correlation values (corr) >0.4 and the differences in correlation values between the primary and secondary peaks (del_corr) <0.3 [54].
3.6. Glacier Boundary Mapping, and the Calculation of the Area Change and Uncertainty
The glacier boundaries of 1970/71 were derived from the first CGI, which was inventoried using topographic maps and verified using aerial and Landsat MSS images. The glacier boundaries of 2000, 2013 and 2018 were digitized manually from Landsat images using the same method as that for the second CGI processing [55]. We also checked the glacier boundaries by cross-checking with Google Earth imagery.
The uncertainty in determining glacier boundaries (Ea) was estimated using a buffer of 13.5 m for the topographic maps with a 1:100,000 scale and half a pixel for the Landsat images [56]. The uncertainty of the glacier area change (Eac) was calculated using the following equation:
where Ea1 and Ea2 represent the uncertainties of the glacier areas for the two different periods.
3.7. Glacier Elevation Changes, Mass Balance, and Uncertainty
Changes in glacier elevation from 1999 to 2011/12 were calculated using the D-InSAR based on the TSX/TDX and SRTM C-band (see Section 3.3). Changes in the glacier elevation from 1970/71 to 1999 and from 1970/71 to 2011/12 were calculated by taking the differences between the DEMs for the TOPO DEM, SRTM and TSX/TDX DEM. All DEMs were resampled to the same spatial resolution (30 m). Before the DEM differencing, the DEMs were corrected for planimetric and altimetric shifts [57] using the TOPO DEM as a reference. The curvature bias [50] in the glacial region was then corrected by fitting sixth-order polynomials to the elevation differences for the non-glacial regions. We considered only the elevation differences between ±100 m over the stable region with slopes ranging from 5° to 75° and excluding glaciers and water bodies in the co-registered and bias corrected DEMs. After the adjustments, an elevation difference map of off-glaciers indicated a local random noise; however, at length scales of a few kilometers, the elevation differences were small, with the mean elevation difference of the total region less than 0.5 m (Table 2).
Table 2.
Statistics of errors of elevation difference at off-glacier region between the TOPO, SRTM and TSX/TDX. MEAN is mean elevation difference, and STDV is standard deviation.
The geodetic mass balance (m w.e. a−1) was calculated using the following equation [58]:
where is the average elevation differences within the perimeter covered by an individual glacier in a larger extent of two periods. In this case, the larger glacier extent ensured the mass change results were not affected by glaciers advancing or retreating. Al is the glacier area when covered in a larger extent. is the average area between two periods calculated as and is the length of the observation period (t2 − t1) in years. fm is a conversion factor (without units) used to transform glacier elevation change into mass change and was set to a constant of 0.85, which correspond to a density of volume change of 850 ± 60 kg m−3—a widely used assumption over longer periods [59].
Under ideal circumstances, there would be no elevation difference in the stable region after the above adjustments. However, the residual errors (Figures S2–S7 and Table 2) remained in our results and caused uncertainty for the elevation change of the glacial region. Therefore, the uncertainty in the differences of the glacier elevation (EΔH) was estimated using the mean elevation difference (Emed) and standard deviation (σ) of the off-glacier region. We calculated the differences of the glacier elevation for each altitude band (50 m, EΔHi), which excluded glaciers and water bodies:
where Emedi and σi are the mean elevation difference and the standard deviation for each altitude band, respectively. Neffi is the effective number of observations at off-glacier region, i.e., the number of included pixels, and is calculated using the total number of observations (Ntoti) for each altitude band, the pixel size (PS) and the distance (d) for the spatial autocorrelation of the elevation change maps (1410 m) were determined using Moran’s I autocorrelation index for the elevation differences of an off-glacier region [12,60]. The overall uncertainty of the DEM difference was calculated by the glacier area-weighted average of EΔHi for each altitude band.
The uncertainty of the glacier boundaries (Ea) should be considered in the mass balance estimation. The glacier outlines were used in this study because they had a larger coverage during the investigated period. The uncertainty in radar penetration (Ep) should also be considered during the mass balance estimation. However, it is difficult to understand this uncertainty. We used the uncertainty in the DEM difference between the SRTM-X and SRTM-C using Formula (4) to represent Ep and the results revealed an uncertainty of 1.9 m. The radar penetration accuracy includes the uncertainty of the differences between SRTM-X and C and the possible slight penetration of the X-band radar beam. However, it was impossible to evaluate the radar penetration accuracy. It was possible that a slight penetration of the X-band radar beam was within this uncertainty range. Finally, the uncertainty of the volume-to-mass conversion should also be considered to calculate the final uncertainty (Em of ±60 kg m−3 for the elevation change to mass change) [59]:
where S represents the glacier area, and ρ represents the ice density.
4. Results
4.1. Glacier Area Changes
There were 136 glaciers in XM with a total area of 641.2 ± 7.7 km2 in 1970/71. The total glacier area decreased by 27.4 ± 8.9 km2 (4.3 ± 1.4%) or 0.09 ± 0.03% a−1 from 1970/71 to 2018. The glacier area changed by −0.01 ± 0.20% a−1 from 2013 to 2018, but it changed by −0.03 ± 0.12% a−1 and −0.13 ± 0.06% a−1 for the periods from 2000 to 2013 and 1970/71 to 2000, respectively. The glacier area at Xinqingfeng decreased by 0.08 ± 0.03% a−1, and in Malan, it decreased by 0.11 ± 0.03% a−1. The glaciers showed heterogeneous variations with some advancing or surging (Tables S1 and S2). Overall, the shrinkage speed of the glacier area decreased after 2000, and the glacier area was stable after 2013, which can be mainly attributed to heterogeneous variations, with some of the glaciers advancing or surging (Tables S1 and S2).
4.2. Glacier Mass Balance
The average elevation decrease of glaciers in Xinqingfeng was 3.50 ± 2.17 m, resulting in an average glacier mass loss of 0.22 ± 0.17 m w.e. a−1 between 1999 and 2011/12. Glaciers exhibited heterogeneous mass changes. West Monuomaha Glacier experienced a significant lowering on the tongue, resulting in a net mass loss from 1999 to 2011 (Figure 2). Glacier Numbers 5–7 had mass changes of 0.01 ± 0.16 to 0.10 ± 0.16 w.e. a−1 (Figure 2 and Table S3).
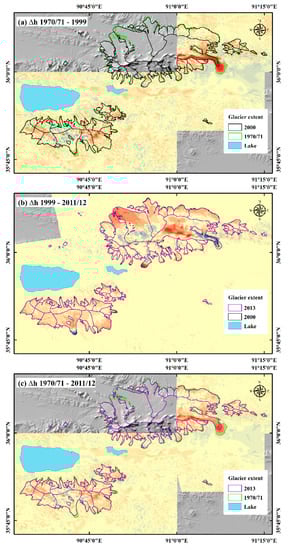
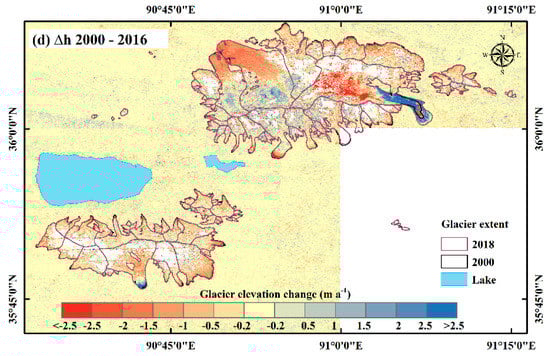
Figure 2.
(a) Elevation difference of DBZ glaciers between TOPO (1970/71) and SRTM (1999); (b) elevation difference of DBZ glaciers between SRTM (1999) and TanDEM-X (2011/12); (c) elevation difference of DBZ glaciers between TOPO (1971) and TanDEM-X (2011/12); (d) elevation difference (2000–2016) of DBZ glaciers derived from Brun et al. [2].
The glaciers at Malan decreased in elevation from 1970 to 2012 with an average of thinning of 10.72 ± 0.91 m, resulting in an average mass loss of 0.22 ± 0.02 m w.e. a−1. The rate of mass loss for these glaciers increased from −0.19 ±0.14 m w.e. a−1 between 1970 and 1999 to −0.29 ±0.17 m w.e. a−1 between 1999 and 2012. Glacier Numbers 14 and 15 experienced a slightly positive mass budget from 1970 to 1999.
Our results indicate that ice loss primarily occurred below 5600 m a.s.l. (Figure 3), which is the reason for glacier area loss below 5600 m a.s.l. The ice thickness thinning rate below 5600 m a.s.l. between 1999 and 2012 was higher than that between 1970 and 1999. However, ice thickness increased at elevations below 5000 m a.s.l. during 1999–2012, which was caused by some glacier surging.
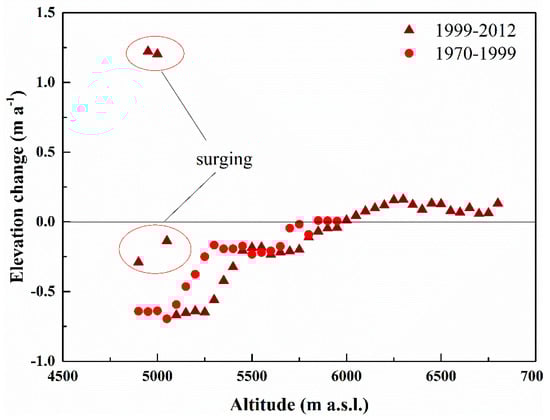
Figure 3.
Altitude distributions of glacier thickness change separated into 50 m elevation bins from 1970 to 1999 and 1999 to 2012.
4.3. Glacier Advance and Surge
A minimum of seven glaciers in Xinqingfeng and Malan showed heterogeneous variations with either surging or advancing during different periods (Table 3). The eastern branch of Glacier Number 1 advanced 280 ± 20 m and converged into the West Monuomaha Glacier (Number 2) from 1971 to 1987 at the same time that the West Monuomaha Glacier was retreating. Glacier Number 1 then continued to advance 50 ± 20 m from 1989 to 1999. The average advance rate for the West Monuomaha Glacier during 1987–1998 was 130 ± 10 m a−1, where the peak value was 600 ± 10 m a−1 during 1987–1989. The West Monuomaha Glacier had a higher velocity during 1986–1997 with a maximum velocity of 150 m a−1 based on the time series data for glacier velocities derived from ITS_LIVE (Figure 4a). However, some data were missing between 1987 and 1989. According to advancing magnitude (1200 m) during 1987–1989, we assumed that the West Monuomaha Glacier had a much higher velocity with surging during 1987–1989. We found this glacier had a higher velocity from 12 October 1987 to 29 November 1987 with a maximum velocity of 5.6 m d−1 (Figure 4b), which may be the peak value from 1986 to 2001 (Figure 4a). Consequently, the West Monuomaha Glacier was a surging glacier with a higher velocity from 1986 (or before 1986) to 2001.
Table 3.
Main characteristics of surging or advancing glaciers.
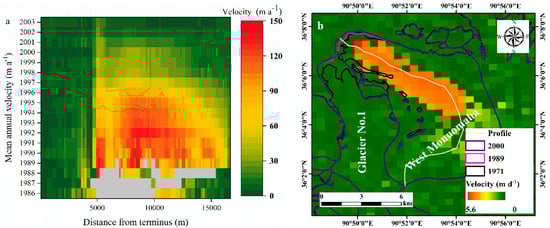
Figure 4.
Panel (a) shows center line annual velocity profiles from 1986 to 2003; (b) shows this glacier had a higher velocity from 12 October 1987 to 29 November 1987 with a maximum velocity of 5.6 m d−1.
The Monuomaha Glacier (Number 4) also advanced 1160 ± 20 m from 2010 to 2016; however, it had an overall retreat of 2550 ± 20 m over the entire period from 1970 to 2010. The glacier velocity results (Figure 5a,b) suggest that the Monuomaha Glacier could have initiated between February and March 2009. Based on the time series data for glacier velocities derived from GoLIVE and ITS_LIVE, the velocity of the Monuomaha Glacier reduced quickly in January 2017 and then returned to normal levels by 2018. The Monuomaha Glacier underwent a significant thickening in the lower part and a significant lowering in the higher part during 1999–2011 and 2011–2014 (the difference between ASTER and TSX/TDX-X, Figure 5c), which indicates glacier surging. The Monuomaha Glacier showed terminus thickening between 2014 and 2018 (the difference between ASTER DEMs), and there were some unreasonable data on the accumulation zone due to higher uncertainty with DEMs derived from optical images for the fresh snow cover region.
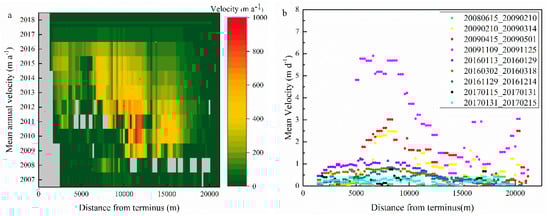
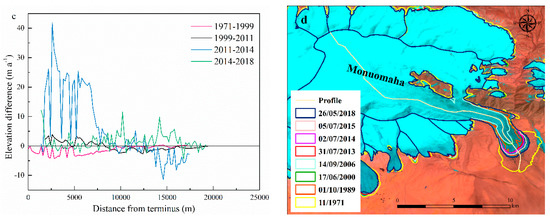
Figure 5.
Panel (a) shows center line annual velocity profiles from 2007 to 2018. (b) shows specific center line velocity profiles with supplementary for (a). (c) shows profiles of the Monuomaha Glacier during different periods. The center line profiles were derived from TOPO DEM data. (d) shows glacier terminus change. The background image is from Landsat 8 OLI on 26 May 2018.
The Zu Glacier (Number 6) advanced 50 ± 10 m from 2014 to 2016 and experienced a higher velocity from 2013 to 2015 (Figure 6). The Zu Glacier showed a significant thickening in the lower part and a significant lowering in the higher part during 2014–2018 (Figure 6c). Combined with the shape of the terminus of the Zu Glacier (Figure 6d), this glacier might be surging from 2014 to 2016, with this glacier retaining a relatively high speed until now.
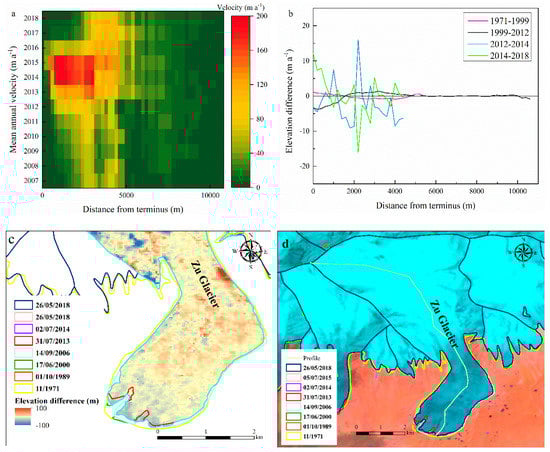
Figure 6.
Panel (a) the center line annual velocity profiles from 2007 to 2018; (b) the profiles of the Zu Glacier during different periods; (c) the elevation difference from 2014 to 2018. The profiles were derived from TOPO DEM data. (d) glacier terminus change. The background image is from Landsat 8 OLI on 26 May 2018.
Glacier Number 7 advanced 40 ± 20 m from 1986 to 1989, and then advanced 110 ± 20 m from 2009 to 2010. Glacier Number 8 advanced 430 ± 20 m from 1970 to 2000; however, we only know for certain that this glacier advanced 660 ± 20 m from 1970 to 1986 and then retreated between 1986 and 2018. Glacier Number 14 showed significant thickening and thinning within its tongues (Figure 2b) between 1999 and 2012. Glacier Number 14 advanced 260 ± 20 m from 2007 to 2012; however, it retreated 950 ± 20 m between 1971 and 2007. Thus, Glacier Number 14 might be a surging glacier.
The latest surge-type index from Mukherjee, Bolch, Goerlich, Kutuzov, Osmonov, Pieczonka, and Shesterova [28] classified the West Monuomaha Glacier, Monuomaha Glacier, and Glacier Number 7 as surge-type glaciers (>100 m a−1). The Monuomaha Glacier and Glacier Nos. 7, 8, and 14 showed significant thickening in their tongues and a significant lowering in their upper parts (Figure 2b), and these glaciers might be surging glaciers. Although Glacier Number 8 was considered a surge-type glacier with surging from 1999 to 2011, it is unclear whether its advance from 1970 to 1986 was caused by surging. In addition, we also found that Glacier Number 1 was likely to be a surge-type glacier (<100 m a−1 and >10 m a−1) [28].
5. Discussion
5.1. Uncertainties
The uncertainties in the geodetic mass balance mainly resulted from the precision of the DEM acquisitions and processes, glacier boundaries and changes, seasonal variation, radar penetration depth, and data voids. All DEMs and methods for acquisitions and processing we employed in our study proved to be valuable for assessing geodetic glacier mass budgets and evaluating uncertainties.
Seasonal variance caused by the difference between data acquisition times should be considered because geodetic measurements should show the mass balance corresponding to an integer number of balance years. For XM glaciers, most accumulating and melting occurred simultaneously during the summer (June to September). In addition, based on the extent of snow coverage on XM glaciers from the Landsat images, we assumed that September was the end of the ablation period. Therefore, in our study, the correction of seasonal variation was set to zero, because no obvious glacier mass change occurred between the months of late winter and spring. Even so, we still conservatively assumed that the seasonal mass change was equal to the maximum net accumulation (603 mm w.e.) of the Malan ice core during 1887–1998. Indeed, the average net accumulation of the Malan ice core from 1887 to 1998 was only 186 mm w.e. This value could create errors of between 0.01 and 0.05 m w.e. a−1 for the mass balances for the periods of 1970–1999, 1999–2012, and 1970–2012. The number was also included in the uncertainty terms.
One critical issue in our study was the unknown C-band and X-band radar penetration into snow and ice. We estimated the C-band radar penetration by comparing the SRTM C-band with the X-band DEM without considered X-band radar penetration. Because TSX/TDX and SRTM-X have the same band (X-band), and the seasonal variation could be ignored as above, it was unnecessary to considering additional X-band penetration when calculating the elevation change between TSX/TDX DEM and SRTM-C DEM, even if the penetration depth of the X-band radar signal into the glacier surface was influenced by different seasons. Liu, Jiang, Jiang, Wang, Ma, and Xu [45] found that the X-band penetration in January was 0.61 ± 0.06 m higher than that in April over the Puruogangri ice field. We also assumed that the X-band penetration in February was 0.61 ± 0.06 m higher than that in March and April over the XM glaciers, potentially creating errors of up to 0.04 m w.e.a−1 for the mass balances during 1999–2012. However, since additional X-band radar penetration was not considered, the penetration depth of the C-band radar we obtained was likely underestimated when calculating the elevation difference between TOPO DEM or TSX/TDX DEM and SRTM C-band DEM. Several studies have reported that the average penetration depth of the X-band radar could reach 2–4 m or less under dry-snow conditions over the accumulation region of glaciers in the Karakoram [25] and Western Pamir [61] mountain ranges. However, the precipitation in our study region is much less than that in the Karakoram and Western Pamir, especially during winter, and the thickness and extent of the dry snow might be much less than in the Karakoram and Western Pamir. We conservatively assumed that the X-band radar penetration was 2 m, with the updated results only less negative by 0.06 m w.e. a−1 and 0.04 m w.e. a−1 than our results during 1970–1999 and 1970–2012, respectively. The number was also included in the uncertainty terms. Thus, the geodetic mass balance results over the long term were less affected by X-band penetration.
Another major uncertainty for the geodetic mass balance was caused by the lack of information in several data voids. Our elevation difference results did not exceed the range of ±100 m; therefore, there were no data voids in the difference between TOPO and SRTM. The elevation difference in the areas of layover and shadow with low coherence (<0.3) for TSX/TDX was not accurate and was excluded in our study. Then, there were only small data voids (approximately 1%) for the elevation difference between TOPO or SRTM and TSX/TDX. In the present study, we calculated the mean elevation difference of the nonvoid pixels without considering the data voids. Some methods can be used to fill the data voids. McNabb et al. (2019) split these methods into three general categories: constant interpolation, spatial interpolation, and hypsometric interpolation. In constant methods, the maximum, minimum, mean, and median elevation changes observed in the same elevation bins regions are used to fill the voids and to evaluate the impact on the total glacier mass balance. In spatial interpolation, the raw DEM or elevation differences of the surrounding pixels are interpolated to fill the voids, and the average elevation difference according to the on-glacier pixels within a 1 km radius of the void pixel for each void pixel is calculated. In hypsometric methods, the mean elevation difference for each 50 m wide elevation bin was used to calculate the mass change by the glacier area of each elevation bin. The above assumptions led to a variation of the mass balance of less than 0.04 m w.e. a−1. The number was also included in the uncertainty terms.
5.2. Glacier Area Changes
Our results showed a decrease in the glacier area at a rate of ~0.00–0.26% a−1 (except for Glacier Nos. 1, 2, and 8) from 1971 to 2018. These results are in agreement with other studies, proving that there are low rates of glacier shrinkage in the ITP. For example, there was a 0.18% a−1 shrinkage from the 1970s to 2009 for the drainage basins of Ayakkum Lake (5Z11, basin code from CGI) and Hoh Xil Lake (5Z12), a 0.17% a−1 shrinkage from 1976 to 2013 for the Qaidam interior-drainage basin (5Y5), and a 0.14 % a−1 shrinkage from 1976 to 2013 for the Ayakkum Lake interior-drainage basin (5Z1) [56,62].
Compared with the surrounding regions in the ITP, the rate of glacier shrinkage in the XM was very close to the western Kunlun Shan (0.1% a−1 from 1970 to 2010) [13] and Kangzhag Ri (0.08% a−1 from 1970 to 2016) [15], was slightly lower than Geladandong (0.15% a−1 from 1964 to 2010) [63] to the south, and was significantly lower than Dongkemadi (0.26% a−1 from 2000 to 2011) [64] and Qilian Shan (0.39% a−1 from 1956 to 2010) [65] to the northeast, Bugyai Kangri (0.48% a−1 from 1981 to 2013) [66] to the southeast, and western Nyainqentanglha (0.62% a−1 from 1970 to 2014) [67] to the south.
5.3. Glacier Mass Changes
Our results for the mass changes of the glaciers at Xinqingfeng and Malan of −0.22 ± 0.17 m w.e. a−1 and −0.29 ± 0.17 m w.e. a−1, respectively, from 1999 to 2011 agree well with the results from Zhou, Hu, Li, Li, Zhao and Ding [36] of −0.21 ± 0.10 m w.e. a−1 and −0.22 ± 0.10 m w.e. a−1 from 2000 to 2016. Brun, Berthier, Wagnon, Kaab and Treichler [2] reported that the global average mass loss was 0.14 ± 0.07 m w.e. a−1 from 2000 to 2016 for glaciers in the ITP. We also estimated that there was a mass loss of 0.17 m w.e. a−1 for the glaciers at XM based on the data from Brun et al. (2017) (Table S3), which agrees well with our study. However, Gardner, et al. [68] found a −0.01 ± 0.35 m a−1 elevation change for the glaciers of the ITP from 2003 to 2009 using ICESat and SRTM. This deviation may be attributed to the different study periods and extent. Neckel, et al. [69] determined that the average mass loss was 0.77 ± 0.35 m w.e. a−1 from 2003 to 2009 for the glaciers in the Qilian Mountains and East Kunlun, which were included in our study region, as observed by ICESat GLAS. Their estimated trend was significantly more negative than ours, which may be attributed to a different study extent and period. These results together prove that the very large ITP is an aggregation of climatically heterogeneous sub-regions that result in spatial variability in the glacier mass balance. Previous studies [10,13] have reported that the West Kunlun Shan and extended West Kunlun showed glacier mass gain from 2000. Zhang and Liu [15] determined that glaciers in Kangzhag Ri, which are approximately 70 km west of XM, showed a positive mass balance (+ 0.16 ± 0.02 m w.e. a−1) from 1999 to 2012 using ASTER and SRTM. Therefore, KangzhagRi and XM are the transition zones from the west to the east regarding the mass balance distribution from positive to negative based on the data since 1999. In addition, we compared three glacial clusters along approximately 35.5–36.5°N, from 87°E to 91°E (Ulugh Muztagh, Kangzhag Ri, and XM) using the results from Brun, Berthier, Wagnon, Kaab and Treichler [2], which showed that the mass balance decreased from the west to east (Figure 7a). We also calculated the mean median elevation, which was presumed to be at equilibrium-line altitude (ELA) such that the mass balance is zero at that elevation [70], for three glacial regions (Figure 7c) and showed that the mean median elevation (or ELA) decreased from the west to the east. The other three glacial clusters (Zangsar Kangri, Purogangri, and Geladandong) along approximately 33–34.5°N from 85.3°E to 91.5°E also showed a similar trend (Figure 7b,d). Because the mean median elevation (or ELA) is closely related to air temperature and precipitation [70], different climate zones result in heterogeneity with the glacier mass balance. In XM, a local climatic zone, the area average mass balance was calculated with a mean median elevation interval of 50 m using our results from 1999 to 2012 (Figure 7). The results showed that the glacier mass loss decreased with increasing mean median elevation. Glaciers with a mean median elevation below 5700 m a.s.l. had significantly more negative mass balance than glaciers above 5700 m a.s.l., because ice mass loss mainly occurred at low altitudes (Figure 3). However, there were no obvious relationships between mass balance with mean median elevation for glaciers with a mean median elevation below 5700 m a.s.l. Thus, glaciers at XM were also significantly influenced by local heterogeneity of climate.
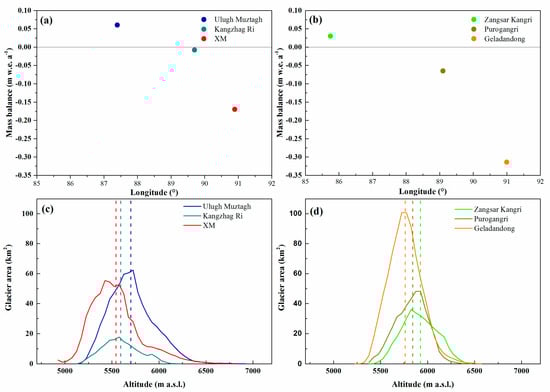
Figure 7.
(a) Glacier mass balance in glacial clusters along approximately 35.5–36.5°N, from 87°E to 91°E (Ulugh Muztagh, Kangzhag Ri, and XM). (b) Glacier mass balance in glacial clusters (Zangsar Kangri, Purogangri, and Geladandong) along approximately 33–34.5°N, from 85.3°E to 91.5°E. (c,d) Hypsography of glaciers for six clusters. Different colors indicate different clusters. The vertical dashed lines indicate the mean median elevation.
Most glaciers experienced similar mass budgets for the investigated periods at Malan. However, some glaciers had greater negative budgets after 1999. For example, Malan experienced a slight mass gain before 1999 and a negative mass change after 1999. The global average mass change trend (more negative) was in agreement with Bugyai Kangri, Dongkemadi, and West Geladandong to the southeast of XM [17]. However, this was in contrast to KangzhagRi [15] and Aru Co to [30] to the west of XM, which showed more positive growth after a negative period. Glaciers to the west of XM showed a lower mass loss or a mass gain trend after 1999; however, glaciers to the east showed a more negative change.
5.4. Glacier Advance and Surge
Two surge models have been linked to a corresponding hypothesis relative to thermal or hydrological surge control [71,72]. Thermal control is characterized by an initiation phase that lasts several years before reaching a peak in the surge and a termination phase that consists of several years of deceleration following the surge peak [73,74]. A switch in basal thermal conditions has been identified as a surge mechanism for some polythermal glaciers, with surging occurring when cold basal conditions switch to temperate conditions [73,74,75]. These surges can begin or end at any seasonal time of year. Hydrological control can explain surging for temperate glaciers and many polythermal glaciers that are already temperate at the base [76]. The subglacial drainage system becomes inefficient during the winter months, increasing the subglacial water pressure and facilitating rapid liding [77,78]. This is characterized by the rapid acceleration and deceleration over a short time (i.e., days to weeks) and is initiated during the winter months and terminated during the summer months when the subglacial drainage system becomes highly efficient [79,80]. The borehole temperature measurements in the Malan ice caps showed that the ice temperature at a depth of 10 m was −6.5 °C; therefore, the glaciers in our study were attributed to the cold type. Our results showed that the Monuomaha Glacier had a long active phase that lasted eight years and may have started and finished in the winter. Thus, the Monuomaha Glacier might be surge controlled via thermal mechanisms, where a switch from cold to temperate conditions caused the surge onset in 2009. The West Monuomaha Glacier and Zu Glacier also had a long active phase duration and might be the same surge control as the Monuomaha Glacier. Under the colder and wetter climate that was recorded in the ice core of Malan ice cap from the late 1980s and into the 1990s [42,81], more snowfall may have occurred in the XM. In recent years, higher precipitation, including snowfall has occurred in the XM (Figure 8). Moreover, the Zu Glacier exhibited a positive mass balance (0.07 ± 0.16 m w.e. a−1), which might be attributed to the precipitation (snowfall) increases from 1999 to 2012 and then surging during 2014–2016. Therefore, we assumed that the build-up of ice from the accumulation of snowfall increasing in the reservoir area enhanced the driving stress, which led to higher ice creep rates and generated heat to produce meltwater, leading to reduced basal drag and faster sliding.
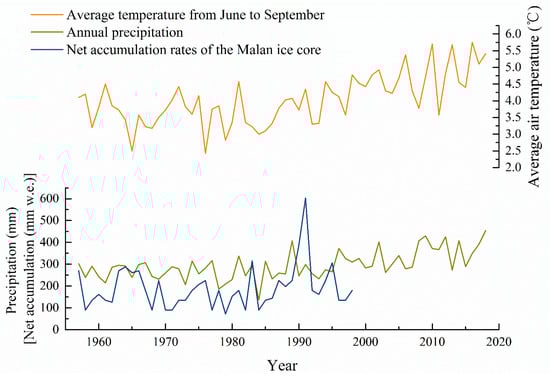
Figure 8.
Changes in the average air temperature (from June to September) and annual precipitation from 1957 to 2018 recorded at the Wudaoliang station. The net accumulation rates recorded from the Malan ice core are also shown.
5.5. Glacier Response to Climate Change
From the coldest years of the Little Ice Age, the areas of the glaciers at Malan were 4.6% larger than modern glaciers, compared with approximately 8% and 20% in Qangtang and TP, respectively [82]. Thus, the glaciers in XM might be more stable. However, the warming trend from the 20th century was recorded from a Malan ice core, and the warmest period was between the 1950s and early 1980s. Several stable cold periods punctuated through the warming, especially between the late 1980s and 1990s, which may have been caused by a strong summer monsoon [42]. The response of the terminus to a change in climate is delayed by flow dynamics, where current changes in an area are integrated reactions to past climate changes [83]. Therefore, we speculated that the shrinkage of the glacier areas mainly occurred between 1970 and 1999 and could be a response to the warming of the 1950s to the early 1980s. Glaciers have undergone slight area shrinkage from 2000 to 2018 relative to the colder climate from the late 1980s and into the 1990s.
Glacier mass balance responds simultaneously to changes in climate. Glacier mass loss from 1999 to 2012 was higher than from 1970 to 1999. The mass balance in XM might be more sensitive to changes in temperature than precipitation (Figure 8). In addition, a higher net accumulation rate was recorded between 1987 and 1995 from an ice core in Malan [81]. Thus, the colder and wetter climate from the late 1980s to 1990s (Figure 8) might have resulted in a slight negative or positive mass change for the glaciers during this period. This is the likely reason for the relatively small negative mass loss between 1970 and 1999.
6. Conclusions
We investigated glacier area and mass changes for Mt. Xinqingfeng and Mt. Malan derived from topographic maps, Landsat, ASTER, SRTM DEM, and TerraSAR-X/TanDEM-X from ~1970 to 2018 and ~1970 to 2012, respectively. Our results showed that the glaciers experienced a small shrinkage from 641.2 ± 7.7 km2 in 1970/71 to 613.9 ± 4.4 km2 in 2018, corresponding to an area shrinkage of 4.3 ± 1.4% (0.09 ± 0.03% a−1) from 1970 to 2018. The shrinkage speed of the glacier area decreased after 2000 and the glacier area was stable after 2013, which was primarily attributed to the advance or surge of some glaciers. However, the mass balances of glaciers at Xinqingfeng and Malan were negative at −0.22 ± 0.17 m w.e. a−1 and −0.29 ± 0.17 m w.e. a−1 from 1999 to 2012, respectively. The mass loss of 0.19 ± 0.14 m w.e. a−1 was found for the glaciers at Malan from 1970 to 1999. Glacier variations at XM are heterogeneous and differ spatially as well as temporally. A total of seven glaciers showed surging or advancing from 1970 to 2018. Among them, the West Monuomaha Glacier, Monuomaha Glacier, and Zu Glacier were identified as surging glaciers, and the others may also be surging glaciers that required more evidence. These surge-type glaciers showed a long active period and comparatively low velocity, suggesting that thermal control was important for surge initiation and recession.
Supplementary Materials
The following are available online at https://www.mdpi.com/2072-4292/12/3/421/s1, Figure S1: (a) The two regions near our study region (northeast by 45 km and southeast by 25 km) where the C-band radar penetration was estimated by comparing the SRTM C-band with the X-band. (b) C-band Radar Penetration depth differences at each elevation bin, Figure S2: Distribution of elevation differences (black line) between TOPO and SRTM on the ice-free terrain after planimetric and vertical adjustment of the DEMs. The blue line represents the corresponding gaussian fit. The vertical lines represent the standard deviation of elevation differences, Figure S3: Distribution of elevation changes between TOPO and SRTM (black line) in each altitude interval. The blue line represents the corresponding gaussian fit, Figure S4: Distribution of elevation differences (black line) between TSX/TDX-X and SRTM on the ice-free terrain after planimetric and vertical adjustment of the DEMs. The blue line represents the corresponding gaussian fit. The vertical lines represent the standard deviation of elevation differences, Figure S5: Distribution of elevation changes between TSX/TDX-X and SRTM (black line) in each altitude interval. The blue line represents the corresponding gaussian fit, Figure S6: Distribution of elevation differences (black line) between TSX/TDX-X and TOPO on the ice-free terrain after planimetric and vertical adjustment of the DEMs. The blue line represents the corresponding gaussian fit. The vertical lines represent the standard deviation of elevation differences, Figure S7: Distribution of elevation changes between TSX/TDX-X and TOPO (black line) in each altitude interval. The blue line represents the corresponding gaussian fit, Table S1: Glacier area (A) and changes (ΔA) from 1970−2018 for selected glaciers that have mass−balance estimates and for all glaciers of the study area, Table S2: Glacier length (L) and changes (ΔL) at Xinqingfeng and Malan for selected glaciers. Table S3: Glacier mean elevation (△H) and geodetic glacier mass balance rates measured from DEM differencing.
Author Contributions
Conceptualization, Z.Z. and S.L.; methodology, Z.Z., Z.J., W.G., and J.X.; software, Z.Z.; validation, S.Z., J.W., D.S., Y.Z., and S.Z.; formal analysis, Z.Z. and D.H.; investigation, Z.Z.; writing—original draft preparation, Z.Z.; writing—review and editing, Z.Z. and S.L. All authors have read and agreed to the published version of the manuscript.
Funding
This research was supported by the Strategic Priority Research Program of the Chinese Academy of Sciences (Grant No. XDA19070501), The Ministry of Science and Technology (Grant No. 2013FY111400), International Partnership Program of Chinese Academy of Sciences (Grant No. 131C11KYSB20160061), the National Natural Science Foundation of China (Grant No. 41701087, 41471067) and Research Funds Provided to New Recruitments of Yunnan University (YJRC3201702).
Acknowledgments
We thank Etienne Berthier for guidance on uncertainty estimation of glacier elevation changes. Landsat, SRTM C-band and ASTER data were acquired from the US Geological Survey and NASA. The China Meteorological Forcing Data set (CMFD) was from the Cold and Arid Regions Science Data Center in Lanzhou. The GoLIVE data was from NSIDC. The High Mountain Asia 8-m DEMs were from NASA. The first and second glacier inventories were provided by a past MOST project (2006FY110200) (http://westdc.westgis.ac.cn/glacier). SRTM X-band and TerraSAR-X/TanDEM-X data were acquired from DLR. GoLIVE data were acquired from NSIDC (https://nsidc.org/data/NSIDC-0710/versions/1), And ITS_LIVE data were acuqired from NASA (https://its-live.jpl.nasa.gov/).
Conflicts of Interest
The authors declare no conflict of interest.
References
- Immerzeel, W.W.; van Beek, L.P.; Bierkens, M.F. Climate change will affect the asian water towers. Science 2010, 328, 1382–1385. [Google Scholar] [CrossRef]
- Brun, F.; Berthier, E.; Wagnon, P.; Kaab, A.; Treichler, D. A spatially resolved estimate of high mountain asia glacier mass balances, 2000-2016. Nat. Geosci. 2017, 10, 668–673. [Google Scholar] [CrossRef]
- Kääb, A.; Berthier, E.; Nuth, C.; Gardelle, J.; Arnaud, Y. Contrasting patterns of early twenty-first-century glacier mass change in the himalayas. Nature 2012, 488, 495–498. [Google Scholar] [CrossRef]
- Kääb, A.; Treichler, D.; Nuth, C.; Berthier, E. Brief communication: Contending estimates of 2003-2008 glacier mass balance over the pamir–karakoram–himalaya. Cryosphere 2015, 9, 557–564. [Google Scholar] [CrossRef]
- Wu, K.; Liu, S.; Jiang, Z.; Xu, J.; Wei, J.; Guo, W. Recent glacier mass balance and area changes in the kangri karpo mountains from dems and glacier inventories. Cryosphere 2018, 12, 103–121. [Google Scholar] [CrossRef]
- Farinotti, D.; Longuevergne, L.; Moholdt, G.; Duethmann, D.; Mölg, T.; Bolch, T.; Vorogushyn, S.; Güntner, A. Substantial glacier mass loss in the tien shan over the past 50 years. Nat. Geosci. 2015, 8, 716–722. [Google Scholar] [CrossRef]
- Holzer, N.; Vijay, S.; Yao, T.; Xu, B.; Buchroithner, M.; Bolch, T. Four decades of glacier variations at muztagh ata (eastern pamir): A multi-sensor study including hexagon kh-9 and pléiades data. Cryosphere 2015, 9, 2071–2088. [Google Scholar] [CrossRef]
- Zhang, Z.; Liu, S.; Wei, J.; Xu, J.; Guo, W.; Bao, W.; Jiang, Z. Mass change of glaciers in muztag ata-kongur tagh, eastern pamir, china from 1971/76 to 2013/14 as derived from remote sensing data. PLoS ONE 2016, 11, e0147327. [Google Scholar] [CrossRef]
- Bolch, T.; Pieczonka, T.; Mukherjee, K.; Shea, J. Brief communication: Glaciers in the hunza catchment (karakoram) have been nearly in balance since the 1970s. Cryosphere 2017, 11, 531–539. [Google Scholar] [CrossRef]
- Lin, H.; Li, G.; Cuo, L.; Hooper, A.; Ye, Q. A decreasing glacier mass balance gradient from the edge of the upper tarim basin to the karakoram during 2000-2014. Sci. Rep. 2017, 7, 6712. [Google Scholar] [CrossRef]
- Gardelle, J.; Berthier, E.; Arnaud, Y. Slight mass gain of karakoram glaciers in the early twenty-first century. Nat. Geosci. 2012, 5, 322–325. [Google Scholar] [CrossRef]
- Gardelle, J.; Berthier, E.; Arnaud, Y.; Kääb, A. Region-wide glacier mass balances over the pamir-karakoram-himalaya during 1999-2011. Cryosphere 2013, 7, 1263–1286. [Google Scholar] [CrossRef]
- Bao, W.; Liu, S.; Wei, J.; Guo, W. Glacier changes during the past 40 years in the west kunlun shan. J. Mt. Sci.-Engl. 2015, 12, 344–357. [Google Scholar] [CrossRef]
- Yao, T.D.; Thompson, L.; Yang, W.; Yu, W.S.; Gao, Y.; Guo, X.J.; Yang, X.X.; Duan, K.Q.; Zhao, H.B.; Xu, B.Q.; et al. Different glacier status with atmospheric circulations in tibetan plateau and surroundings. Nat. Clim. Chang. 2012, 2, 663–667. [Google Scholar] [CrossRef]
- Zhang, Z.; Liu, S. Area changes and mass balance of glaciers in kangzhagri of the tibetan plateau from 1970 to 2016 as derived from remote sensing data. J. Geo-Inf. Sci. 2018, 20, 1338–1349. [Google Scholar]
- Neckel, N.; Braun, A.; Kropáček, J.; Hochschild, V. Recent mass balance of the purogangri ice cap, central tibetan plateau, by means of differential x-band sar interferometry. Cryosphere 2013, 7, 1623–1633. [Google Scholar] [CrossRef]
- Chen, A.A.; Wang, N.; Li, Z.; Wu, Y.; Zhang, W.; Guo, Z. Region-wide glacier mass budgets for the tanggula mountains between ∼1969 and ∼2015 derived from remote sensing data. Arct. Antarct. Alp. Res. 2017, 49, 551–568. [Google Scholar] [CrossRef]
- Motyka, R.J.; Truffer, M. Hubbard glacier, alaska: 2002 closure and outburst of russell fjord and postflood conditions at gilbert point. J. Geophys. Res. 2007, 112, F02004. [Google Scholar] [CrossRef]
- Kotlyakov, V.M.; Rototaeva, O.V.; Nosenko, G.A. The september 2002 kolka glacier catastrophe in north ossetia, russian federation: Evidence and analysis. Mt. Res. Dev. 2004, 24, 78–83. [Google Scholar] [CrossRef]
- Sevestre, H.; Benn, D.I. Climatic and geometric controls on the global distribution of surge-type glaciers: Implications for a unifying model of surging. J. Glaciol. 2015, 61, 646–662. [Google Scholar] [CrossRef]
- Kotlyakov, V.M.; Osipova, G.B.; Tsvetkov, D.G. Monitoring surging glaciers of the pamirs, central asia, from space. Ann. Glaciol. 2008, 48, 125–134. [Google Scholar] [CrossRef]
- Shangguan, D.H.; Liu, S.Y.; Ding, Y.J.; Guo, W.Q.; Xu, B.Q.; Xu, J.L.; Jiang, Z.L. Characterizing the may 2015 karayaylak glacier surge in the eastern pamir plateau using remote sensing. J. Glaciol. 2016, 62, 944–953. [Google Scholar] [CrossRef]
- Lv, M.; Guo, H.; Lu, X.; Liu, G.; Yan, S.; Ruan, Z.; Ding, Y.; Quincey, D.J. Characterizing the behaviour of surge- and non-surge-type glaciers in the kingata mountains, eastern pamir, from 1999 to 2016. Cryosphere 2019, 13, 219–236. [Google Scholar] [CrossRef]
- Copland, L.; Sylvestre, T.; Bishop, M.P.; Shroder, J.F.; Seong, Y.B.; Owen, L.A.; Bush, A.; Kamp, U. Expanded and recently increased glacier surging in the karakoram. Arct. Antarct. Alp. Res. 2011, 43, 503–516. [Google Scholar] [CrossRef]
- Round, V.; Leinss, S.; Huss, M.; Haemmig, C.; Hajnsek, I. Surge dynamics and lake outbursts of kyagar glacier, karakoram. Cryosphere 2017, 11, 723–739. [Google Scholar] [CrossRef]
- Bhambri, R.; Hewitt, K.; Kawishwar, P.; Pratap, B. Surge-type and surge-modified glaciers in the karakoram. Sci. Rep. 2017, 7, 15391. [Google Scholar] [CrossRef]
- Steiner, J.F.; Kraaijenbrink, P.D.A.; Jiduc, S.G.; Immerzeel, W.W. Brief communication: The khurdopin glacier surge revisited—Extreme flow velocities and formation of a dammed lake in 2017. Cryosphere 2018, 12, 95–101. [Google Scholar] [CrossRef]
- Mukherjee, K.; Bolch, T.; Goerlich, F.; Kutuzov, S.; Osmonov, A.; Pieczonka, T.; Shesterova, I. Surge-type glaciers in the tien shan (central asia). Arct. Antarct. Alp. Res. 2018, 49, 147–171. [Google Scholar] [CrossRef]
- Pieczonka, T.; Bolch, T. Region-wide glacier mass budgets and area changes for the central tien shan between ~ 1975 and 1999 using hexagon kh-9 imagery. Glob. Planet. Chang. 2015, 1–13. [Google Scholar] [CrossRef]
- Zhang, Z.; Liu, S.; Zhang, Y.; Wei, J.; Jiang, Z.; Wu, K. Glacier variations at aru co in western tibet from 1971 to 2016 derived from remote-sensing data. J. Glaciol. 2018, 64, 397–406. [Google Scholar] [CrossRef]
- Jiang, Z.; Liu, S.; Guo, W.; Li, J.; Long, S.; Wang, X.; Wei, J.; Zhang, Z.; Wu, K. Recent surface elevation changes of three representative glaciers in nyêmaqên mountains, source region of yellow river. J. Glaciol. Geocryol. 2018, 40, 231–237. [Google Scholar]
- Guo, W.Q.; Liu, S.Y.; Wei, J.F.; Bao, W.J. The 2008/09 surge of central yulinchuan glacier, northern tibetan plateau, as monitored by remote sensing. Ann. Glaciol. 2013, 54, 299–310. [Google Scholar] [CrossRef]
- Xu, J.; Shangguan, D.; Wang, J. Three-dimensional glacier changes in geladandong peak region in the central tibetan plateau. Water 2018, 10, 1749. [Google Scholar] [CrossRef]
- Zhang, W. A surging glacier in the nanjiabawa peak area, himalayas. J. Glaciol. Geocryol. 1983, 5, 75–76. [Google Scholar]
- Kääb, A.; Leinss, S.; Gilbert, A.; Bühler, Y.; Gascoin, S.; Evans, S.G.; Bartelt, P.; Berthier, E.; Brun, F.; Chao, W.-A.; et al. Massive collapse of two glaciers in western tibet in 2016 after surge-like instability. Nat. Geosci. 2018, 11, 114–120. [Google Scholar]
- Zhou, Y.S.; Hu, J.; Li, Z.W.; Li, J.; Zhao, R.; Ding, X.L. Quantifying glacier mass change and its contribution to lake growths in central kunlun during 2000-2015 from multi-source remote sensing data. J. Hydrol. 2019, 570, 38–50. [Google Scholar] [CrossRef]
- Wei, J.; Liu, S.; Guo, W.; Xu, J.; Bao, W.; Shangguan, D. Changes in glacier volume in the north bank of the bangong co basin from 1968 to 2007 based on historical topographic maps, srtm, and aster stereo images. Arct. Antarct. Alp. Res. 2015, 47, 301–311. [Google Scholar]
- Wei, J.; Liu, S.; Xu, J.; Guo, W.; Bao, W.; Shangguan, D.; Jiang, Z. Mass loss from glaciers in the chinese altai mountains between 1959 and 2008 revealed based on historical maps, srtm, and aster images. J. Mt. Sci.-Engl. 2015, 12, 330–343. [Google Scholar] [CrossRef]
- Liu, S.; Shangguan, D.; Ding, Y.; Han, H.; Zhang, Y.; Wang, J.; Xie, C.; Ding, L.; Li, G. Variation of glaciers studied on the basis of rs and gis: A reassessment of the changes of the xinqingfeng and malan ice caps in the northern tibetan plateau. J. Glaciol. Geocryol. 2004, 26, 244–252. [Google Scholar]
- Li, B. Nature Environment in the Hoh Xil Region of Qinghai; Science Press: Beijing, China, 1996. [Google Scholar]
- Xie, Z.; Han, J.; Feng, Q.; Wang, X. Primary study on the glaciers of mountain malan, hoh xil region, qinghai-xizang plateau. J. Nat. Sci. Hunan Norm. Univ. 2000, 23, 83–88. [Google Scholar]
- Wang, Y.; Pu, J.; Zhang, Y.; Sun, W. Characteristic of present warming change recorded in malan ice core, central tibetan plateau. J. Glaciol. Geocryol. 2003, 25, 130–134. [Google Scholar]
- GB/T12343.1-2008. Compilation Specifications for National Fundamental Scale Mapse—Part 1: Compilation Specifications for 1:25000/1:50000/1:100000 Topographic Maps; General Administration of Quality Supervision Inspection and Quarantine: Beijing, China, 2008. [Google Scholar]
- Wang, H.; Hu, J.; Tan, Q.; Xu, X. Evaluation of the contour line interpolation generated dems of mountainous area in north china. Contrib. Geol. Miner. Resour. Res. 2014, 29, 433–437. [Google Scholar]
- Liu, L.; Jiang, L.; Jiang, H.; Wang, H.; Ma, N.; Xu, H. Accelerated glacier mass loss (2011–2016) over the puruogangri ice field in the inner tibetan plateau revealed by bistatic insar measurements. Remote Sens. Environ. 2019, 231, 111241. [Google Scholar] [CrossRef]
- Kamp, U.; Bolch, T.; Olsenholler, J. DEM generation from aster satellite data for geomorphometric analysis of cerro sillajhuay, chile/bolivia. In Proceedings of the ASPRS 2003 Annual Conference, Anchorage, AK, USA, 5–9 May 2003. [Google Scholar]
- Krieger, G.; Moreira, A.; Fiedler, H.; Hajnsek, I.; Werner, M.; Younis, M.; Zink, M. Tandem-x: A satellite formation for high-resolution sar interferometry. IEEE Trans. Geosci. Remote Sens. 2007, 45, 3317–3341. [Google Scholar] [CrossRef]
- Costantini, M. A novel phase unwrapping method based on network programming. IEEE Trans. Geosci. Remote Sens. 1998, 36, 813–821. [Google Scholar] [CrossRef]
- Berthier, E.; Arnaud, Y.; Vincent, C.; Rémy, F. Biases of srtm in high-mountain areas: Implications for the monitoring of glacier volume changes. Geophys. Res. Lett. 2006, 33, L08502. [Google Scholar] [CrossRef]
- Gardelle, J.; Berthier, E.; Arnaud, Y. Impact of resolution and radar penetration on glacier elevation changes computed from dem differencing. J. Glaciol. 2012, 58, 419–422. [Google Scholar] [CrossRef]
- Shangguan, D.H.; Bolch, T.; Ding, Y.J.; Kröhnert, M.; Pieczonka, T.; Wetzel, H.U.; Liu, S.Y. Mass changes of southern and northern inylchek glacier, central tian shan, kyrgyzstan, during ∼1975 and 2007 derived from remote sensing data. Cryosphere 2015, 9, 703–717. [Google Scholar] [CrossRef]
- Gardner, A.S.; Moholdt, G.; Scambos, T.; Fahnstock, M.; Ligtenberg, S.; van den Broeke, M.; Nilsson, J. Increased west antarctic and unchanged east antarctic ice discharge over the last 7 years. Cryosphere 2018, 12, 521–547. [Google Scholar] [CrossRef]
- Fahnestock, M.; Scambos, T.; Moon, T.; Gardner, A.; Haran, T.; Klinger, M. Rapid large-area mapping of ice flow using landsat 8. Remote Sens. Environ. 2016, 185, 84–94. [Google Scholar] [CrossRef]
- Sam, L.; Bhardwaj, A.; Kumar, R.; Buchroithner, M.F.; Martin-Torres, F.J. Heterogeneity in topographic control on velocities of western himalayan glaciers. Sci. Rep. 2018, 8, 12843. [Google Scholar] [CrossRef] [PubMed]
- Guo, W.; Liu, S.; Xu, J.; Wu, L.; Shangguan, D.; Yao, X.; Wei, J.; Bao, W.; Yu, P.; Liu, Q.; et al. The second chinese glacier inventory: Data, methods and results. J. Glaciol. 2015, 61, 357–372. [Google Scholar] [CrossRef]
- Wei, J.F.; Liu, S.Y.; Guo, W.Q.; Yao, X.J.; Xu, J.L.; Bao, W.J.; Jiang, Z.L. Surface-area changes of glaciers in the tibetan plateau interior area since the 1970s using recent landsat images and historical maps. Ann. Glaciol. 2014, 55, 213–222. [Google Scholar]
- Nuth, C.; Kääb, A. Co-registration and bias corrections of satellite elevation data sets for quantifying glacier thickness change. Cryosphere 2011, 5, 271–290. [Google Scholar] [CrossRef]
- Fischer, M.; Huss, M.; Hoelzle, M. Surface elevation and mass changes of all swiss glaciers 1980–2010. Cryosphere 2015, 9, 525–540. [Google Scholar] [CrossRef]
- Huss, M. Density assumptions for converting geodetic glacier volume change to mass change. Cryosphere 2013, 7, 877–887. [Google Scholar] [CrossRef]
- Bolch, T.; Pieczonka, T.; Benn, D.I. Multi-decadal mass loss of glaciers in the everest area (nepal himalaya) derived from stereo imagery. Cryosphere 2011, 5, 349–358. [Google Scholar] [CrossRef]
- Lambrecht, A.; Mayer, C.; Wendt, A.; Floricioiu, D.; Volksen, C. Elevation change of fedchenko glacier, pamir mountains, from gnss field measurements and tandem-x elevation models, with a focus on the upper glacier. J. Glaciol. 2018, 64, 637–648. [Google Scholar] [CrossRef]
- Ye, Q.; Zong, J.; Tian, L.; Cogley, J.G.; Song, C.; Guo, W. Glacier changes on the tibetan plateau derived from landsat imagery: Mid-1970s–2000–13. J. Glaciol. 2017, 63, 273–287. [Google Scholar] [CrossRef]
- Wang, Y.; Wu, L.; Xu, J.; Liu, S. Variation and uncertainty analysis of the glaciers in the past 50 years in geladandong of tibetan plateau. J. Glaciol. Geocryol. 2013, 35, 255–262. [Google Scholar]
- Qiao, C. Remote sensing monitoring of glacier changes in dongkemadi region of tanggula mountain. J. Anhui Agric. Sci. 2010, 38, 7703–7705. [Google Scholar]
- Sun, M.; Liu, S.; Yao, X.; Guo, W.; Xu, J. Glacier changes in the qilian mountains in the past half-century: Based on the revised first and second chinese glacier inventory. J. Geogr. Sci. 2018, 28, 206–220. [Google Scholar] [CrossRef]
- Liu, Q.; Guo, W.; Nie, Y.; Liu, S.; Xu, J. Recent glacier and glacial lake changes and their interactions in the bugyai kangri, southeast tibet. Ann. Glaciol. 2015, 51, 61–69. [Google Scholar] [CrossRef]
- Wu, K.; Liu, S.; Guo, W.; Wei, J.; Xu, J.; Bao, W.; Yao, X. Glcier change in the western nyainqentanglha range, tibetan plateau using historical maps and landsat imagery:1970-2014. J. Mt. Sci.-Engl. 2016, 13, 1358–1374. [Google Scholar] [CrossRef]
- Gardner, A.S.; Moholdt, G.; Cogley, J.G.; Wouters, B.; Arendt, A.A.; Wahr, J.; Berthier, E.; Hock, R.; Pfeffer, W.T.; Kaser, G.; et al. A reconciled estimate of glacier contributions to sea level rise: 2003 to 2009. Science 2013, 340, 852–857. [Google Scholar] [CrossRef]
- Neckel, N.; Kropáček, J.; Bolch, T.; Hochschild, V. Glacier mass changes on the tibetan plateau 2003–2009 derived from icesat laser altimetry measurements. Environ. Res. Lett. 2014, 9, 1–7. [Google Scholar] [CrossRef]
- Sakai, A.; Nuimura, T.; Fujita, K.; Takenaka, S.; Nagai, H.; Lamsal, D. Climate regime of asian glaciers revealed by gamdam glacier inventory. Cryosphere 2015, 9, 865–880. [Google Scholar] [CrossRef]
- Falaschi, D.; Bolch, T.; Lenzano, M.G.; Tadono, T.; Lo Vecchio, A.; Lenzano, L. New evidence of glacier surges in the central andes of argentina and chile. Prog. Phys. Geogr. Earth Environ. 2018, 42, 792–825. [Google Scholar] [CrossRef]
- Quincey, D.J.; Glasser, N.F.; Cook, S.J.; Luckman, A. Heterogeneity in karakoram glacier surges. J. Geophys. Res. Earth Surf. 2015, 120, 1288–1300. [Google Scholar] [CrossRef]
- Clarke, G.K.C.; Collins, S.G.; Thompson, D.E. Flow, thermal structure, and subglacial conditions of a surge-type glacier. Can. J. Earth Sci. 1984, 21, 232–240. [Google Scholar] [CrossRef]
- Murray, T.; Stuart, G.W.; Miller, P.J.; Woodward, J.; Smith, A.M.; Porter, P.R.; Jiskoot, H. Glacier surge propagation by thermal evolution at the bed. J. Geophys. Res. 2000, 105, 13491. [Google Scholar] [CrossRef]
- Fowler, A.C.; Murray, T.; Ng, F.S.L. Thermally controlled glacier surging. J. Glaciol. 2001, 47, 527–538. [Google Scholar] [CrossRef]
- Sevestre, H.; Benn, D.I.; Hulton, N.R.J.; Baelum, K. Thermal structure of svalbard glaciers and implications for thermal switch models of glacier surging. J. Geophys. Res. Earth Surf. 2015, 120, 2220–2236. [Google Scholar] [CrossRef]
- Kamb, B.; Raymond, C.F.; Harrison, W.D.; Engelhardt, H.; Echelmeyer, K.A.; Humphrey, N.; Brugman, M.M.; Pfeffer, T. Glacier surge mechanism—1982-1983 surge of variegated glacier, alaska. Science 1985, 227, 469–479. [Google Scholar] [CrossRef]
- Björnsson, H. Hydrological characteristics of the drainage system beneath a surging glacier. Nature 1998, 395, 771–774. [Google Scholar] [CrossRef]
- Burgess, E.W.; Forster, R.R.; Larsen, C.F.; Braun, M. Surge dynamics on bering glacier, alaska, in 2008-2011. Cryosphere 2012, 6, 1251–1262. [Google Scholar] [CrossRef]
- Lingle, C.S.; Fatland, D.R. Does englacial water storage drive temperate glacier surges? Ann. Glaciol. 2003, 36, 14–20. [Google Scholar] [CrossRef]
- Wang, N. Variations in net accumulation rate of the malan ice core from the northern tibetan plateau over the period of 1887 though 1998 and their relationship to solar activity. Quat. Sci. 2009, 29, 913–919. [Google Scholar]
- Pu, J.; Yao, T.; Wang, N.; Ding, L.; Zhang, Q. Recent variation of the malan glacier in hoh xil region of the tibetan plateau. J. Glaciol. Geocryol. 2001, 23, 189–192. [Google Scholar]
- Bolch, T.; Kulkarni, A.; Kaab, A.; Huggel, C.; Paul, F.; Cogley, J.G.; Frey, H.; Kargel, J.S.; Fujita, K.; Scheel, M.; et al. The state and fate of himalayan glaciers. Science 2012, 336, 310–314. [Google Scholar] [CrossRef]


© 2020 by the authors. Licensee MDPI, Basel, Switzerland. This article is an open access article distributed under the terms and conditions of the Creative Commons Attribution (CC BY) license (http://creativecommons.org/licenses/by/4.0/).