Abstract
Illegal open-pit mining causes environmental harm and undermines sustainable development. Conventional monitoring approaches such as field research and unmanned aerial vehicle (UAV) imagery are time-consuming and labor-intensive, making large-scale monitoring difficult. In comparison, optical remote sensing imagery can cover large areas but is vulnerable to adverse weather conditions and is not sensitive to vertical ground changes. As open-pit excavation causes sudden changes in the scattering properties of ground objects along with dramatic vertical deformation, we evaluated the feasibility of using interferometric synthetic aperture radar (InSAR) coherence to identify illegal mining activities. Our method extracts the coherence coefficient from two SAR images taken on different dates, applies thresholding and filtering to extract a decorrelation map, and then overlays this with legal mining boundaries and optical satellite images to identify illegal mining activities. For three test cases in southwestern Inner Mongolia, China, 49 legal mining sites were correctly detected (with an accuracy of 90.74%) as well as six illegal mining sites. Ground truthing confirmed the presence of ongoing activity at one of these sites. Our study shows that InSAR coherence is suitable for the identification of mining activities, and our method provides a new approach for the detection and monitoring of illegal open-pit mining.
1. Introduction
Mineral resources are an important aspect of economic development, playing an important role in urbanization, infrastructure construction, and national security [1]. China’s ongoing emphasis on environment protection and structural reforms on the supply side has led to revised coal industry policies, resulting in the shutting down of mines with out-of-date production methods [2,3,4]. However, high demand has led to extensive illegal activities, such as unlicensed mining, operations in unauthorized areas, and extraction beyond permissible amounts [5,6]. These practices can cause serious environmental problems while degrading national mineral resource stocks [7]. Unlike underground mines, surface mines are usually more profitable due to easier and lower-cost exploitation. Open-pit mines are, therefore, more susceptible to illegal activities, requiring effective monitoring. Conventional approaches such as field research and monitoring using unmanned aerial vehicles (UAVs) are time-consuming, labor-intensive, and difficult to apply at a large scale. In comparison, surface change detection using optical satellite images can facilitate monitoring on a large scale, yet optical images are susceptible to adverse weather conditions as well as sun illumination. Additionally, most of these methods are two-dimensional, making it impossible to detect the vertical changes caused by open-pit mining. Worse still, to avoid surveillance, many illegal mining activities are undertaken at night, making them even more difficult to detect remotely. Therefore, we are in urgent need of a new approach to address such a problem.
Synthetic aperture radar interferometry (InSAR) can enable both high-resolution and large-scale ground monitoring while, at the same time, is not susceptible to adverse weather conditions or acquisition time. Consequently, this technique is increasingly preferred by researchers. Initially, the technique was mainly applied to three-dimensional (3D) surface reconstruction, mapping, and surface-change detection; later it was broadened to differential InSAR (DInSAR) for motion-based studies of seismic deformation, volcanic motion, glacial drift, urban deformation, landslides, and mining-induced deformation [8,9,10,11,12,13]. So far, several studies utilizing DInSAR in the monitoring of illegal mining have been conducted. For example, [14] designed an underground mining detection system based on DInSAR and [5] integrated both DInSAR and geographical information system (GIS) technology to identify illegal underground mining. However, these studies are specifically targeting underground mining detection as this kind of excavation usually results in gradual surface subsidence, this is easy to detect. For open-pit mines, excavation can easily shift the reflectivity of ground features and cause extensive deformation, resulting in a discontinuous phase of radar echoes, which is termed as decorrelation [15,16]. It acts as a kind of noise and makes DInSAR unsuitable for such an application. To avoid decorrelation, [17] used 18 images from the TerraSAR-X satellite to perform a whole time-series process, which required a significant amount of time and calculation effort as well as financial cost. Offset-tracking techniques [18,19,20] can also be applied to such scenarios, although these are also resource-intensive.
The coherence of repeat-pass SAR images describes the degree of correlation between acquisitions [21]. This evaluates the quality of local interferometric fringes and provides scattering information for ground objects. The generation of coherence map is much easier comparing to InSAR results, thus, this metric has been proved to be efficient as well as versatile and can be applied to many fields including water body recognition [22,23,24,25], disaster monitoring and relief [26,27,28,29], forest biomass extraction [30,31,32,33], target detection, and archeological protection [21,34,35,36,37]. As for mining applications, [38] used coherence maps to identify underground mining-induced surface collapse. [39] mentioned identifying possible illegal mining sites while performing archeological reservations on raw coherence maps, and [40] introduced the coherence map to distinguish abandoned or closed opencast mines from active ones. Therefore, there still lacks a systematic and more focused means for rapid and effective identification of illegal open-pit mining activities.
In this study, we sought to turn the problem of decorrelation into an advantage; as the sudden changes in reflectivity features caused by open-pit mining lead to DInSAR decorrelation, this can become an indicator of mining activity. Thus, we put forward a fine process for identification of illegal excavations, we used SAR data to form coherence maps, after geocoding was performed using digital elevation models, the coherence map of each study area was obtained. We then introduced an adaptive thresholding and filtering method to extract decorrelation areas. By overlaying these analyses with mining right distribution maps, the location of potential legal and illegal mining activities could be detected. In addition, as several factors other than mining activity can also cause decorrelation, optical images were used to ground-truth our analysis outputs and eliminate non-mining-induced decorrelation to finally identify legal and illegal mining activities (Figure 1). We also evaluated our results using mining survey data, comparative experiments, and field research.
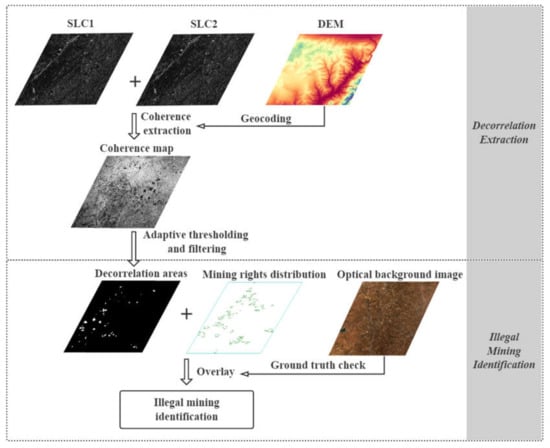
Figure 1.
Workflow for interferometric synthetic aperture radar (InSAR) coherence identification of illegal open-pit mining activity.
2. Materials and Methods
2.1. Study Area
The Chinese region of Ordos City in southwestern Inner Mongolia covers 87,000 km2, up to 70% of which overlays coal deposits with proven reserves of 150.1 billion t, which accounts for 1/6 of national coal reserves [41,42]. By the end of 2014, there were 332 mine sets in this area, including 139 open-pit mines [43], providing an ideal area to conduct this study. Three study areas with different ground features were chosen to apply our identification scheme to evaluate the feasibility of illegal mining identification using InSAR coherence under different ground conditions. Study area A (39.767°N~40.051°N; 109.835°E~110.156°E) is mainly an urban region with intense human activity, study area B (39.283°N~39.669°N; 110.488°E~110.855°E) is dominated by mountainous terrain, and study area C (39.472°N~39.925°N; 110.106°E~110.486°E) is also mountainous with fluvial influences (Figure 2). Study area B and C exhibit little human activity but large vegetation coverage, but our experiment was conducted in winter and the optical images showed little vegetation existence due to defoliation.
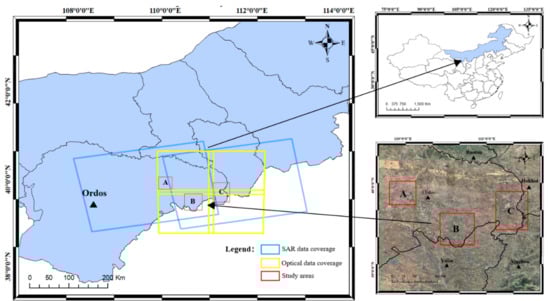
Figure 2.
Data coverage and the location of the study areas. Red, blue and yellow rectangles represent the coverage of study areas, synthetic aperture radar (SAR), and optical data, respectively.
2.2. Input Data
We acquired four SAR images from the European Space Agency’s (ESA) Sentinel-1 Interferometric Wide (IW) swath platform, which has a wide coverage area, appropriate resolution, and a revisit interval of 12 d [44]. Such a short revisit window is good for change detection as it can minimize the impact of other decorrelation sources. The four SAR images formed two pairs (2017-11-07–2017-11-19, 2017-11-14–2017-11-26) for coherence extraction. In addition, we acquired four optical images from the ESA’s Sentinel-2 platform. Of the 13 bands available, the red, green, and blue bands at a 10-m resolution were most suitable for ground object identification [45]. Cloud coverage in the optical images was less than 5%, making the effects of such interference minimal. To avoid errors caused by differences in the acquisition date between the datasets, the selected optical images were obtained during SAR acquisitions on 20 November 2017 (Table 1). Besides, NASA’s Shuttle Radar Topography Mission (SRTM), the digital elevation model (DEM) was used for SAR data geocoding [46]. The mining rights distribution map for 2017 was obtained from Henan Institute of Geological Survey, China.

Table 1.
SAR and multispectral imagery used in this study.
2.3. Coherence and Decorrelation
The coherence coefficient (γ), a quantitative representation of coherence, is expressed as
where M and S are SAR acquisitions, * indicates the complex conjugate, m and n are the window sizes of the local window, and (i, j) are the pixel coordinates. The value of γ ranges from 0 (decorrelated) to 1 (fully correlated).
Coherence is affected by many factors and can be generalized as follows [16]:
where is thermal noise decorrelation, is Doppler centroid decorrelation, is data processing decorrelation, mainly because of image misregistration, these three factors affect the entire scene of data, making little difference to the local decorrelation [47]. is temporal decorrelation, is geometric decorrelation, is the volumetric scattering decorrelation, these three factors matter in our study. Temporal decorrelation is caused by surface changes between SAR acquisitions [48,49]. In this study, the excavation of open-pit mines changes the reflection characteristics of ground objects over a short time period, thereby introducing decorrelation. Geometric decorrelation is caused by changes in the looking angle of the sensor, causing the acquisition of non-overlapping bands of the ground wavenumber spectra [50]. Volumetric decorrelation is usually caused by volume scattering due to vegetation coverage. These two factors also need to be eliminated while identifying excavation. Therefore, we introduced an optical image in our study for ground truth checking to address such a problem.
2.4. Decorrelation Extraction
The two sets of SAR data were preprocessed with a 5 × 1 multi-looking scale and coherence determined with a 3 × 3 window. After geocoding using a Shuttle Radar Topography Mission (SRTM) digital elevation model (DEM), we obtained a coherence map for the study region from which the study areas were extracted (Table 2). Open-pit excavation brings the coherence coefficient of these areas significantly lower than in the surroundings, identifiable as a darker color as shown in the coherence maps in Table 2. Based on this, Otsu’s automatic thresholding algorithm was applied to identify the decorrelation areas [51]. As a classic image segmentation threshold method, this technique analyzes the maximum inter-class variance of the difference between an image target and the image background and obtains the optimal threshold. Since this ignores the influences of non-gray values, it is a simple yet efficient tool that is widely used in digital image processing fields. For images with a single-peaked histogram, such as the coherence map in this case (“Histogram” in Table 2), Otsu algorism shows a better thresholding performance.
Table 2.
Refining process for coherence maps of the study areas.
In each case, the segmentation threshold for an image target and background is set to , and the variance between these classes is denoted by , thus
where is the proportion of pixels in the target with an average gray value of , and is the proportion of background pixels with an average gray value of . The traversal method is then used to maximize the inter-class variance, , to derive the optimal threshold . Since the decorrelation areas occupied a relatively small portion of the coherence map, here, was assigned with an impact factor of 0.6 to obtain the decorrelated areas. These areas were set as white in the resulting maps to improve the identification in the subsequent overlays (“thresholding” in Table 2).
Due to the large coverage of each threshold map, using a smaller sized median filter window cannot eliminate noise properly, too large sized window will erase some of the decorrelation areas. After a few tryouts, a median window (25 × 25) brought reasonable results and were used to remove noise speckles while still retaining the decorrelated areas (“median filtering” in Table 2).
2.5. Illegal Mining Identification
Once decorrelation maps had been extracted, they were overlaid with the mining rights distribution map to discriminate legal and illegal excavations. However, the mining rights map describes permitted mining areas stipulated by law rather than actual excavation areas. Therefore, we needed to distinguish open-pit mining-induced decorrelation from other factors from optical imagery. Here, Sentinel-2A optical images were introduced and subjected to atmospheric correction, resampling, and band re-composure, which were then used for ground-truthing. Here automated classification methods can be adopted including supervised/unsupervised classification, support vector machines (SVMs), deep learning, and computer vision algorithms. However, the classification accuracy of these approaches is never perfect. Thus, to avoid introducing further error, and given the decorrelation areas were not too numerous, we identified the decorrelation areas manually on the optical images.
We processed Sentinel 2 optical images by radiometric calibration and atmospheric correction, selected the red, blue, and green bands to form a 10 m resolution map of the study areas, and then overlaid this with the decorrelation maps (30% transparency) and the mining rights distribution map to identify both legal and illegal open-pit mine excavations. The discrimination process is shown schematically in Figure 3. For the identification of illegal mining sites, the decorrelation map, optical image, and mining rights distribution map were all necessary; the decorrelation maps were used to identify ground changes, the optical images were used for ground-truthing, and the mining rights distribution maps were used to determine whether the identified excavations are legal or illegal. Any decorrelated areas corresponding to open-pit mines in the optical images must have experienced excavation between the two SAR acquisitions. Any such areas that did not correlate with legal mining rights were subsequently classified as illegal mining sites.
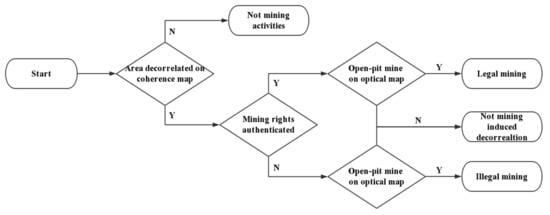
Figure 3.
Workflow for identifying illegal mining using overlaid maps.
3. Results and Discussion
Figure 4 shows the optical maps overlaid with the decorrelation maps (with 30% transparency) and the mining rights distribution map, using different colors to represent different mineral deposits.
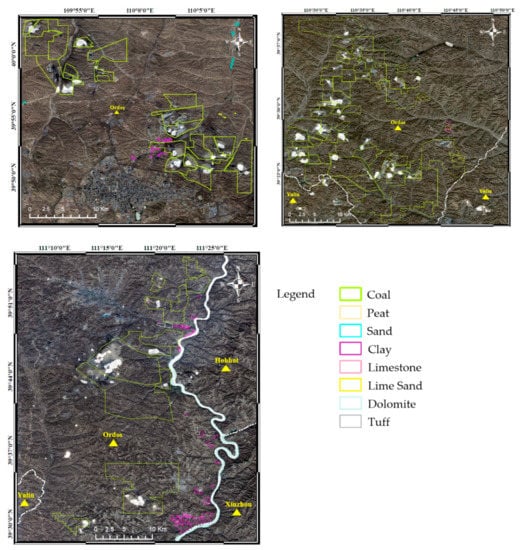
Figure 4.
Overlay maps of decorrelation, mining rights, and optical imagery.
As we only obtained the mining right distribution map for Ordos, other cities were not taken into consideration in this study, even where decorrelation occurred. Using the mining rights distribution, we found that, in general, the size of open-pit coal mines was larger than other kinds of mines. All the study areas were dominated by open-pit coal mines, with a few other types of mine scattering around them. Most of the decorrelation that occurred in study area A and B lay inside the mining right boundaries and were correlated with visible open-pit mines. With a river running through study area C and given the absorption of radar echoes by water, a large area of linear decorrelation was found here. After acquiring the overlay map, we manually check the optical mapping of each corresponding decorrelated area to produce an illegal mining identification map (Figure 5). To verify the results, we used the mining survey data for Ordos (acquired from Henan Institute of Geological Survey, China), which indicated the actual areas of excavation in November (shown in Figure 5 with red boundaries).
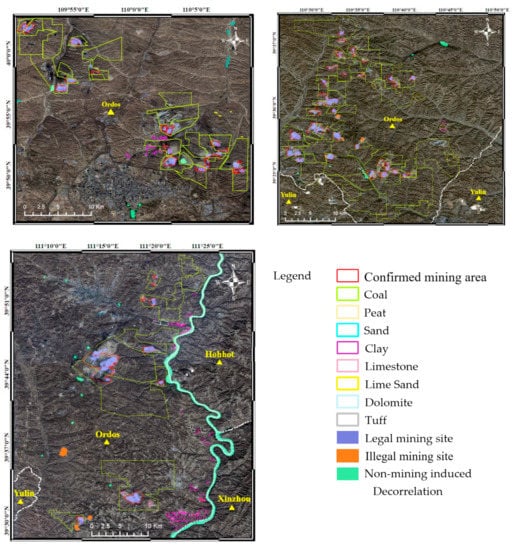
Figure 5.
Illegal mining areas identification map for the three study areas overlaid with mining survey data indicating actual areas of excavation.
Across all the study areas, our method identified 81 decorrelation areas. Based on visual inspection, 60 of these were open-pit mines with 54 laying inside the mining rights boundaries and were, thus, identified as legal mining areas. The remaining six areas were not located inside the legal boundaries and were, therefore, defined as illegal mining sites. In addition, 21 decorrelation areas were not classified as open-pit mines, being water bodies, vegetation, or topographically low areas. To verify the results further, we considered the mining survey data to represent the actual areas of excavation (red circles in Figure 5). As the resolution of SAR data is not high, decorrelation areas, and the confirmed excavation site boundaries do not fit perfectly. Given our study is to define whether the excavation is illegal or not, so if decorrelation appears in the confirmed mining areas, we assume this site is well verified. In this way, a total of 49 of the identified legal mining sites corresponded to actual excavation sites on the survey map, representing an identification accuracy of 90.74%. However, our method identified five excavation areas that did not appear on the survey data. Eight sites were miss identified. Detailed statistics for each study area are shown in Table 3.
Table 3.
Identification results and verification statistics for mining sites in the three study areas.
The identification accuracy of each study area was higher than 80%; however, the miss rate in study area C was not negligible at 35.71%. This was because of four small-scale existing actual mining sites sited along the river. Such small-scale excavation was not easily detected using the 20-m resolution SAR images and, even if detected, would have likely been filtered out by the median filter method. Higher-resolution SAR data would be needed to address this problem. In addition, these small-sized sites were other kinds of open-pit mines (i.e., not coal mines). Thus, when only considering coal mining as the predefined target mine type, the miss rate for study area C was 10%, and the overall miss rate across all three sites is reduced to just 7.55%. With respect to the illegal mining sites we identified, five out of the six sites were located adjacent to known mining rights boundaries (three in middle left part of study area B and two in the lower left part of study area C). These illegal mining sites reflect the common occurrence of mining beyond authorized areas, with only one of the illegal sites being located far from the existing mining rights boundaries.
It was clear from our analysis that mining activities during the monitoring period focused on open-pit coal mining rather than other types of mining. There are two main reasons for this, namely weather conditions and the relationship between supply and demand. Ordos lies in a high-latitude and high-altitude region with an average temperature in November below 0 °C and strong winds. Such unfavorable weather conditions usually prevent most excavations. However, coal has accounted for approximately 70% of China’s energy consumption for several years [52], leading to a significant increase in demand. In addition, in November, China’s regional central heating begins and continues for the following four months, and 90% of the energy consumed by regional central heating comes from coal [53]. Therefore, in the case of most open-pit coal mines, during winter, excavation continues to meet the needs of energy supply.
To rule out the possibility that decorrelation extracted using our method was caused by the ground features of open-pit mines themselves rather than excavation, a comparative test case was designed and carried out for study area B. For this, two further SAR images (with the same time interval as in the 2017 analysis) were obtained for 2018 (Table 4) and analyzed using the same techniques for comparison (Table 5).
Table 4.
Summary of datasets used for comparative testing.
Table 5.
Comparison result.
16 February 2018, was a Chinese traditional Spring Festival, marking the beginning of the Spring Festival vacation that lasts 7–15 days for most industries when mining activities had mostly ceased. As shown in Table 5, the coherence map during this period showed a higher overall coherence coefficient. Most of the low coherence regions (dark regions) in the previous analysis showed good coherence in the comparative test. By comparing the decorrelation maps, the results were more distinct; only four decorrelation areas were extracted during the Spring Festival and two of them, laying in the upper right areas, were caused by topographical factors and were consistent with the previous analysis. This left two other decorrelation areas that are attributed to excavation. From the comparative test, we could determine that when the excavation of most of the open-pit mines was suspended (due to the Spring Festival), the ground features of open-pit mines did not produce decorrelation. Thus, the possibility of the ground features of open-pit mines causing decorrelation was eliminated.
To verify the identified illegal mining sites, a UAV-equipped field research team visited the three detected illegal mining sites in study area B and collected ground-based and aerial imagery soon after the remote sensing analysis. However, ongoing illegal mining was detected in only one of the sites. Here, several digging excavators and moving trucks fully loaded with coal were recorded (Figure 6a–d). Figure 6e,f also showed UAV images of coal piles, excavation tracks, and various other equipment demonstrating the existence of the ongoing illegal mining activity.
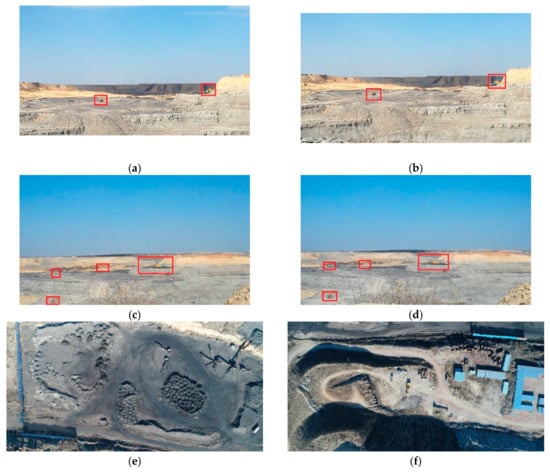
Figure 6.
Field photos of possible illegal mining activity in study area B: (a–d) ground-based video frames of excavators and moving trucks; (e–f) unmanned aerial vehicle (UAV) images of coal piles and other mining equipment.
Although our field research only confirmed illegal mining at one of the three potential sites in study area B, this does not necessarily indicate that our approach is deficient or that illegal mining is not active at the other sites. All three areas must have experienced some ground deformation during the monitoring period, which led to the decorrelation. Indeed, most illegal mining is conducted secretively. It is, therefore, possible that illegal mining is occurring at these sites but that this was not detected in the field. Due to satellite revisit intervals, it is not yet possible to achieve real-time monitoring. For illegal mining, such activity must be detected as soon as possible to minimize its damage. The smallest data acquisition time-window possible would, therefore, be favorable (12 days for Sentinel-1), and shorter SAR intervals could be applied. Alternatively, different SAR datasets for the same areas could be used to fill the time gaps, although this introduces data compatibility issues and requires further study.
4. Conclusions
Although decorrelation is often a barrier to DInSAR application, we used this as an advantage for identifying active excavations related to open-pit mining. Using the coherence of just two SAR images avoids complicated DInSAR calculations and improves processing efficiency. Our case study in southwestern Inner Mongolia successfully identified 49 legal mining sites with an overall accuracy of 90.74% and commission error of 9.26%. Although the overall miss rate was 14.04%, considering only open-pit coal mines, the miss rate was just 7.55%. Across all the three study areas, six illegal mining sites were identified and in study area B, at which ongoing illegal mining activity was confirmed at one site.
Overall, our work shows the feasibility of using InSAR coherence to identify illegal mining activity. The extraction results in three distinct study areas illustrate the applicability of our method in different scenarios and can be applied to other areas suffering from illegal mining. Certain difficulties remain, however. To extract illegal excavation from InSAR coherence, the intervals between SAR acquisitions cannot be too long, or other ground feature changes than excavation (i.e., defoliation due to seasonal change) could blend in, making it harder for our method to be implemented. Besides, due to SAR data resolution limitations, very small-scale open-pit mining may not be detected using our method, to address this problem higher-resolution SAR data are needed. Another limitation of the developed approach is that it was only intended to identify the locations of illegal mining activity rather than its extent. Further study is, therefore, needed to further develop these methods to quantitatively evaluate open-pit mining extent using SAR data. As well as adopting a broader range of datasets and focusing on the development of a time-series surveillance system for better monitoring of excavation activity.
Author Contributions
S.W., X.L., Z.C., and G.Z. designed the experiments; S.W. performed the experiments, analyzed the data and wrote the original draft; T.M. performed the field research. All the authors contributed to the preparation and revision of this paper. All authors have read and agreed to the published version of the manuscript.
Funding
This research was supported by the China Geological Survey’s program “National Remote Sensing Monitoring of Mineral Resources Development (No. DD20160075),” “Recovery Monitoring of New Mines in 2017 (No. DD20189805),” “Geological Survey and Monitoring of Mines Using Remote Sensing (No. DD20190511)” and “Jilin province science and technology development plan (No.20170204036SF).”
Acknowledgments
We thank the European Union Copernicus program for providing Sentinel-1 and Sentinel-2 data. We also thank the Henan Institute of Geological Survey for the mining rights distribution and mining survey data and their filed research team’s efforts. Finally, we thank the anonymous reviewers for their constructive feedback.
Conflicts of Interest
The authors declare no conflict of interest.
References
- Shen, L.; Andrews-Speed, P. Economic analysis of reform policies for small coal mines in China. Resour. Policy 2001, 27, 247–254. [Google Scholar] [CrossRef]
- Amankwah, H.; Larsson, T.; Textorius, B. Open-pit mining with uncertainty: A conditional value-at-risk approach. In Optimization Theory, Decision Making, and Operations Research Applications, Proceedings of the 1st International Symposium and 10th Balkan Conference on Operational Research, Thessaloniki, Greece, 22–25 September 2011; Springer: New York, NY, USA, 2013; pp. 117–139. [Google Scholar]
- Wang, J.; Kang, H.; Liu, J.; Chen, P.; Fan, Z.; Yuan, W.; Liu, Y. Layout strategic research of green coal resource development in China. J. China Univ. Min. Technol. 2018, 47, 15–20. (In Chinese) [Google Scholar]
- Wang, D.; Nie, R.; Long, R.; Shi, R.; Zhao, Y. Scenario prediction of China’s coal production capacity based on system dynamics model. Resour. Conserv. Recycl. 2018, 129, 432–442. [Google Scholar] [CrossRef]
- Xia, Y.; Wang, Y.; Du, S.; Liu, X.; Zhou, H. Integration of D-InSAR and GIS technology for identifying illegal underground mining in Yangquan District, Shanxi Province, China. Environ. Earth Sci. 2018, 77, 319. [Google Scholar] [CrossRef]
- Singh, P.; Chaulya, S.K.; Singh, V.K.; Ghosh, T.N. Motion detection and tracking using microwave sensor for eliminating illegal mine activities. In Proceedings of the 2018 3rd International Conference on Microwave and Photonics (ICMAP), Dhanbad, India, 9–11 February 2018; IEEE: Piscataway, NJ, USA, 2018; pp. 1–5. [Google Scholar] [CrossRef]
- Ananda, I.N.; Aswari, F.V.; Narmaningrum, D.A.; Nugraha, A.S.A.; Asidiqi, M.A.A.; Setiawan, Y. Modeling of erosion on Jelateng watershed using USLE method, associated with an illegal mining activities (PETI). IOP Conf. Ser. Earth Environ. Sci. 2016, 47, 012025. [Google Scholar] [CrossRef]
- Rosen, P.A.; Hensley, S.; Joughin, I.R.; Li, F.K.; Madsen, S.N.; Rodriguez, E.; Goldstein, R.M. Synthetic aperture radar interferometry. Proc. IEEE 2000, 88, 333–382. [Google Scholar] [CrossRef]
- Simons, M.; Rosen, P.A. Interferometric synthetic aperture radar geodesy. Treatise Geophys. 2007, 3, 391–446. [Google Scholar]
- Zhu, J.; Li, Z.; Hu, J. Research progress and methods of InSAR for deformation monitoring. Acta Geod. Cartogr. Sin. 2017, 46, 1717–1733. [Google Scholar]
- Ben Hassen, M.; Rebai, N.; Deffontaines, B.; Turki, M.M.; Chaabani, F. Phosphate mine subsidences deduced from differential interferometry (DInSAR): The Moulares case example (southern Atlas of Tunisia). C. R. Geosci. 2011, 343, 729–737. [Google Scholar] [CrossRef]
- Chang, H.C.; Ge, L.; Rizos, C. DInSAR for Mine Subsidence Monitoring Using Multi-Source Satellite Sar Images. In Proceedings of the 2005 IEEE International Geoscience and Remote Sensing Symposium, Seoul, Korea, 29 July 2005; IEEE: Piscataway, NJ, USA, 2005; pp. 1742–1745. [Google Scholar] [CrossRef]
- Temporim, F.A.; Gama, F.F.; Paradella, W.R.; Mura, J.C.; Silva, G.G.; Santos, A.R. Spatiotemporal monitoring of surface motions using DInSAR techniques integrated with geological information: A case study of an iron mine in the Amazon region using TerraSAR-X and RADARSAT-2 data. Environ. Earth Sci. 2018, 77, 688. [Google Scholar] [CrossRef]
- Hu, Z.; Ge, L.; Li, X.; Chris, R. Designing an Illegal Mining Detection System based on DinSAR. In Proceedings of the 2010 IEEE International Geoscience and Remote Sensing Symposium, Honolulu, HI, USA, 25–30 July 2010; IEEE: Piscataway, NJ, USA, 2010; pp. 3952–3955. [Google Scholar] [CrossRef]
- Gens, R.; Genderen, J.L.V. Review Article SAR interferometry—Issues, techniques, applications. Int. J. Remote Sens. 1996, 17, 1803–1835. [Google Scholar] [CrossRef]
- Zebker, H.A.; Villasenor, J. Decorrelation in interferometric radar echoes. IEEE Trans. Geosci. Remote Sens. 1992, 30, 950–959. [Google Scholar] [CrossRef]
- Hartwig, M.E.; Paradella, W.R.; Mura, J.C. Detection and Monitoring of Surface Motions in Active Open Pit Iron Mine in the Amazon Region, Using Persistent Scatterer Interferometry with TerraSAR-X Satellite Data. Remote Sens. 2013, 5, 4719–4734. [Google Scholar] [CrossRef]
- Fan, H.; Gao, X.; Yang, J.; Deng, K.; Yu, Y. Monitoring Mining Subsidence Using A Combination of Phase-Stacking and Offset-Tracking Methods. Remote Sens. 2015, 7, 9166–9183. [Google Scholar] [CrossRef]
- Yang, Z.; Li, Z.; Zhu, J.; Preusse, A.; Yi, H.; Hu, J.; Feng, G.; Papst, M. Retrieving 3-D Large Displacements of Mining Areas from a Single Amplitude Pair of SAR Using Offset Tracking. Remote Sens. 2017, 9, 338. [Google Scholar] [CrossRef]
- Ou, D.; Tan, K.; Du, Q.; Chen, Y.; Ding, J. Decision Fusion of D-InSAR and Pixel Offset Tracking for Coal Mining Deformation Monitoring. Remote Sens. 2018, 10, 1055. [Google Scholar] [CrossRef]
- Tapete, D.; Cigna, F. COSMO-SkyMed SAR for Detection and Monitoring of Archaeological and Cultural Heritage Sites. Remote Sens. 2019, 11, 1326. [Google Scholar] [CrossRef]
- Brisco, B.; Ahern, F.; Murnaghan, K.; White, L.; Canisius, F.; Lancaster, P. Seasonal Change in Wetland Coherence as an Aid to Wetland Monitoring. Remote Sens. 2017, 9, 158. [Google Scholar] [CrossRef]
- Chaabani, C.; Chini, M.; Abdelfattah, R.; Hostache, R.; Chokmani, K. Flood Mapping in a Complex Environment Using Bistatic TanDEM-X/TerraSAR-X InSAR Coherence. Remote Sensing. Remote Sens. 2018, 10, 1873. [Google Scholar] [CrossRef]
- Van der Sanden, J.J.; Short, N.H.; Drouin, H. InSAR coherence for automated lake ice extent mapping: TanDEM-X bistatic and pursuit monostatic results. Int. J. Appl. Earth Obs. Geoinf. 2018, 73, 605–615. [Google Scholar] [CrossRef]
- Canisius, F.; Brisco, B.; Murnaghan, K.; Kooij, M.; Keizer, E. SAR Backscatter and InSAR Coherence for Monitoring Wetland Extent, Flood Pulse and Vegetation: A Study of the Amazon Lowland. Remote Sens. 2019, 11, 720. [Google Scholar] [CrossRef]
- Ryo, N.; Hiroto, N.; Naoya, T.; Takeo, T. Sensitivity and limitation in damage detection for individual buildings using insar coherence—A case study in 2016 kumamoto earthquakes. Remote Sens. 2018, 10, 245. [Google Scholar] [CrossRef]
- Chini, M.; Pelich, R.; Pulvirenti, L.; Pierdicca, N.; Hostache, R.; Matgen, P. Sentinel-1 InSAR Coherence to Detect Floodwater in Urban Areas: Houston and Hurricane Harvey as A Test Case. Remote Sens. 2019, 11, 107. [Google Scholar] [CrossRef]
- Donnellan, A.; Parker, J.; Milliner, C.; Farr, T.G.; Glasscoe, M.; Lou, Y.; Zheng, Y.; Hawkins, B. UAVSAR and optical analysis of the Thomas fire scar and Montecito debris flows: Case study of methods for disaster response using remote sensing products. Earth Space Sci. 2018, 5, 339–347. [Google Scholar] [CrossRef]
- Plank, S. Rapid Damage Assessment by Means of Multi-Temporal SAR—A Comprehensive Review and Outlook to Sentinel-1. Remote Sens. 2014, 6, 4870–4906. [Google Scholar] [CrossRef]
- Zhang, H.; Wang, C.; Zhu, J.; Fu, H.; Xie, Q.; Shen, P. Forest Above-Ground Biomass Estimation Using Single-Baseline Polarization Coherence Tomography with P-Band PolInSAR Data. Forests 2018, 9, 163. [Google Scholar] [CrossRef]
- Cartus, O.; Santoro, M.; Schmullius, C.; Li, Z. Large area forest stem volume mapping in the boreal zone using synergy of ERS-1/2 tandem coherence and MODIS vegetation continuous fields. Remote Sens. Environ. 2011, 115, 931–943. [Google Scholar] [CrossRef]
- Pinto, N.; Simard, M.; Dubayah, R. Using InSAR Coherence to Map Stand Age in a Boreal Forest. Remote Sens. 2013, 5, 42–56. [Google Scholar] [CrossRef]
- Chen, H.; Cloude, S.R.; Goodenough, D.G. Forest Canopy Height Estimation Using Tandem-X Coherence Data. IEEE J. Sel. Top. Appl. Earth Obs. Remote Sens. 2016, 9, 3177–3188. [Google Scholar] [CrossRef]
- Tapete, D.; Cigna, F. SAR for Landscape Archaeology; Springer: Cham, Switzerland, 2017; pp. 101–116. [Google Scholar]
- Cigna, F.; Tapete, D. Tracking Human-Induced Landscape Disturbance at the Nasca Lines UNESCO World Heritage Site in Peru with COSMO-SkyMed InSAR. Remote Sens. 2018, 10, 572. [Google Scholar] [CrossRef]
- Corbane, C.; Lemoine, G.; Pesaresi, M.; Kemper, T.; Sabo, F.; Ferri, S.; Syrris, V. Enhanced automatic detection of human settlements using Sentinel-1 interferometric coherence. Int. J. Remote Sens. 2018, 39, 842–853. [Google Scholar] [CrossRef]
- Marco, C.; Ramona, P.; Renaud, H.; Patrick, M.; Carlos, L.M. Polarimetric and Multitemporal Information Extracted from Sentinel-1 Sar Data to Map Buildings. In Proceedings of the 2018 IEEE International Geoscience and Remote Sensing Symposium, Valencia, Spain, 22–27 July 2018; IEEE: Piscataway, NJ, USA, 2018; pp. 8132–8134. [Google Scholar] [CrossRef]
- Zhao, C.; Lu, Z.; Zhang, Q.; Yang, C.; Zhu, W. Mining collapse monitoring with SAR imagery data: A case study of Datong mine, China. J. Appl. Remote Sens. 2014, 8, 083574. [Google Scholar] [CrossRef]
- Tapete, D.; Cigna, F.; Masini, N.; Lasaponara, R. Prospection and monitoring of the archaeological heritage of Nasca, Peru, with ENVISAT ASAR. Archaeol. Prospect. 2013, 20, 133–147. [Google Scholar] [CrossRef]
- Chatterjee, R.S.; Lakhera, R.C.; Dadhwal, V.K. InSAR coherence and phase information for mapping environmental indicators of opencast coal mining: A case study in Jharia Coalfield, Jharkhand, India. Can. J. Remote Sens. 2010, 36, 361–373. [Google Scholar] [CrossRef]
- Du, Z.; Ge, L.; Li, X.; Alex, H.N. Land Subsidence Characteristics of Ordos Using Differential Interferometry and Persistent Scatterer Interferometry. In Proceedings of the 2015 IEEE International Geoscience and Remote Sensing Symposium, Milan, Italy, 26–31 July 2015; IEEE: Piscataway, NJ, USA, 2015; pp. 314–317. [Google Scholar]
- Ning, S.Z. Coal resources and tectonic division of Ordos Basin. Adv. Mater. Res. 2013, 734–737, 316–319. [Google Scholar] [CrossRef]
- Liu, Y. Hazards treatment and residual coal recovery scheme in Ordos region old goaf. Opencast Min. Technol. 2015, 7, 79–81. [Google Scholar]
- Fiaschi, S.; Mantovani, M.; Frigerio, S.; Pasuto, A.; Floris, M. Testing the potential of Sentinel-1A TOPS interferometry for the detection and monitoring of landslides at local scale (Veneto Region, Italy). Environ Earth Sci. 2017, 76, 492. [Google Scholar] [CrossRef]
- Kumar, P.; Sajjad, H.; Tripathy, B.R.; Ahmed, R.; Mandal, V.P. Prediction of spatial soil organic carbon distribution using Sentinel-2A and field inventory data in Sariska Tiger Reserve. Nat. Hazards 2018, 90, 693–704. [Google Scholar] [CrossRef]
- Rodríguez, E.; Morris, C.S.; Belz, J.E. A global assessment of the SRTM performance. Photogramm. Eng. Remote Sens. 2006, 72, 249–260. [Google Scholar] [CrossRef]
- Malinverni, E.S.; Sandwell, D.T.; Tassetti, A.N.; Cappelletti, L. InSAR decorrelation to assess and prevent volcanic risk. Eur. J. Remote Sens. 2014, 47, 537–556. [Google Scholar] [CrossRef]
- Ma, G.; Zhao, Q.; Wang, Q.; Liu, M. On the Effects of InSAR Temporal Decorrelation and Its Implications for Land Cover Classification: The Case of the Ocean-Reclaimed Lands of the Shanghai Megacity. Sensors 2018, 18, 2939. [Google Scholar] [CrossRef] [PubMed]
- Ahmed, R.; Siqueira, P.; Hensley, S.; Chapman, B.; Bergen, K. A survey of temporal decorrelation from spaceborne L-Band repeat-pass InSAR. Remote Sens. Environ. 2011, 115, 2887–2896. [Google Scholar] [CrossRef]
- Gatelli, F.; Monti, G.A.; Parizzi, F.; Pasquali, P.; Prati, C.; Rocca, F. The Wavenumber Shift in SAR Inter-ferometry. IEEE Trans. Geosci. Remote Sens. 1994, 31, 855–865. [Google Scholar] [CrossRef]
- Otsu, N. A threshold selection method from gray-level histogram. IEEE Trans. Syst. Man Cybern. 1979, 9, 62–66. [Google Scholar] [CrossRef]
- National Bureau of Statistics. China Statistical Yearbook; China Statistics Press: Beijing, China, 2018. [Google Scholar]
- Tsinghua University Building Energy Conservation Research Center. International Energy Agency. District Energy System in China: Options for Optimization and Diversification; Tsinghua University Building Energy Conservation Research Center: Beijing, China, 2018. [Google Scholar]


© 2020 by the authors. Licensee MDPI, Basel, Switzerland. This article is an open access article distributed under the terms and conditions of the Creative Commons Attribution (CC BY) license (http://creativecommons.org/licenses/by/4.0/).