Article

Bringing Earth Observation to Schools with Digital Integrated Learning Environments

Department of Geography, Ruhr-University Bochum, 44801 Bochum, Germany
*
Author to whom correspondence should be addressed.
Remote Sens. 2020, 12(3), 345; https://doi.org/10.3390/rs12030345
Submission received: 19 December 2019 / Revised: 18 January 2020 / Accepted: 19 January 2020 / Published: 21 January 2020
(This article belongs to the Collection Teaching and Learning in Remote Sensing)

Abstract

:
The digital integrated learning environments (ILEs) for earth observation described in this article are bringing the complex topic of earth observation into classrooms. They are intended to give pupils with no prior experience in remote sensing the opportunity to solve tasks with earth observation data by using the same means that professionals have at hand. These learning environments integrate remote sensing tools and background knowledge in a comprehensive e-learning environment. They are tailored for use in schools, whereby the curriculum typically does not include earth observation, teachers are generally not familiar with its concepts, and the technical infrastructure is still not quite ready for digital teaching resources. To make the learning environments applicable, the special demands and obstacles presented by a school environment have to be considered. These obstacles are used to derive the requirements for the use of satellite data in school classes and create classroom resources in terms of technology, didactics, and e-learning. The concept itself was developed ten years ago, and since, then multiple applications have been created and used in classes. Data from an online questionnaire focuses on the specific qualities of the learning modules, enabling us to assess whether the concept works, and where there is need for improvement. The results show that the learning environments are being used, and that they continue to open the minds of pupils and teachers alike to a new perspective on the earth.

1. Introduction

When looking at an image from space, it is most likely the unconventional perspective or the strange colors that make people stop, look, and wonder. Remote sensing professionals, on the other hand, may start to ask about details like the band combination, acquisition modes, or the sensor used. They know that behind this plain, two-dimensional raster of pixels lies a whole world of digital information that is not plainly visible. Opening the door to this world of information in order to look beneath the surface can be overwhelming, and the initial fascination may soon be washed away by indices, feature spaces, and complex software tools.
With an abundance of available earth observing satellites and corresponding data sources, satellite images are blending into our everyday life. While more and more people are actively or passively making use of those information sources, few really know about the background of remote sensing and its applications. In German schools, the subject is barely addressed [1]. This kind of imbalance has been addressed by several activities in the past years, like the Remote Sensing in Schools (abbreviated “FIS” in German) project, or Blickpunkt Fernerkundung (BLIF) [2]. These activities share the approach of introducing the use of digital satellite images in secondary schools. The curriculum in German schools for geography classes explicitly mentions the use of satellite images, but they are seldom used as more than a means to illustrate phenomena discussed in classes or as a less abstract substitute for maps. While printed satellite images fit that purpose very well, they leave the very nature of this rich source of information largely untouched [3]. Earth observation images are data collected from space that contain information on important topics in our everyday lives, and are also invaluable for various scientific questions regarding the complex system which is the planet on which we live. The interdisciplinary nature of earth observation technology and applications addresses a whole range of STEM topics, ranging from analyzing vegetation or natural hazards in biology or geography classes to experiencing the electromagnetic spectrum at work in physics lessons.
However, the potential of earth observation in secondary education goes well beyond offering a broad range of topics. Educating pupils to make decisions based on information derived from diverse media is stated as a requirement in school curricula for geography [4,5]. The decision making process, especially in the natural sciences, is more complex than in everyday lives. Assessing situations like natural disasters requires nonlinear analyses. It requires precise analyses, critical reflection, and the incorporation of expertise and facts [6]. In that regard, satellite images are a perfect training ground for these abilities, since they are not explicit in every way. Interpreting them and deriving data from them for decision making relies on decoding information that is not obviously visible. Moreover, the application of satellite images can be seen in the light of problem-based learning, fostering spatial orientation skills, method competences, and evaluations, as well as practice skills [7].
While these are good reasons why information gathered from earth observing satellites should be incorporated in school curricula, that information is not easily unlocked, since the initially fascinating images will not reveal everything by simple visual analysis alone. They have to be disassembled into more abstract greyscale bands and numbers to make the information they contain accessible.
So how can the initial fascination be maintained while lowering that level of complexity? And how can working with earth observation images be applied in everyday school lessons? In the course of the last 13 years, we have been conducting the Remote Sensing in Schools (FIS) project that addresses this problem from various angles (see Appendix A). The activities of the FIS project range from offering easy-to-follow learning materials to linking earth observation topics to the curricula of secondary schools in Germany and educating teachers about the basics of remote sensing. Those activities are specially designed integrated learning environments (ILEs) that couple means for image analysis with background knowledge about earth observation in a technical framework that offers easy access within the context of everyday school lessons. This article is centered around these integrated learning environments and their core concepts and realization.
As there is still no commonly-accepted definition of “Integrated Learning Environment”, the term is often used interchangeably with “Innovative Learning Environment” or Interactive Learning Environment”, all abbreviated as ILE. It is often used to describe learning on different levels that can happen both via digital resources, as well as in classic classroom situations [8]. When employed in an e-learning context, it characterizes web-based environments that provide digital learning content as well as management tools [9]. There is often no clear distinction between the use of the term and “Learning Management Systems” (LMS), that see widespread use in online education and follow a much more generalized approach. To clear up any confusion and to clarify the way in which the term is used here, it is important to underline that the use of “integration” generally describes a range of tools, functionalities, or methods that are combined or integrated into one entity to serve a common purpose. So, in both technical and didactic domains, it characterizes the meaningful combination of tools, whether technological or didactic, which serve to achieve a certain goal.
The aim of learning environments is to use remote sensing in classes in a way that allows pupils to solve problems through the use of image analyses. Hence, we define the integrated learning environment described herein as:
“A learning module that integrates tools, data as well as background knowledge for earth observation into a system that provides a simple learning infrastructure and is easily accessible for teachers and students alike.”
The basic hypothesis is that if such learning environments are to be successfully used in classes, they need to follow an approach where not the topic of remote sensing itself, but the situation in classrooms, specifies the demands that are to be met by the learning environment.
Considering this, Section 2 of this article will describe these learning modules by first analyzing the obstacles that they are up against. From there, the obstacles will serve as a guideline for the creation of the means to overcome them. After the main demands have been established, the way in which they are addressed will be addressed. This is done in three steps. First, the technical domain will be described, showing how the remote sensing tools have been integrated. Next, the aspects of e-learning that play a crucial role in the learning environments are examined. Finally, the didactic domain will be considered, giving an overview of how the learning process is stimulated and guided.
Section 3 and Section 4 give an insight into whether this demand-driven approach for the creation of the ILEs has been successful in schools. Here, an online questionnaire was used to assess the quality of the learning experience with the learning environments and give insights into whether the adopted approach is applicable, and how often the materials are used. The survey is also used to derive information on how selected ILEs perform from the pupil’s perspective, and what the reasons for differences in performance may be.

2. Demand-Driven Development of Digital Integrated Learning Environments

The ILEs are supposed to be effective tools for the integration of remote sensing in German schools, so it is important to take a look at the situation in schools and assess the conditions in which the learning environments are used, and what obstacles have to be overcome. These obstacles define the demands made upon learning environments in terms of the technology used, the incorporated e-learning methods, and the applied didactic methods.

2.1. Obstacles and Demands

Several factors militate against the widespread use of digital satellite images in schools. To introduce pupils to the world of earth observation, a good knowledge base is required on the teacher´s side. Unfortunately, satellite images play a minor role in the education of secondary school teachers in German universities. An analysis of corresponding curricula concludes: “We are still far away from mandatory study offers for teachers” [1].
Other issues are the use of computers in general, and the corresponding use of suitable software. According to a study in German schools, only 20.6% of the pupils are using a computer once or twice every month [10]. Since computer usage is a prerequisite for work with digital earth observation data, it has to take place within a limited timeframe, which it shares with other digital topics in secondary school education.
Seeing that the time that could possibly be devoted to digital image analysis is already limited, the question of the right tools to do it is of paramount importance. In general, teachers are not averse to the use of technology in classes, but are often not qualified to use it or are lacking support [10]. In combination with the fact that most teachers have no prior experience with digital image data, using professional software is not likely to yield good results. And how much time could teachers possibly invest in acquiring new skills like the use of a new piece of software? According to a study by Mußmann et al. [11], teachers in Germany spend around 25% of their work time preparing for classes. Assuming an average of 25 school lessons per week, this leaves them with a preparation time of less than 30 min per lesson, which cannot be considered enough to properly set up the materials required for computer-aided teaching with remote sensing data. That being said, freely-available tools like LeoWorks (leoworks.terrasigna.com), SNAP (step.esa.int), or QGIS (www.qgis.org) at least offer an opportunity to use genuine earth observation data without adding cost to the already extensive list of obstacles. From experience, it is safe to say that if there is enough time for preparation and implementation, they can be used in scenarios like project days or teacher training. But for everyday use in schools, they are still too diverse in their possible fields of application. As such, using them effectively with no prior experience is not possible.
Another obstacle lies in the lesson topic, i.e., the image data itself. For years, the acquisition of specific earth observation data was costly and time consuming, and was carried out largely by professionals; however, with the advent of freely-available data sources such as the Landsat archive, things have started to change. Nowadays, the open data policy introduced by the Copernicus program (www.copernicus.eu) offers data from all operational sentinel satellites for free. It has also simplified the process of finding and downloading the data. Teachers are now very capable of doing just that, and preparing, for example, a true color image all by themselves. Nonetheless, using that data in a lesson is still problematic, as it is still too complex and contains a lot of bands of different resolutions that are most likely of no use in classes, and would unnecessarily ramp up the learning curve.
These problems can be condensed into four main demands that need to be considered when it comes to the use of digital satellite images in schools, and that also define the prerequisites for a system that would make possible the use of satellite data in schools:
1. Unencumbering Infrastructure.
This describes the ability of teachers to include digital learning in their classes, as well as the potential time they have to devote to this. Here, the main obstacles to be addressed are the availability, as well as the accessibility, of digital learning content. This is a metaproblem that, if not properly addressed, will impede all other efforts. It is noteworthy that limited internet access is also still an issue in schools, and something that has to be taken into account here. So, ILEs have to add as little preparation time as possible to the teacher’s schedule, and have to be executable with or without fast internet access.
2. Scalable Tools
There is no way around the use of tools for image analysis if the intention to bring remote sensing into schools is to be taken seriously. But neither the preparation time nor the actual teaching time in classes opens a sufficient time window with which to introduce the available tools to teachers and pupils. The main reason is their vast range of functionalities that cannot be scaled down to a specific use case. Therefore, the functionalities need to adapt to the task.
3. Prepared Data
Today, satellite data is available abundantly and for free. But for the use in a regular lesson, the data need to be prepared to fit the topic. They have to be ready to use and stripped of unnecessary information that would slow down the processing time as well as hinder the general learning process. The available information should be essential for the use case of the lesson.
4. Integrated Background Knowledge
Pupils as well as teachers lack the background knowledge that is necessary to understand and work with the data. Therefore, that knowledge has to be provided.
Each of these prerequisites represents an obstacle that cannot be removed, but it is necessary to mitigate it as much as possible, which is what the “Integrated Learning Environments for Remote Sensing” seeks to achieve.
Figure 1 is an annotated screenshot of one of the final ILEs that shows how these prerequisites and demands manifest themselves visually in learning environments. As shown, the integration of the four prerequisites is plainly visible. The way in which the problem of infrastructure is addressed cannot be clearly visualized in a single screenshot, as it is the way of combining these three aspects in technical, didactic, and e-learning terms that makes up the backbone of the learning environments.

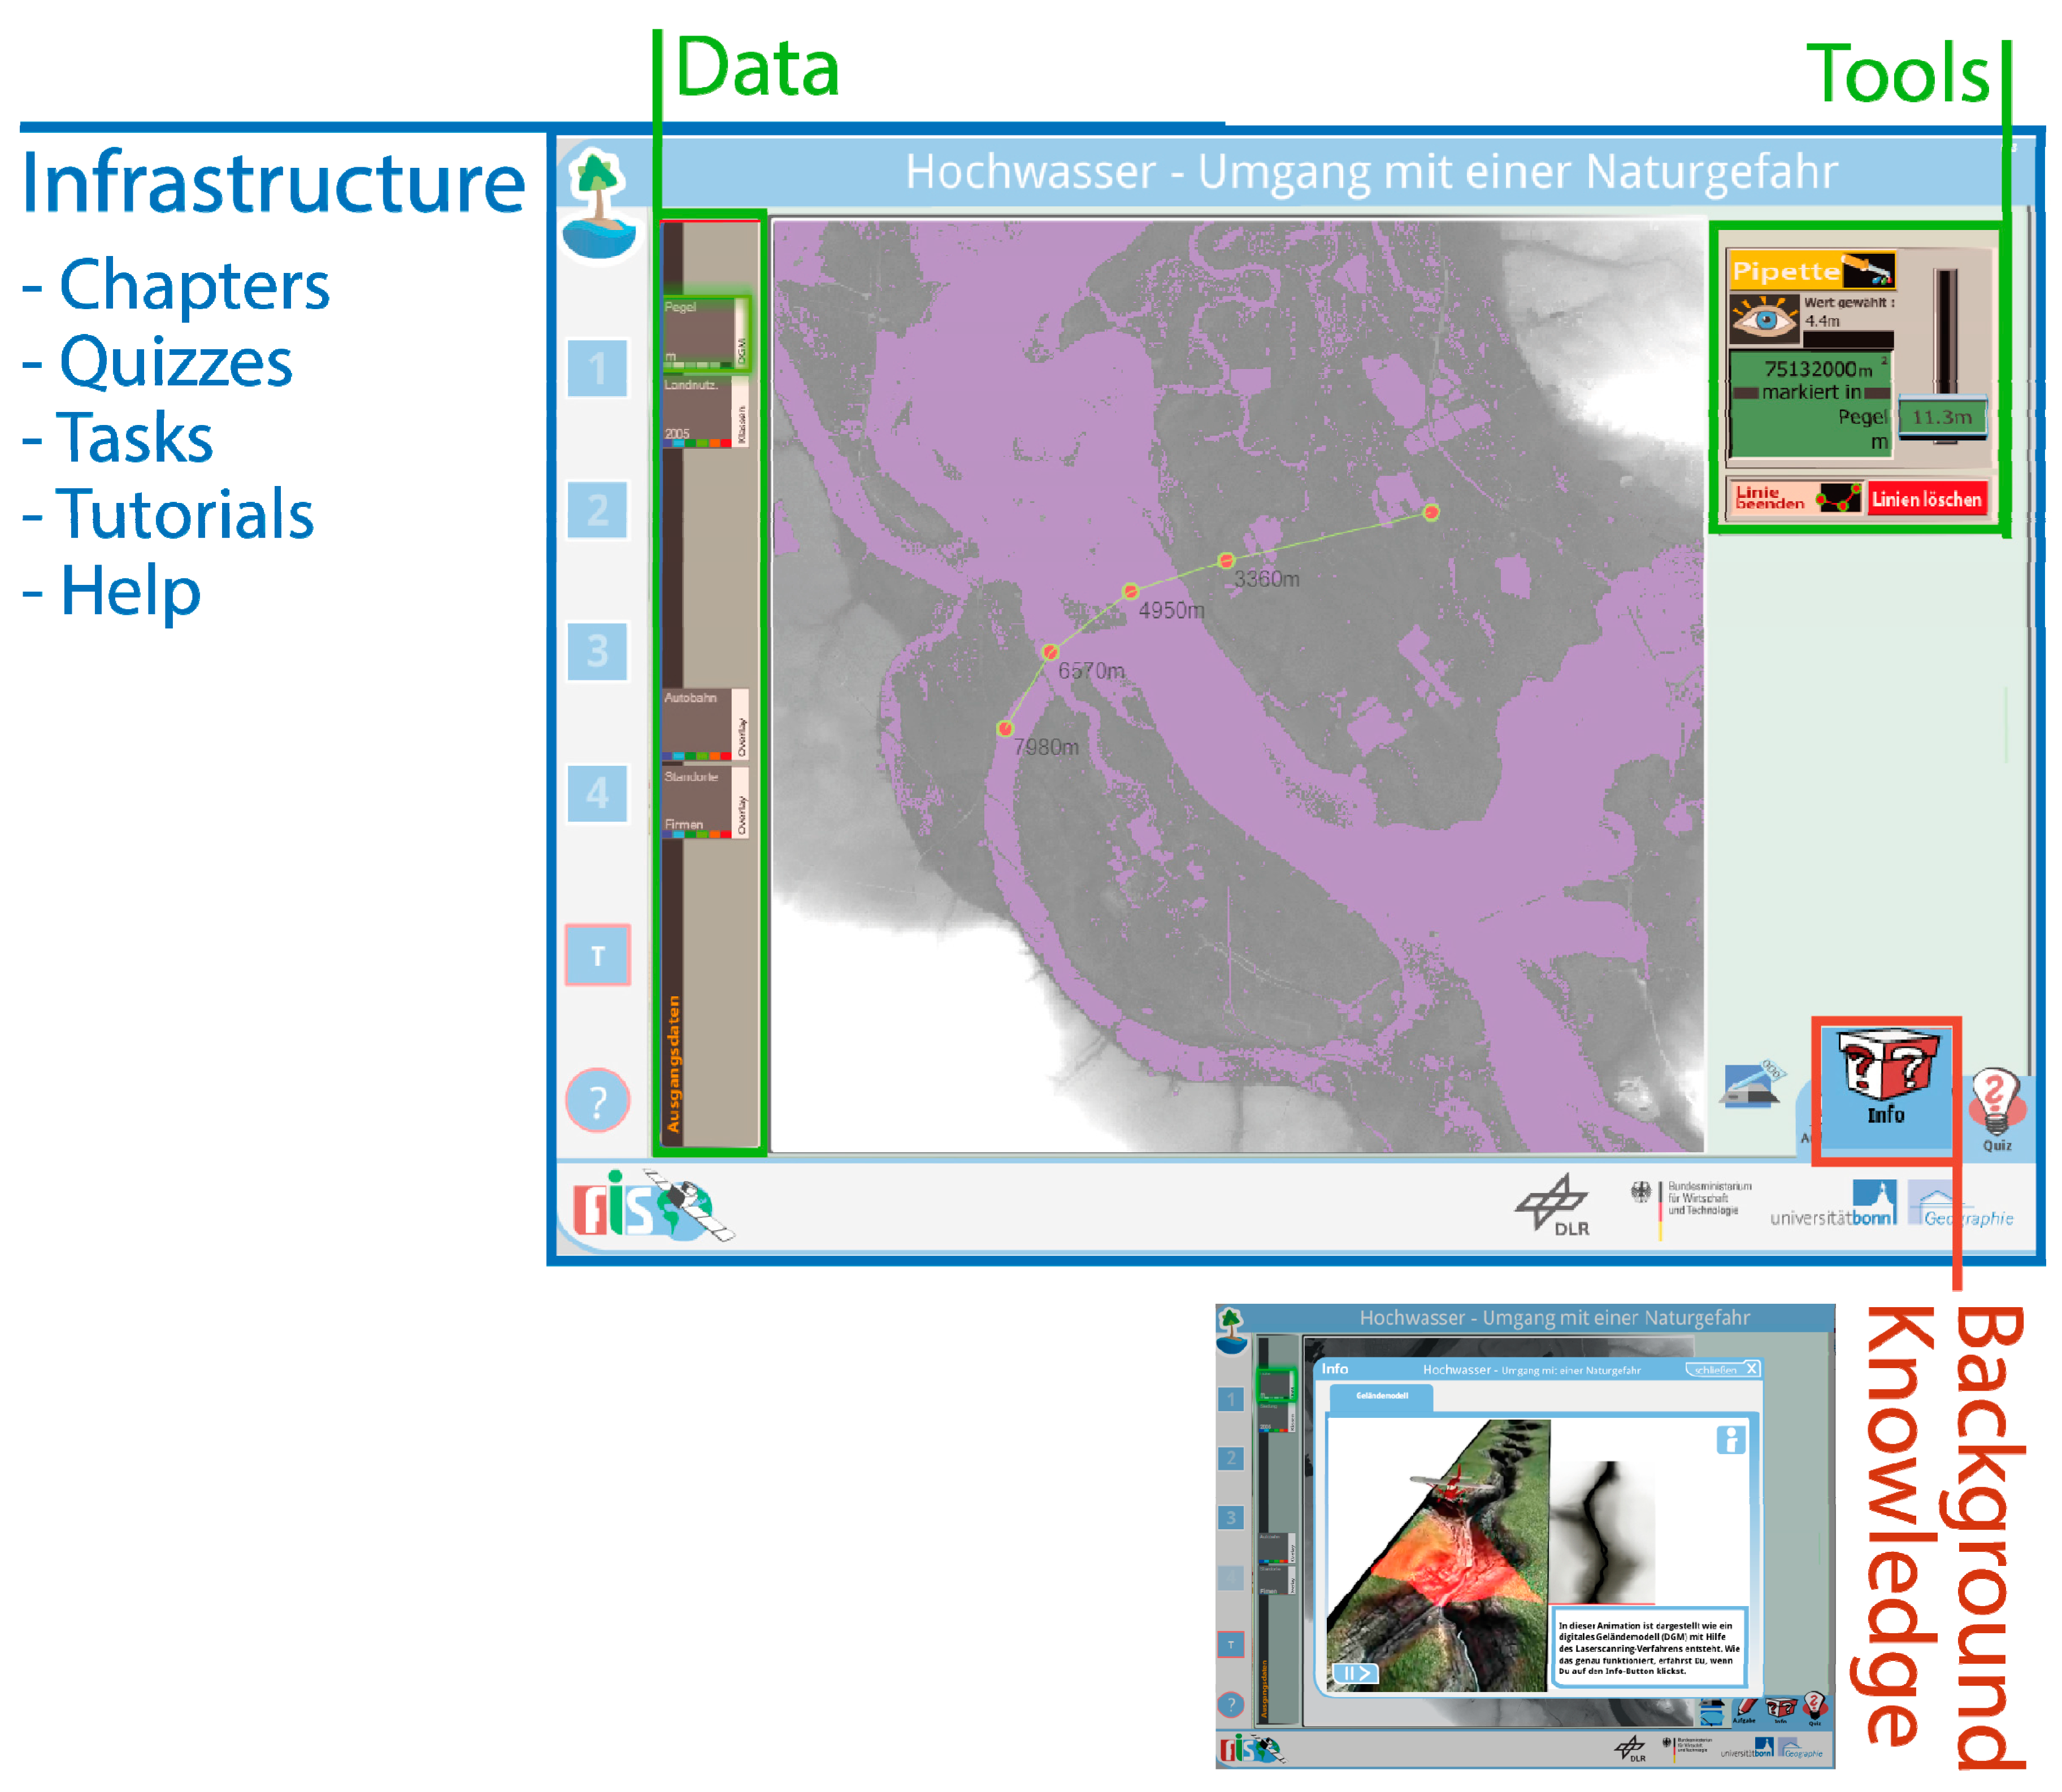
2.2. Technical Aspects

Without a sound technical foundation, none of the aforementioned obstacles can be overcome. So, finding solutions to address them is a key priority, as they penetrate all other aspects of the ILEs.
The main technical demands are related to the four prerequisites, and are shown in Table 1.
The whole framework of the environments is designed in the Adobe Flash runtime environment by Adobe (www.adobe.com) and its proprietary programming language, ActionScript 3.0. From today’s perspective, this raises justified concerns, since the browser-side support for the Flash plugin is to be discontinued in all major browser in the near future. It is important to understand that the initial planning and realization of these digital learning modules in the FIS project began in 2008. At that time, the Flash technology was the only feasible way of realizing the demands shown Table 1. Besides, the near future will see the concept transferred to more future-proof web technology.
It is also the reason for certain challenges and limitations. No libraries for the functionalities needed are available in ActionScript 3.0, which made it necessary to create them. Table 2 gives an overview on the implemented functionalities. The calculations have to be performed locally by the browser and the flash plugin which, for more complex, pixel-based calculations like classifications over multiple bands, is an issue, because of the limitations of the programming language with regard to processing speed. As a consequence, the image size was limited to 500 × 500 pixels. The tools use *.png images as a data format. Therefore, data preparation involves exporting the original reflectance from ENVI. Also, metadata that is indispensable for remote sensing data, like acquisition dates or band information, have to be stored in an external *.xml file, since this is the most common readable data format for external data in Flash. Taking into account that the aim was not to create a fully-fledged remote sensing software, but rather, a learning tool, these limitations and compromises are considered acceptable.
Since the learning environments are supposed to offer real remote sensing functionalities that also have to be easy to use by people with no prior knowledge of remote sensing, they had to be redesigned to make them user-friendly. As a result, a drag and drop-based graphical user interface was created. Furthermore, the availability of the tools is limited by the task at hand, so the NDVI calculation, for example, is only made available when needed, as illustrated in Figure 2. The figure also shows how different the setups of the available tools can be. While Screenshot (A) shows a very minimalistic setup only allowing data to be displayed, the complexity increases up to screenshot (D), where an NDVI-based timeline analysis can be performed. The configuration of the available data, as well as the tools that are to be used on that data, is also done in an external *.xml-file.
These efforts resulted in the creation of a scalable tool. Data, as well as tool sets, are predefined not only for one learning module. They are reconfigured step by step as the learner advances through the chapters of each leaning environment. The data also always has to be ready to use. Unless data preparation techniques like histogram stretching are the topic, they are done beforehand or automatically in the background. Screenshot C of Figure 2 shows an example where manipulating the image is essential to the topic.
In order to meet the overarching demands of an uncumbersome infrastructure, and the connected availability as well as accessibility of the resources, it is also important that the learning not be restricted to online usage of the modules. Broadband high speed internet connections are still not common in a lot of schools. In a study amongst principals in German schools, only 36 % stated that a fast internet connection was available in all rooms or laboratories [12]. As a consequence, the Learning Environments can also be downloaded and run offline on Windows computers.

2.3. E-Learning Aspects

Any means of learning that is electronic or digital can be summarized as e-learning. This leads to a large variety of techniques, applications, and strategies that may or may not prove to be fitting to the task. The possibilities that are connected to the field of e-learning are manifold, and they are widely used in today’s society [13]. But with an abundance of possibilities also comes a variety of pitfalls that lead to reduced efficiency of the material [13]. The foundations of the successful creation and implementation of e-learning material are laid out by longstanding research mainly carried out by cognitive and educational psychologists, as well as private entrepreneurs [13,14,15]. Of the many recommendations given in these works, three were found to be applicable and of special importance for the impartation of background knowledge, as well as the overall concept of the modules. They represent the design paradigms against which all decisions of content creation are weighted.
1. Multiple representations
To convey the background knowledge, the pupils need to engage in the work with digital image data, in which the full spectrum of interactivity has been used. Mayer and Clark [13] formulated the Multiple representation principle, stating that two different modes of representation work better than one. By a sensible combination of multiple types of knowledge encoding, this demand is met in the e-learning units (see Figure 3). When background knowledge is presented in the modules, simple text describing the topics is almost always accompanied by illustrations or interactions.
2. Coherence
Keeping the representations of knowledge as short as possible, as well as avoiding redundant information, has been found to be important to the success of multimedia-aided learning [16]. As a result, short and coherent explanations in order to reduce cognitive load are used throughout the modules, and the amount of information was reduced depending on the task. Also, trying to split the knowledge into smaller chunks of information is a strategy applied in order increase coherence.
3. Guided Discovery
Learning is based on an inquiry process whereby learners construct knowledge out of experience and from examples rather than predefined representations. This type of learning can be difficult for pupils who possess no prior knowledge in the topic, and who are also in constant danger of being distracted or led astray by the possibilities of the more open design of the learning environments. Therefore, it is important to implement guidance in the form a scaffold [17] that provides smaller pieces of information and functionalities. In practice this means that the amount of information and number of functionalities increases as the pupils advance through the learning modules. But it may also mean that some functionalities or tools that were available previously are disabled again if they are no longer needed. Also, small tutorials and help buttons accompany and facilitate the learning process.

2.4. Didactcal Aspects

The underling didactic principle applied in the learning environments is one of moderate or mild constructivism. Constructivism in didactics generally proposes a teaching style that is based on constructivist epistemology, where the reality that surrounds the human mind is only perceived and understood by experiencing and reconstructing it internally based on the neuronal capabilities and limitations of the human brain itself. The reality and knowledge about the world that we perceive is thus an “experienced reality”, rather than a true reality [18]. This was translated into didactics by not defining knowledge building as a linear process, but rather, as an absorption of information from which internal models are constructed that can be applied to problem solving where they either fail or succeed, and thereby become constructed knowledge.
This process, however, strongly relies on self-reflection and experimentation, and thus requires a high degree of self-organized acquiring of information, as well as time to test the self-constructed knowledge in real-world scenarios. Also, the learner and his/her previous knowledge and experience play a major role in knowledge construction [19,20]. While constructivist theory and its role in knowledge construction is widely accepted, its actual application is the subject of ongoing discussion, and after centuries of research, it still leaves experts in doubt of its efficiency [21,22]. The open and undirected nature of constructivist learning setups can lead to frustration amongst students. Also, when taking into account the basic assumptions of the well-established cognitive load theory [23], the unstructured amount of information to be processed in the course of unguided knowledge construction can lead to a high load on the working memory, thus impeding the learning process [24]. By adding various degrees of instruction, as proposed by moderate constructivism, these problems can be counteracted [25,26].
In this regard, the scaffolding for guided discovery, which has already been mentioned in the preceding e-learning and technical part, also serves as a structure that provides the instruction and guidance needed to limit the degree of information and possibilities within the learning modules. Preparing the data used in the learning environment, and also reducing it to the absolute minimum amount of information, is a measure taken to comply with cognitive load theory as well. We assume that any information or data preparation that is not connected to the activity will unnecessarily add to the intrinsic cognitive load of the learning content. This is to be seen in the light of the easy application of the ILEs. Other educational situations in schools, like project days, may demand a higher degree of freedom for gathering information from the data and making decisions.

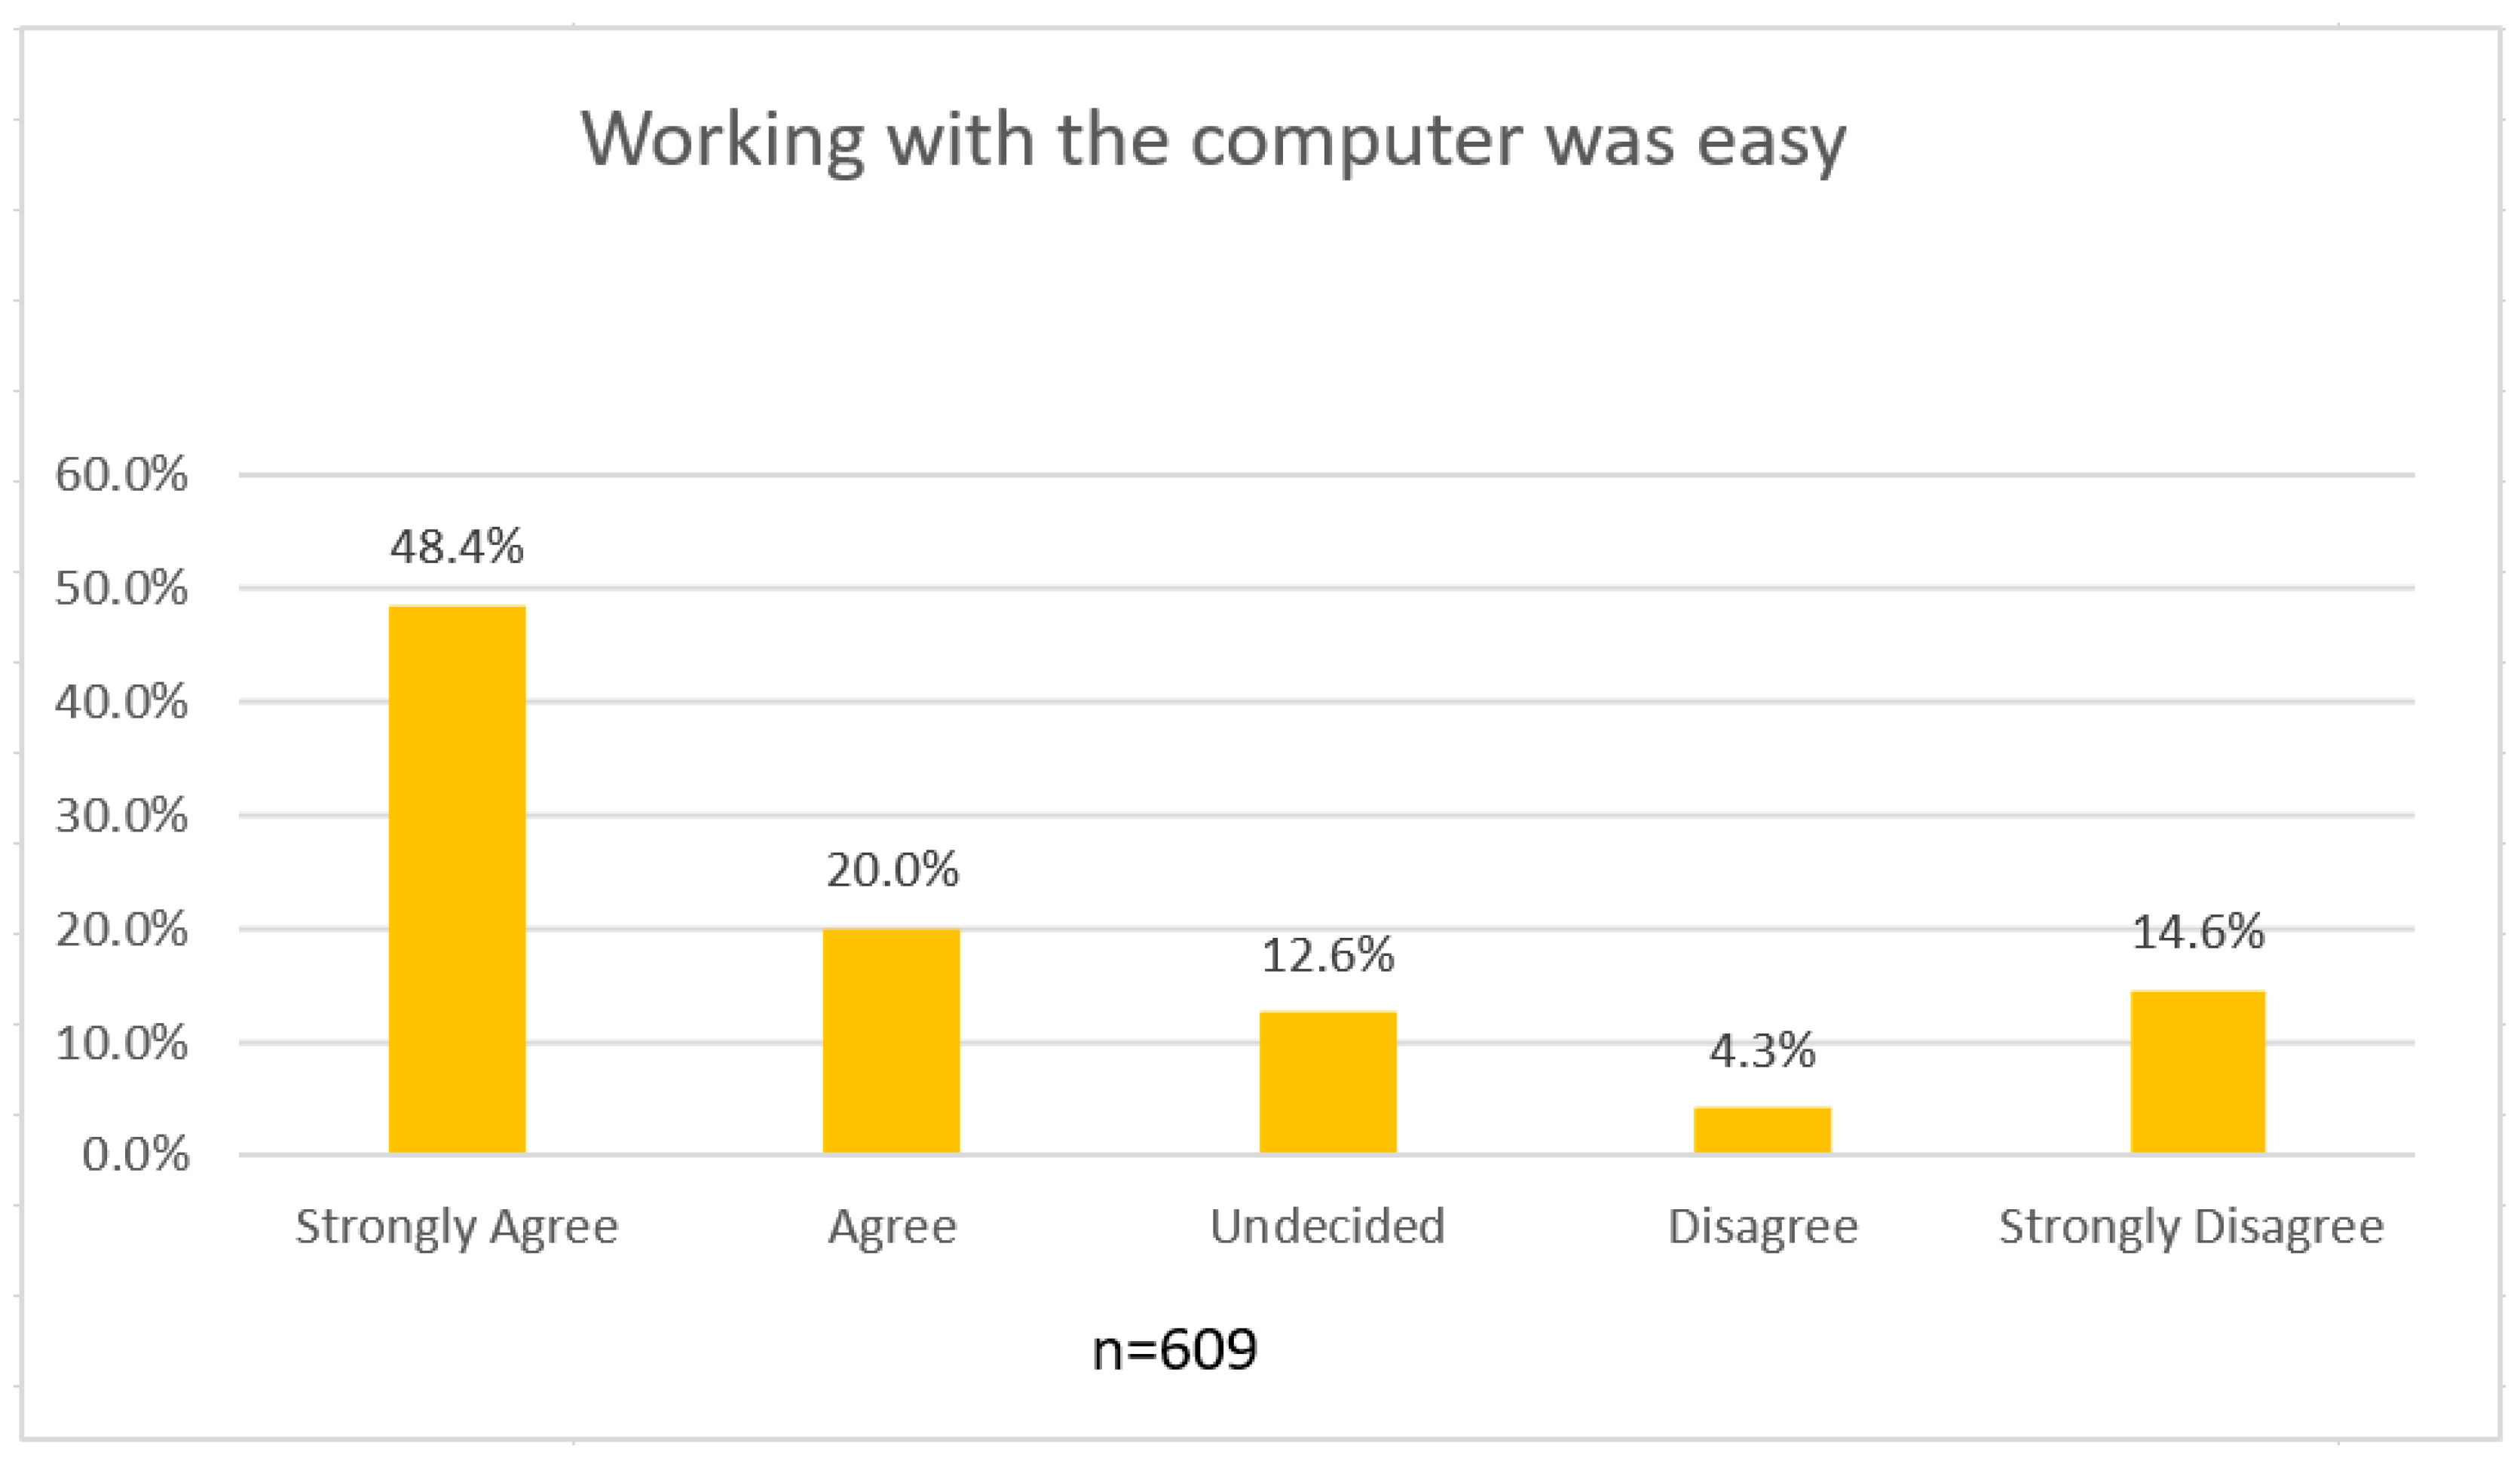
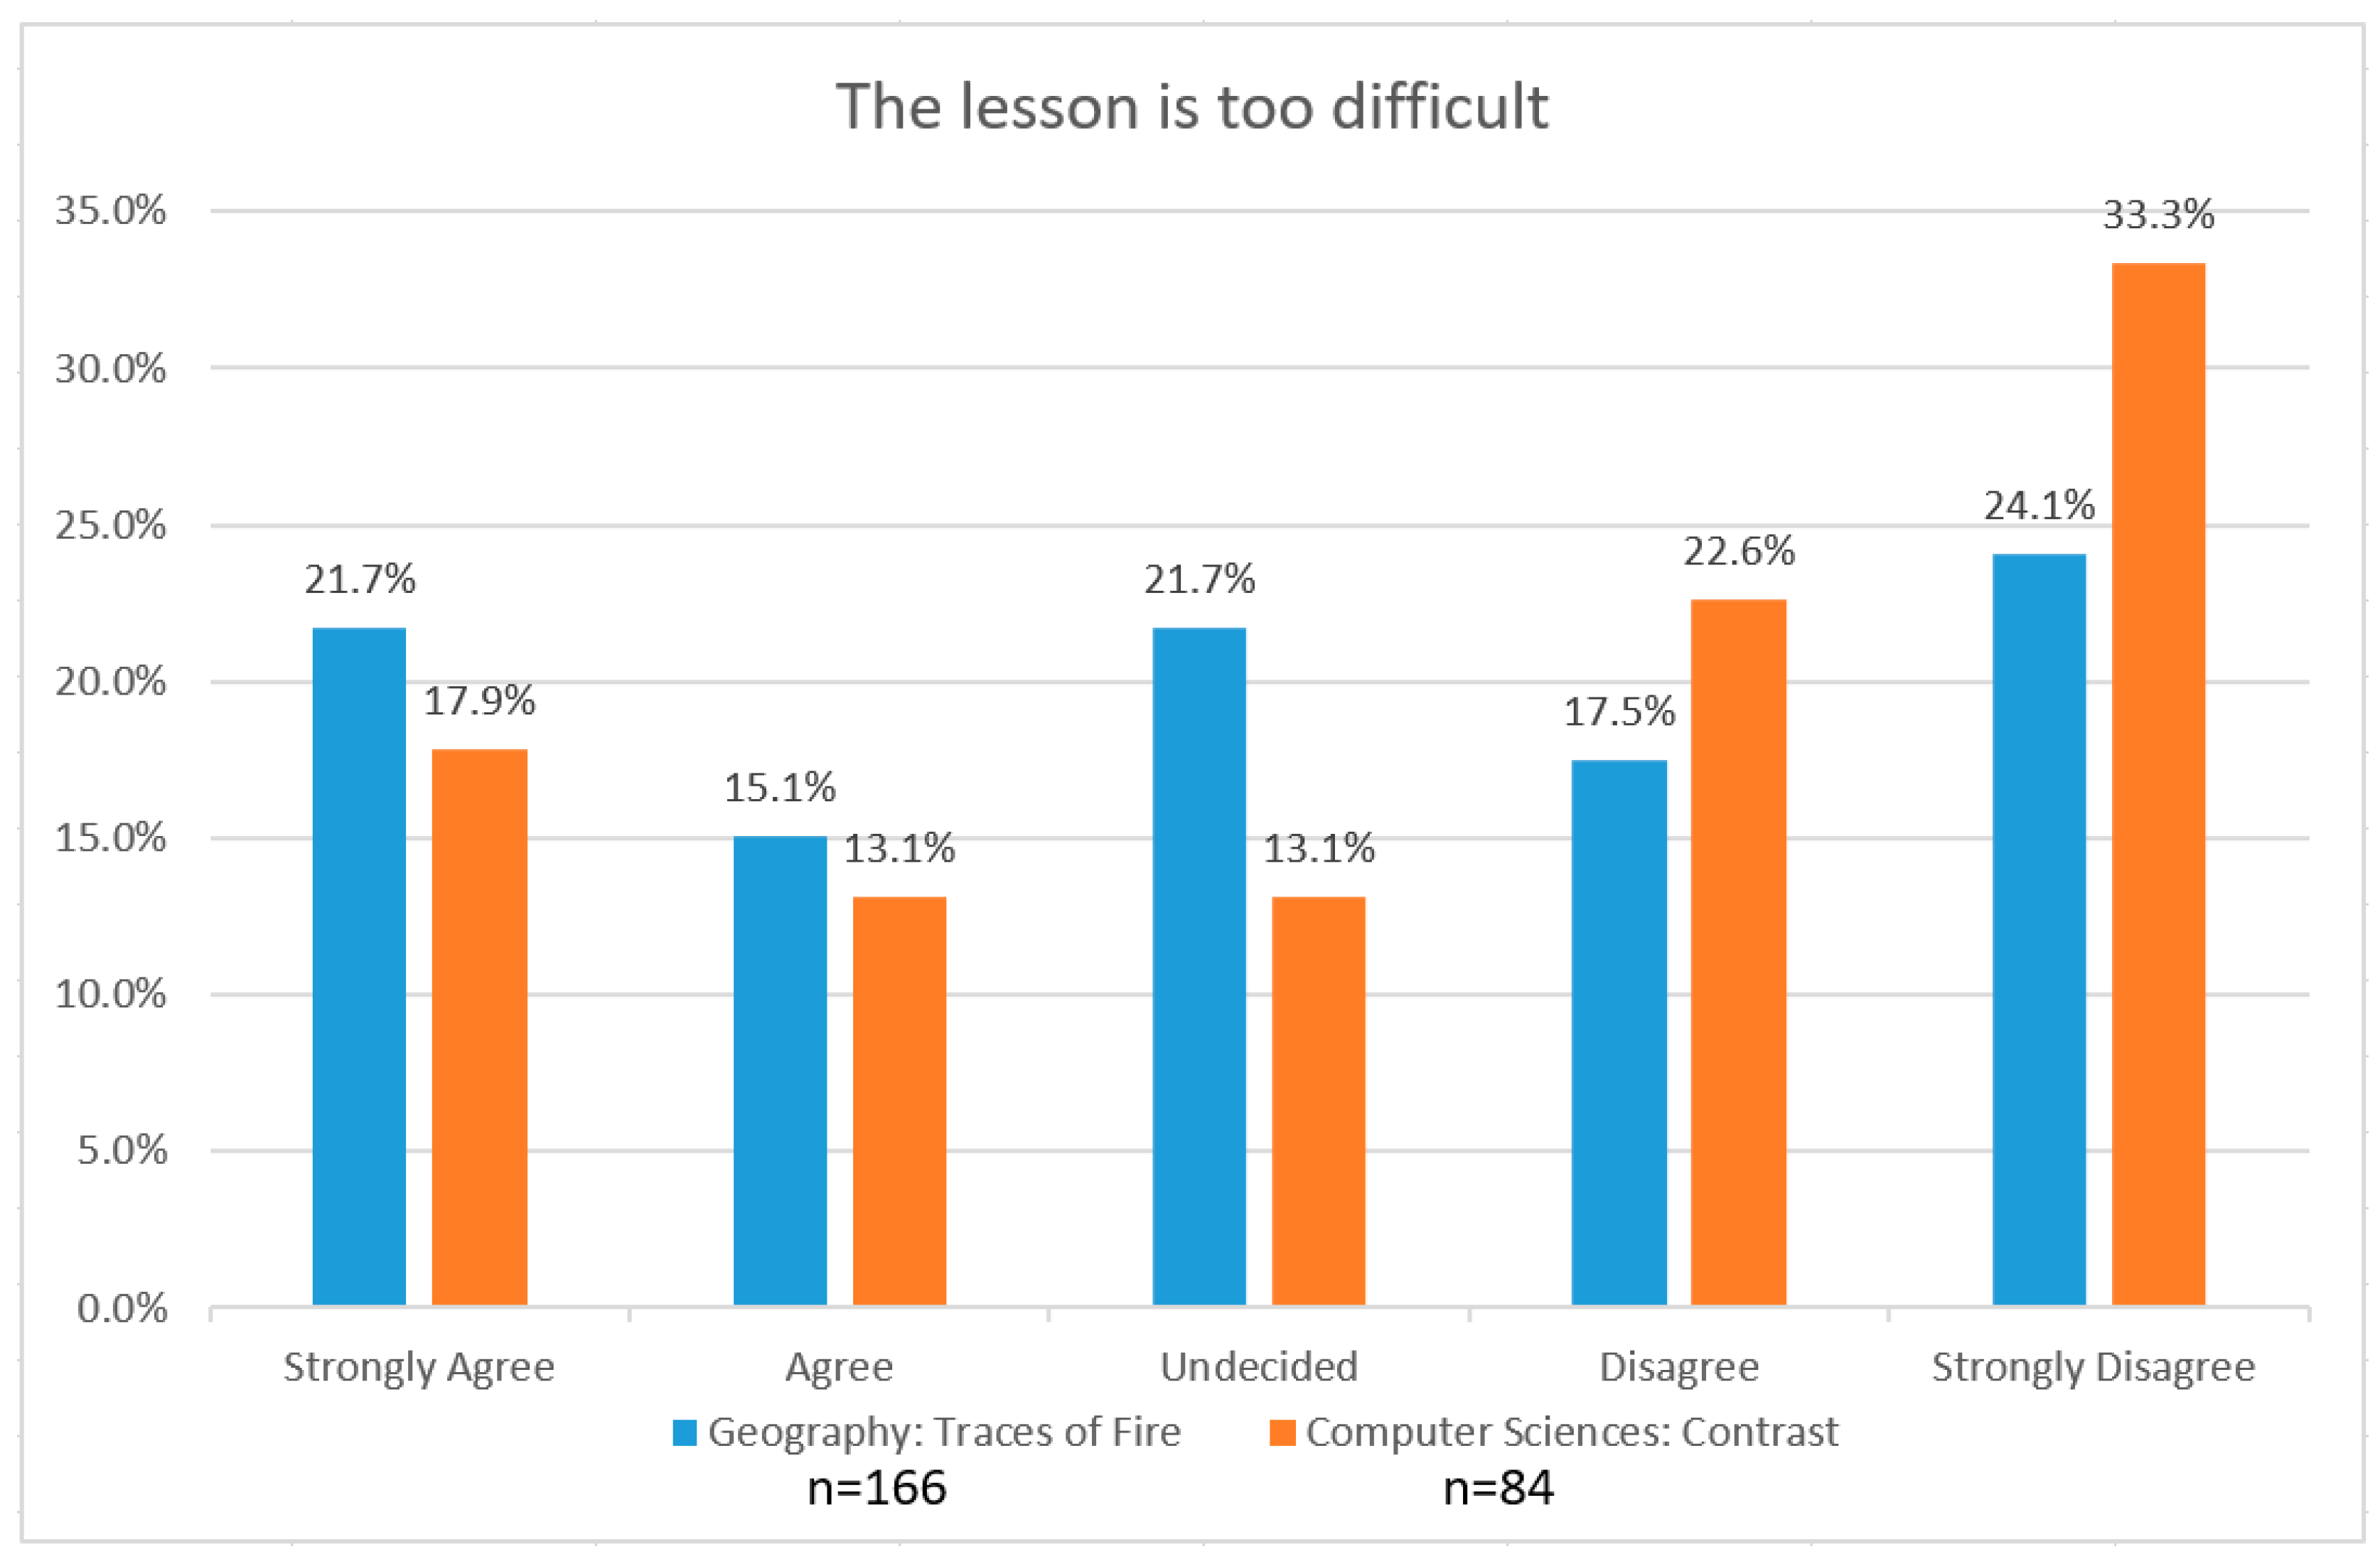
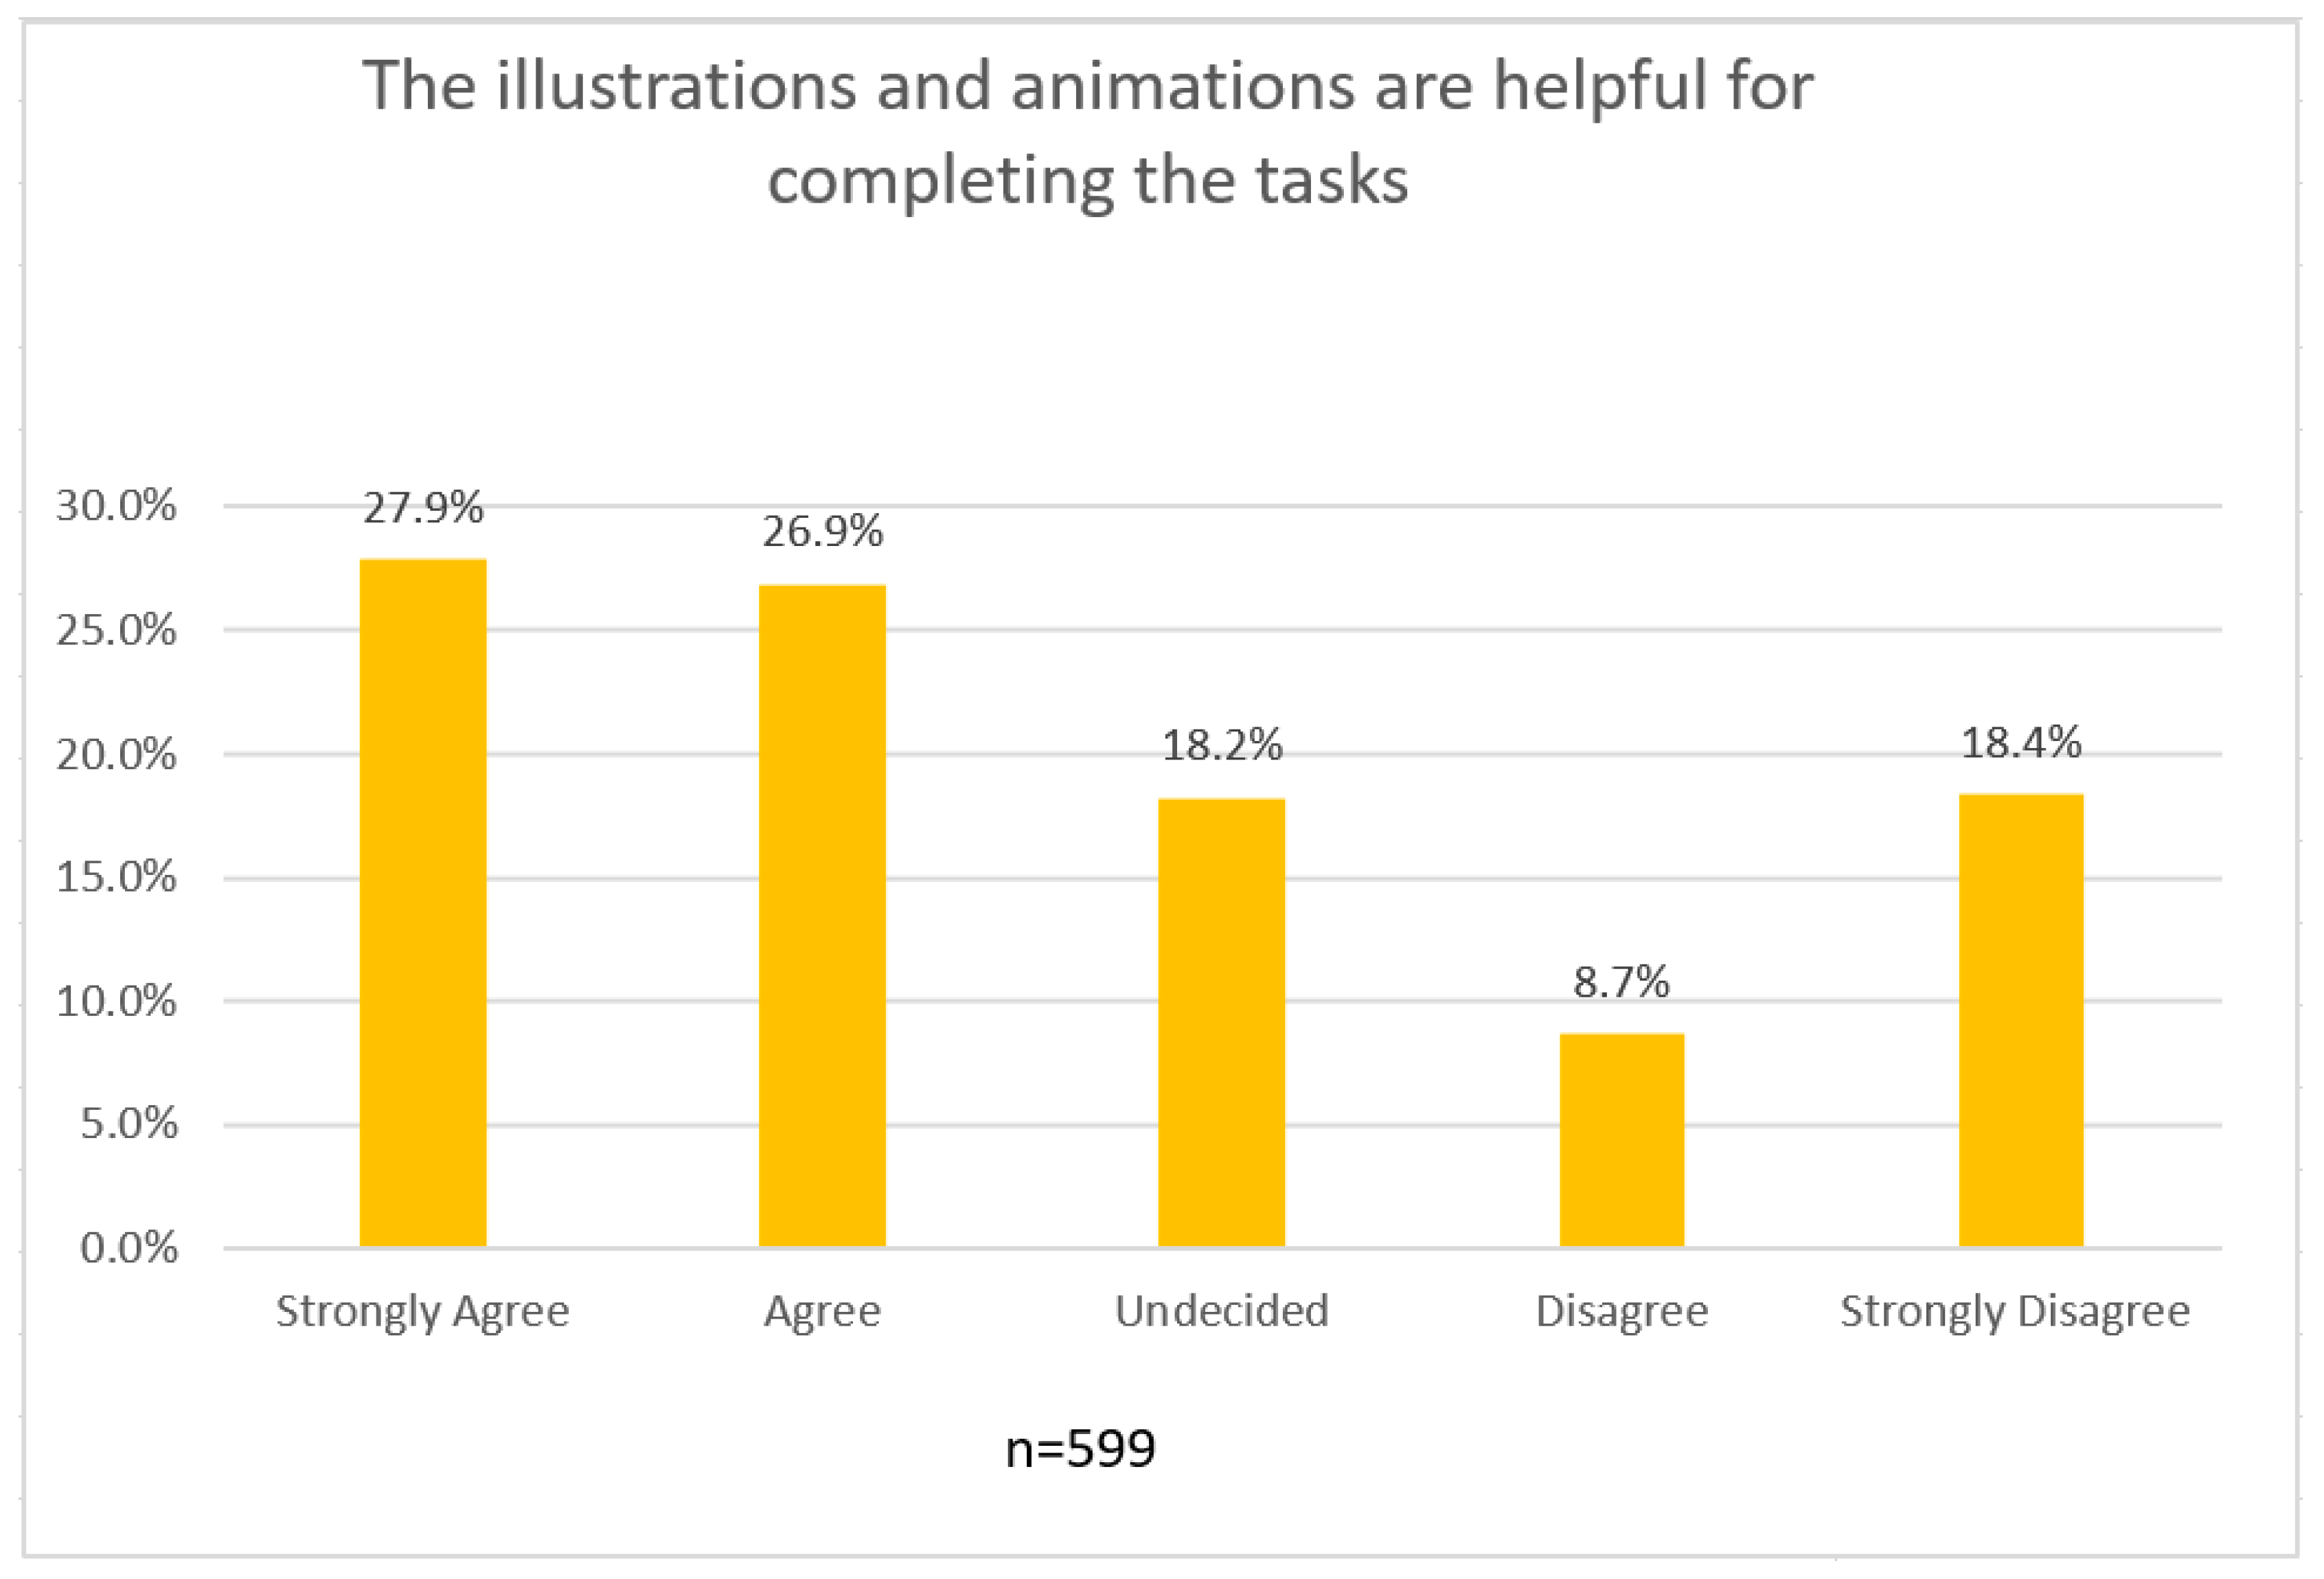
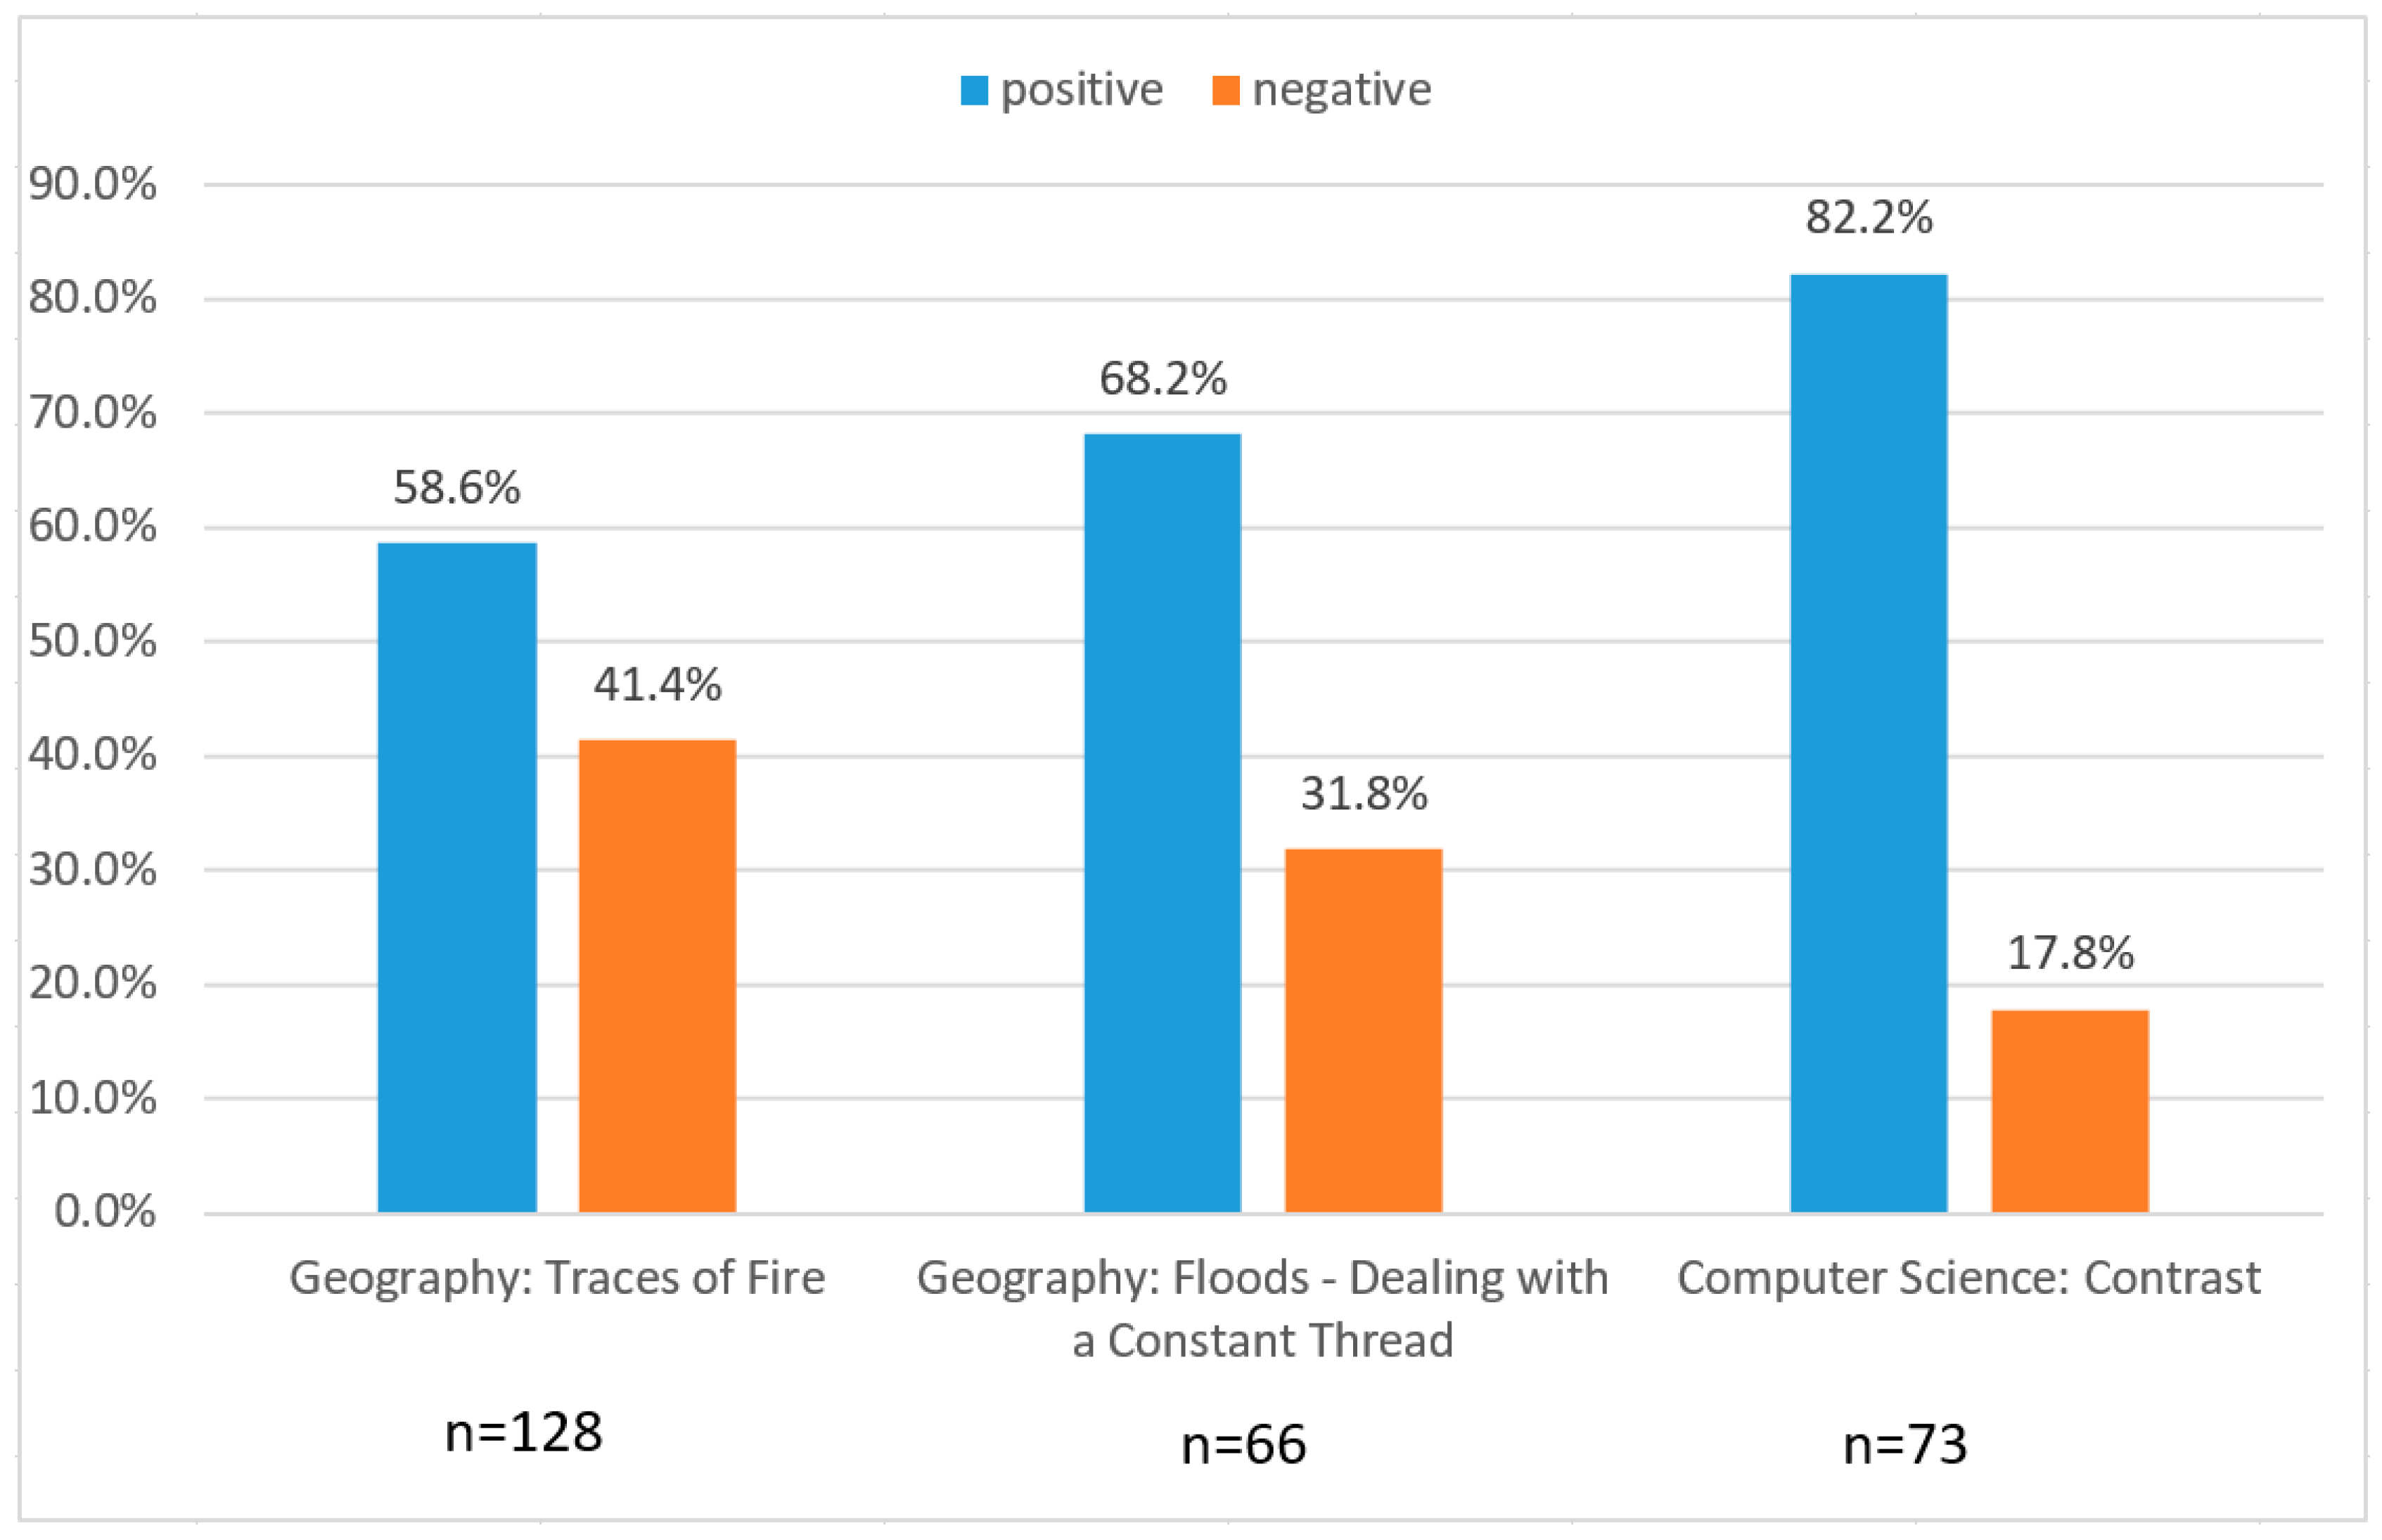
3. Applying Integrated Learning Environments in Classrooms

The sound foundation of technology, e-learning, and didactics have proven to be a reliable but fallible guideline for the creation of interactive classroom resources. All means applied in the production are, in the end, just attempts to reduce the obstacles that were described initially. To date, earth observation is not part of most curricula in German schools, so bringing it into classrooms remains an uphill battle. Regarding this, it is even more important to get an overview of whether the material is used at all, and what problems arise in its application.
To assess the quality and the success of the learning environments, a digital evaluation sheet was implemented in the platform that is to be filled out after the application has finished. Starting in 2012, 660 pupils and 55 teachers took part in the survey. Since the survey was voluntary, it suffered from low feedback, which was especially noticeable in terms of the low number of participants on the teacher side.
The main purpose of the items in the survey was to get feedback on the quality and usability of the integrated learning modules, and thereby, to improve them. While not being enough for an exhaustive analysis on all the aspects of such complex environments, it gives some insights into the usability and the effect of the animations in the context of conveying background knowledge in the modules themselves. A main concern is the general usability of the tools and the learning environments, since overly-complex handling would result in a high extraneous cognitive load that would impede the general learning process. According to Figure 4, most of the pupils found working with the computer easy when using the modules. Also, Figure 5 shows that the digital leaning units were generally not perceived as being too difficult.
However, pupils’ opinions on how difficult the lessons were differed depending on the learning module. This can be observed in Figure 6. While the pupil’s evaluations of the difficulty level for the lesson “Computer Science: Contrast” were pretty much in line with the general perception of the difficulty throughout the learning modules, it varied substantially in the lesson “Geography: Traces of Fire”. One possible reason for this is the slightly different application of animation interactions.
Background knowledge that is crucial to work with the data is implemented in the learning modules in the form of info boxes. These info boxes utilize illustrations, animations, and interactions alongside text wherever possible. Figure 7 illustrates that more than half of the students found the illustrations and animations helpful. But, for a third of them, they do not seem to help in completing the task. To get some insight into why the pupils did not find some of the animations and illustrations helpful, three modules that were used and evaluated more often were singled out.
Figure 8 shows that the pupils’ evaluations differed depending on the learning module that was used. While the majority always found the animations and illustrations useful, this was a lot more apparent in the lesson “Computer Science: Contrast”, for example. Here a 1/0.2 ratio can be found for every pupil that agreed or agreed strongly, as opposed to pupils who disagreed or disagreed strongly. Looking for the characteristics that set these animations and interactions apart from those in “Geography: Traces of Fire”, where the ratio was just 1/0.7, the most striking is the length and amount of information that they tried to convey, i.e., substantially more in the latter, where the interactive animations themselves stretched over several chapters. This is an intentional attempt at breaking down the information into small bits and thereby complying with the design paradigm of coherence (see Section 2.3). But because the absolute amount of information was not reduced in the same manner, this may have reduced the efficiency of the interactions. Figure 9 shows screenshots from the biology lesson, where the added value of animations and interactions was evaluated more critically. The background information given in the first chapter of the module is in itself a short introduction to basic principles of remote sensing. It is plainly visible that the multiple representation principle was applied consistently, as every explanation in text form (A) was accompanied by illustrations, animations, or interactions (B). Notice the chapter indicator (C) showing that this background information in the module consists of seven chapters, which comprise additional subsequences of only the first of four chapters of the whole ILE. So, there is a lot of information to be absorbed by the pupils who are already exposed to a topic they most likely never heard of before. This information should have been more clearly reduced in both the didactic and quantitative sense to avoid unnecessary extraneous cognitive load. The interactive introduction to earth observation was later decoupled from the learning environment and used as a single resource to introduce teachers or students to remote sensing, where it was well received.
Figure 10 shows a more refined use of the coherence principle in the learning module “Contrast”. The information here is specifically tailored to each chapter in the learning module. There is no additional subsequencing, as seen in the example before.
The lesson learned from this is that the design paradigms can be applied effectively, but that blindly following those guidelines might not always lead to success. While splitting the content into small bits is a fitting means by which to reduce extraneous cognitive load, the reduction of the content to an amount fitting to the specific lesson serves the very same goal and seems to be more important.

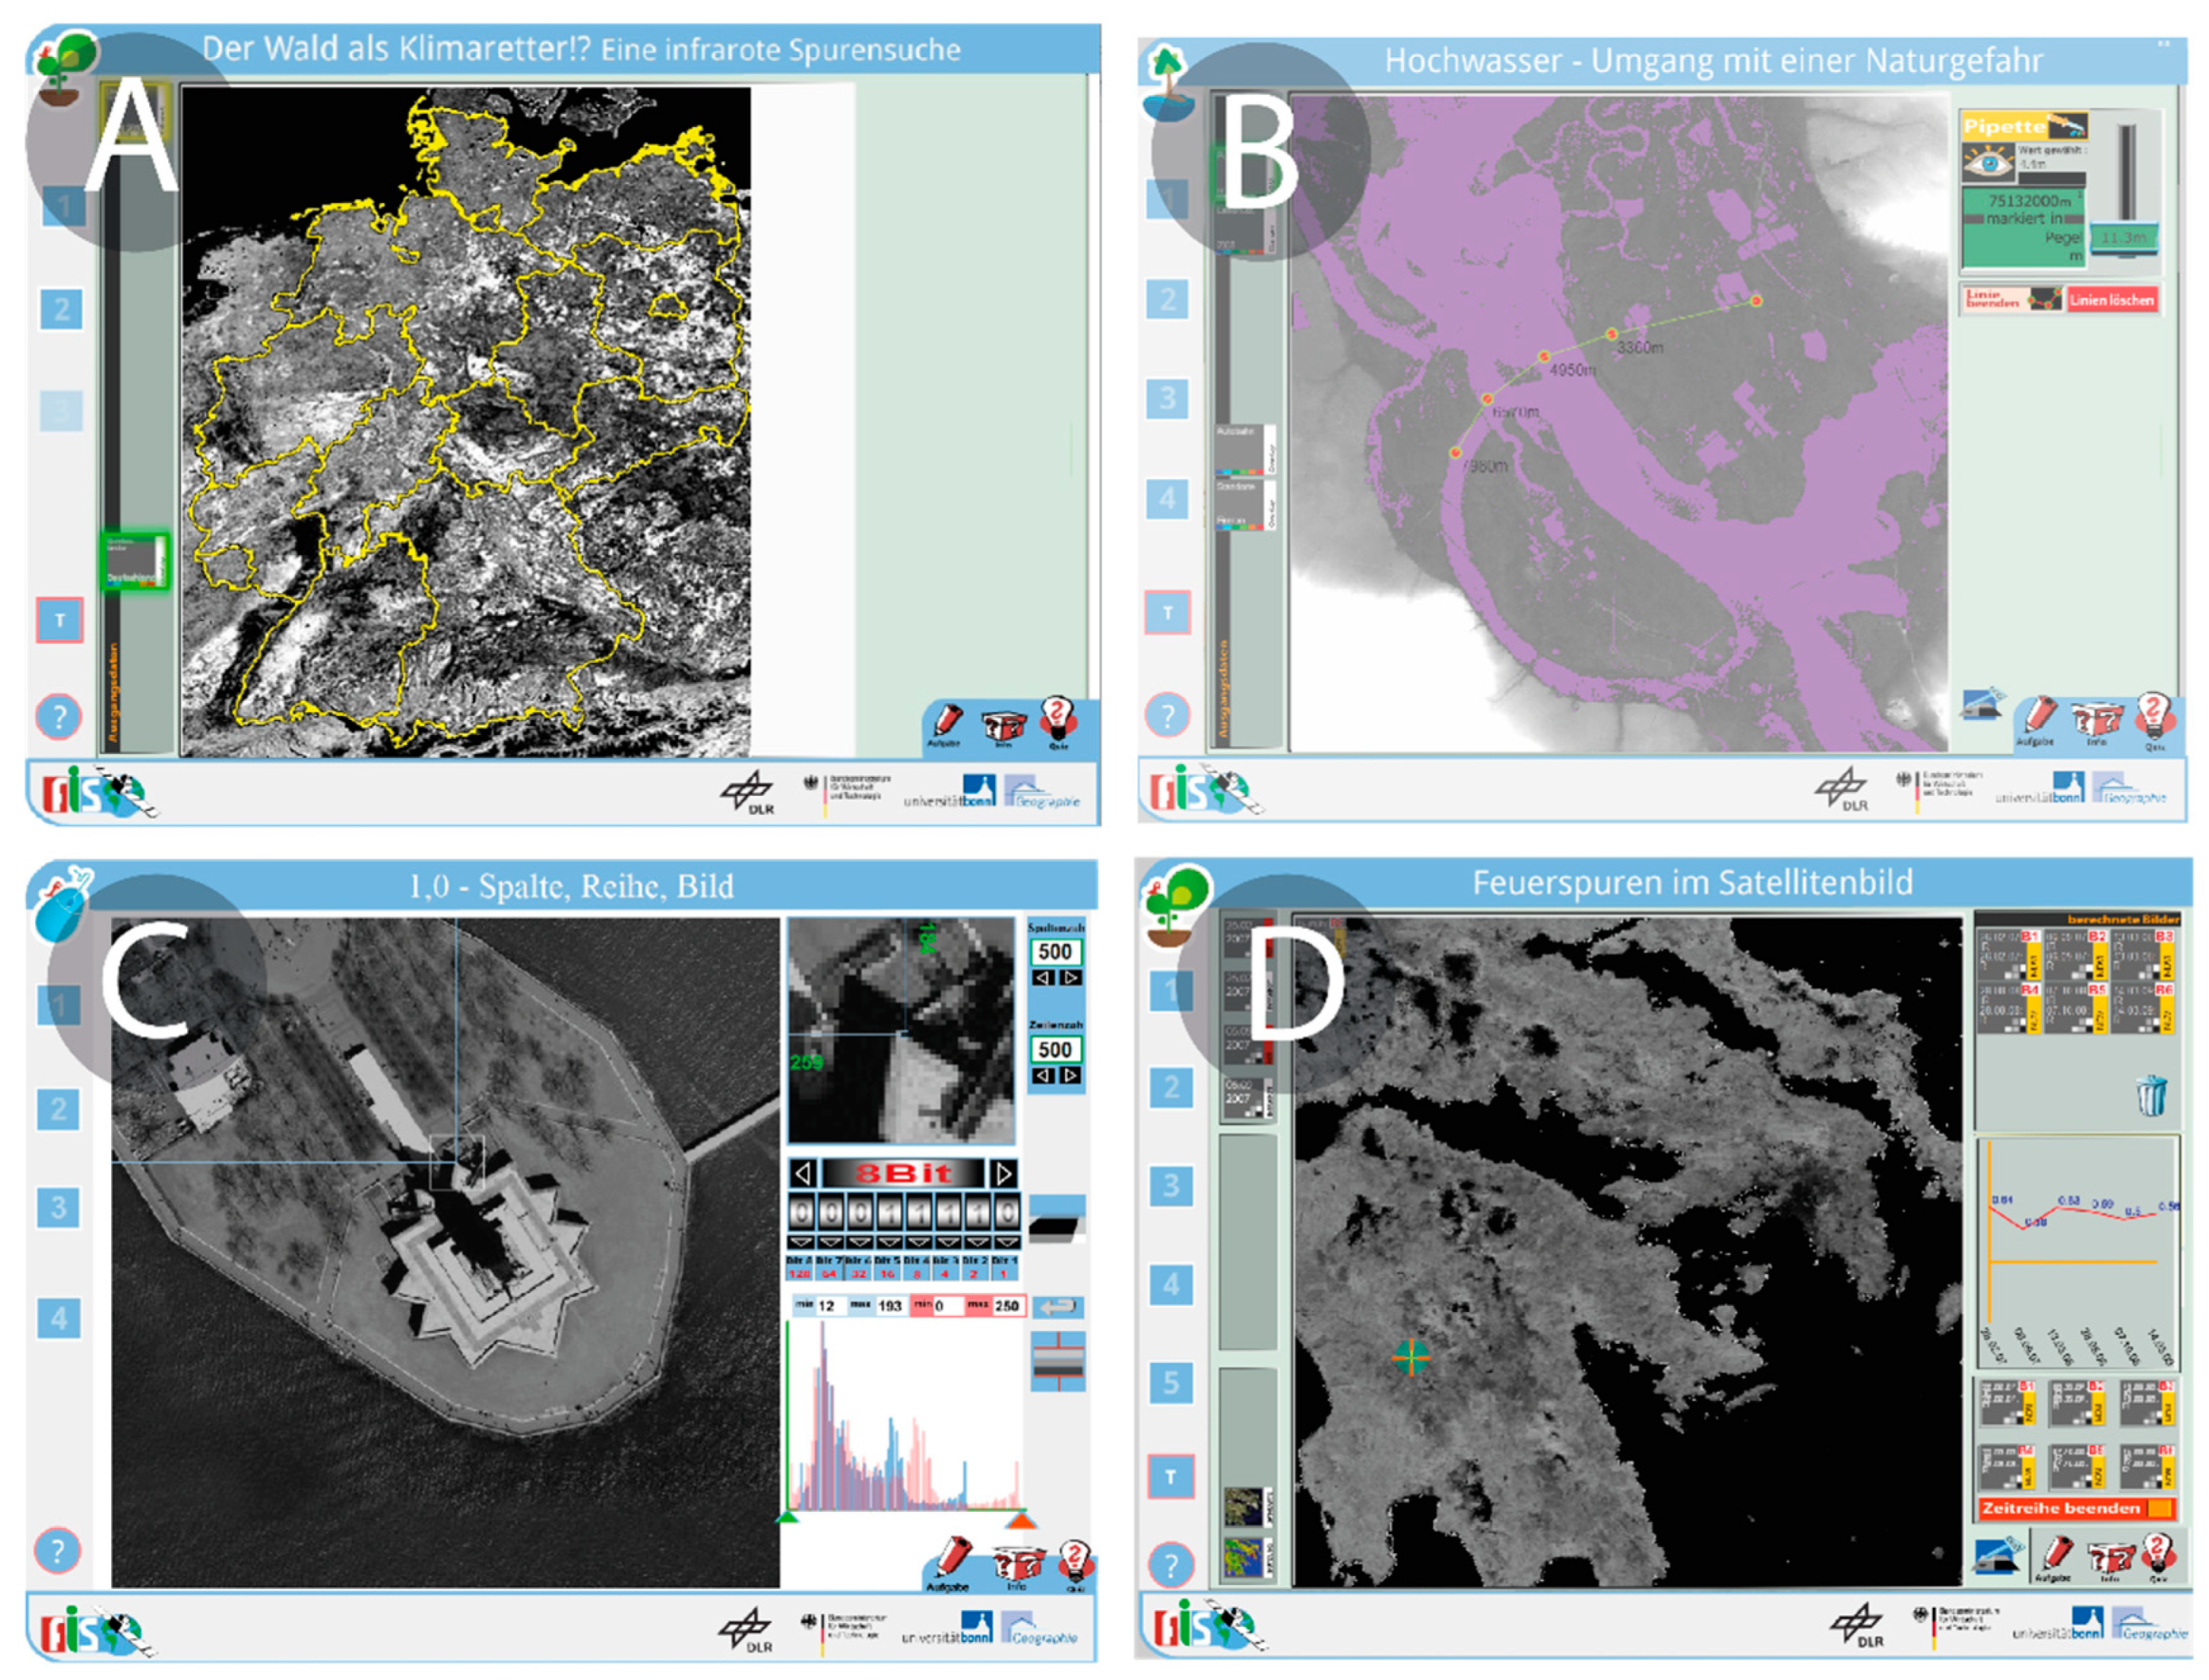
4. Learning Modules in Past, Present and Future Application

In the course of the last 12 years, the described concept has seen plentiful applications, mainly in secondary school education. Learning environments have been implemented in an online learning platform (http://www.fis.rub.de), and some of the core principles have also been used to create additional material to inform pupils, teachers, as well as anyone interested in earth observation. To assess whether the overall idea of the modules has been successful, Figure 11 shows how often they were accessed or downloaded.
The learning platform has been online since 2012. An evaluation of the login data was conducted for the years 2013, 2014, 2015, as well as for the two-year time period from April 2017 to the end of March 2019. Technical issues, as well as the fact that the project was not funded throughout the whole eight years, prevented a more complete assessment of the data, and also explains the missing offline data for 2015. Figure 8 shows that in the four recorded years, the materials were downloaded or accessed online over 30,000 times. Considering the almost two missing years, in which the platform was online and accessed, this can be seen as an encouraging number that indicates that tens of thousands of pupils were brought into contact with earth observation. The figure also shows that access and download numbers were halved in those eight years. Part of the loss of users can be associated with fewer personnel that were involved in updating and advertising the learning portal on occasions like teacher trainings due to funding issues. But also, technical problems may have had a negative impact. A major issue is the dependency on Adobe Flash Player technology. While being the natural choice for complex web applications at the time in which the learning modules were conceptualized and created, today, most browsers discourage or even discontinue its use for security and other reasons, making it harder to use the online material, especially on Apple and Linux operating systems. In the period 2017–18, online access shrunk drastically, while the number of downloaded modules increased by almost two thirds. Since the downloaded modules can be used without the Flash Player on Windows systems, this can be seen as a clear indicator of the impact of the discontinued Flash support in browsers. Therefore, addressing that technical issue is the main task to ensure the continued use of the ILEs in the future.
The major advantage of Flash technology has been its ability to deliver media content, simple interactions, as well as complex functionalities in the form of “rich internet applications” (RIAs) in a format that is compatible with all major operating systems by using a plugin. Today, all major web browsers make use of the HTML5 Canvas technology. Without the use of plugins, graphically-demanding, browser-based internet applications can now be created using mainly JavaScript. While those technologies were in their infancy when the applications were created, the next generation of the ILEs will make extensive use of them, as they are now well established. Transferring the ILEs with all their functionalities as well as their media content is, however, not so much a matter of converting, but rather, of completely recreating them. At the moment, there are several activities underway to solve this issue on different levels. Animations and interactions are recreated using the Adobe Animate IDE in combination with the CreateJS—JavaScript library (createjs.com). Taking into account recent developments in browser-based remote sensing applications like EO Browser (https://apps.sentinel-hub.com/eo-browser/), all tools are implemented in a web GIS, enabling a completely browser-based operation of the future learning modules. A purely web-based approach, however, mainly relies on server-side calculations and the display of the calculated data in the browser. While this is a feasible way for calculations of large volumes of data, it presents a predicament for the school environment, because it would omit the possibility of using ILEs offline, which is still an important prerequisite for the use of digital earth observation in schools due to bandwidth limitations. The approach taken by us right now is to aim for both online and offline use, depending on the content of the lesson and the complexity of the calculations. In this way, some of the lessons will still be compiled into desktop applications using the electron framework that allows desktop applications to be developed in JavaScript. But it will not be neglected that the direction the development of the technology in both e-learning and remote sensing is taking favors a web-based approach.

5. Conclusions and Outlook

Based on the demands of everyday school reality, digital integrated learning environments for earth observation have proven to be applicable in classrooms. A lot of experience was gathered in the production and application of these modules. This experience has been put to use in other activities and projects like “Columbus Eye” and “ESERO Germany” (see Appendix A). Those projects are also targeting pupils to make them more aware of earth observation, as well as of astronautics in general. The unique combination of different aspects of remote sensing, didactics, and e-learning results in applicable classroom material that presents the use of digital learning tools in a contemporary way in everyday classroom situations. In teacher training, where the learning modules play a crucial role, the participants reacted very positively to this new input for their classroom. While the greatest obstacle for the ongoing use of the modules is a purely technological one, there are clear indicators that there is still room for improvement in the application of the didactic and e-learning paradigms. While those overarching principles will remain, they have to be altered to emphasize even more the ease of use in everyday classroom situations. Given the complexity of the topic and the fact that pupils as well as teachers are stepping into uncharted territory, i.e., where there is little previous knowledge, paying extra attention to how coherently the information is presented seems to pay off and should be regarded as a top priority.
The process of properly applying technology in teaching in our view still remains one of the biggest challenges. Picking the right means from the vast pool of e-learning technologies to convey content and also prepare and reorganize the content in a way that best fits the chosen tools is a decisive process in the creation of e-learning content, in which the paradigms mentioned in Section 2.3 are very helpful to us. These challenges are, of course, not restricted to schools. In higher education, as well as lifelong learning, this plays an even more important role, since new earth observation data and applications are meeting an ever-growing audience that is eager to learn about the subject. Regarding remote sensing topics, schools are, in a way, a worst-case scenario, where a lot of limitations apply that are of less relevance under other educational circumstances, but they are also a good proving ground for teaching materials. This environment forces us to think about such special demands and adapt to them, which is, in itself, a vital strategy in planning and implementing e-learning strategies.
In this regard it is also important to point out that some of the obstacles that our concept has had to react to are founded in the fact that the importance of remote sensing for our society is neither mirrored in public awareness nor in school curricula. This is also a reason why it has little to no priority in the university education of future teachers. The impetus that large scale earth observation initiatives like Copernicus, as well as the vast number of private entrepreneurs, have created should be used more efficiently to educate the general public about the capabilities and potential of this technology. This may serve as the leverage needed to integrate remote sensing in school curricula in a sustainable manner.
With the opportunity to address the current challenges within the next months, the materials will see extensive revision in both technological and content-related aspects to guarantee the existence and improvement of a platform, such that it will continue to be a sound foundation upon which pupils, teachers, and everybody else may start the journey towards gaining a whole new perspective of our planet.

Author Contributions

Conceptualization, H.H., methodology, H.H.; software, H.H.; validation, H.H.; formal analysis, H.H.; investigation, H.H.; resources, H.H.; data curation, H.H.; writing—original draft preparation, H.H.; writing—review and editing, H.H., A.R. and C.J.; visualization, H.H.; supervision, A.R. and C.J.; project administration, A.R.; funding acquisition, A.R. Please turn to the CRediT taxonomy for the term explanation. Authorship must be limited to those who have contributed substantially to the work reported. All authors have read and agreed to the published version of the manuscript.

Funding

Parts of this research was funded by GERMAN AEROSPACE CENTER (DLR), grant number 50 EE 0932.

Acknowledgments

We thank the Remote Sensing Research Group (RSRG) at the Department of Geography / University of Bonn for their technical, logistical and administrative support.

Conflicts of Interest

The authors declare no conflict of interest.

Appendix A

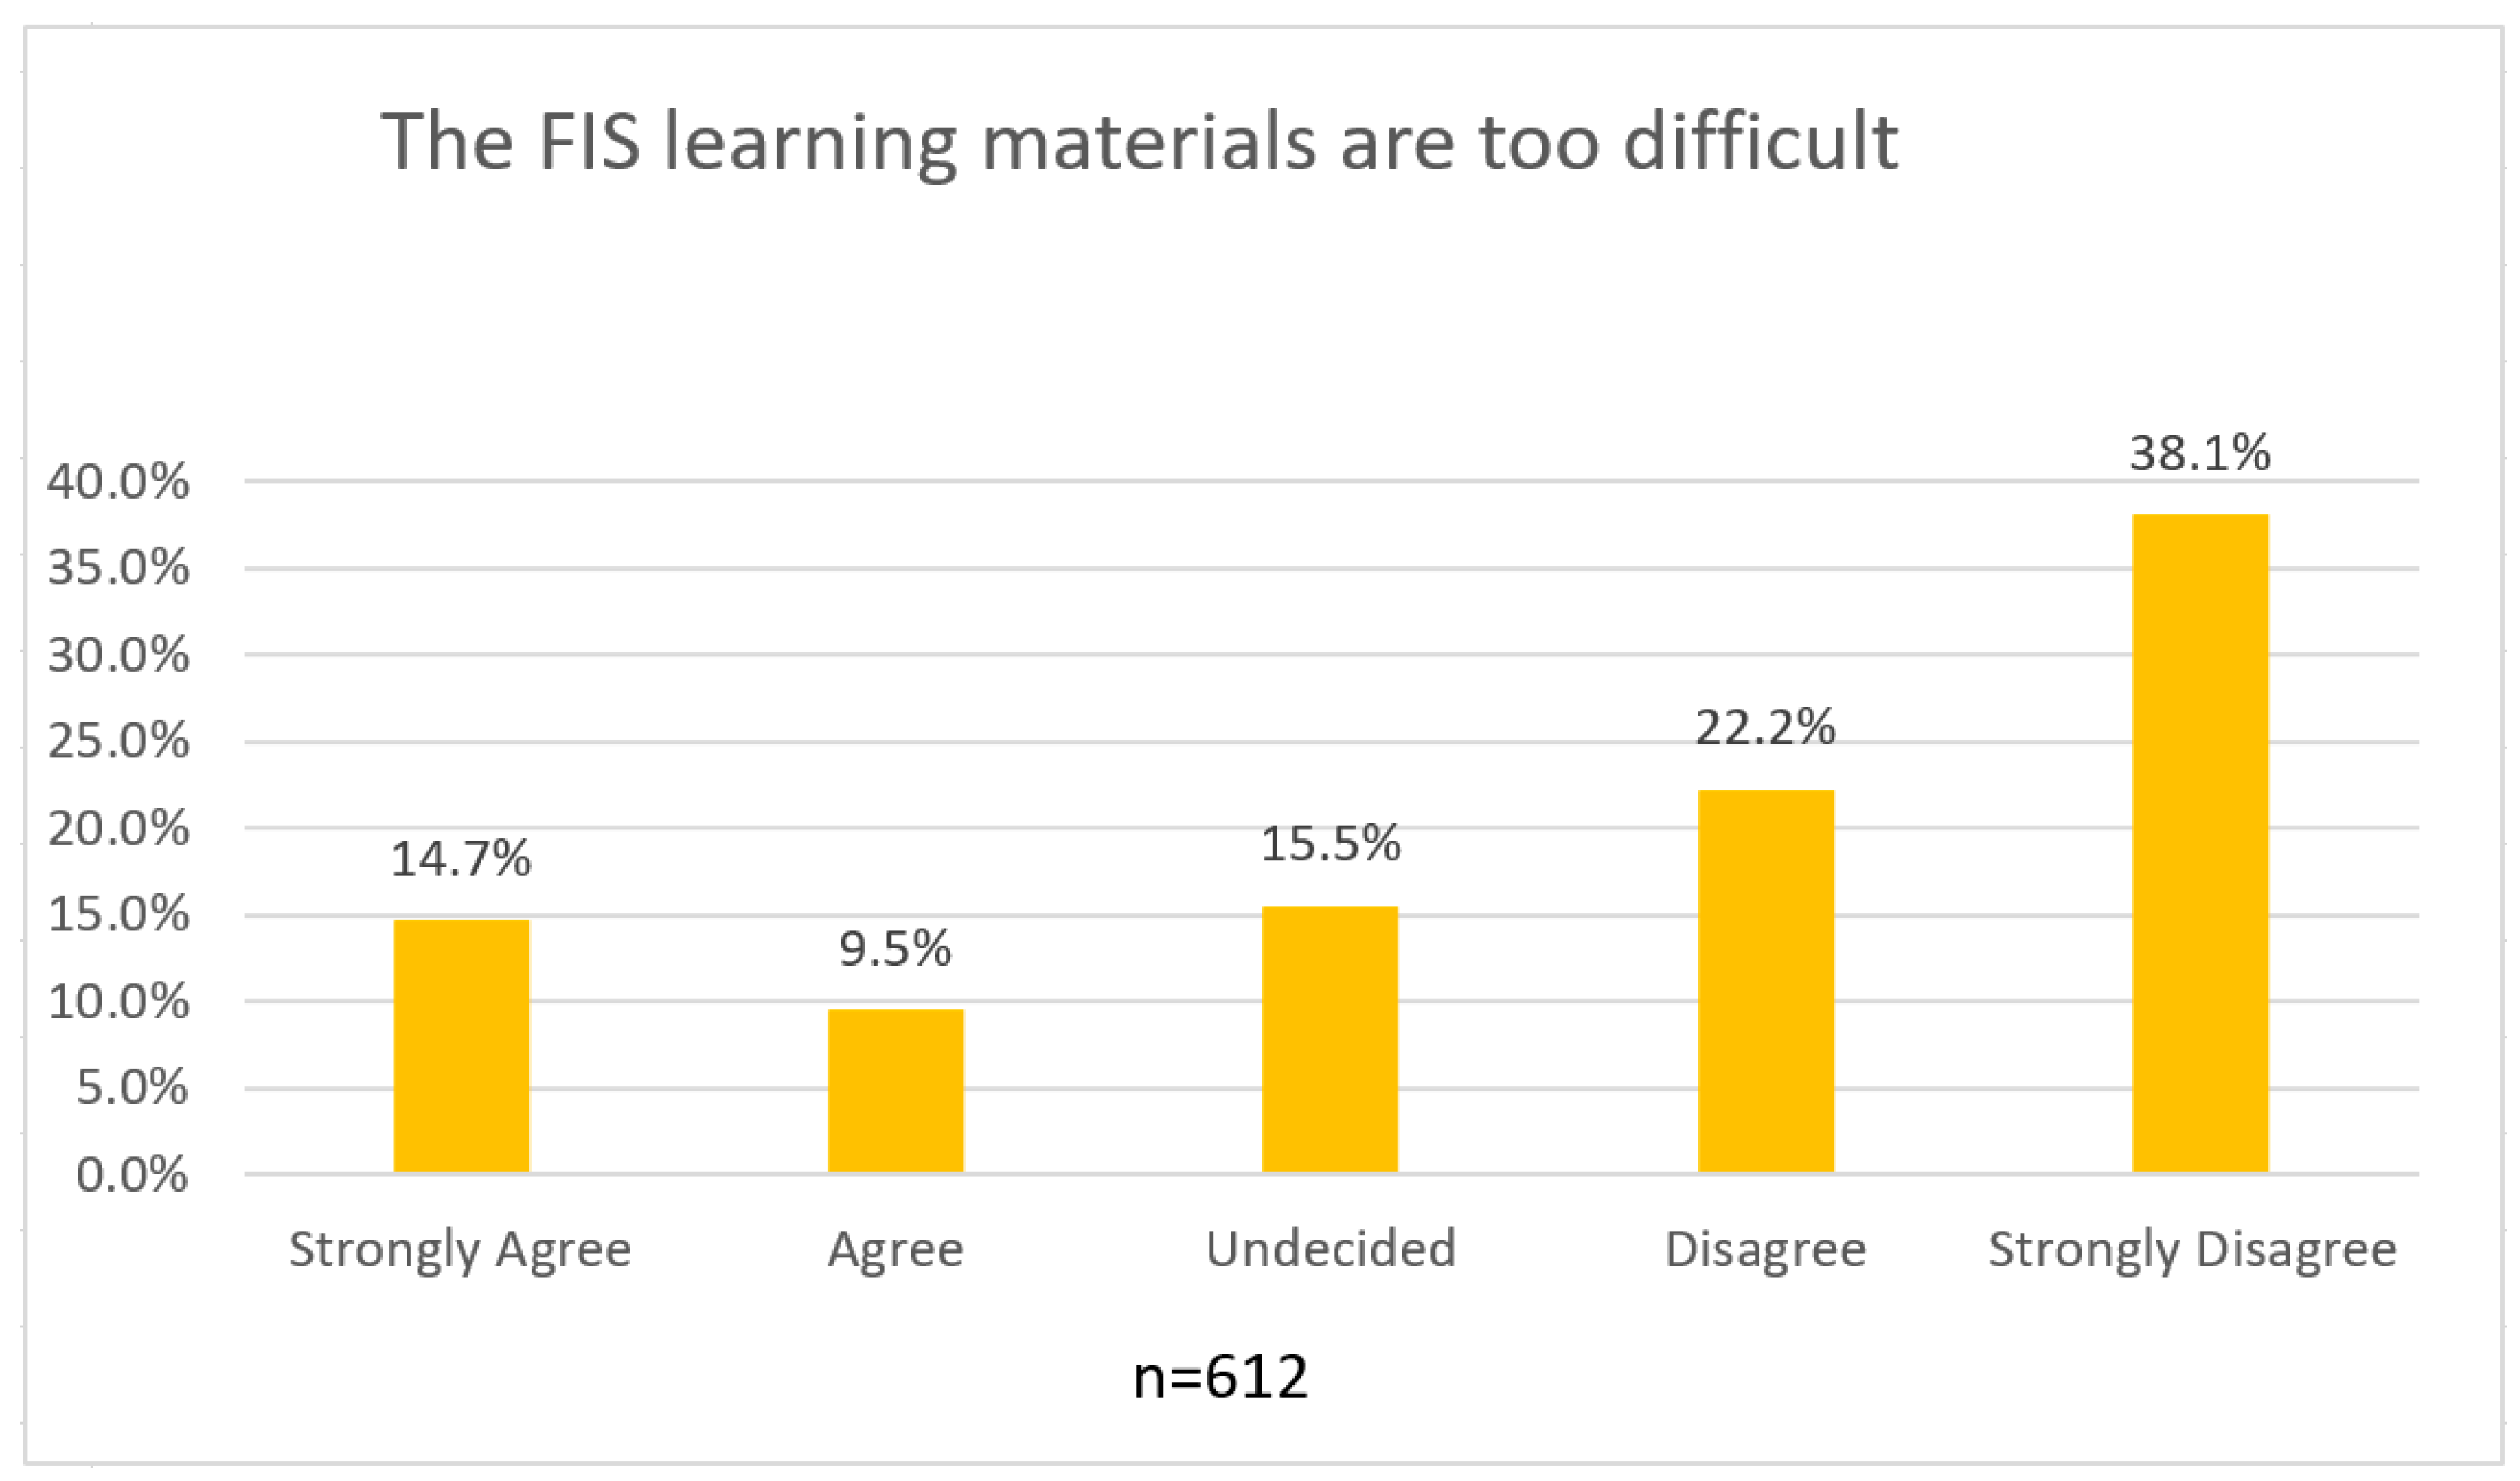
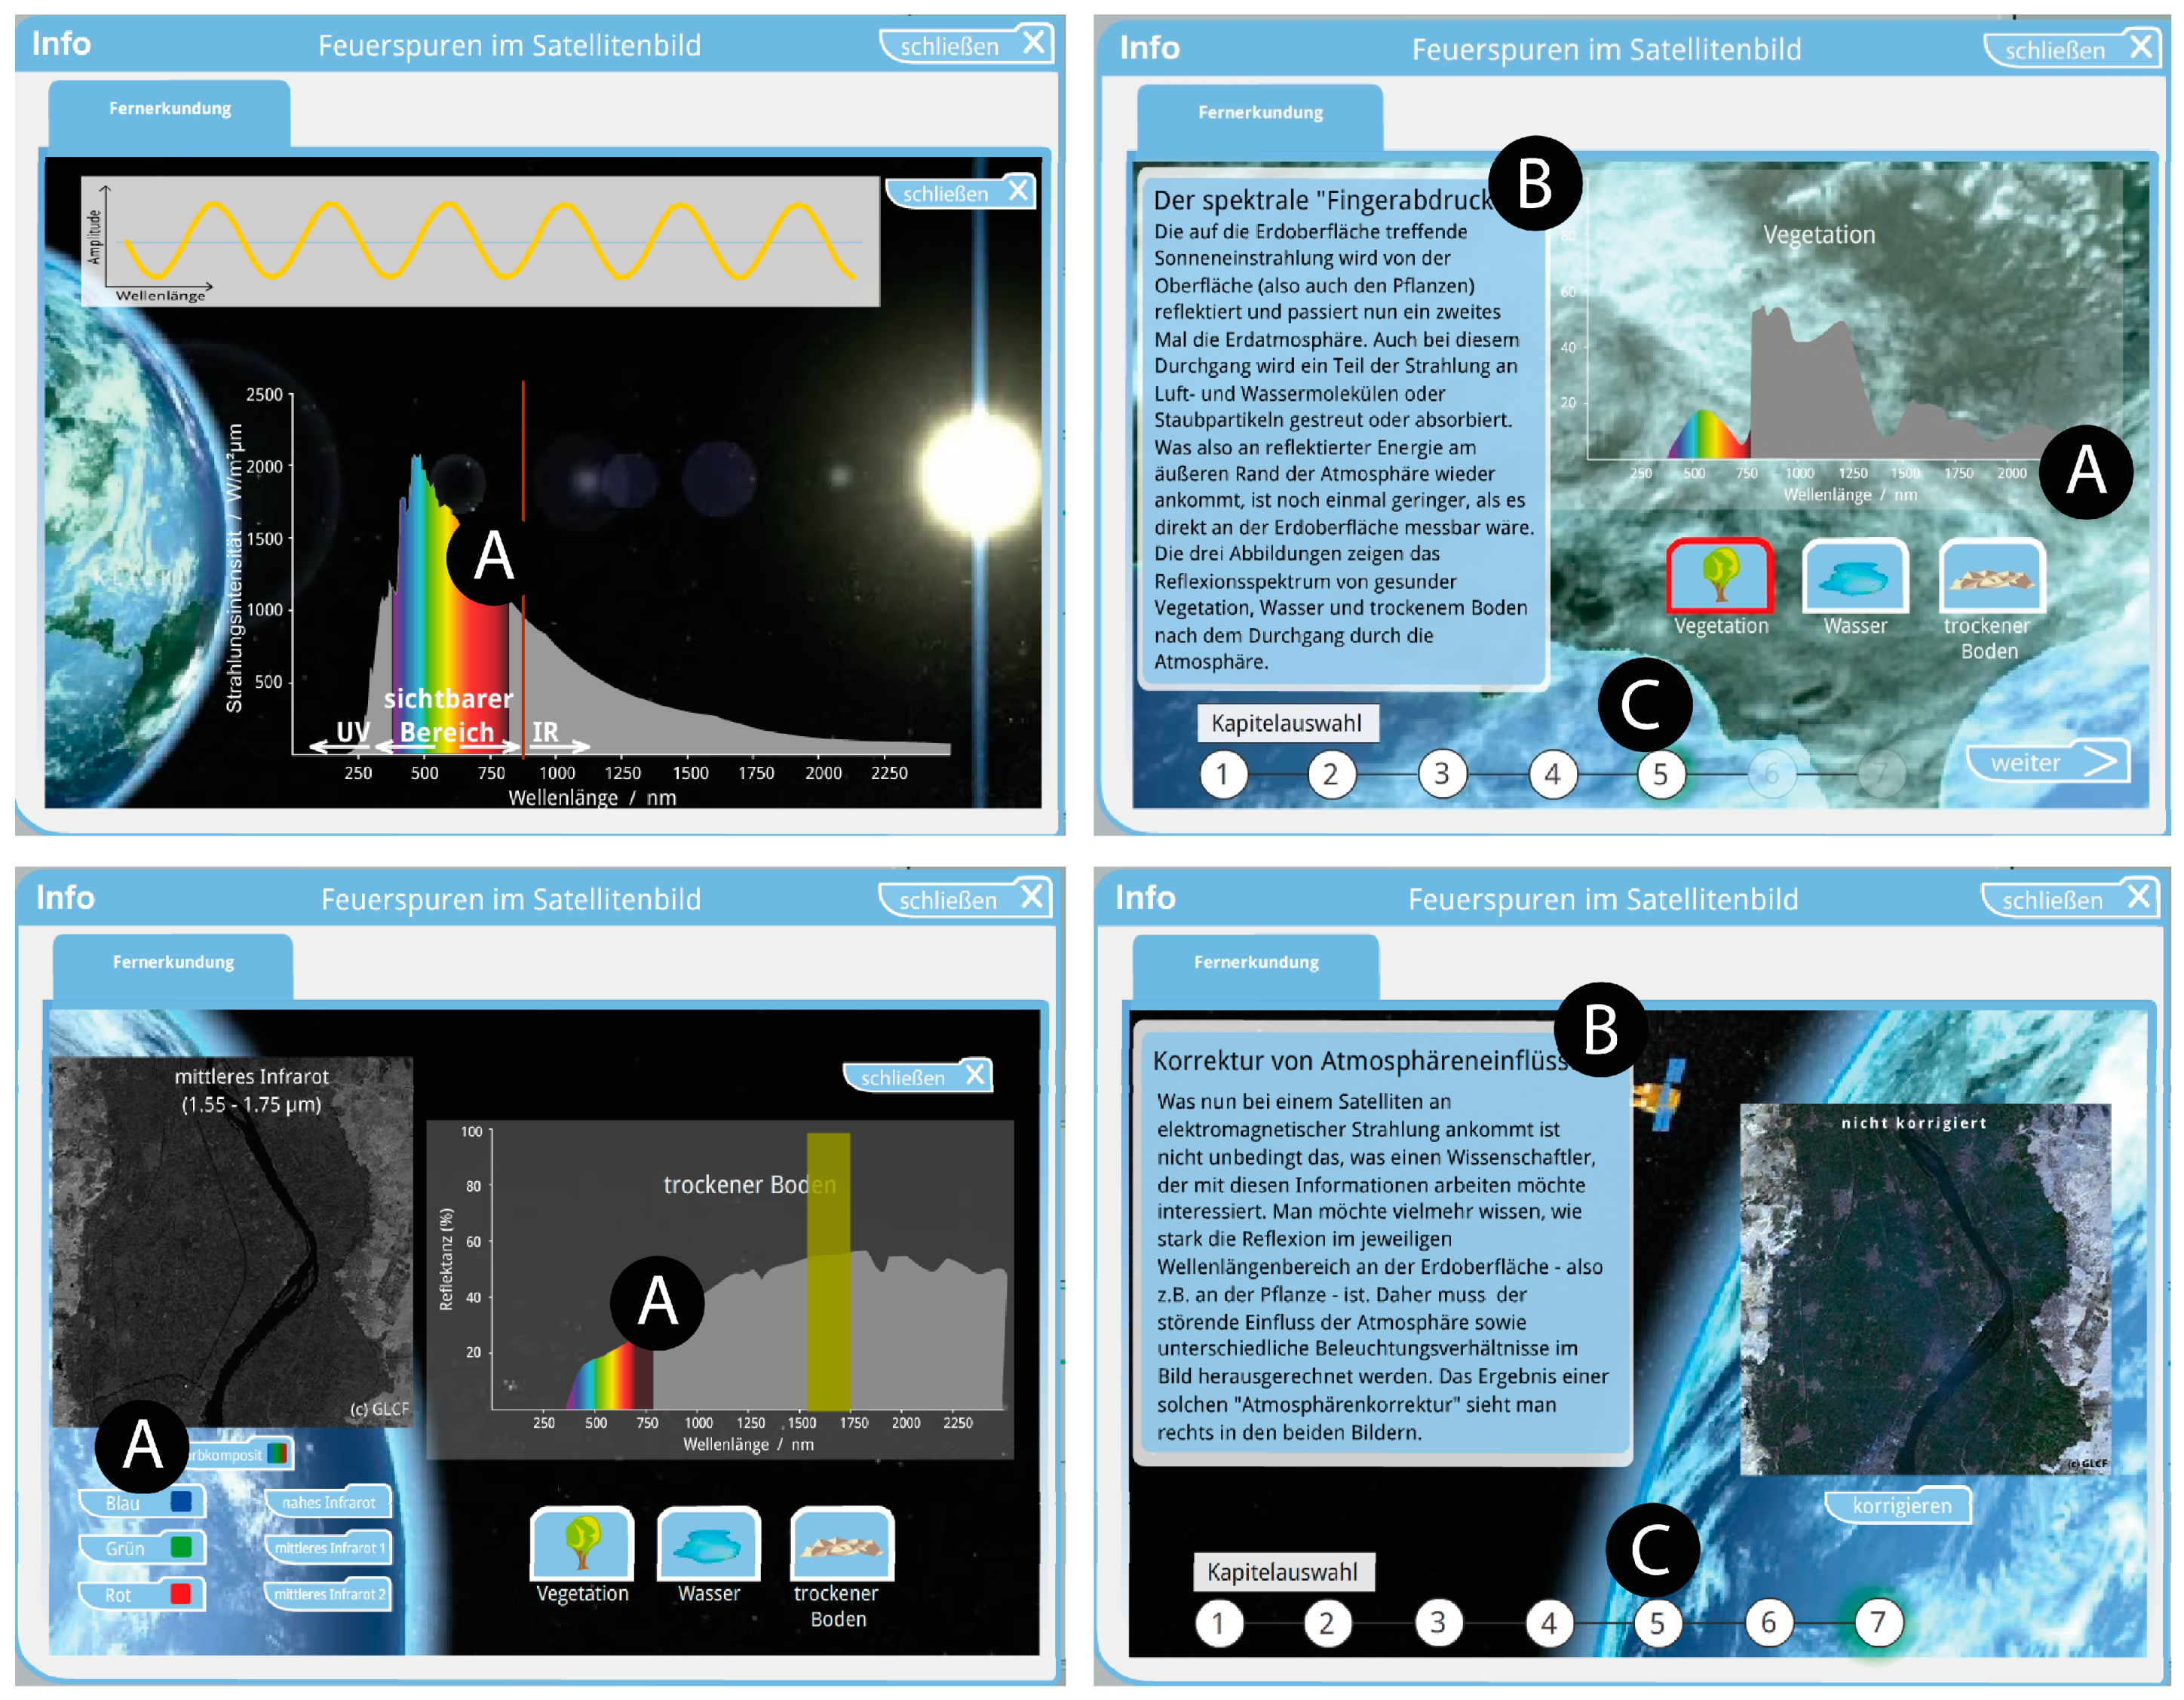
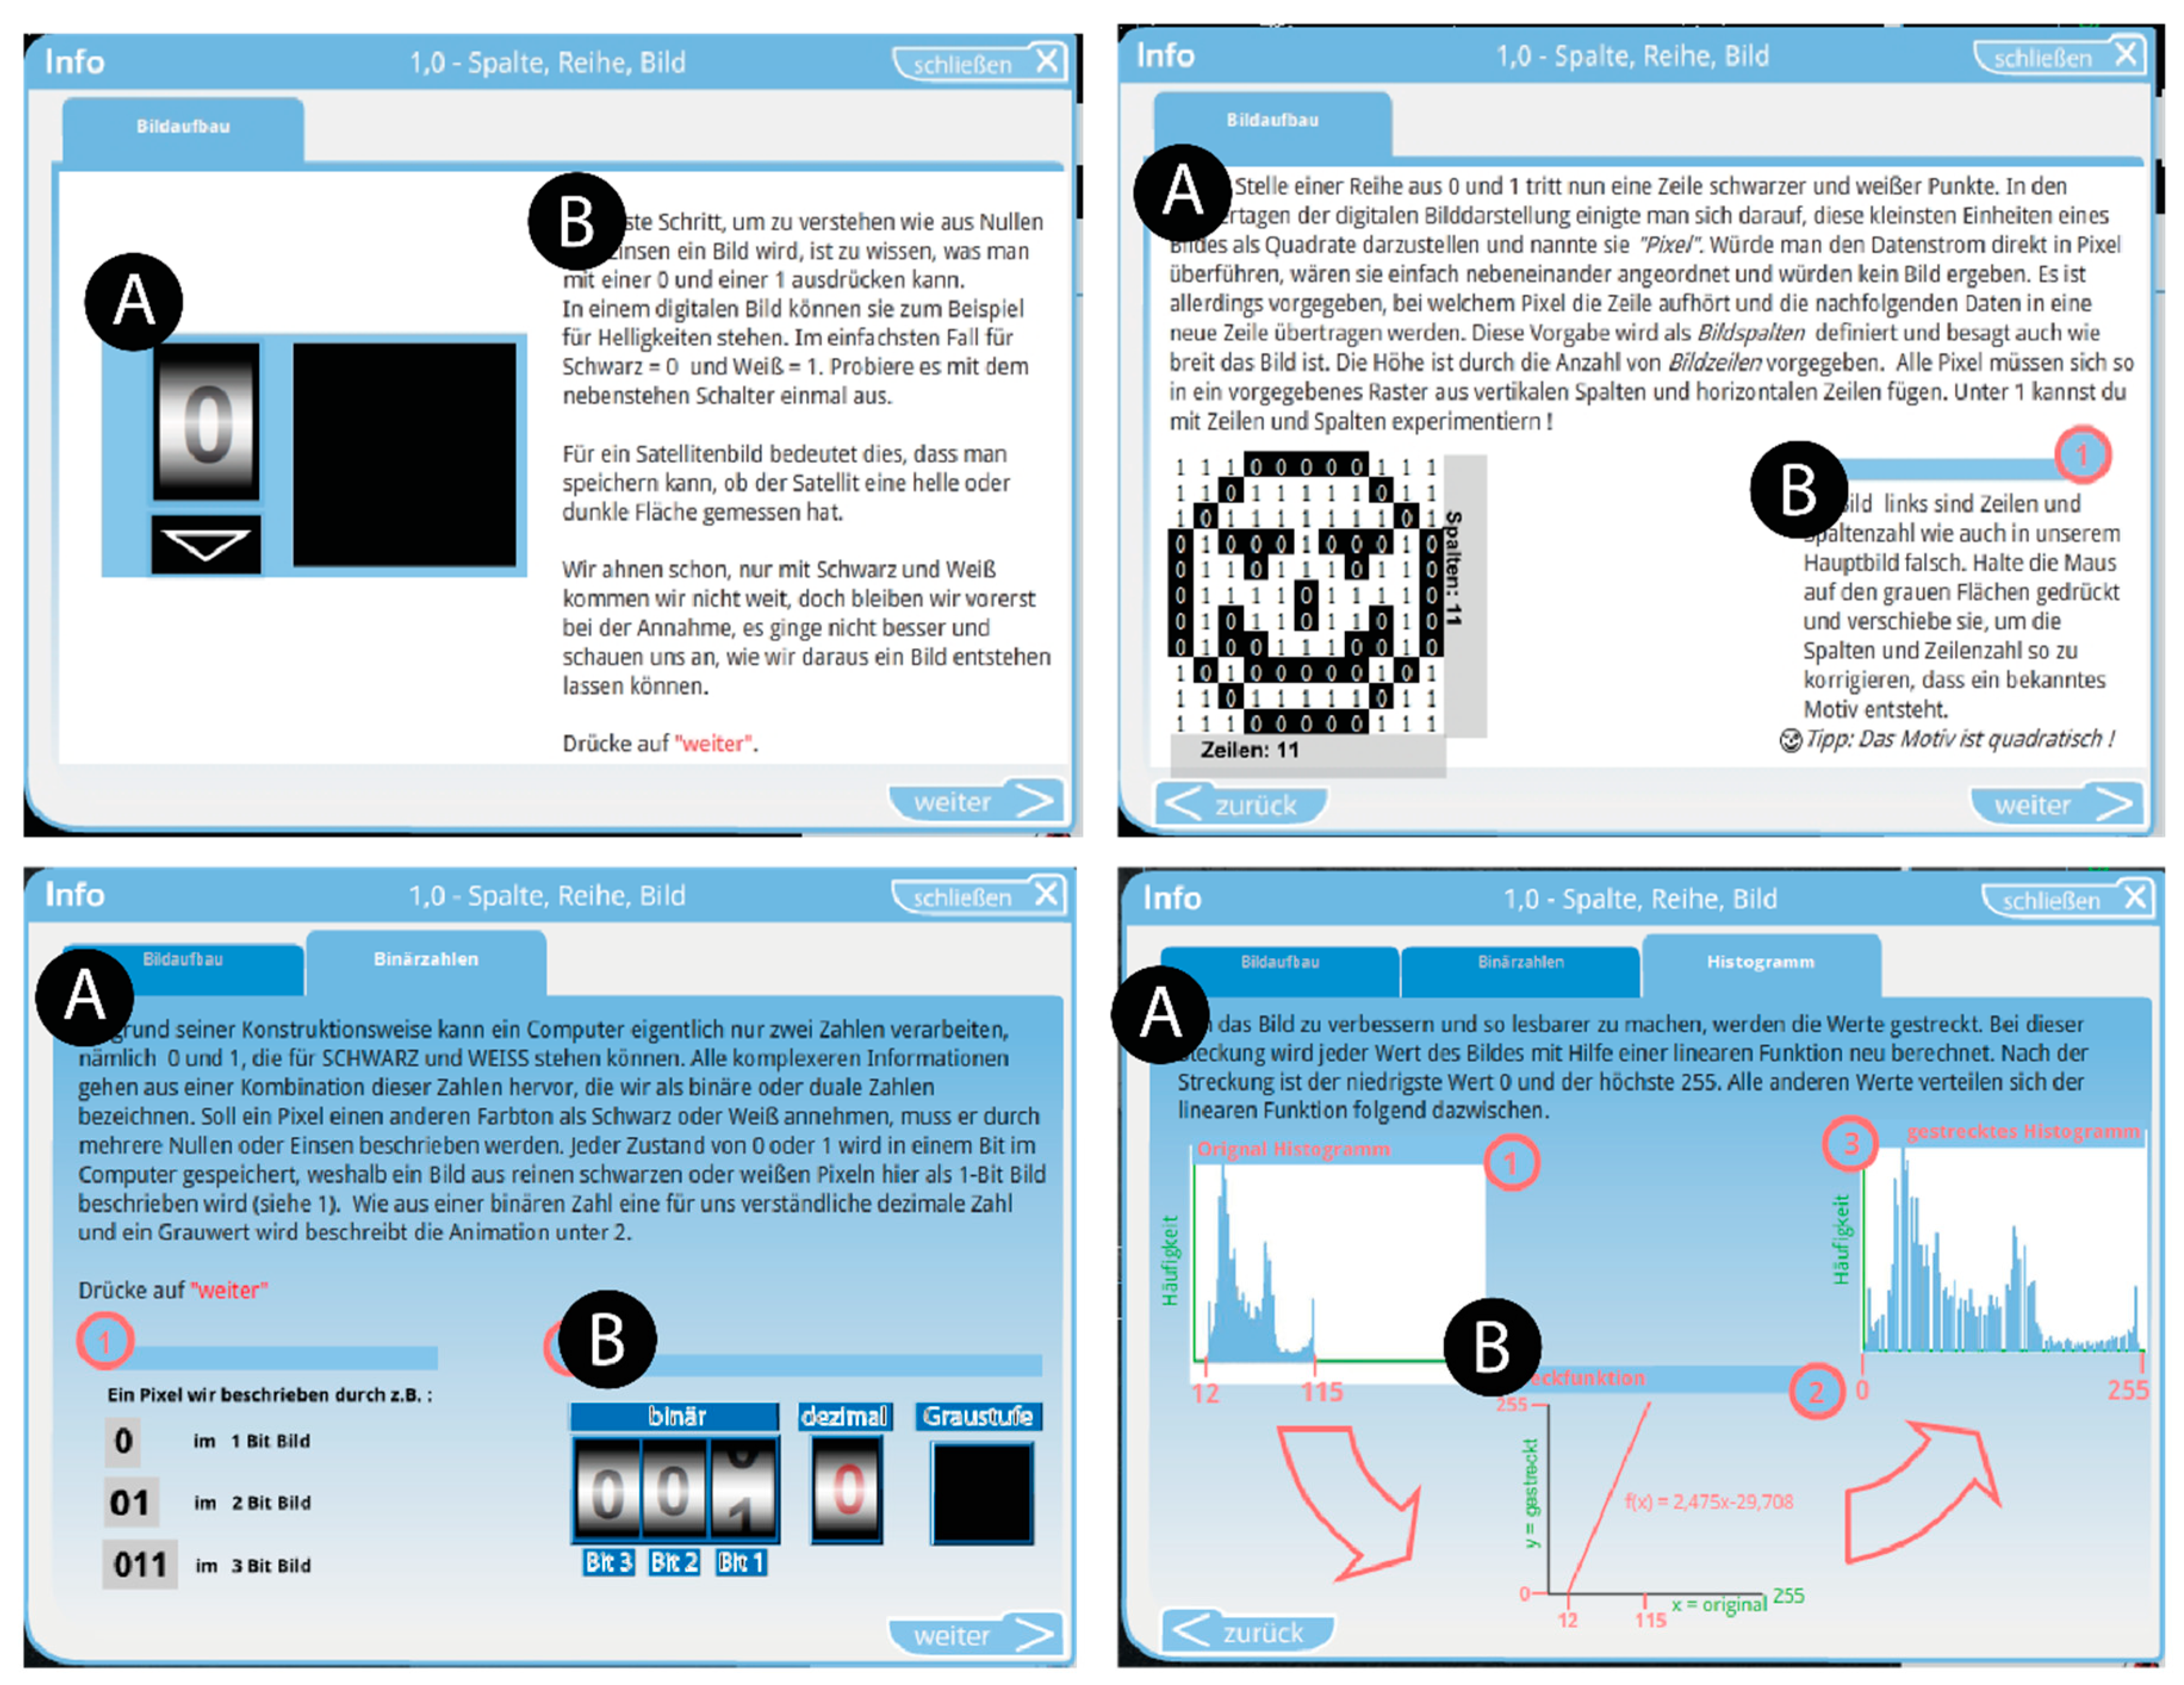
Appendix A.1. The Remote Sensing in Schools Project (FIS)

The integrated learning environments described in this article are part of the Remote Sensing in Schools Project. The project is funded by the German Aerospace Center (DLR) with interruption since 2006. Its primary goal is to find ways to integrate earth observation topics in school classrooms for all STEM subjects. It also represents a way distributing basic knowledge of earth observation to the interested public as well as university students. While the integrated learning environments described in this article play a crucial part in this effort, they are embedded in an online environment that also consists of background information and additional classroom resources. The projects also carries out teacher trainings as well as hands on projects with pupils.

Appendix A.2. Columbus Eye/Kepler ISS Project

From 2013 until 2019 high definition video cameras of the HDEV device on board the international space station provided live images from space that where available in an online video stream. The projects aim is to exploit this special resource for earth observation for educational purposes. The resulting website (columbuseye.rub.de) offers an archive of videos showing special events on the planet. It also contains digital classroom resources ranging from simple classification tools to augmented reality applications.

Appendix A.3. ESERO Germany

ESERO is the abbreviation of European Space Education Recourse Office. The Geomatics Working Group at the Ruhr-University of Bochum is the leading team of a consortium of institutions that are tasked by the European Space Administration (ESA) to strengthen the presence of space related topics in Germany’s primary and secondary school education. The ESERO Germany conveys different aspects of human activities in space in STEM subjects with a focus on earth observation.

Appendix B

All learning resources shown in Figure 1, Figure 2, Figure 3, Figure 9 and Figure 10 can be downloaded in English language or accessed online in German language at www.fis.rub.de.

References

  1. Siegmund, A. Satellitenbilder im Unterricht. Ph.D. Thesis, Pädagogischen Hochschule Heidelberg, Heidelberg, Germany, 2011. [Google Scholar]
  2. Ditter, R.; Jacob, C.; Siegmund, A.; Wolf, R. BLIF—A Remote Sensing Web Application for Competence Oriented School Education. In Proceedings of the Fifth Framework of AGIT and the GI-Forum Conference, Salzburg, Austria, 7–9 July 2010. [Google Scholar]
  3. Kerstin, V.; Roland, G.; Henryk, H. Einbindung fernerkundlicher Methoden in den Erdkundeunterricht—das Beispiel der Klassifikation und Change Detection. In Proceedings of the Fourth ‘Learning with Geoinformation’ Conference; Result of the Conference, Held within the Framework of AGIT and Organised in Co-Operation with the HERODOT Network as well as the GI-Forum, Salzburg, Austria, 8–10 July 2009. [Google Scholar]
  4. Asmussen, S.; Engemann, C.; Schühle, M.-H.; Stribel, D.; Wohlgemut, J. Bildungsplan des Gymnasiums. Bildungsplan 2016: Geographie; Neckar-Verlag GmbH: Villingen-Schwenningen, Germany, 2016. [Google Scholar]
  5. Gamerith, W.; Hemmer, I.; Czapek, F. Educational Standards in Geography for the Intermediate School Certificate. With Sample Assignments, 3rd ed.; DGfG: Berlin, Germany, 2014. [Google Scholar]
  6. Eggert, S.; Bögeholz, S. Göttinger Modell der Bewertungskompetenz—Teilkompetenz “Bewerten, Entscheiden und Reflektieren” für Gestaltungsaufgaben Nachhaltiger Entwicklung. Z. Didakt. Naturwissenschaften 2006, 12, 177–197. [Google Scholar]
  7. Goetzke, R.; Hodam, H.; Rienow, A.; Voß, K. Tools and Learning Management Functions for a Competence-Oriented Integration of Remote Sensing in Classrooms, GI_Forum 2013: Conference Proceedings; Wichmann: Heielberg, Germany, 2013; pp. 458–463. [Google Scholar]
  8. Lee, K.T. Teachers using an integrated learning environment to cater for individual learning differences in Hong Kong primary classrooms. Technol. Pedag. Educ. 2005, 14, 371–389. [Google Scholar] [CrossRef]
  9. Fox, M. The Effects of the Integrated Learning Environment on Student Performance at the Navy and Marine Corps Intelligence Training Center. Master’s Thesis, Old Dominion University, Norfolk, VA, USA, 2009. [Google Scholar]
  10. Renn, O.; Hiller, S. MINT-Nachwuchsbarometer. Bildung in der Digitalen Transformation; acatech-Deutsche Akademie der Wissenschaften: München, Germany, 2017. [Google Scholar]
  11. Hardwig, T.; Mußmann, F.; Peters, S.; Parciak, M. Zeiterfassungsstudien zur Arbeitszeit von Lehrkräften in Deutschland. Konzepte, Methoden und Ergebnisse von Studien zu Arbeitszeiten und Arbeitsverteilung im Historischen Vergleich; Niedersächsische Staats—und Universitätsbibliothek Göttingen: Göttingen, Germany; Georg-August-Universität Göttingen Kooperationsstelle Hochschulen und Gewerkschaften: Göttingen, Germany; GOEDOC Dokumenten—und Publikationsserver der Georg-August-Universität Göttingen: Göttingen, Germany, 2018. [Google Scholar]
  12. forsa Politik—und Sozialforschung GmbH. Die Schule aus Sicht der Schulleiterinnen und Schulleiter—Digitalisierung und Digitale Ausstattung: Ergebnisse einer Bundesweiten Repräsentativbefragung. Available online: https://www.vbe.de/fileadmin/user_upload/VBE/Service/Meinungsumfragen/2019-04-17_forsa-Bericht_SL_Digitalisierung_Bund.pdf (accessed on 14 August 2019).
  13. Clark, R.C.; Mayer, R.E. e-Learning and the Science of Instruction. Proven Guidelines for Consumers and Designers of Multimedia Learning; John Wiley & Sons: New York, NY, USA, 2011; ISBN 1118086163. [Google Scholar]
  14. Mayer, R.E. (Ed.) The Cambridge Handbook of Multimedia Learning, 1st ed.; Cambridge University Press: Cambridge, UK, 2005; ISBN 978-0-521-54751-2. [Google Scholar]
  15. Aldrich, C. Learning by doing. In A Comprehensive Guide to Simulations, Computer Games, and Pedagogy in E-Learning and Other Educational Experiences; Pfeiffer: San Francisco, CA, USA, 2005; ISBN 0787977357. [Google Scholar]
  16. Mayer, R.E. (Ed.) The Cambridge Handbook of Multimedia Learning, 2nd ed.; Cambridge University Press: Cambridge, UK, 2014; ISBN 9781107610316. [Google Scholar]
  17. De Jong, T.; Lazonder, A.W. The Guided Discovery Learning Principle in Multimedia Learning. In The Cambridge Handbook of Multimedia Learning, 2nd ed.; Mayer, R.E., Ed.; Cambridge University Press: Cambridge, UK, 2014; pp. 371–390. ISBN 9781107610316. [Google Scholar]
  18. Terhart, E. Constructivism and teaching: A new paradigm in general didactics? J. Curric. Stud. 2003, 35, 25–44. [Google Scholar] [CrossRef]
  19. Sjøberg, S. Constructivism and Learning. International Encyclopedia of Education; Elsevier: Amsterdam, The Netherlands, 2010; pp. 485–490. ISBN 9780080448947. [Google Scholar]
  20. Piaget, J. The Construction of Reality in the Child, 2nd ed.; Basic Books: New York, NY, USA, 1954. [Google Scholar]
  21. Kirschner, P.; Sweller, J.; Clark, R. Why Minimal Guidance During Instruction Does Not Work: An Analysis of the Failure of Constructivist, Discovery, Problem-Based, Experiential, and Inquiry-Based Teaching. Educ. Psychol. 2006, 41, 75–86. [Google Scholar] [CrossRef]
  22. Mayer, R. Should There Be a Three-Strikes Rule Against Pure Discovery Learning? Am. Psychol. 2004, 59, 14–19. [Google Scholar] [CrossRef] [PubMed] [Green Version]
  23. Sweller, J. Cognitive Load during Problem Solving: Effects on Learning. Cognit. Sci. 1988, 12, 257–285. [Google Scholar] [CrossRef]
  24. Tuovinen, J.E.; Sweller, J. A comparison of cognitive load associated with discovery learning and worked examples. J. Educ. Psychol. 1999, 91, 334–341. [Google Scholar] [CrossRef]
  25. Tanja, R. Moderater Konstruktivismus. In Theorien in der Biologiedidaktischen Forschung: Ein Handbuch für Lehramtsstudenten und Doktoranden; Krüger, D., Vogt, H., Eds.; Springer: Berlin/Heidelberg, Germany, 2007; pp. 69–79. ISBN 978-3-540-68166-3. [Google Scholar]
  26. Duit, R. Zur Rolle der konstruktivistischen Sichtweise in der Naturwissenschaftsdidaktischen Lehr—und Lernforschung. On the Role of the Constructivist Perspective in Didactic Research on Science Instruction; Beltz: Weinheim, Germany, 1995. [Google Scholar]
Figure 1. Annotated screenshot of the module “Floods—Dealing with a constant thread”. All data and the necessary tools are integrated in the learning environment. Background knowledge is made available through an info box. The infrastructure is a combination of methods by which to structure the whole learning module (Source: see Appendix B).
Remotesensing 12 00345 g001
Figure 2. Different setups of available tools. (A) Minimal setup (B) Threshold classification; (C) Tools for bitwise pixel manipulation and histogram stretching; (D) NDVI Timeline Analysis (Source: see Appendix B).
Remotesensing 12 00345 g002
Figure 3. The “Multiple Representations Principle” in action. (A) shows a screenshot of the learning environment “Floods” with an interaction about the creation of a digital terrain model. Text and interaction complement each other. (B) shows an example of the module “Forests—A Climate Saver?” where an interactive component alongside a text explains how infrared is depicted in an image (Source: see Appendix B).
Remotesensing 12 00345 g003
Figure 4. Pupils agreement with the statement: “Working with the compute was easy”.
Remotesensing 12 00345 g004
Figure 5. Pupils agreement with the statement: “The FIS learning materials are too difficult”.
Remotesensing 12 00345 g005
Figure 6. Differences in pupils agreement with the statement: “The lesson is too difficult” in two different classroom resources.
Remotesensing 12 00345 g006
Figure 7. Pupils agreement with the statement: “The illustrations and animations are helpful for completing the tasks”.
Remotesensing 12 00345 g007
Figure 8. Pupils reacting positively (agreeing strongly or agreeing) or negatively (disagreeing or disagreeing strongly) to the statement “The illustrations and animations are helpful for completing the tasks” in different learning modules.
Remotesensing 12 00345 g008
Figure 9. Presumed incorrect use of the “Coherence Priciple”. (A) Interaction/Animation; (B) Text; (C) Chapter Indicatior (Source: see Appendix B).
Remotesensing 12 00345 g009
Figure 10. Refined use of the “Coherence Principle”. (A) Interaction/Animation; (B) Text (Source: see Appendix B).
Remotesensing 12 00345 g010
Figure 11. Accumulated module access and download.
Remotesensing 12 00345 g011
Table 1. Defined demands and how they are addressed on a technical level.
DemandTechnical Contribution
Unencumbering InfrastructureThe modules have no need for installation; they are accessible either online or are downloadable, and can be directly executed.
Scalable ToolsThe tools resemble their counterparts found in professional software, but are redesigned for ease of use. They can be tied to a certain task, meaning they are only made available when needed.
Prepared DataThe data is predefined for the task at hand. No data has to be prepared on the teacher’s side.
Color corrections are done automatically. Using a simple drag and drop-based user interface, the data can either be displayed or added to a tool for analysis.
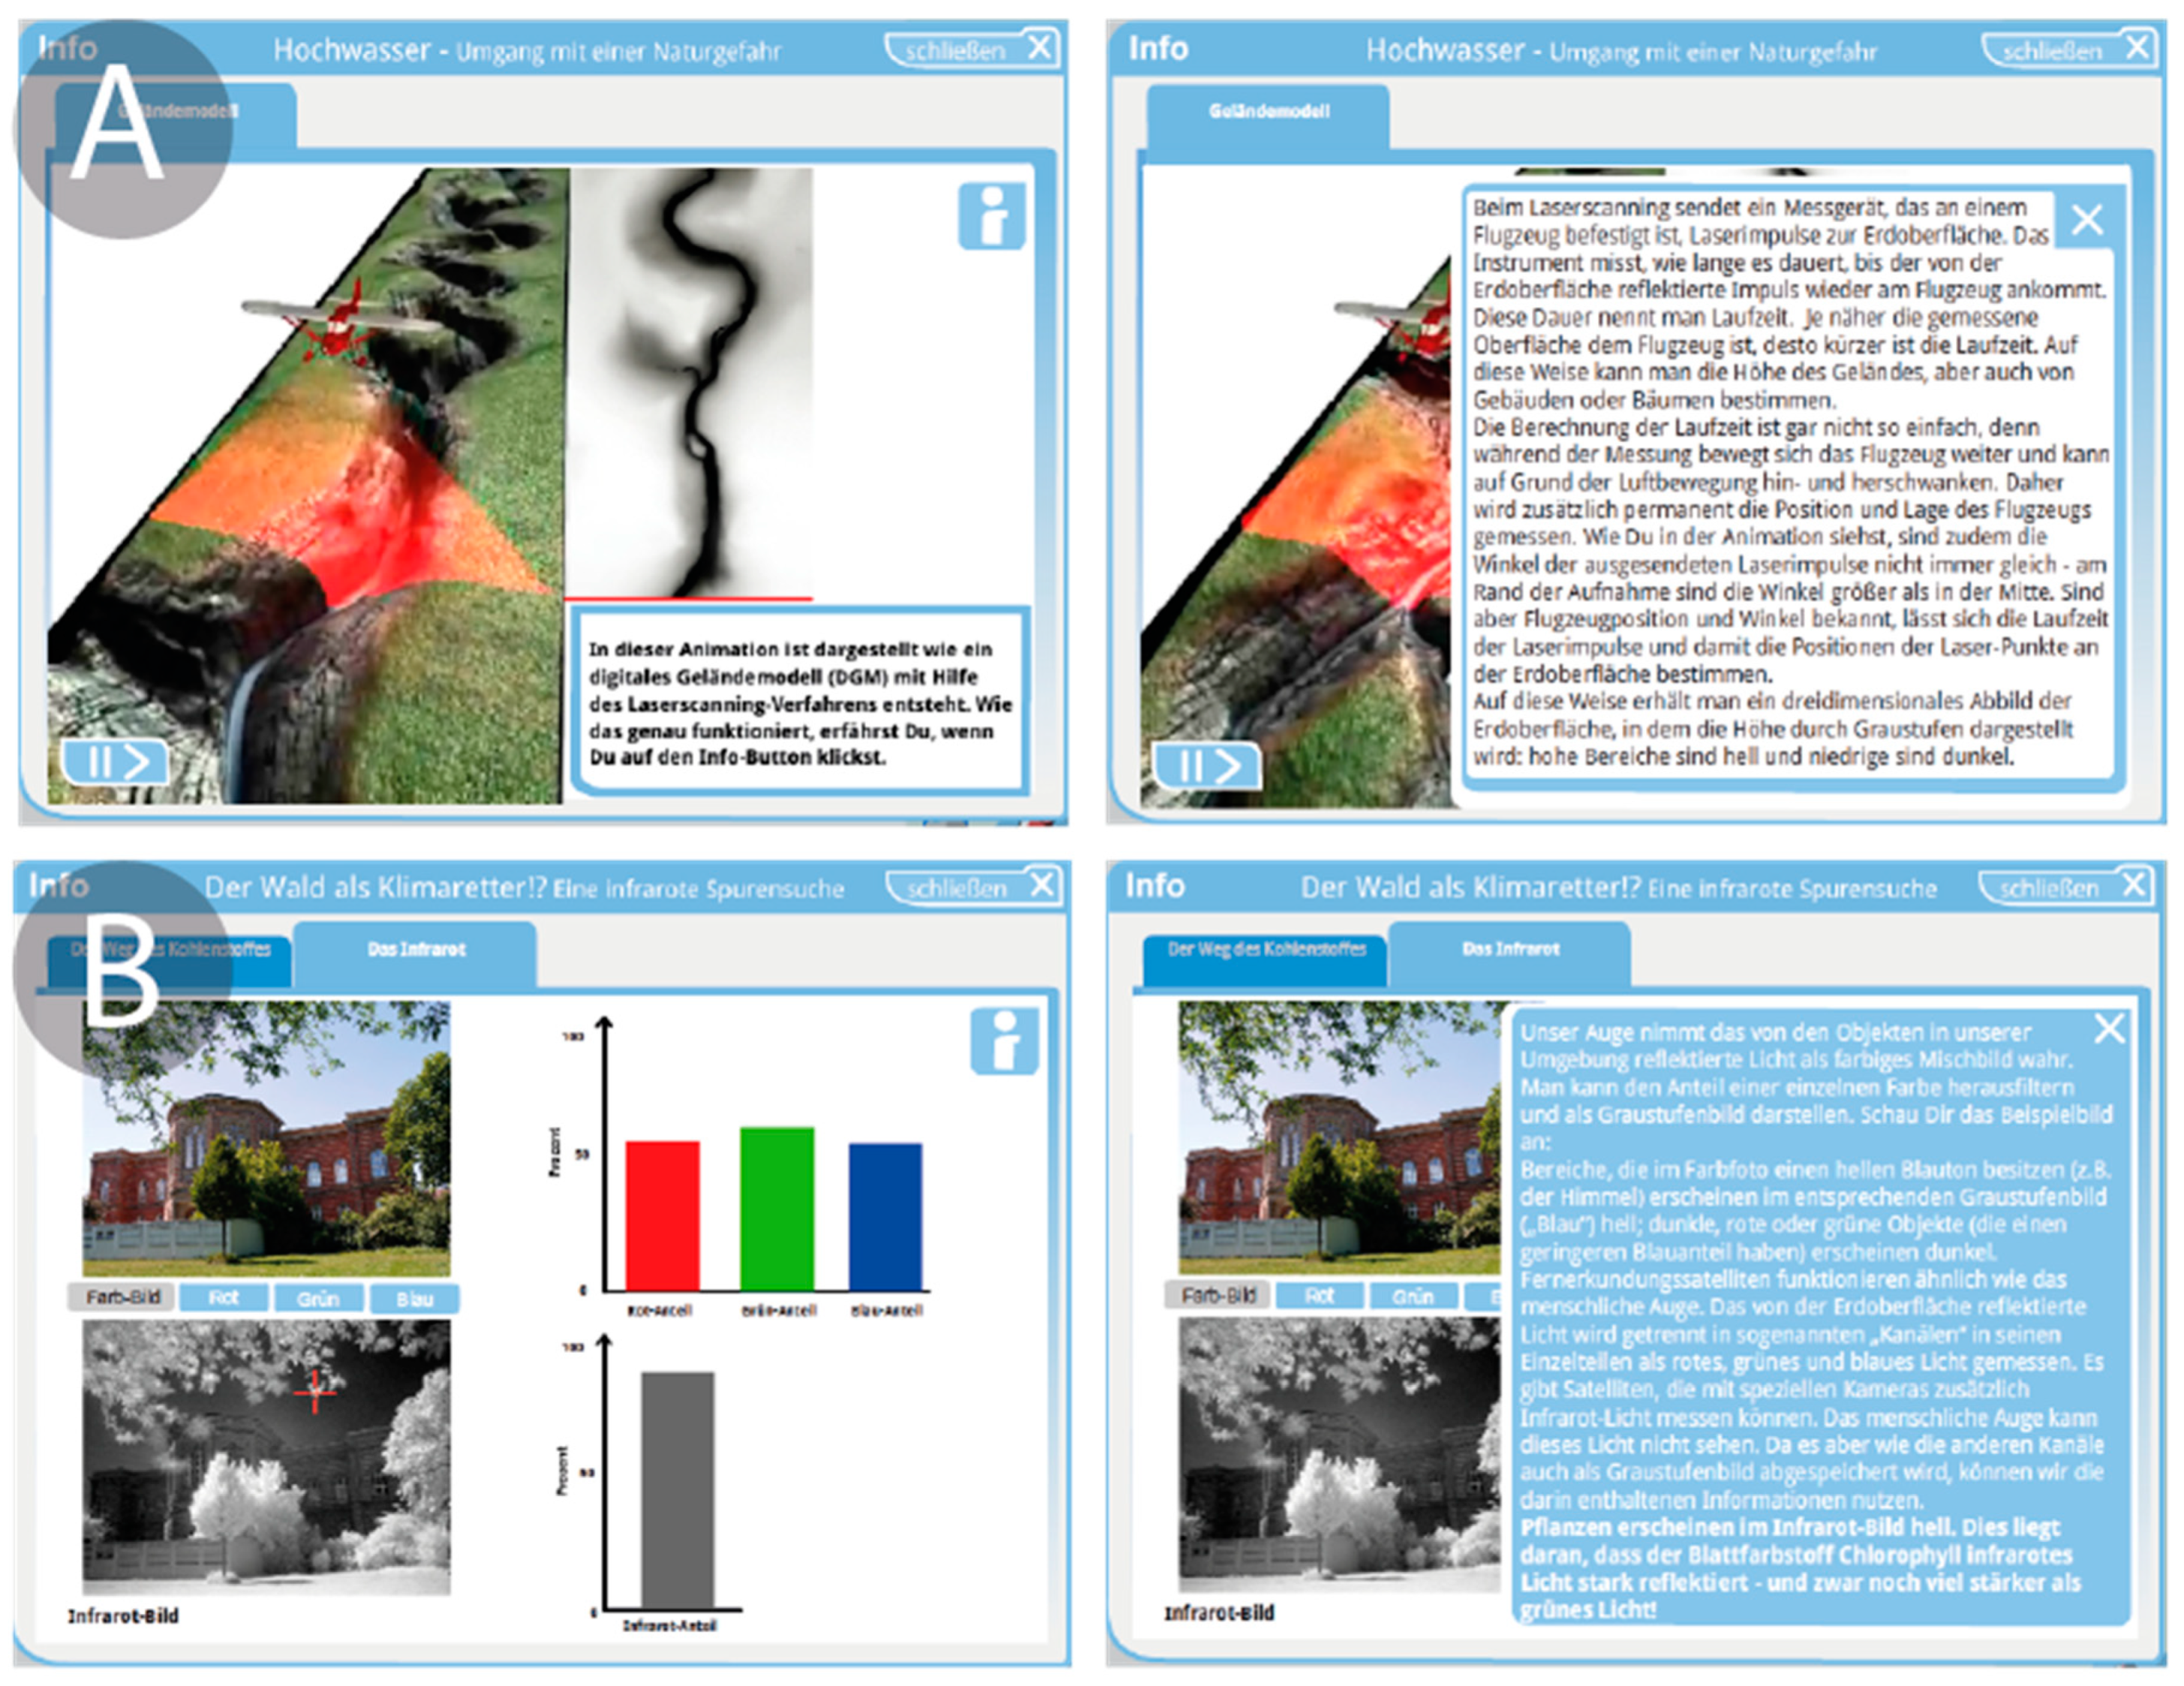
Integrated Background KnowledgeThe background knowledge needed to understand the task can be easily accessed in the learning environment, and is heavily driven by animations and interactions.
Table 2. Functionalities implemented in the learning modules.
Functionality GroupDescriptionFunctionalities
Core FunctionalitiesFunctionalities that are not triggered by user input.
  • Analyze bands as original reflectance data
  • Automated linear, standard deviation-based image stretching for displaying band data
  • Display bitmap data
  • Layer logic
  • Include metainformation for the data
  • Data pool for user created images
Main functionalitiesBasic functionalities that serve image analysis and are not tied to a task or a data type
  • Pixel info
  • Swipe
  • Measure distances
  • Measure area
  • Save images to desktop
Analysis functionalitiesFunctionalities that are more specifically tied to a task or data type.
  • NDVI
  • Change detection
  • Threshold classification
  • Minimum distance classification
  • Maximum likelihood classification
  • Time series analysis
  • Edge detection filter
  • Median filter
  • Mean filter
  • Histogram stretch
  • Bit depth reduction
  • Pixel wise bit value manipulation

