Abstract
This paper tests an automated methodology for generating training data from OpenStreetMap (OSM) to classify Sentinel-2 imagery into Land Use/Land Cover (LULC) classes. Different sets of training data were generated and used as inputs for the image classification. Firstly, OSM data was converted into LULC maps using the OSM2LULC_4T software package. The Random Forest classifier was then trained to classify a time-series of Sentinel-2 imagery into 8 LULC classes with samples extracted from: (1) The LULC maps produced by OSM2LULC_4T (TD0); (2) the TD1 dataset, obtained after removing mixed pixels from TD0; (3) the TD2 dataset, obtained by filtering TD1 using radiometric indices. The classification results were generalized using a majority filter and hybrid maps were created by merging the classification results with the OSM2LULC outputs. The accuracy of all generated maps was assessed using the 2018 official “Carta de Ocupação do Solo” (COS). The methodology was applied to two study areas with different characteristics. The results show that in some cases the filtering procedures improve the training data and the classification results. This automated methodology allowed the production of maps with overall accuracy between 55% and 78% greater than that of COS, even though the used nomenclature includes classes that can be easily confused by the classifiers.
1. Introduction
Knowledge regarding the Earth’s surface and its’ use for human activities is critical for several applications, such as climate change monitoring and forecast [1,2], habitat conservation and planning [3,4], population mapping [5,6], urban planning [7], policy making [8], among others [9,10]. Due to the speed of population growth and the human intervention on the landscape, changes on both the land use and land cover at a given location may occur within short time intervals. Hence, the fast generation of updated land use land cover (LULC) maps is becoming increasingly important.
Remote sensing data has long been used as an input to generate LULC maps [11,12]. The high revisit capabilities and wide coverage of remote sensing platforms, such as Landsat and Sentinel, allow the automated generation of LULC maps with high temporal frequencies [13,14,15]. However, supervised satellite image classification demands training data sets that are able to characterize each of the target classes [16,17]. Hence, training data are central within the LULC map generation process, as their quality and representativeness of the classes will determine the quality of the classification result. Such training data is usually generated by human photointerpretation of higher resolution imagery, such as very high spatial resolution satellite or aerial imagery, and/or from field surveys, which are costly and time-consuming processes [18,19]. This is a major limitation when seeking to automatically generate LULC maps and fully explore the potential of satellite imagery with temporal resolutions of just a few days, such as by using the imagery collected by both satellites of the Sentinel-2 constellation. Therefore, it is desirable to develop methodologies that enable the automatic generation of training data, either by using already available sets of ancillary information, adopting a data driven approach or utilizing a mix of the two.
Volunteered Geographic Information (VGI) [20], mainly generated with citizen contributions, is one of the possible sources of data that can be used to create training data for a LULC classifier. Other terms for VGI are also used, such as Geographic Citizen Science, Neogeography or Participatory Sensing, even though they have slightly different meanings [21]. One of the most successful VGI projects is OpenStreetMap (OSM) [22], which has millions of contributors all over the world and aims to create a vector map of the world. The data created by all contributors are then available for free download and use.
Arsanjani et al. [23], showed that data capable of generating LULC maps comparable to Urban Atlas (UA) may be obtained from OSM [24]. Based on these findings, a methodology was created to automatically convert OSM data into LULC classes [25,26,27] using several nomenclatures, namely level 2 classes of CORINE Land Cover (CLC) [28], and UA, as well as GlobeLand30 classes [29]. Nonetheless, OSM data is often incomplete, even in regions where the OSM data coverage is high. This becomes more evident in the regions where a larger amount of data is missing in OSM. To overcome this limitation, the data derived from OSM was merged with GlobeLand30 to generate hybrid maps for two study areas in Africa and Asia [26]. Shultz et al. [30], created a LULC product with the CLC nomenclature using OSM derived data, and completed the regions with no data in OSM by classifying Landsat satellite imagery using the OSM derived data as training data. The results were compared with CLC and the obtained accuracy was higher than 80%.
Arsanjani et al. [31], also tested the use of data extracted from OSM to train the Maximum Likelihood Classifier to classify a RapidEye image of an urban area using the UA nomenclature. The results were compared to UA and a kappa index of 89% was obtained. In [32], OSM data was also used to classify a time-series of Landsat satellite imagery. However, only the data regarding the OSM keys “natural” and “landuse” were used. Several challenges were identified such as missing data in some classes of interest, positional and thematic errors and the imbalanced class distribution in the training data. To overcome the first problem, the authors discarded classes with less than 10 polygons in OSM, polygons that could not be clearly associated to a single class as well as polygons with an area inferior to a pixel (with a spatial resolution of 30 × 30 m). To overcome the second problem, artificial training samples were generated using the synthetic minority over-sampling technique. Several classification techniques were tested considering four, five and six classes. The accuracy results in some cases was more than 80%.
Haufel et al. [33], developed a semi-automated approach to classify orthophotos of urban areas into four classes: buildings, roads, low vegetation and high vegetation. For OSM roads, which are represented in OSM by linear features, a width of two pixels was considered as spatial extent. As OSM data may have several errors and inconsistencies, the Normalized Difference Vegetation Index (NDVI) and the Normalized Digital Surface Model (NDSM) were used; these methods were useful for solving spectral and geometric problems mainly related with vegetation and height of features. Random Forest was used as a classifier and the results appeared to be promising, even though no quantitative accuracy assessment was made.
While several methods were already proposed to consider OSM derived data as training for image classifiers to generate LULC maps, further developments are still necessary to obtain reliable datasets which are able to accommodate both urban and rural scenes. This paper aims to propose an automated methodology to generate LULC maps using three approaches which successively filter OSM data to generate high quality training data. These three datasets were used to classify a time-series of Sentinel-2 satellite imagery using a nomenclature with 8 classes similar to the level 1 classes of the 2018 version of the “Carta de Ocupação do Solo” (COS 2018) produced by the Portuguese national mapping agency. A map derived from COS 2018 was used as reference data to assess the accuracy of the obtained classifications. Experiments were made in two study areas comprising of both urban and rural settings. Hybrid maps (i.e., LULC maps where only areas without OSM coverage are completed by using the outputs of the classifications generated in the previous experiments) were also generated and their quality assessed. This analysis was conducted due to the promising results given by similar approaches [26,30], and it enabled us to assess which methodology (i.e., use OSM just for training or to generate hybrid maps) provided better results.
Overall, the presented approaches showed that OSM may provide valuable training data to incorporate into automated LULC classification routines. Namely, the filtering of OSM data with several indices present in the literature (e.g., NDVI) was shown to improve accuracy metrics of the resulting LULC maps.
2. Study Areas and Datasets
In this section the study areas used for testing the proposed methodology are presented and the datasets used in the paper described, namely OSM data, the Sentinel-2 satellite imagery and the COS LULC products.
2.1. Study Areas
Two study areas, with different characteristics, are used in this paper. Study area A is located at the Tagus river estuary, in the west part of Portugal (corresponding to the NUTS III Metropolitan Area of Lisbon), while study area B is located in the center of the country, corresponding to the “Beiras and Serra da Estrela” NUTS III region. The two study areas have different degrees of OSM coverage and detail, population density, terrain morphology and vegetation/forest types. Hence, testing the methodology over different scenes and different levels of available OSM data. These regions were selected since they were considered representative when it comes to OSM completion, landscape and urban/rural differences.
2.1.1. Study Area A
Study area A occupies an area of 1560 km2 and includes the city of Lisbon and surrounding areas. Most of the region is urban but also includes agricultural areas, natural vegetation, forest regions and wetlands. Figure 1a shows the location of the study area in continental Portugal, Figure 1b shows the true color visualization of the Sentinel-2 multispectral image collected in 19 June 2018 and Figure 1c shows the OSM data available in the area.
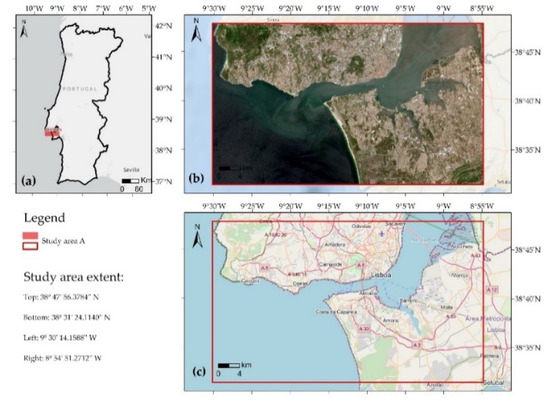
Figure 1.
Study area A: (a) Location within continental Portugal, (b) Sentinel-2 satellite image of the study area collected in 19 June 2018, (c) OSM data available in the study area (OSM basemap provided by ESRI).
2.1.2. Study Area B
Study area B occupies an area of 2000 km2 and is located in the center of continental Portugal. It includes the natural park of “Serra da Estrela”, which is a national park. It is a mountain region with sparse vegetation, rock and forested areas, with some small and dispersed urban areas. Figure 2a shows the location of the study area in continental Portugal, Figure 2b shows the true color visualization of the Sentinel-2 multispectral image collected in 19 June 2018, and Figure 2c shows the OSM data available in the area.
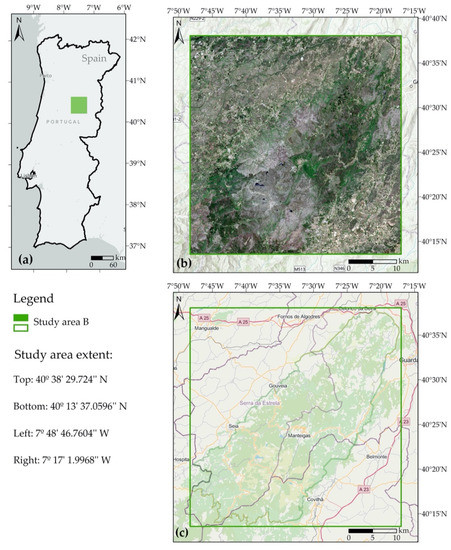
Figure 2.
Study area B: (a) Location within continental Portugal, (b) Sentinel-2 satellite image of the study area collected in 19 June 2018, (c) OSM data available in the study area (OSM basemap provided by ESRI).
2.2. OpenStreetMap Data
OSM is a collaborative project created in 2004 that aims to create a freely available vector map of the world. The project has been very successful, and in May 2020 it had more than 6,000,000 registered users. OSM data is structured into four data types, namely: Nodes, ways, relations and tags [34], which are described as:
- Nodes—Are points with a geographic location expressed by coordinates (latitude and longitude);
- Ways—Are polylines (if open) or polygons (if closed) and are formed by an ordered list of nodes;
- Relations—Are ordered lists of nodes and ways and are used to express relationships between them, such as a travel root including bus lines and stops;
- Tags—Are associated with nodes, ways or relations and include metadata about them. They are formed by pairs of key-value and are used to describe the properties of the elements, where the key specifies a property which has a value for each element. A list of the tags proposed by the OSM community is available at the OSM Wiki (https://wiki.openstreetmap.org/wiki/Map_Features), but the volunteers may add new tags. Examples of tags (key = value) are building = commercial or landuse = forest.
The completeness and types of features available in OSM may vary considerably from region to region, as they depend upon the volunteer’s contributions [35]. Usually, features such as waterways and the road network are the first to be inserted in OSM [36]. It can be seen (Figure 1c) that for study area A, most of the missing data (shown in beige) is outside the urban areas. A large percentage of study area B has no data in OSM and most of the data available refers to the natural park (Figure 2c). In the zones outside the natural park, only a few data is available for the existent urban areas, such as the city of Covilhã (bottom of Figure 2c).
2.3. Sentinel-2 Satellite Images
ESA developed a family of missions for Earth Observation, called the Sentinels, which includes the Sentinel-2. This mission includes two twin satellites (Sentinel-2A and Sentinel-2B), which have on board the MultiSpectral Instrument (MSI) that collects high resolution optical images of the Earth with a temporal resolution of 5 days at the equator. The multispectral images have 13 bands with different spatial resolutions in the Visible Near Infrared (VNIR) and the Short-Wave Infrared (SWIR) wavelengths. Table 1 shows the bands, the corresponding wavelengths and their spatial resolutions [37].

Table 1.
Bands of multispectral images collected by the Sentinel-2 mission, their central wavelength, bandwidth and spatial resolution.
For each study area a time series formed by three Sentinel-2 images with the processing Level-2A was used for the analysis, so that the seasonal variation of vegetation could be captured. The collection dates of the images are shown in Table 2, as well as the Sentinel GRID corresponding to their location. For the study presented in this paper, only the 10 m spatial resolution bands were used in the classification (B2–B4 and B8), as the intention was to generate a LULC map with 10 m spatial resolution. However, band 11 was used to compute the NDBI, as explained in Section 3.3.

Table 2.
Details about the bands and images used for the analysis made in each study area.
2.4. The Portuguese Land Cover Map (COS)
The “Carta de Ocupação do Solo—COS” product is a LULC map produced by the Direção Geral do Território (DGT), which is the Portuguese institution responsible for producing official topographic cartography and several types of thematic maps. This LULC product has versions for the years 1990, 1995, 2007, 2010, 2015 and 2018. The COS series is produced in the vector data model, where each polygon delineates a homogeneous area assigned to the LULC class occupies 75% of the polygon area. The COS minimum mapping unit (MMU) is 1 ha, while the minimum distance between lines and the minimum width of the polygons is 20 m.
COS is obtained by using visual interpretation of orthophotos with RGB and near infrared bands. The overall accuracy of COS 2015 for level 1 classes is 96% [38]. The overall accuracy of COS 2018 is still under assessment, but the technical specification requires the accuracy values to be higher than 85% [39].
The nomenclature of COS follows a hierarchical structure formed by several levels, where each level is more detailed than the previous one. The nomenclature has been updated throughout the different versions of the COS. For example, while the version of 2015 has 5 levels and 5 classes for level 1, the 2018 version considers 4 levels and level 1 includes 9 classes. Table 3 shows the level 1 nomenclature of COS 2015 and COS 2018.

Table 3.
Classes of level 1 nomenclature of COS 2015 and COS 2018.
COS 2015 was used to assist in the identification of the classes proportion in the study areas and for the creation of a product that will be compared with COS 2018, as described in Section 3. Therefore, class harmonization between these versions was performed as indicated in Section 3.2.
3. Methodology
The methodology applied in this paper includes nine main steps: (1) Conversion of OSM raw data into the CLC classes using a transformed version of OSM2LULC conversion software (OSM2LULC-4T); (2) harmonization of the results of step 1 into the used nomenclature; (3) generation of three sets of training data derived from the data obtained in step 2 (TD0, TD1 and TD2) through the application of successive filtering procedures; (4) selection of training samples from each training set (TS0, TS1 and TS2); (5) assessment of class separability and accuracy of the training sets and of the extracted samples; (6) classification of the satellite images with the training samples generated in step 4; (7) generalization of the classification results using a majority filter; (8) creation of hybrid maps incorporating the data extracted from OSM and the classification results; and (9) accuracy assessment of the classification results obtained in step 6, the generalized maps obtained in step 7 and the hybrid maps obtained in step 8. Figure 3 shows the methodology workflow.
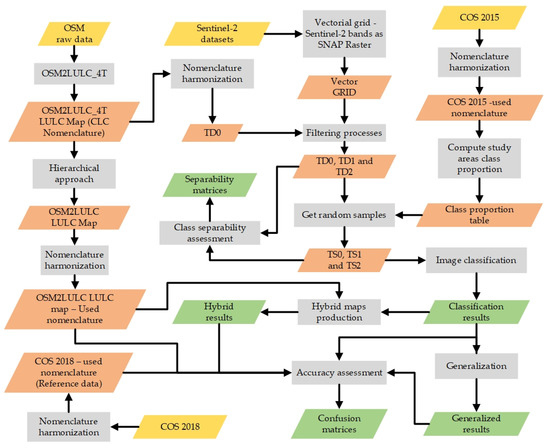
Figure 3.
Methodology workflow.
3.1. Nomenclatures’ Harmonization
Data sources with different classification schemas were used throughout this study. Therefore, it was necessary to harmonize the class nomenclatures. The nomenclature selected for use in the classification includes the eight LULC classes listed in the left column of Table 4, which also shows their correspondence with the classes of the remaining nomenclatures.

Table 4.
Harmonization of the nomenclatures of the used data sources.
The OSM raw data were converted into LULC classes using the OSM2LULC_4T software package, as explained in Section 3.2. The output classes are listed in the second column of Table 4 and include level 2 classes and some of level 3 classes of CLC nomenclature. Columns 3 and 4 of Table 4 show the correspondence with the classes of COS 2015 and COS 2018, which were used, respectively, to define the weights associated to the classes in the classification process (as explained in Section 3.3) and the accuracy assessment (as explained in Section 3.4). This was performed to attenuate the class imbalance present in the dataset.
The aim of this study was to obtain LULC maps through satellite image classification. However, there are some land use classes that cannot be differentiated only by their spectral response. Therefore, some vegetated areas (such as golf courses and urban vegetation), which are in some nomenclatures included in artificial surfaces, were instead incorporated in the vegetated classes, as shown in Table 4.
Figure 4 and Figure 5 show, respectively, the LULC maps obtained by converting COS 2018 to the nomenclature used for the classification for study area A and study area B.
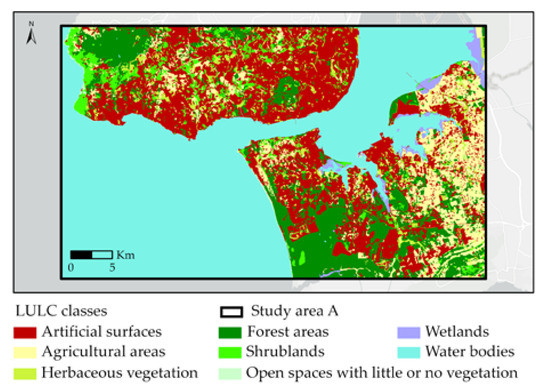
Figure 4.
Map resulting from the conversion of COS 2018 to the classes used in the classification (shown in Table 4) for study area A.
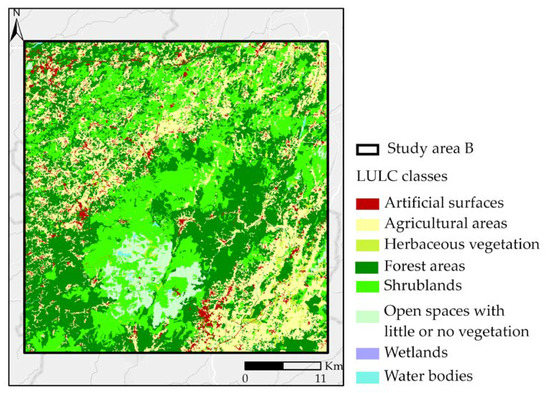
Figure 5.
Maps resulting from the conversion of COS 2018 to the classes used in the classification (shown in Table 4) for study area B.
Table 5 shows the variation of the classes’ area when comparing the maps corresponding to COS 2015 and COS 2018. The variation in each class is smaller than 2% of the area of interest for both study areas. Therefore, the classes’ area extracted from COS 2015 provides a good estimate of the classes’ area in COS 2018. These values are used to generate training samples proportional to the classes’ expected area, as explained in Section 3.5.

Table 5.
Variation of classes’ area between the maps resulting from the conversion of COS 2015 and COS 2018 to the classes used in this study.
3.2. Conversion of OSM Data to LULC
In order to use OSM features to obtain LULC classes, it is necessary to perform a series of steps that include:
- Mapping the OSM features into the LULC classes of interest;
- converting linear features, such as roads and waterways, into areal features;
- solve inconsistencies resulting from the association of different classes to the same location when there are, for example, overlapping features with different characteristics, or there is missing data indicating that a feature is underground (location = underground).
OSM2LULC [25,40] is a software package that includes a set of tools developed to address these issues and automatically convert OSM data into LULC maps. At present, it enables the conversion of OSM features to the LULC classes of Urban Atlas and CLC level 2 nomenclatures, and to the GlobeLand30 nomenclature. In OSM2LULC, the linear OSM features that can be associated with LULC classes are converted into polygons by creating buffer zones around the lines using either predefined buffer widths or by calculating the distance to other OSM features with spatial analysis. Due to the characteristics of OSM data, for some OSM features it is not possible to specify a unique association with a LULC class. In some cases, when such a direct relation cannot be established, OSM2LULC uses strategies based on the analysis of the geometric and topological properties to determine if a certain group of OSM features should be associated with a certain LULC class or not. For example, to assign a polygon called forest in OSM to a forest class, the area of the polygon needs to have a minimum predefined value.
OSM2LULC has 6 modules which implement and apply these strategies to groups of OSM features. The data produced by these modules are then integrated, merging all the results into a single layer while solving inconsistencies resulting from overlapping polygons that have been assigned to distinct LULC classes. The elimination of inconsistencies is done by considering a hierarchical approach that assigns different levels of priority to the output LULC classes.
Currently, OSM2LULC has four versions (Versions 1.1 to 1.4). The differences between them are related with the technologies and data models used [25,40]. Versions 1.1 (based on GRASS GIS) and 1.2 (based on GRASS GIS and PostGIS) use only the vector data model as an input and output data model, while versions 1.3 (based on GRASS GIS) and 1.4 (based on GDAL and Numpy) use the raster data model to apply the priority rules, generating results in the raster format.
OSM2LULC version 1.2 was used in this study to transform OSM tags into LULC classes, although with a few modifications. The output of the conversion process is a vector map with the classes of interest, where the resulting polygons do not overlap. However, as in the original OSM data, there are frequently overlapping features that can be associated with different LULC classes; in the training sets filtering process explained in Section 3.3, the originally overlapping regions were excluded from the training sets. Therefore, instead of using the files resulting from the complete workflow of OSM2LULC as input to derive the training data, the files used were the ones obtained before the step that solves inconsistencies. Another modification included in the OSM2LULC software used in this paper relates to the mapping of OSM features to the LULC classes. A few changes were added that related to the association of vegetated areas to the class Artificial Surfaces (which in CLC include regions such as golf courses and urban vegetation). As the aim here was to use this data for training classifiers, the inclusion of vegetated regions in the training sets of Artificial Surfaces would result in low class separability and classification problems. Therefore, the regions with tags related to urban vegetation and golf courses were associated with Herbaceous vegetation, as shown in Table 4. The OSM2LULC used with these changes is referred to as OSM2LULC_4T.
3.3. Training Data
The base data used in this research was obtained by running OSM2LULC_4T with the data extracted from OSM for the considered study areas. Two filtering steps were then applied, as illustrated in Figure 6, producing three different training sets: Training Data 0 (TD0), Training Data 1 (TD1) and Training Data 2 (TD2).
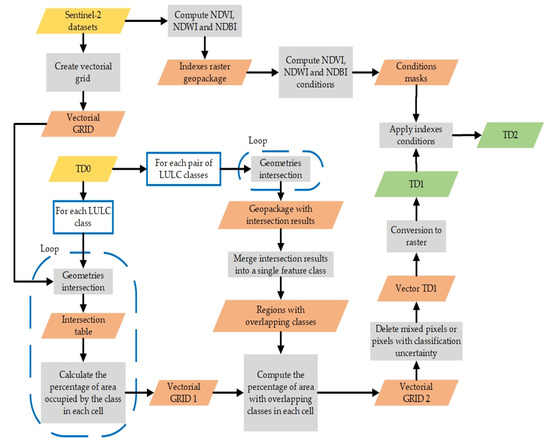
Figure 6.
Workflow of the filtering process used to generate two additional training sets (TD1 and TD2) from TD0, obtained from the original OSM data after the application of the OSM2LULC_4T conversion tools.
To generate the data necessary for the filtering steps, a vector grid was generated with cells coincident with the pixels of the Sentinel-2 images. The grid cells were intersected with the polygons obtained from OSM2LULC_4T and the percentage of area occupied by each class in each cell was computed. The cells with non-zero percentages associated with more than one LULC class could be considered as corresponding to mixed pixels and the cells assigned to all classes with total percentage inferior to 100% are cells with missing data.
The first training dataset (TD0) associated to each class included all the cells obtained with OSM2LULC_4T, either if they are partially or fully assigned to the class. That is, all cells with a positive percentage of area associated to the class were considered to be part of TD0.
To obtain TD1, the data in TD0 were then filtered by removing all the cells that are either assigned to more than one class or that have a percentage of occupation by the LULC class inferior to 100%, as these correspond to either mixed pixels or pixels with missing data in OSM. The aim of this step was to assess if this filtering procedure will improve the quality of the training set, even at the possible expense of losing training data.
The third level of training data (TD2) results from the application of filters to TD1 by setting thresholds to three radiometric indices, namely the NDVI, the Normalized Difference Water Index (NDWI) and the Normalized Difference Built-up Index (NDBI), computed, respectively, with Equations (1)–(3), where NIR, Red, Green and SWIR correspond, respectively, to bands B8, B4, B3 and B11 of Sentinel-2.
NDVI varies between −1 and 1 and quantifies the difference between the spectral response in the near infrared and red bands. It is used to identify vegetation with chlorophyll, which usually corresponds to NDVI values larger than 0.3 [41]. NDWI also varies between −1 and 1, and regions with water generate positive values [42]. The NDBI index also takes values between −1 and 1 and is used to identify build-up areas, which usually have positive values of NDBI [43].
These indices were computed for the three sets of satellite imagery used for both study areas so that their variation could be analyzed. This analysis resulted in the identification of threshold values used to exclude unwanted regions from the training data of each class are shown in Table 6, as well as the number of images they have to apply to. This last condition was used because the land cover in some regions may change along the year, and therefore indices such as the NDVI and the NDWI also change. As a time series of images from different seasons was used, the aim was not to exclude regions that may have variations along the year but are in fact correctly assigned to the classes; instead, the aim was to only exclude regions that do not really correspond to the classes, and therefore should not be used for training.

Table 6.
Condition used for filtering the TD1 dataset with the NDVI, NDWI and NDBI indices, to obtain TD2.
The thresholds defined in Table 6 were set by visual interpretation and analysis of the per-class histograms generated for the three indices for each satellite image, as well as the mean and the standard deviation of the indices per class in the regions under analysis and were used for both study areas. While for classes 1 to 5 the values of the NDVI and NDWI were set to all the satellite images, this was not the case for the classes 6–8, where if at least one of the sets of imagery would be within the threshold, it would be considered as belonging to the class. NDBI was only used for class 1.
3.4. Classes Separability
To assess the quality of the training datasets, the classes’ separability was computed with the Bhattacharyya distance [44] as it enables determining the statistical distance between the classes. The greater the distance, the greater the separability is. In this paper, the separability was computed for each class in a one class versus all comparison, using Equation (4), where i represents the training dataset corresponding to class i (core i), represents the training data corresponding to all classes except class i (core ), represents the Bhattacharyya distance between core i and core , and stands for the means of the cores i and , respectively, while and are, respectively, the covariance matrices of cores and [45].
The classification was made selecting samples from TD0, TD1 and TD2, as explained in Section 3.5. Therefore, the class separability was computed both for these datasets and for the samples used in the classification.
3.5. Classification and Generalization
The Sentinel-2 images were classified using the Random Forest classifier [46], available at Sklearn [47], using 500 trees. The same parameters were used in all tests. Due to computational constraints and to attenuate the effects of class imbalance in the different sets of training data, for each set of experiments a random sample was extracted from the sets TD0, TD1 and TD2, denoted, respectively as TS0, TS1 and TS2. These samples were created such that the size of the sample for each class is proportional to the class area in COS 2015 and that each class training set could not have less than 20,000 cells. The total number of sample cells was 534,900 for study area A and 520,278 cells for study area B. For all other parameters of the random forest classifier, the default values were used, which lead to a full grown trees scenario.
As the classification was pixel oriented and the reference data used for accuracy assessment was a map with a 1 ha MMU (see Section 3.6), a majority filter was applied to remove most isolated small regions from the classification results, producing a generalized version of the classification results. The applied filter consisted of a circular moving window, selecting for each central pixel the majority class within the window. As 1 ha corresponds to a square with 10 × 10 cells, the radius chosen for the moving window was 5 cells.
3.6. Accuracy Assessment
The accuracy of the training datasets TD0, TD1 and TD2, the obtained classifications and their generalized versions were assessed using as a reference: (1) The map obtained from the conversion of the COS 2018 to the used nomenclature, as described in Section 3.1; (2) the LULC maps obtained with the conversion of OSM to LULC classes by running the OSM2LULC software package with the inconsistencies solving tools, as explained in Section 3.2.
Contingency matrices were created with the map data represented in the rows and the reference data in the columns. The values pij in the contingency matrix cells represent the area of the region under analysis classified with class i in the map (row) and class j in the reference data (column). The overall accuracy was computed using Equation (5), and the user’s accuracy and producer’s accuracy per class was computed using Equation (6) and Equation (7), respectively.
Note that to assess the accuracy of LULC map extracted from OSM with OSM2LULC, the areas considered in the denominator of Equations (5)–(7) correspond only to the regions that have data in OSM, and therefore, as there are regions with no data in OSM in both study areas, their sum is always smaller than the total area of the study areas.
The user’s and producer’s accuracy enable the computation of, respectively, the map commission and omission errors per class by subtracting the accuracy values from 100%.
3.7. Hybrid Maps
Finally, an additional test was made, corresponding to the creation of hybrid maps. These maps were generated by directly using the information coming from OSM2LULC software package in all regions where it is available and using the classification results obtained with each of the training samples (TS0, TS1 and TS2) for the regions where OSM data were not available. The accuracy of these products was assessed as explained in the previous section and was compared with the accuracy of the classification results.
4. Results and Discussion
This section presents the results obtained in the several steps of the methodology, along with their discussion. In Section 4.1 the training datasets TD0, TD1 and TD2 are shown, along with their respective classes’ separability scores and selected samples, as explained in Section 3.4. The maps obtained with the classification using the several training datasets are then presented in Section 4.2, where some examples of the generalized maps are also presented. In Section 4.3, the accuracy of the classified maps and their generalizations are shown. In Section 4.4, the accuracy of the hybrid maps created (as explained in Section 3.7) are analyzed and compared with the accuracy obtained for both the classifications and generalizations results.
4.1. Training Data
Figure 7a and Figure 8a show, respectively, the TD0 datasets for study areas A and B. For study area A this set corresponds to 49.6% of the whole study area, while for study area B it corresponds to 45.3%. Figure 7b and Figure 8b show, respectively for the study area A and B, the data removed from TD0 to obtain TD1 (in light blue), the data removed from TD1 to obtain TD2 (in the medium shade of blue) and TD2 (in dark blue). Table 7 shows the percentage of these data belonging to each class in each training dataset.
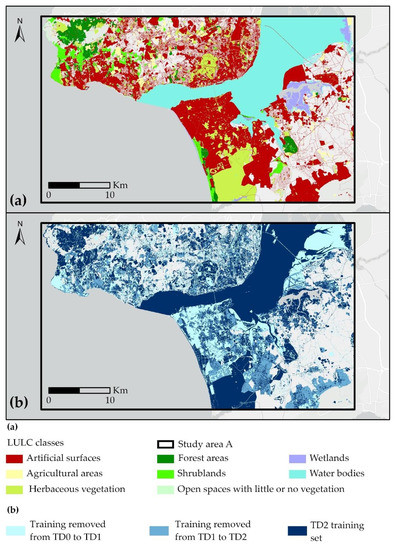
Figure 7.
Training data for study area A: (a) Shows the TD0 training set. (b) Shows the regions excluded from TD0 to obtain TD1 (light blue) as well as the regions removed from TD1 to obtain TD2 (a medium shade of blue) and TD2 (dark blue).
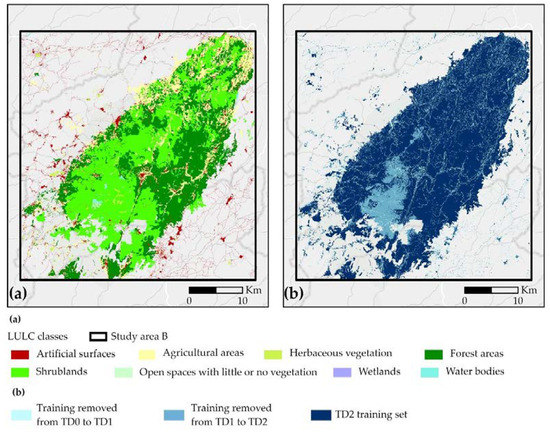
Figure 8.
Training data for study area B: (a) Shows TD0 training set. (b) Shows the regions excluded from TD0 to obtain TD1 (light blue) as well as the regions removed from TD1 to obtain TD2 (a medium shade of blue) and TD2 (dark blue).

Table 7.
Percentage of the TD0, TD1 and TD2 datasets belonging to each class for study areas A and B.
An analysis of Figure 7 and Figure 8, and Table 7 shows that, for study area A, most of the regions excluded from TD0 belonged to class 1 (artificial surfaces), therefore increasing the percentage of most of the remaining classes in TD1 and TD2. In study area B, the decrease in percentage is also mostly observed in class 1, but to a lesser extent, and the class with higher increase in percentage (but with a value of only 5.5%, from TD0 to TD2) is class 4 (forest areas).
The classes separability for the datasets TD0, TD1 and TD2, and the derived samples TS0, TS1 and TS2 are shown in Figure 9 and Figure 10, respectively, for study areas A and B. Regarding study area A, the classes’ separability improves for all classes except class 7 (wetlands) when the filtering procedures transform TD0 into TD1 and TD1 into TD2. For this class the separability is the same for TD0 and TD1, and decreases slightly for TD2. The behavior is similar for the samples extracted from these data, however with a few differences, mainly for the classes with vegetation (classes 2–5), showing a decrease in the differences between the separability of the samples extracted from TD0, TD1 and TD2.
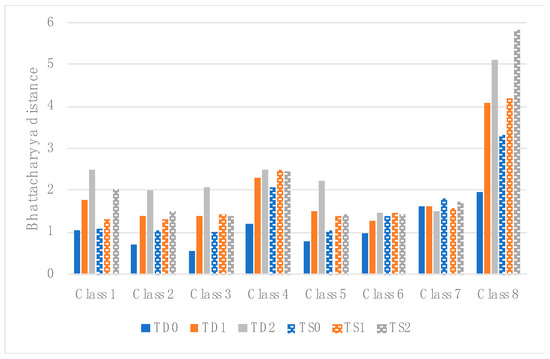
Figure 9.
Class separability per class for the TD0, TD1 and TD2 datasets and the samples TS0, TS1 and TS2 extracted from these datasets to train the classifier for study area A.
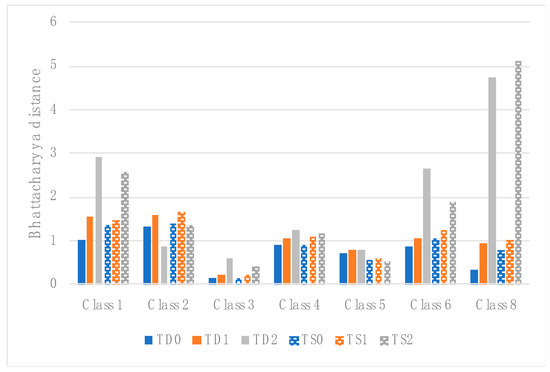
Figure 10.
Class separability per class for the TD0, TD1 and TD2 datasets and the samples TS0, TS1 and TS2 extracted from these datasets to train the classifier for study area B.
For study area B the class separability also increases or is unchanged for all classes from TD0 to TD1 and from TD1 to TD2, except for class 2 (agricultural areas), where class separability decreases from TD1 to TD2.
These results show that in most cases, class separability increases with the filtering steps. This is particularly evident for classes 1 and 8 in both study areas. The remaining classes behave differently when comparing study area A with study area B. The separability of both class 3 (herbaceous vegetation) and class 5 (shrublands) is particularly low, which is expected to negatively impact the ability to distinguish those. The use of samples for training instead of using the complete TD0, TD1 and TD2 datasets in most classes does not appear to have a large influence over the separability, even though it may influence the representativeness of the training data, especially for classes that are more heterogeneous.
4.2. Classification and Generalization
Figure 11 and Figure 12 show the classification results obtained with the three training sets, respectively, for study areas A and B. Study area A TD0 and TD1 results show a clear misclassification of most of the ocean part as artificial surfaces. This problem is solved with TD2, after applying the filtering process with the NDVI, NDWI and NDBI indices.
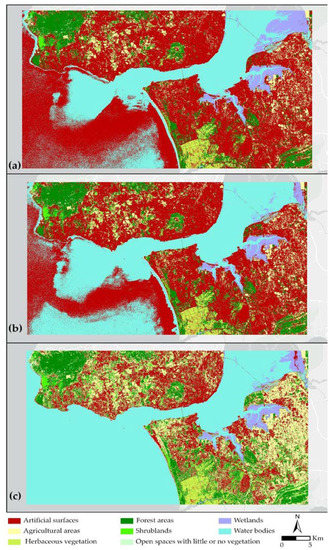
Figure 11.
Classification results for study area A obtained with the training samples TS0 (a), TS1 (b) and TS2 (c), extracted, respectively, from TD0, TD1 and TD2.
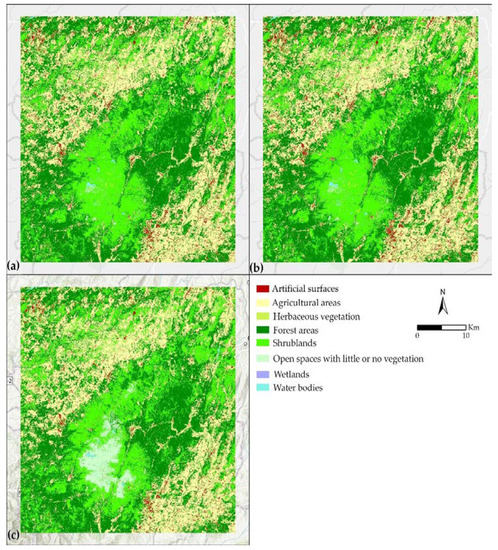
Figure 12.
Classification results for study area B obtained with the training samples TS0 (a), TS1 (b) and TS2 (c), extracted, respectively, from TD0, TD1 and TD2.
For study area B, the most visible change in the results obtained with the data extracted from TD0 and TD1 to TD2 is the central part of the park, which changed from class 5 (shrublands) to class 6 (open spaces with little or no vegetation). This class change is more in agreement with COS 2018, as shown in Figure 5.
Figure 13 shows details of the effect of the generalization obtained with the 5 m radius majority filter for two regions located in study areas A and B.
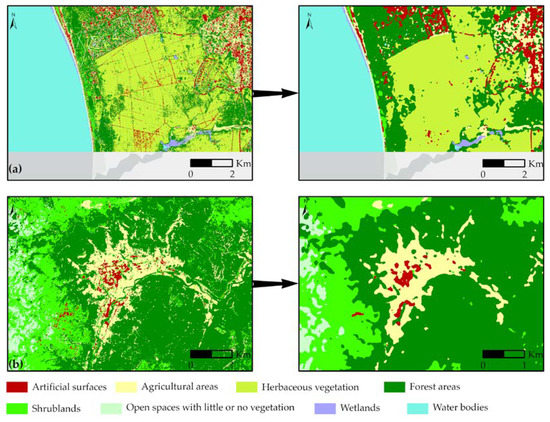
Figure 13.
The figures on right side show the effect of the generalization obtained with the application of the majority filter to the images on left side, for two regions located, respectively, in: (a) Study area A and (b) study area B.
4.3. Accuracy Assessment
Table 8 shows the overall accuracy of TD0, TD1 and TD2 datasets for both study areas. Figure 11 and Figure 12 show the maps obtained with the classification and the generalized maps. The accuracy of the maps obtained from OSM with the OSM2LULC software was also computed. To enable a comparison with the classification results, the accuracy of the classifications obtained with the several training data for the regions where OSM data is available are also shown in Table 8.

Table 8.
Overall accuracy (%) of: the TD0, TD1 and TD2 training datasets; the maps resulting from the classification with the samples extracted from these datasets; their generalized versions; the classified maps considering only the regions where OSM data is available; and of the map generated using OSM2LULC software. The maps derived from COS 2018 with nomenclature harmonization were used as reference data.
The results show that, for both study areas, the overall accuracy of the training datasets increases from TD0 to TD1 and from TD1 to TD2, showing that the filtering process is indeed removing regions incorrectly included in the original data. Regarding the classification results, the overall accuracy also increases with the improved training datasets for study area A, varying between 55% when using the sample extracted from TD0 and 73% when using the sample extracted from TD2. However, that is not observed for study area B, where the overall accuracy has a constant value of 65%. The accuracy of the generalized maps obtained with the samples extracted from TD0, TD1 and TD2 for study area A only changed for the map obtained with training data from TD2 (improved 5%). For study area B, the overall accuracy increased the same 4% for the maps generated with the samples extracted from TD0, TD1 and TD2, achieving 69% for all of the samples.
The accuracy of the LULC map obtained with OSM2LULC was 70% for study area A and 87% for study area B. The classified regions obtained for the regions where OSM data is available (which corresponded to 50% of study area A and 45% of study area B) achieved overall accuracies of between 66% and 73% for study area A and a constant value of 66% for study area B, which are 21% lower than the accuracy obtained for the results obtained with the complete OSM2LULC procedure.
Table 9 and Table 10 show, respectively, the user’s and producer’s accuracy per class of the TD0, TD1 and TD2 datasets for study area A, the classification results obtained with the training data extracted from each of the datasets alongside their generalized versions.

Table 9.
User’s Accuracy per class (%) (equal to 100 minus the commission errors), for study area A, of the training datasets TD0, TD1 and TD2 and of the maps resulting from the classification with TS0, TS1 and TS2 (Figure 11). The reference data used are the maps derived from the COS 2018 with the nomenclature harmonization.

Table 10.
Producer’s Accuracy per class (%) (equal to 100 minus the omission errors) for study area A, of the training datasets TD0, TD1 and TD2 and of the maps resulting from the classification with TS0, TS1 and TS2 (Figure 11). The reference data used are the maps derived from the COS 2018 with the nomenclature harmonization.
The results for study area A show that, for the training data, the filtering used from TD0 to TD1 improved the user’s accuracy (which correspond to a decrease of commission errors) for all classes except class 3 (herbaceous vegetation), where there was a decrease of 3% (Table 9). Regarding the producer’s accuracy, the main results show an increase larger than 20% for classes 1, 3 and 5 (Table 10) (corresponding to a decrease of omission errors of the same magnitude) and a decrease in accuracy mainly for classes 2 and 4, of, respectively, 40% and 32%. This shows that this filtering step decreased the commission errors, removing locations that were not classified in the same way in the reference data, but also introduced relevant omissions, mainly in classes 2 (agricultural areas) and 4 (forest areas). However, this does not appear to have been a problem, given that both the user’s and producer’s accuracy of the classification improved or was kept unchanged for most classes, with only three exceptions of small magnitude, namely in class 5 (shrublands) for the user’s accuracy, where a decrease of 3% was observed, and classes 1 and 6 for the producer’s accuracy.
Regarding the filtering made from TD1 to TD2, both the user’s and producer’s accuracy of the training data increased for all classes, except for a decrease of only 2% in the producer’s accuracy for class 1. However, for the classification results, the user’s accuracy showed an increase of 40% for class 1 (artificial surfaces), a slight increase of 1% for classes 3 (herbaceous vegetation), no changes for class 8 (water bodies) and a decrease of between 3% and 19% for all the other classes. In contrast, the producer’s accuracy increased for all classes (Table 10), except for class 1 (artificial surfaces), which shows a decrease of 30%. These results show that, for study area A, the filtering process from TD0 to TD1 not only improved the overall classification results, as shown in Table 8, but also the classification of most classes, even though there are still some classes that are very poorly classified, from which the worst class is class 3 (herbaceous vegetation) with values that are always smaller than 7%. The filtering process performed from TD1 to TD2 mainly showed a problem with class 1 (artificial surfaces). This filtering step removed a large part of the regions previously classified as urban, as shown in Table 7 and Figure 7b). Even though this did not have much impact in the accuracy of the training datasets, and even resulted in an increase of the overall accuracy, as shown in Table 8, it had a very large influence on the accuracy of class 1, increasing the omission errors in 30%. This shows that this filtering process may have removed from the training data of class 1 important data to classify the artificial surfaces of this study area. However, a more detailed analysis of the classification results shows that these results are very much influenced by two aspects: (1) Some classes used in COS are land use classes; and (2) COS has an MMU of 1 ha. This is illustrated in the two examples shown in Figure 14, which shows for two smaller areas: Very high resolution images (Figure 14b,c); the maps obtained from COS 2018 (Figure 14d,e), used as a reference; the classification results (Figure 14f,g); and the generalization results (Figure 14h,i). The region represented on the left of Figure 14 includes a large polygon classified as an urban area in COS, which is a military facility, and is therefore included in class 1. However, the region is in fact covered by vegetation, and was therefore in the classification results included in the vegetated classes. A similar phenomenon can be seen on the region shown on right-side, where a parcel with urban vegetation was not included in the class artificial surfaces in the classification but was included in that class in COS 2018. It is also evident that the classification results have much more detail, not shown in COS due to its MMU. However, these differences are smaller when considering the generalized version of the classification results, resulting in an increase of accuracy when considering COS as reference.
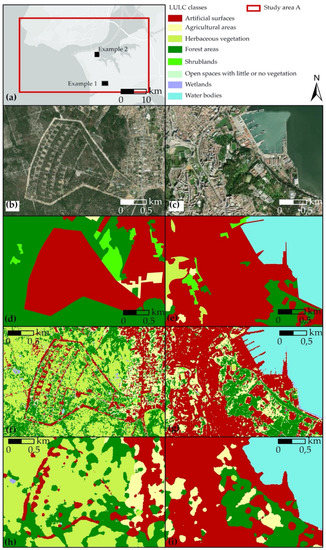
Figure 14.
Detailed data for two example zones 1 and 2 in the study area A. (a) Shows the location of both regions in study area A, (b,c) show very high resolution imagery for, respectively, example regions 1 and 2; (d,e) show the COS derived reference map; (f,g) show the classification results obtained with the training data extracted from TD2; (h,i) show the generalized maps corresponding to (f,g) for, respectively, example zones 1 and 2.
Both the user’s and producer’s accuracy of the generalized maps have a behavior very similar to the accuracy of classification results for all classes, but with better results for most of them, which resulted in an increase of the overall accuracy of these maps.
Table 11 and Table 12 show the results corresponding to, respectively, Table 9 and Table 10, but for study area B.

Table 11.
User’s Accuracy per class (%) (equal to 100 minus the commission errors) for Study area B of the training datasets TD0, TD1 and TD2 and of the maps shown in Figure 12 resulting from the classification with TS0, TS1 and TS2. The reference data used are the maps derived from the COS 2018 with the nomenclature harmonization.

Table 12.
Producer’s Accuracy per class (%) (equal to 100 minus the omission errors) for Study area B of the training datasets TD0, TD1 and TD2 and of the maps shown in Figure 12 resulting from the classification with TS0, TS1 and TS2. The reference data used are the maps derived from the COS 2018 with the nomenclature harmonization.
The results for study area B show in general less variation than for study area A. For the training datasets, with the filtering process from TD0 to TD1, both the user’s and producer’s accuracy improved or remained unchanged for all classes, with larger improvements for classes 1 and 8 (respectively, 20% and 42%). Regarding the classification results, the most significative changes are for class 8 (water bodies), which shows a decrease of 29% of the user’s accuracy (Table 11) and an increase of 26% in the producer’s accuracy (Table 12). This shows that commission errors increased, and omission errors decreased. That is, less water regions were missing from the map, but some regions were wrongly classified as water when compared with the reference data. A detailed analysis shows that the accuracy of the training sets improved because many water ways are narrow streams that do not occupy the cells entirely, and therefore the filtering process removes most of these cells from TD1. On the other hand, the commission errors of the classification increased because these streams are not mapped in COS because of its MMU. The other class showing more differences is class 1, with a decrease of 4% in the user’s accuracy and an increase of 6% in the producer’s accuracy. The behavior is therefore similar to what was observed for the class water but with a smaller amplitude. This also occurs because the urban tissue in this region is mainly formed by dispersed buildings and narrow roads mixed with agricultural areas and other types of vegetation, which in most cases occupied cells only partially and therefore were eliminated during the filtering process. On the other hand, these small features are not represented in COS because of its MMU.
Regarding the filtering from TD1 to TD2, the accuracy of the training data showed results similar to the ones obtained for study area A for class 1, that is, a significant increase of the user’s accuracy (22%) and a slight decrease of the producer’s accuracy (2%). The user’s accuracy of all other classes was either unchanged or showed an increase of 6% (classes 5 and 8), except for class 3, with a decrease of 3%. The producer’s accuracy increased or was kept unchanged for all other classes. However, the accuracy of the classification results obtained with the training data extracted from TD2 showed larger differences when compared to the results obtained with the training data extracted from TD1. The user’s accuracy only increased for by 9%, 2% and 24%, respectively, for classes 1, 4 and 8, and the major decrease of user’s accuracy was obtained for class 6 (12%). The producer’s accuracy also decreased for classes 1, 3, 4 and 8, and a large increase of 30% was observed for the 6. This increase corresponds to the central part of the park, which was correctly classified with the training data extracted from TD2. Therefore, the most significant changes are for the water bodies, with a decrease of commission errors of 24% and an increase of omission errors of 17%, class 6 (open spaces with little or no vegetation), with an increase of commission errors of 12% and a decrease of omission errors of 30% and class 1 (artificial surfaces), with a decrease of commission errors of 9% and an increase of omission errors of 14%. A more detailed analysis of why the omission errors increased for class 8 shows that it is due to the fact that several streams are covered by trees tops, and therefore the spectral response, and therefore the NDVI and NDWI values correspond to vegetated areas instead of water areas. For class 1, the main problems are due to the mixture of the urban fabric with agriculture and other types of vegetation, which in COS are classified as class 1 (due to the MMU) but in the image classification were classified as either classes 2 or 3. The accuracy of the generalized maps was similar to the accuracy of the classification results, meaning it was slightly better for some classes and worse for others, but resulted in an improvement of the overall accuracy of 4%, as shown in Table 8.
Overall, such accuracy results consolidate the relevance of OSM to generate LULC maps [25,26,27,30,31,33]. The use of the indices to filter the raw OSM data was also successful. Namely, the use of the NDVI, NDWI and NDBI, expanding on the approach proposed in [33], which only used NDVI for such a task.
4.4. Hybrid Maps
The results of the accuracy assessment showed that the overall accuracy of the data obtained with the OSM2LULC software package is high in both study areas, and in most cases higher than the classification results (Table 8). Therefore, hybrid maps were created for both study areas, as explained in Section 3.6, and their accuracy assessed. Table 13 shows the overall accuracy obtained for these hybrid maps (HM), and the difference between the values obtained for the hybrid maps and the maps obtained exclusively with the classification (Class) and their generalized versions (Gen).

Table 13.
Overall accuracy (%) of the: (1) Classification results (Class) and the generalized maps (Gen) obtained with the samples TS0, TS1 and TS2; (2) of the hybrid maps (HM) using the data produced with OSM2LULC and the classification results obtained with TS0, TS1 and TS2; and (3) the difference between: the overall accuracy obtained for the hybrid maps and the classification results (HM-Class); and the hybrid maps and the generalized maps (HM-Gen).
The results show that, for study area A, the best overall accuracy was obtained for the generalized maps obtained after performing the classification with TS2 (78%). For study area B, the hybrid maps had the highest accuracy, achieving 75% when using the classification data obtained with TS0 and TS1 datasets and 74% when using TS2 training data. These results show that only for study area B the use of hybrid maps provided better results. Hence, the advantages of this approach seem to depend on the characteristics of the region and the OSM data available (e.g., coverage or quality) for a given region. Therefore, it may be advantageous to use the OSM data just as training data instead of the creation of the hybrid maps as proposed in Schultz et al. [30].
5. Conclusions
This paper presented an automated methodology to obtain LULC maps with the classification of Sentinel-2 multispectral images using training sets extracted from OSM. A nomenclature of eight classes was selected, resulting from an adaptation of the nomenclature of COS 2018. A mapping between both nomenclatures was made, and COS 2018 was used as reference data for accuracy assessment.
The results show that, in general, the filtering processes improved the class separability, showing that the problematic regions were successfully removed from the training datasets. The overall accuracy of the training datasets confirms this for both study areas, as it increases from TD0 to TD1 and from TD1 to TD2. The accuracy of the classification results and their generalized versions also increased with the successive filtering procedures for the study area with more urban characteristics (study area A), achieving an accuracy of 78% in the best case, while it remained unchanged for the rural study area (study area B), achieving a best value of 69%. This indicates that the filtering procedures in some cases improves the quality of the training data. For study area B the overall accuracy of hybrid maps was higher than that of the classification results and their generalization, which was not the case for study area A, where the generalized version of the map obtained with TS2 was the best. The quality of these hybrid products is very much dependent on the characteristics of the region and the data available in OSM, as the data available in the satellite’s imagery is not used in the regions with OSM data. On the other hand, OSM may contain land use information that may be difficult to obtain from the imagery, such as the differentiation between a cultivated field and natural vegetation.
The obtained values for the user’s and producer’s accuracy showed that the values of the overall accuracy increased, even though some classes were very hard to classify. In particular, classes 2 (agricultural areas), 3 (herbaceous vegetation), 5 (shrublands) and 6 (open spaces with little or no vegetation) were in some cases confused, which was not surprising due to the similarity of their spectral responses in some parts of the study areas.
The accuracy results were obtained using COS 2018 as reference data, in order to have a comparison with an official LULC map. However, this product has a 1 ha MMU, and therefore it is not the best reference data to assess the accuracy of a pixel-based (10 × 10 m pixel size) classification. The generalization procedure applied to the classification results attenuated this issue, and an increase in accuracy was observed in some cases. Therefore, to assess the real quality of the generated products, a pixel-oriented reference database should be used in the future.
Due to the computational requirements necessary to perform the classifications with the complete TD0, TD1 and TD2 datasets, only samples extracted from them were used for the classifications, which is not ideal, as the class representativeness may be lost due to the exclusion of potentially valuable training data. Additionally, these tests were made considering only four bands of the Sentinel-2 images instead of the available 13 bands. In future work, all available training data and bands will be used to train the classifiers, taking advantage of cloud computation capabilities. Time series with more images per year may also be considered, so that the changes along the year may be better represented.
In the future, work tests will also be made to automatically obtain the thresholds used to filter data using the radiometric indices so that they can be set for other regions and different sets of images. These will be derived from a statistical analysis of the indices’ variation within the available training data.
Overall, OSM showed that it may provide enough data to perform a classification with reasonable quality with an automated approach, even when classes with similar spectral responses are used. However, additional studies are still necessary to identify the best choices in terms of considered classes and filtering methodologies, so that high quality LULC maps may be obtained with the desired frequency, as no time-consuming human intervention is necessary when applying automated methodologies.
Author Contributions
Main conceptualization, C.C.F., J.P.; methodology, C.C.F., J.P., I.J., and D.D.; software development: J.P., I.J., and D.D.; case studies implementations: J.P., I.J., and D.D.; writing, C.C.F., J.P., I.J., and D.D.; figures and diagrams, J.P., I.J. All authors have read and agreed to the published version of the manuscript.
Funding
The study has been partly supported by the Portuguese Foundation for Science and Technology (FCT) under grant SFRH/BSAB/150463/2019 and project grant UID/MULTI/00308/2019, and the project EPSSI-Exploring the Potential of the Sentinel missions Satellite Imagery (FR015), funded by the Institute for Systems Engineering and Computers at Coimbra (INESC Coimbra).
Acknowledgments
The authors are grateful to the OSM contributors that added data to OSM that may be used for projects such as the one presented in this paper.
Conflicts of Interest
The authors declare no conflict of interest.
References
- Li, Z.; Liu, S.; Tan, Z.; Sohl, T.L.; Wu, Y. Simulating the effects of management practices on cropland soil organic carbon changes in the Temperate Prairies Ecoregion of the United States from 1980 to 2012. Ecol. Model. 2017, 365, 68–79. [Google Scholar] [CrossRef]
- Ren, W.; Tian, H.; Tao, B.; Yang, J.; Pan, S.; Cai, W.-J.; Lohrenz, S.E.; He, R.; Hopkinson, C.S. Large increase in dissolved inorganic carbon flux from the Mississippi River to Gulf of Mexico due to climatic and anthropogenic changes over the 21st century. J. Geophys. Res. Biogeosci. 2015, 120, 724–736. [Google Scholar] [CrossRef]
- Drake, J.C.; Griffis-Kyle, K.; McIntyre, N.E. Using nested connectivity models to resolve management conflicts of isolated water networks in the Sonoran Desert. Ecosphere 2017, 8, e01652. [Google Scholar] [CrossRef]
- Panlasigui, S.; Davis, A.J.S.; Mangiante, M.J.; Darling, J.A. Assessing threats of non-native species to native freshwater biodiversity: Conservation priorities for the United States. Biol. Conserv. 2018, 224, 199–208. [Google Scholar] [CrossRef]
- Bakillah, M.; Liang, S.; Mobasheri, A.; Jokar Arsanjani, J.; Zipf, A. Fine-resolution population mapping using OpenStreetMap points-of-interest. Int. J. Geogr. Inf. Sci. 2014, 28, 1940–1963. [Google Scholar] [CrossRef]
- Stevens, F.R.; Gaughan, A.E.; Linard, C.; Tatem, A.J. Disaggregating Census Data for Population Mapping Using Random Forests with Remotely-Sensed and Ancillary Data. PLoS ONE 2015, 10, e0107042. [Google Scholar] [CrossRef]
- Schneider, A. Monitoring land cover change in urban and peri-urban areas using dense time stacks of Landsat satellite data and a data mining approach. Remote Sens. Environ. 2012, 124, 689–704. [Google Scholar] [CrossRef]
- European Commission; Directorate-General for Communication. The European Green Deal; European Commission: Brusel, Belgium, 2020; ISBN 978-92-76-17190-4. [Google Scholar]
- Ahiablame, L.; Sinha, T.; Paul, M.; Ji, J.-H.; Rajib, A. Streamflow response to potential land use and climate changes in the James River watershed, Upper Midwest United States. J. Hydrol. Reg. Stud. 2017, 14, 150–166. [Google Scholar] [CrossRef]
- Rajib, A.; Merwade, V. Hydrologic response to future land use change in the Upper Mississippi River Basin by the end of 21st century. Hydrol. Process. 2017, 31, 3645–3661. [Google Scholar] [CrossRef]
- Friedl, M.A.; McIver, D.K.; Hodges, J.C.F.; Zhang, X.Y.; Muchoney, D.; Strahler, A.H.; Woodcock, C.E.; Gopal, S.; Schneider, A.; Cooper, A.; et al. Global land cover mapping from MODIS: Algorithms and early results. Remote Sens. Environ. 2002, 83, 287–302. [Google Scholar] [CrossRef]
- Cihlar, J. Land cover mapping of large areas from satellites: Status and research priorities. Int. J. Remote Sens. 2000, 21, 1093–1114. [Google Scholar] [CrossRef]
- Gislason, P.O.; Benediktsson, J.A.; Sveinsson, J.R. Random Forests for land cover classification. Pattern Recognit. Lett. 2006, 27, 294–300. [Google Scholar] [CrossRef]
- Liu, T.; Abd-Elrahman, A. Multi-view object-based classification of wetland land covers using unmanned aircraft system images. Remote Sens. Environ. 2018, 216, 122–138. [Google Scholar] [CrossRef]
- Pengra, B.W.; Stehman, S.V.; Horton, J.A.; Dockter, D.J.; Schroeder, T.A.; Yang, Z.; Cohen, W.B.; Healey, S.P.; Loveland, T.R. Quality control and assessment of interpreter consistency of annual land cover reference data in an operational national monitoring program. Remote Sens. Environ. 2019, 111261. [Google Scholar] [CrossRef]
- Cavur, M.; Kemec, S.; Nabdel, L.; Duzgun, S. An evaluation of land use land cover (LULC) classification for urban applications with Quickbird and WorldView2 data. In Proceedings of the 2015 Joint Urban Remote Sensing Event, JURSE 2015, Lausanne, Switzerland, 30 March–1 April 2015. [Google Scholar]
- Cao, R.; Zhu, J.; Tu, W.; Li, Q.; Cao, J.; Liu, B.; Zhang, Q.; Qiu, G. Integrating Aerial and Street View Images for Urban Land Use Classification. Remote Sens. 2018, 10, 1553. [Google Scholar] [CrossRef]
- Stehman, S.V. Sampling designs for accuracy assessment of land cover. Int. J. Remote Sens. 2009, 30, 5243–5272. [Google Scholar] [CrossRef]
- Stehman, S.V.; Foody, G.M. Key issues in rigorous accuracy assessment of land cover products. Remote Sens. Environ. 2019, 231, 111199. [Google Scholar] [CrossRef]
- Goodchild, M.F. Citizens as sensors: The world of volunteered geography. GeoJournal 2007, 69, 211–221. [Google Scholar] [CrossRef]
- See, L.; Mooney, P.; Foody, G.; Bastin, L.; Comber, A.; Estima, J.; Fritz, S.; Kerle, N.; Jiang, B.; Laakso, M.; et al. Crowdsourcing, Citizen Science or Volunteered Geographic Information? The Current State of Crowdsourced Geographic Information. ISPRS Int. J. Geo-Inf. 2016, 5, 55. [Google Scholar] [CrossRef]
- OpenStreetMap. Available online: https://www.openstreetmap.org (accessed on 28 August 2020).
- Jokar Arsanjani, J.; Helbich, M.; Bakillah, M.; Hagenauer, J.; Zipf, A. Toward mapping land-use patterns from volunteered geographic information. Int. J. Geogr. Inf. Sci. 2013, 27, 2264–2278. [Google Scholar] [CrossRef]
- Urban Atlas. Available online: https://land.copernicus.eu/local/urban-atlas (accessed on 28 August 2020).
- Patriarca, J.; Fonte, C.C.; Estima, J.; de Almeida, J.-P.; Cardoso, A. Automatic conversion of OSM data into LULC maps: Comparing FOSS4G based approaches towards an enhanced performance. Open Geospat. Data Softw. Stand. 2019, 4, 11. [Google Scholar] [CrossRef]
- Fonte, C.; Minghini, M.; Patriarca, J.; Antoniou, V.; See, L.; Skopeliti, A. Generating Up-to-Date and Detailed Land Use and Land Cover Maps Using OpenStreetMap and GlobeLand30. ISPRS Int. J. Geo-Inf. 2017, 6, 125. [Google Scholar] [CrossRef]
- Fonte, C.C.; Patriarca, J.A.; Minghini, M.; Antoniou, V.; See, L.; Brovelli, M.A. Using OpenStreetMap to Create Land Use and Land Cover Maps: Development of an Application. In Volunteered Geographic Information and the Future of Geospatial Data; IGI Global: Hershey, PA, USA, 2017; p. 25. [Google Scholar]
- Corine Land Cover. Available online: https://land.copernicus.eu/pan-european/corine-land-cover (accessed on 28 August 2020).
- Global Land Cover. Available online: http://www.globallandcover.com (accessed on 28 August 2020).
- Schultz, M.; Voss, J.; Auer, M.; Carter, S.; Zipf, A. Open land cover from OpenStreetMap and remote sensing. Int. J. Appl. Earth Obs. Geoinf. 2017, 63, 206–213. [Google Scholar] [CrossRef]
- Jokar Arsanjani, J.; Helbich, M.; Bakillah, M. Exploiting Volunteered Geographic Information To Ease Land Use Mapping of an Urban Landscape. ISPRS Int. Arch. Photogramm. Remote Sens. Spat. Inf. Sci. 2013, XL-4/W1, 51–55. [Google Scholar] [CrossRef]
- Johnson, B.A.; Iizuka, K. Integrating OpenStreetMap crowdsourced data and Landsat time-series imagery for rapid land use/land cover (LULC) mapping: Case study of the Laguna de Bay area of the Philippines. Appl. Geogr. 2016, 67, 140–149. [Google Scholar] [CrossRef]
- Haufel, G.; Bulatov, D.; Pohl, M.; Lucks, L. Generation of Training Examples Using OSM Data Applied for Remote Sensed Landcover Classification. In Proceedings of the IGARSS 2018 IEEE International Geoscience and Remote Sensing Symposium, Valencia, Spain, 22–27 July 2018; IEEE: Valencia, Spain, 2018; pp. 7263–7266. [Google Scholar]
- Minghini, M.; Frassinelli, F. OpenStreetMap history for intrinsic quality assessment: Is OSM up-to-date? Open Geospat. Data Softw. Stand. 2019, 4, 1–17. [Google Scholar] [CrossRef]
- Fonte, C.C.; Antoniou, V.; Bastin, L.; Estima, J.; Arsanjani, J.J.; Bayas, J.-C.L.; See, L.; Vatseva, R. Assessing VGI Data Quality. Ubiquity Press 2017. [CrossRef]
- Monteiro, E.; Fonte, C.; Lima, J. Analysing the Potential of OpenStreetMap Data to Improve the Accuracy of SRTM 30 DEM on Derived Basin Delineation, Slope, and Drainage Networks. Hydrology 2018, 5, 34. [Google Scholar] [CrossRef]
- Sentinel 2- MSI instrument. Available online: https://earth.esa.int/web/sentinel/technical-guides/sentinel-2-msi/msi-instrument (accessed on 28 August 2020).
- Direção-Geral do Território. Especificações técnicas da Carta de uso e ocupação do solo de Portugal Continental para 1995, 2007, 2010 e 2015; Direção Geral do Território: Lisboa, Portugal, 2018; p. 103. [Google Scholar]
- DGT. Especificações técnicas da Carta de Uso e Ocupação do Solo (COS) de Portugal Continental para 2018 2019; DGT: Lisboa, Portugal, 2019. [Google Scholar]
- Patriarca, J. jasp382/glass: GLASS v0.0.1; Zenodo: Genève, Switzerland, 2020. [Google Scholar]
- Goward, S.N.; Markham, B.; Dye, D.G.; Dulaney, W.; Yang, J. Normalized difference vegetation index measurements from the advanced very high resolution radiometer. Remote Sens. Environ. 1991, 35, 257–277. [Google Scholar] [CrossRef]
- McFeeters, S.K. The use of the Normalized Difference Water Index (NDWI) in the delineation of open water features. Int. J. Remote Sens. 1996, 17, 1425–1432. [Google Scholar] [CrossRef]
- Zha, Y.; Gao, J.; Ni, S. Use of normalized difference built-up index in automatically mapping urban areas from TM imagery. Int. J. Remote Sens. 2003, 24, 583–594. [Google Scholar] [CrossRef]
- Xuan, G.; Zhu, X.; Chai, P.; Zhang, Z.; Shi, Y.; Dongdong, Y. Feature Selection based on the Bhattacharyya Distance. In Proceedings of the 18th International Conference on Pattern Recognition (ICPR’06), Hong Kong, China, 20–24 August 2006; pp. 1232–1235. [Google Scholar]
- McLachlan, G.J. Mahalanobis distance. Resonance 1999, 4, 20–26. [Google Scholar] [CrossRef]
- Cutler, A.; Cutler, D.R.; Stevens, J.R. Random Forests. In Ensemble Machine Learning; Zhang, C., Ma, Y., Eds.; Springer: Boston, MA, USA, 2012; ISBN 978-1-4419-9325-0. [Google Scholar]
- Sklearn. Available online: https://scikit-learn.org/stable/modules/generated/sklearn.ensemble.RandomForestClassifier.html (accessed on 28 August 2020).
Publisher’s Note: MDPI stays neutral with regard to jurisdictional claims in published maps and institutional affiliations. |
© 2020 by the authors. Licensee MDPI, Basel, Switzerland. This article is an open access article distributed under the terms and conditions of the Creative Commons Attribution (CC BY) license (http://creativecommons.org/licenses/by/4.0/).