Abstract
In developing countries, information on the area and spatial distribution of paddy rice fields is an essential requirement for ensuring food security and facilitating targeted actions of both technical assistance and restoration of degraded production areas. In this study, Sentinel 1 (S1) and Sentinel 2 (S2) imagery was used to map lowland rice crop areas in the Sédhiou region (Senegal) for the 2017, 2018, and 2019 growing seasons using the Random Forest (RF) algorithm. Ground sample datasets were annually collected (416, 455, and 400 samples) for training and testing yearly RF classification. A procedure was preliminarily applied to process S2 scenes and yield a normalized difference vegetation index (NDVI) time series less affected by clouds. A total of 93 predictors were calculated from S2 NDVI time series and S1 vertical transmit–horizontal receive (VH) and vertical transmit–vertical receive (VV) backscatters. Guided regularized random forest (GRRF) was used to deal with the arising multicollinearity and identify the most important predictors. The RF classifier was then applied to the selected predictors. The algorithm predicted the five land cover types present in the test areas, with a maximum accuracy of 87% and kappa coefficient of 0.8 in 2019. The broad land cover maps identified around 12,500 (2017), 13,800 (2018), and 12,800 (2019) ha of lowland rice crops. The study highlighted a partial difficulty of the classifier to distinguish rice from natural herbaceous vegetation (NHV) due to similar temporal patterns and high intra-class variability. Moreover, the results of this investigation indicated that S2-derived predictors provided more valuable information compared to VV and VH backscatter-derived predictors, but a combination of radar and optical imagery always outperformed a classification based on single-sensor inputs. An example is finally provided that illustrates how the maps obtained can be combined with ground observations through a ratio estimator in order to yield a statistically sound prediction of rice area all over the study region.
1. Introduction
Rice is one of the most consumed cereals in West Africa and, in recent decades, its consumption has shown the highest increase worldwide, from around 30 kg/year per capita in 1990 to 45 kg in 2010 [1,2]. In Senegal, rice consumption reaches even higher levels, with around 70 kg/year per capita in 2009 [3]. To satisfy such a requirement, imports of rice (milled equivalent) in the decade 2008–2017 amounted on average to 1,500,000 tonnes, in addition to the average national production (paddy equivalent) of about 580,000 tonnes [4]. This strong internal demand, reinforced also by the uncertainties of the international rice market, has prompted regional agricultural policy to promote local rice cultivation [5,6]. In Senegal, rice production has increased significantly thanks to major infrastructure investments, mainly concentrated in the Senegal River Valley and Anambe Basin. On the other hand, in the Casamance region (located in the south of the country), traditional lowland rice cultivation, despite its local importance in social and food terms, received very little support, although it faces major short- and long-term problems [7,8]. Recently, Mendez del Villar [9] estimated that in Casamance, local rice production covers only between 30% and 40% of household consumption, and, in the case of surpluses, local rice is available on weekly markets for, at most, 4 to 6 months per year. For the rest of the year, the needs are covered by imported rice.
The region of Sédhiou (Middle Casamance) is characterized by favorable soil and climatic conditions and has a long rice growing tradition, especially in the lowland areas. Lowland rice cultivation remains a subsistence farming activity that uses traditional practices and is performed almost exclusively by women. Since the 1970s, rice production systems of the region have become increasingly threatened by factors such as decrease in precipitation, prolonged droughts, and soil degradation (salinization, acidification, and silting up); this has pushed the Senegalese government and fund donors to undertake actions aimed at recovery of the lowlands, in order to secure rice production for smallholders.
In this context, systematic crop mapping and monitoring plays an important role for sustainable development as well as economic planning and is an effective tool for governments, planners, and decision-makers. Official agricultural statistics are usually based on data acquired through field surveys and interviewing the farmers; this method is extremely tedious, time-consuming, often inaccurate, cost ineffective, and labor-intensive [10]. Remote sensing-based methods have already been proven as an efficient alternative for mapping rice areas and forecasting production. The benefits of remote sensing technology include: (i) spatial coverage over a large geographic area; (ii) availability during all seasons; (iii) relatively low cost or no cost at all, since some satellite products are freely available (i.e., MODIS, Landsat, Sentinel 1 and 2); (iv) efficient analysis; (v) they provide information in a timely manner; and (vi) they are capable of delineating detailed spatial distributions of areas under rice cultivation [10]. Many efforts have been made in paddy rice mapping by using various algorithms (e.g., supervised and unsupervised classifiers, knowledge-based approaches, phenology-based classifiers) as well as different data sources including optical remote sensing (e.g., SPOT-VGT, MODIS, Landsat, Sentinel 2) and microwave remote sensing (e.g., RADARSAT, PALSAR, Sentinel 1) [11]. Exhaustive analyses of existing paddy rice mapping algorithms are available in specific reviews [10,11,12]. Most of these techniques have been developed for South and Southeast Asia, where almost all the world’s rice production is concentrated. As stated by Mosleh et al. [10], most developed algorithms are empirical in nature and require further calibration and validation prior to being implemented over other geographical locations. To the authors’ knowledge, only two studies have focused on rice mapping in African countries through remote sensing means. Turner and Colganton [13] mapped rice in the Inland Niger Delta of Mali using three SPOT-XS scenes acquired in 1988 and supervised and unsupervised techniques. Busetto et al. [14] used the PhenoRice algorithm to track recent variations of rice cultivation practices along the Senegal River Valley. This algorithm exploits time series of MODIS imagery to identify unique phenology features of paddy rice; due to the moderate spatial resolution of these satellite data, i.e., 250 m, it is not suitable for mapping rice in regions, like Middle Casamance, where paddy areas are small in size and scattered throughout the territory where geo-pedo-morphological conditions are favorable.
The recent launch of the Sentinel 1 (S1) and Sentinel 2 (S2) satellites, thanks to their high spatial resolution and short revisit times, has provided unprecedented opportunities to map paddy rice, especially in fragmented landscapes. Both satellites provide substantial advances regarding spectral, spatial, and temporal resolutions compared to the previous satellite generations. In particular, S1 allowed the major limitations of previous SAR missions to be overcome, such as: (i) lack of systematic acquisitions, (ii) poor data availability, and (iii) high cost for large-scale mapping that jeopardized the development of operational products [11,15]. Furthermore, the dense time series provided by S1 and S2 satellites offer the opportunity to retrieve dynamic properties of target surfaces by investigating their spectral features (both reflectance and backscatter) combined with temporal information on any changes. The availability of satellite imagery at key times during the crop growing cycle is indeed essential for accurate discrimination [16].
The main objective of this study is, therefore, to develop a methodology to collectively map the rice-cropping system in the Sédhiou region based on S1- and S2-derived metrics (predictors) and Random Forest (RF) methodology [17]. RF is an ensemble learning classifier that has achieved efficient classification results in various remote sensing studies, including cropland mapping [18,19,20,21]. The high-resolution resulting cartography allows, on the one hand, to map the various rice-growing areas scattered throughout the territory and, on the other, to derive information, such as their exploitation level, which can facilitate targeted actions of both technical assistance and restoration of degraded rice production areas. The novelty of the current investigation with respect to the existing rice mapping literature regards not only the study area, which has never previously been investigated through remote sensing means, but also the peculiar characteristics of its rice production system, which implies difficulties that are not usually found in other paddy rice cultivated environments. In fact, due to the subsistence nature of agriculture in the area, rice cultivation is much less intensive than in other zones, like Southeast Asia, with consequently less defined rice spectral and backscatter firms. Moreover, a high presence of natural herbaceous vegetation with spectral and backscatter characteristics similar to rice is another aspect that hampers rice identification in the Sédhiou region. Therefore, rice mapping in this area is particularly challenging, even more so considering the high percentage of cloud-affected spectral imagery. To overcome all these issues, a new classification processing chain, which also includes an original procedure to process S2 scenes and derive cloud-free normalized difference vegetation index (NDVI) time series, was developed. Finally, the combined use of radar and optical imagery has recently been found to be able to outperform a classification based on single-sensor inputs [22,23,24,25], but only one study investigated the use of S1 and S2 time series [26] for rice mapping, although in a completely different environment. The study therefore aims to investigate the combined use of freely available S1 and S2 datasets for rice mapping in an African environment.
In light of the lack of specific high-resolution rice classification studies in the West African environment, this study also aimed to address the following research questions:
- What are the NDVI and backscatter temporal profiles of the land cover classes present in South Senegal’s lowland areas?
- What is the individual relative importance of selected input predictors for the classification task?
- Is the combination of radar and optical imagery able to outperform a classification based on single-sensor inputs?
2. Materials
2.1. Study Area
The Sédhiou region (Figure 1) corresponds to the geographic region of the Middle Casamance, covering 7341 km2 that amounts to 3.73% of Senegal’s total area. The region’s climate is of the Sudano-Guinean type, rain falls from June to October with maximum intensity in August and September, and the dry season covers the period from November to May. Yearly average precipitation ranges from 700 to 1300 mm. The lowest monthly average temperatures are recorded between December and January and vary between 25 and 30 °C; the highest are between March and September, ranging from 30 to 40 °C.
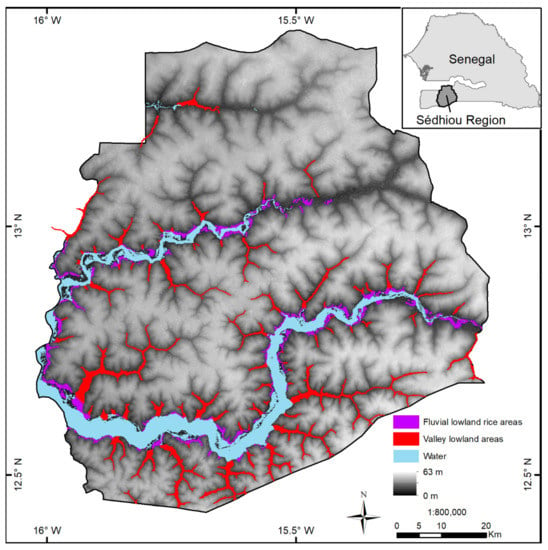
Figure 1.
Study area and location of lowland rice areas in Sédhiou Region.
The morphology is almost flat, with values ranging between 0 and 63 m (Shuttle Radar Topography Mission digital elevation model-SRTM DEM); it is characterized by a dense hydrographic network that sculpted lowland areas (locally called “valleys”) which tend to fill with water during the rainy season, becoming suitable for rice production. Other lowland areas (denominated “fluvial”) are located on the banks of the Casamance and Soungrougrou rivers.
Lowland rice cultivation is traditionally widespread and is characterized by the following peculiarities: (i) it is essentially carried out by women; (ii) almost all cultural operations are done manually with traditional tools; (iii) there is little or no use of fertilizers and pesticides; (iv) it is performed on very small plots (<1000 m2) delimited by small mud walls (locally called “balanghon”); (v) there is poor or no water control; (vi) it leads to low yields (<1 t/ha); (vi) rice production is intended almost only for self-consumption. Major production constraints are due to salinization, acidification, and silting up of lowland areas. Moreover, although roughly flat, lowland areas have a complex microtopography, since soil is not artificially levelled. This means that during the flood period, water is often not uniformly distributed in the plots. To facilitate water permanency in high spots of not levelled paddy plots, farmers create furrows or holes (respectively, locally called “billons” and “cuvettes”) and cultivate rice only on their upper borders.
In the study area, rice is grown in a single annual cycle that lasts approximately 80–120 days depending on the variety. It is typically sown from the end of July to mid-August, grows until October, and is mostly harvested during December. However, substantial local variability can exist, creating challenges for operational monitoring. More details about lowland rice culture in the Sédhiou region are given in Manzelli et al. [27,28].
2.2. Data Used in This Study
2.2.1. Sentinel 1 and Sentinel 2 Data
The S1 and S2 data were downloaded from the Copernicus Open Access Hub (https://scihub.copernicus.eu/).
Regarding S1 imagery, we made use of the Interferometric Wide Swath (IW) mode scenes provided in dual-polarization with vertical transmit–vertical receive (VV), and vertical transmit–horizontal receive (VH). We utilized the Level 1 Ground Range Detected (GRD) product with a spatial resolution of 10 × 10 m2; since only the Sentinel 1A satellite is available for the study area, the temporal resolution is 12 days. The GRD scenes were constituted of focused SAR data that had been detected, multi-looked, and projected to ground range using the Earth ellipsoid model WGS84. Two tiles were required to provide a single time period wall-to-wall mosaic of the study area.
Regarding S2 data, downloaded optical 10 × 10 m2 imagery has a temporal resolution of 5 days. Three tiles (T28PCV, T28PDU, and T28PDV) were required to provide a single time period wall-to-wall mosaic of the study area. For each rice growing season, all available S2 imagery between 1 July and 31 January with 0 to 90% cloud coverage were downloaded; this unusually high maximum value of cloud cover was made possible thanks to the processing procedure (explained in the Methods section) that is particularly effective in masking cloud defects. The 2017 and 2018 scenes were available only in the Top-Of-Atmosphere (TOA) Level 1C format, while the 2019 scenes were downloaded in the Bottom-Of-Atmosphere (BOA) Level 2A format.
2.2.2. Ground Validation Data
Two independent ground sample datasets were collected during the investigation; the sampled locations for the 2019 campaign are displayed in Figure 2. The first dataset was used for training and testing yearly RF classification. It consisted of ground point samples that were taken for each year in lowland areas during the rice harvest period. Five types of land cover (LC) were recorded, corresponding to water areas (W), natural herbaceous vegetation (NHV), rice (R), bare soil (BS), and trees (T). The class NHV includes both paddies that have not been cultivated during a season and those areas that for different reasons (salinization, silting up, acidification, insufficient means to cultivate) are normally not cultivated. Built-up areas are not present in lowland areas because these zones are flood-prone during the rainy season and therefore, not suitable for human settlements. Moreover, in the study area, no other crops are cultivated in lowland areas. Regarding rice valleys, ground sampling was performed through transects from side to side and at different heights (beginning, center, end) in order to sample land cover classes in different geo-pedo-morphology and water availability conditions. However, since there were not enough training and validation ground samples for water, bare soil, and trees classes, they were supplemented by samples selected by photointerpretation of Google Earth (GE) high resolution imagery. A total of 416, 455, and 400 samples were collected for 2017, 2018, and 2019 seasons, respectively (Table 1). To ensure independent calibration and validation sets, samples were divided in two groups for training and testing the random forest algorithm using a 50/50 percent stratified random sampling approach.
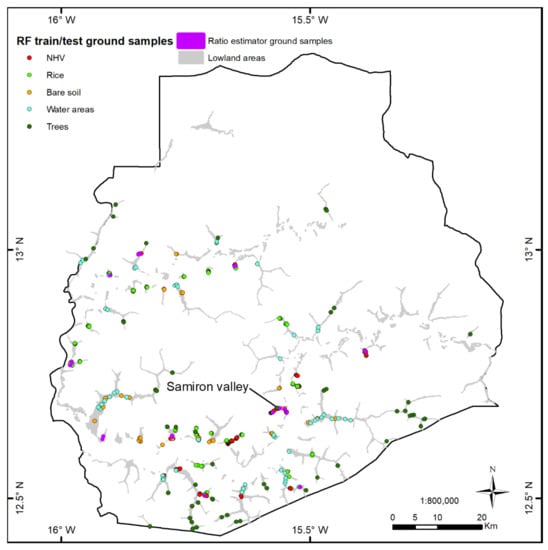
Figure 2.
Ground samples collected for the 2019 rice growing season.

Table 1.
Yearly number of Random Forest (RF) training and test samples for each land cover (LC) class. NHV—natural herbaceous vegetation.
The second ground sample dataset was used to obtain a statistically sound estimate of regional rice area in an exemplary year (2019), as further explained in the “Statistical estimation of rice area” subsection of the Methods section. This dataset, collected during the 2019 harvest period, consisted of 20 40 × 40 m2 (4 × 4 S1 and S2 pixels) plots independent of the training/testing samples and uniformly distributed within the two strata containing rice areas (fluvial and valley lowland areas). The position of the 20 plots was chosen randomly within the two strata, thus configuring a balanced survey or probability sampling design. For each of these plots, the rice area fraction was determined on the basis of the ground observations complemented by visual analysis of GE images that fortunately were available for the 2019 rice growing season.
2.2.3. Lowland Area Mask
This study focused on delineating lowland rice-cropping systems. A thematic cartography of the lowland areas had already been performed [29] and was used here to exclude upper areas not suitable for paddy rice. This mask (Figure 1) was derived through the combined use of a 30 m SRTM (Shuttle Radar Topography Mission) digital elevation model (DEM) and photointerpretation of high-resolution Google Earth images; it was further validated by a field survey performed in 2013. The mask was then updated and improved over the years, giving a total of more than 350 distinct areas spread over the region and a total area of around 25,000 hectares.
3. Methods
The overview of the study workflow is shown in Figure 3; it consists of the following steps: (1) data pre-processing of S1 and S2 scenes; (2) S1 and S2 data processing, which involves the creation of the NDVI and backscatter time series; (3) computation and optimal selection of predictors; (4) Random Forest classification; (5) validation of classification; (6) improvement of the 2019 rice area estimation by the use of a ratio estimator. The methodological steps are fully described in the following sections.
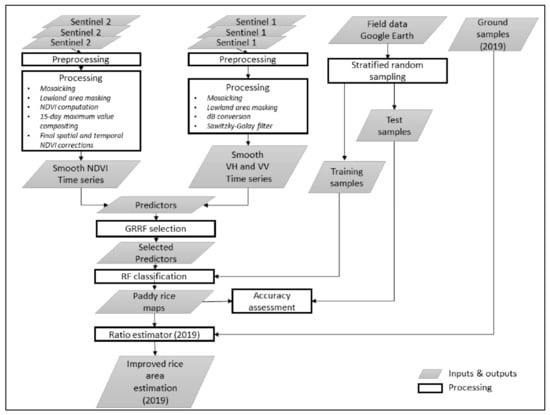
Figure 3.
Overview of the study workflow.
3.1. Pre-Processing of S1 and S2 Imagery
S1 imagery was pre-processed with Sentinel Application Platform (SNAP) software v7.0 to derive the backscatter coefficient for each pixel using the following steps: (1) apply the orbit file to update orbit metadata with a restituted orbit file; (2) GRD border noise removal—this step removes the low intensity noise and invalid data at the scene edges; (3) thermal noise removal—this process removes additive noise by reducing discontinuities in sub-swaths for multi-swath acquisition; (4) radiometric calibration using sensor calibration parameters; (5) terrain corrections using SRTM—this process converts the S1 calibrated intensity to geocoded backscatter coefficient (σ°), accounting for terrain characteristics. The values of local incidence angles extracted for the study area showed negligible variation, thus avoiding the need to account for topographic influence on backscatter.
Pre-processing of S2 imagery involved only scenes for the 2017 and 2018 rice growing season, since they were available only in the Top-Of-Atmosphere (TOA) Level 1C format; hence, they were pre-processed to obtain Bottom-Of-Atmosphere (BOA) Level 2A products using sen2cor plugin v2.5.5 [30], available on the SNAP software v7.0.
3.2. Processing of S1 and S2 Imagery
The pre-processed S1 data were processed through the following steps: (1) mosaicking of images of the same date; (2) masking using the lowland area mask to remove unsuitable upper areas; (3) conversion to decibels via log scaling (10*log10(σ°linear)) and quantization to 32-bits; (4) smoothing of backscatter time series using a Savitzky–Golay (S–G) filter [31] in order to reduce speckle, high-frequency signal, and random noise components. The use of an S–G filter to smooth backscatter time trends has already been implemented in several other studies [32,33,34,35]; filter order, filter length, and time scaling factor S–G parameters were set to 1, 3, and 2, respectively. An example of S–G filtering is given in Figure 4.
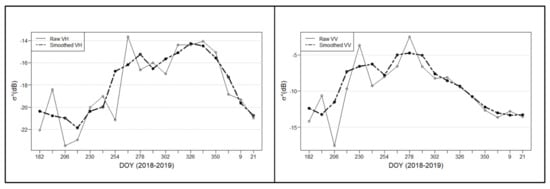
Figure 4.
Raw and smoothed 2018 VH (left) and VV (right) backscatter temporal dynamics for a pixel (Lat. −15.5669, Lon. 12.6794) of a paddy rice plot in Samiron valley. VH—vertical transmit–horizontal receive; VV—vertical transmit–vertical receive.
This processing workflow was conducted on each yearly S1 dataset on all available imagery between 1 July and 31 January, resulting in a total of 18 VV and VH input features per year for RF classification.
Processing of Sentinel 2 data involved the following steps: (1) mosaicking; (2) NDVI computation; (3) 15-day maximum value compositing; (4) final spatial and temporal NDVI corrections.
The Sentinel 2 time series were computed using the Normalized Difference Vegetation Index (NDVI) [36], a useful measure of greenness and vigor that is closely correlated to the leaf area index of paddy rice fields [37]. NDVI data facilitate meaningful comparisons of seasonal and inter-annual changes in vegetation growth and activity. The strength of the NDVI lies also in its rationing concept, which reduces many forms of noise (illumination differences, cloud shadows, atmospheric attenuation, and certain topographic variations) which are present in the original multispectral bands [38]. Reflectance values in band 4 and band 8 of the Sentinel 2 products were used to calculate NDVI, as shown in Equation (1):
where ρnir is the reflectance value of the NIR band and ρred is the reflectance value of the red band.
NDVI = (ρnir − ρred)/(ρnir + ρred)
In order to correct for the influence of clouds, the Maximum Value Composite (MVC) method was applied for calculating the highest NDVI value on a 15-day basis and thus, deriving two scenes per month. Due to the high percentage of cloud cover affecting scenes between July and October (Figure 5), however, the MVC method was not always able to remove the influence of clouds. This issue was fixed by applying a correction procedure originally proposed by Escadafal et al. [39] and fully developed by Maselli et al. [40]. The procedure consists of two sequential steps corresponding to spatial and temporal filtering operations, respectively. The spatial filter first removes isolated pixels with anomalous NDVI values (i.e., out of a pre-defined standard deviation range from the average) and replaces them with local NDVI averages. The temporal filter then operates through an “upper envelope” algorithm that does not modify the seasonal NDVI maxima but removes the NDVI drops that are followed by immediate recoveries. An example of the filtering effect of this procedure is given in Figure 6.
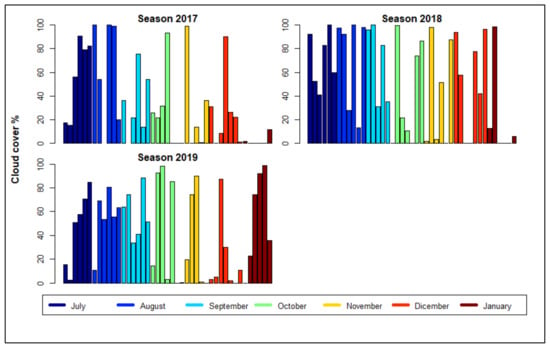
Figure 5.
Percentage of cloud cover affecting S2 T28PDV tile imagery (corresponding to 82% of the study area) in 2017, 2018, and 2019 seasons.
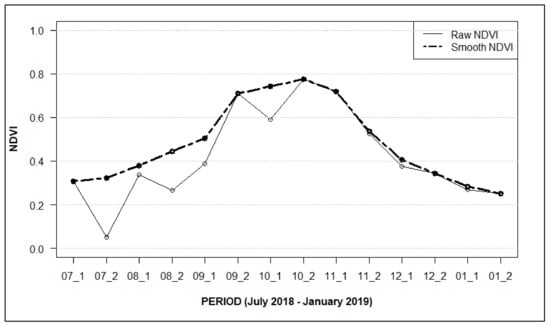
Figure 6.
Raw and smoothed 2018 NDVI temporal dynamic for a pixel (Lat. −15.5669, Lon. 12.6794) of a paddy rice plot in Samiron valley.
The final smoothed NDVI scenes were produced at 15-day intervals between 1 July and 31 January, resulting in a total of 14 input features per year for RF classification.
3.3. Image Classification by RF
RF is a nonparametric decision tree learning algorithm that is part of the machine learning classifiers [17]. RF was chosen over other supervised classification models, since it is known for performing particularly well and efficiently on large input datasets with many different features [41], and previous research used this classifier for mapping purposes with great success [32,42,43]. The RF algorithm falls under the ensemble learning methods, in which multiple decision trees (forming a random forest) are built during training, after which the mode of the predicted classes of the individual trees forms the output class of the forest. The RF classifier usually outperforms simple decision trees due to less overfitting [44]. The random forest is constructed using a bootstrapping technique, in which each tree is fitted based on a random subset of training samples with replacement, while at each split in this tree, a random subset of the input features is also selected [41].
3.3.1. Computation and Optimal Selection of Predictors
The within-season temporal dynamics of backscatter and NDVI are strictly related to physiological changes during crop growth; the extraction of key parameters from temporal profiles built from multi-temporal datasets of satellite imagery is a widely used approach for crop mapping and classification [45].
In the study, spectral and backscatter metrics related to rice phenological stages and/or crop management were used as predictors in RF classification. The metrics used as predictors derived from temporal profiles of S1 VV and VH backscattering coefficients and S2 NDVI index are shown in Table 2. Most of the predictors were calculated for the whole length of the rice growing cycle (PTOT) and for three specific temporal windows (i.e., P1, P2, P3) related to specific agropractices and/or rice phenological stages (Figure 7). P1 covers the period July–August corresponding to the period of land preparation, flooding of paddy plots, sowing/transplanting of rice, and emergence. P2 covers the period September–October and corresponds roughly to the vegetative and reproductive stages until flowering. P3 covers the period November–December–January and corresponds to the ripening stage and harvest. Even if most of the production is usually harvested between November and the first half of December, P3 also includes January because sometimes, when land preparation is carried out late due to operational constraints or delays of seasonal rainfalls and long cycle rice varieties are used, harvest is performed in this month. During the preliminary exploration of temporal NDVI and backscatter signatures, it emerged that rice, compared to the other land cover classes, has a peculiar and more abrupt decrease in the period from flowering to harvest (Figure 8); therefore, three more predictors (Span_harv_dec, Span_harv_30, Span_harv_45) were extracted from optical and backscatter metrics in order to highlight this specific rice pattern and facilitate RF classification. A total of 93 predictors were calculated annually from NDVI, VH, and VV backscatter time series.

Table 2.
Predictors extracted from yearly S1 VV and VH backscattering coefficients and S2 NDVI index (PTOT = July–January; P1 = July–August; P2 = September–October; P3 = November–December–January).

Figure 7.
Calendar of rainfall, phenological stages, and temporal windows used for predictors calculation.
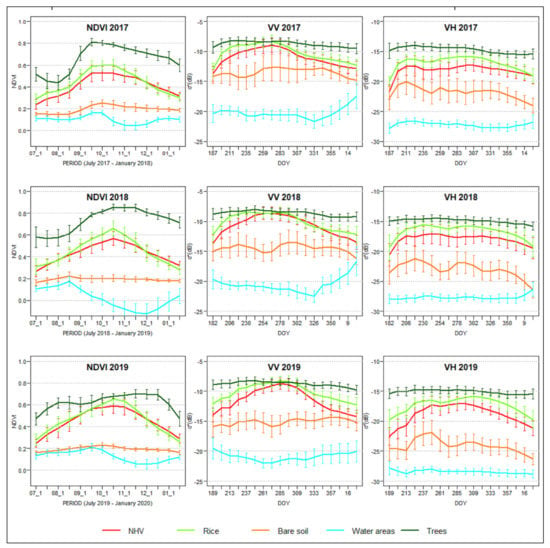
Figure 8.
Average temporal patterns of NDVI, VV, and VH backscatters for land cover classes mapped in the three seasons investigated. Error bars indicate standard deviations.
Nevertheless, within such a large amount of predictors, all calculated from the same original spectral and backscatter metrics, multicollinearity and redundancy usually arise. Performing predictors selection allows the use of redundant and misleading data to be reduced to reach highest classification accuracy, while decreasing computation time. Therefore, a reduction in predictors by selecting the best performing ones is recommended [46]. This step was performed using the Guided Regularized Random Forests method (GRRF) [47]. The GRRF has recently been successfully applied in classification tasks [48,49,50]. GRRF selects the most relevant predictors without loss of information from the data. The rationale behind GRRF is to regularize the feature importance obtained by the standard RF per predictor. A full description of this method is available in Deng and Runger [47]. Regarding GRRF parameters, λ (penalty factor) was set to 1 as in previous works [47], while γ (weight of the normalized feature importance) was set to 0.2. The number of selected predictors for each year is reported in the second column of Table 3.

Table 3.
Selected parameters for 2017, 2018, and 2019 RF classifications based on S1 and S2 datasets.
Taking into account that the trees within the GRRF are not independent, the method is only able to select predictors and not to estimate their importance. Therefore, once the predictors were selected, a standard RF was used to estimate this.
3.3.2. Application of RF Classifier and Accuracy Assessment
Once the best performing predictors had been identified, they were used to train and apply the RF classifier. In our study, RF classifier was run using the “Random Forest” (v.4.6–14) R package-based script published by Millard and Richardson [51]. The “tuneRF” function of the same package was used to tune the RF classification by optimizing, with respect to Out-of-Bag (OOB) error estimate, the two main parameters: ntrees (the number of trees to grow) and mtry (the number of variables that should be selected at a node split). The selected ntrees and mtry parameters and resulting OOB error for each year are given in Table 3.
The classification accuracy assessment was performed using independent test samples. Error matrices were computed for each rice growing season, deriving user accuracies, producer accuracies, overall accuracy, and a Kappa coefficient. A Kappa coefficient [52] determines whether the results presented in the error matrix are significantly better than a random result and can range from −1 to 1.
In order to evaluate if the combination of radar and optical imagery outperforms a classification based on single-sensor inputs, the above described classification procedure was also applied to single S1 and single S2 datasets. Classifications were evaluated and compared based on overall matrix error accuracy (OA), rice class user accuracy (RUA), and rice class producer accuracy (RPA).
3.4. Statistical Estimation of Rice Area
The statistical estimation of crop area is a complex issue that should theoretically be kept distinct from crop mapping. The direct use of classified satellite images for a statistically sound estimation of crop area is, in fact, usually hampered by the insufficient accuracy and biasedness of the maps obtained [53]. This was also the case for the current investigation, which implies that the area estimates produced by RF classification are likely not unbiased. These estimates, however, can be corrected into unbiased values through the application of an estimator belonging to one of the two major families, i.e., calibration and regression [53,54]. The calibration estimator relies on the use of error matrices and can contemporarily correct the area estimates of all classes considered. The regression estimator is instead more proficiently applied to correct the estimates of only one class, as is currently the case for rice.
In any case, the area correction must rely on a balanced survey possibly independent of the classification training, i.e., on reference area observations collected by probability sampling [54]. Such observations were only available for one year, 2019, which was therefore used to exemplify the possibility of rice area correction through the regression estimator.
In practice, this estimator combines biased information known for the whole population with accurate information obtained from a balanced survey [54]. In the current case, the biased information was derived from the RF classification of the entire study region, while the accurate information was derived from the reference sample of 2019. The objective of this operation was to preserve the properties of this sample (unbiasedness) as much as possible and reduce the respective uncertainty (i.e., increasing the precision).
The ratio estimator is a simplification of the regression method which is preferable when the relationship between the percentage areas from the ground survey and from the image classification is linear through the origin, as it presumably was in our case. Among the various forms of ratio estimator, the estimation of average rice area fraction () was obtained by the following equation:
where RAcp is the average rice area fraction derived from the image classification and Bg−c is the slope of the regression of ground (dependent variable) versus classified (independent variable) rice area fractions forced through the origin.
4. Results
4.1. Temporal NDVI and Backscatter Land Cover Patterns
Average temporal patterns of NDVI, VV, and VH backscatters for the five LC classes mapped in the Sédhiou region lowland areas are shown in Figure 8. In general, the dynamics of the five classes are fairly stable over the three monitored growing seasons, thus providing a solid basis for the subsequent classification task.
Regarding rice, its temporal patterns show the typical dynamics related to the three distinct cycle stages: (i) the flooding/transplanting period, (ii) vegetative period, and (iii) maturation/harvest period. Initially, both NDVI and backscatter values are low for paddy rice during the flooding/transplanting period due to the presence of water, followed by an increase over the vegetative-to-reproductive stage and finally, a significant decrease from maturation to harvest stage. This final reduction is due to biomass removal and plant senescence (for NDVI) and surface scatter from the open land (for S1 backscatters).
The natural herbaceous vegetation (NHV) class shows similar dynamics to rice but characterized by generally lower values of NDVI and backscatter over the season. Another difference from rice is a more gradual decrease in NDVI values in the last months. However, it must be pointed out that these are average trends and that a strong intra-class variability in both rice and NHV classes exists. This variability is clear from Figure 9, where the 2019 average patterns of rice and NHV classes and the dynamics of four selected ground plots belonging to these classes are displayed. The ground sample patterns may substantially diverge from the respective class average pattern and overlap those of the other class, thus hampering the classification task.
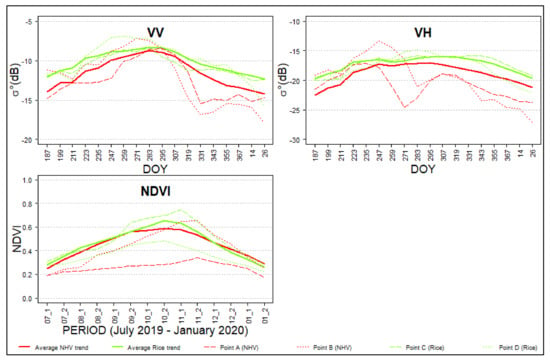
Figure 9.
Average temporal patterns of NHV (Natural Herbaceous Vegetation) and Rice classes in 2019 against temporal patterns of four selected plots. (Point A: Lat. −15.7788, Lon. 12.6201; Point B: Lat. −15.7691, Lon. 12.5584; Point C: Lat. −15.6477, Lon. 12.6211; Point D: Lat. −15.5462, Lon. 12.6735).
Regarding the trees class, it generally shows a dynamic characterized by the highest values between monitored classes. VH and VV backscatter dynamics are normally smoother than rice and NHV classes, more stable, and with a less evident decrease in the last stages of the season. NDVI dynamics generally show an increase during September and October and a decrease in the last monitored months, but with a less defined reduction compared to rice and NHV classes. On the other hand, bare soil and water areas classes show the lowest values both in S1 backscatters and S2 NDVI values. Backscatter and NDVI values of water areas tend to increase in the last months due to the fact that water level decreases and retreats, leaving water-free damp areas that are occasionally colonized by natural vegetation.
4.2. Importance of Predictors
Using the GRRF method, 31, 29, and 21 predictors are selected for RF classification in the 2017, 2018, and 2019 rice growing seasons, respectively. The normalized importance of the chosen predictors for each season are given in Figure 10, sorted in descending order. It can be appreciated that 36 of the selected predictors, corresponding to 44.4% of the total, involve data derived from S2 data, i.e., NDVI. Instead, VV and VH backscatter-derived selected predictors are 24 and 21, accounting for 29.6% and 25.9% of the total, respectively. Considering only the five most important predictors per season, the predominance of S2-derived predictors becomes even more important, accounting for 73% of the total. The average NDVI value over the season (NDVI_mean_PTOT) is the most important predictor in the 2017 and 2018 seasons and the second most important in 2019. Moreover, also the metrics that record the characteristic abrupt decrease in rice NDVI values (i.e., NDVI_span_harv dec, NDVI_span_harv_30, NDVI_span_harv_45) are generally present among the most important predictors in each season. Regarding radar backscatter-derived predictors, most of those selected concern average values over the whole season. Predictors related to time occurrences and standard deviation metrics are never selected by GRRF.
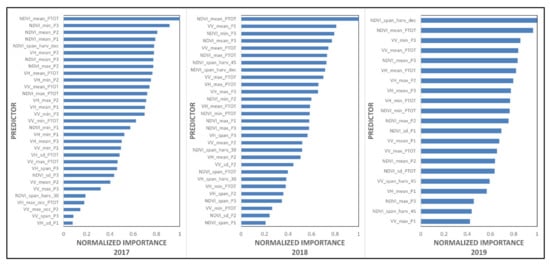
Figure 10.
Normalized importance of the predictors selected for 2017, 2018, and 2019 seasons.
4.3. Classification Results and Accuracy Assessment
Classification land cover results over the selected study period are shown in Figure 11. The classification identifies 13,974 (2017), 12,428 (2018), and 12,801 (2019) ha of rice crops in lowland areas, corresponding to 56%, 50%, and 51% of the mapped area, respectively. This indicates, on the one hand, a general temporal stability in the exploitation rate of lowland areas over the years; on the other, it highlights that large morphologically suitable rice areas are not used for cropping.
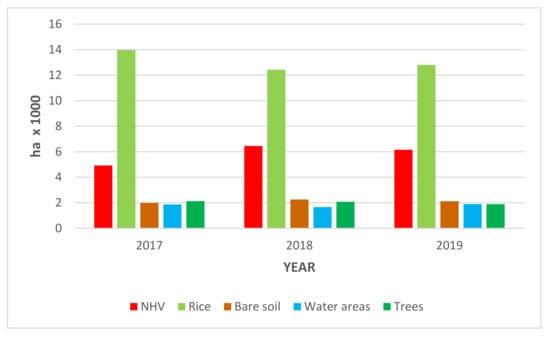
Figure 11.
Land cover statistics for 2017, 2018, and 2019 rice growing seasons (NHV—natural herbaceous vegetation).
At the local level, great variability exists (data not shown), with areas fully exploited for rice growing and others that for different reasons are not exploited at all. The entire region’s classified map cannot be shown here as the lowland areas are strongly dispersed over the territory and cover only a small fraction of it; subsequently, the resulting figure would be difficult to understand and appreciate. We therefore prefer to show here the classification of a single area and we chose the Samiron valley (Figure 12), which is located near Sédhiou town, capital of the eponymous region. In the valley, a first area close to the Casamance river can be identified, which is heavily degraded due to the presence of acidified and salinized soils; here, bare soil or natural herbaceous vegetation LC classes are present. Then follows a large area which is, to a great extent, cultivated over the three monitored years. Finally, it is possible to identify a last narrow area of the valley which is less exploited and in a more variable way depending on the seasonal water availability, which, as mentioned, depends exclusively on seasonal rainfall.
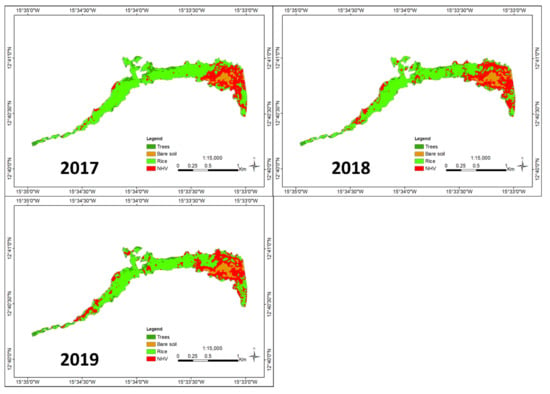
Figure 12.
Classification of Samiron valley in 2017, 2018, and 2019 rice growing seasons.
Regarding the other LC classes, NHV is the one that shows the highest variability with values ranging from 4922 (2017) to 6452 ha (2018). NHV values are complementary to those of rice, since the sum of areas covered by the other three LC classes (bare soil, water areas, and trees) are, as expected, stable over the years with around 6000 ha.
The results of the classification accuracy assessment are shown in Table 4. The overall accuracy of RF classification ranges from 84.5% in 2017 to 87.4% in 2019. The Kappa coefficient ranges between 0.68 (2017) and 0.8 (2019). Most of the LC classes are correctly classified with high user accuracy values. NHV, on the other hand, is recognized by the classifier with more difficulty and user accuracy for this class ranges between 66% (2019) and 69% (2018). In most cases, wrongly classified NHV samples are identified as rice. The same type of misclassification (between NHV and rice) is recorded also for the rice class, but with a lower magnitude; therefore, user accuracy for this class is always higher and ranges between 87% (2017 and 2018) and 89% (2019). These inaccuracies in the classification of NHV and rice classes indicate an overestimation of rice cropped areas.

Table 4.
Confusion matrices of lowland land cover maps in 2017, 2018, and 2019 rice growing seasons (NHV—natural herbaceous vegetation; R—rice; B—bare soil; T—trees; U_ACC—user accuracy (%); P_ACC—producer accuracy (%); O_ACC—overall accuracy (%); K_COEF—Kappa coefficient).
4.4. Assessment of Classification Accuracies with Different Dataset Combinations
The performances of RF classifications using single datasets or a combination of them are given in Table 5. The results clearly show that the combination of radar and optical imagery always outperforms a classification based on single-sensor inputs. Regarding single inputs-based classifications, S2-based timeseries show higher accuracies compared to S1-based classifications. However, while the differences in OA for classifications based on single inputs are moderate (between 2 and 5), the combined use of the two datasets leads to very marked improvements (about 8–9% compared to S2 single input classification and about 12–13% compared to S1 single input classification). Regarding RUA and RPA, evidence is on the whole similar, even less marked. It is also interesting to note that all these results are fairly stable over the three years.

Table 5.
Accuracy statistics derived from error matrices of classifications produced with different dataset combinations (OA—overall accuracy (%); RUA—rice class user accuracy (%); RPA—rice class producer accuracy (%); S1—Sentinel 1; S2—Sentinel 2).
4.5. Statistical Estimation of Rice Area
The average rice area fraction and respective standard error obtained by the ground survey of 2019 (20 40 × 40 m2 plots) are 0.463 and 0.097, respectively. The sample is therefore characterized by a notable uncertainty, which can be reduced by applying the ratio estimator to the corresponding RF classification. Figure 13 shows the linear regression forced through the origin of the rice area fractions measured on the ground and derived from the RF classification for the 20 plots. The correlation between ground and classified rice area fractions is very high (R2 = 0.928), and the regression slope is close to 1 (0.980). The application of this slope to the mean rice area fraction found from the RF classification over the whole region (0.514) produces a corrected rice area fraction average of 0.504, with notably reduced standard error (0.025). This implies a high relative efficiency of the estimator (RE), which is given by the ratio of the sample and estimator variances (14.5). Such RE can be seen as a factor which, multiplied by the number of plots actually surveyed, indicates the number of ground plots which should be theoretically considered to obtain a precision similar to that of the applied ratio estimator (i.e., 14.5 × 20 = 290).
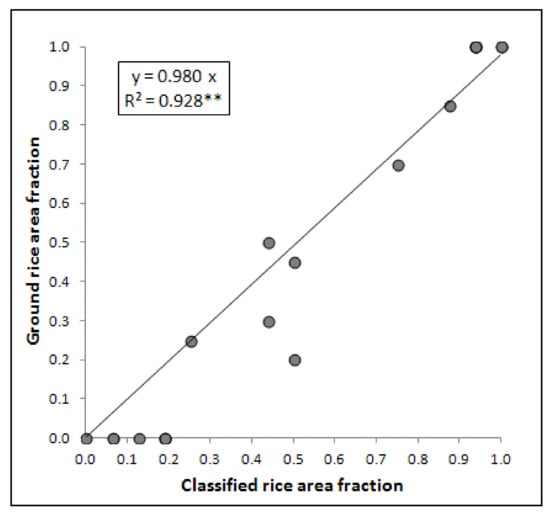
Figure 13.
Linear regression forced through the origin of the rice area fractions measured on the ground and derived from the RF classification for the 20 40 × 40 m2 plots (** = highly significant correlation, p < 0.01).
5. Discussion
In this study, multitemporal S1 and S2 series were used to identify paddy rice fields in South Senegal. Standard procedures were applied for S1 pre-processing and processing of S1 imagery, while for S2 data, a specific new procedure was developed to remove cloud influence. The preliminary analysis of S1 and S2 time series data provided insight into the selection of metrics to derive suitable predictors for RF classification. The results from the predictors selection, performed using the GRRF method, demonstrated that NDVI time series in our study area provide more valuable information compared to VV and VH backscatters. This can be attributed to average NDVI values that are particularly capable of distinguishing rice from three of the other four LC classes present in lowland areas, i.e., bare soil, water areas, and trees. In addition, the decrease in NDVI values in the final stage prior to harvest resulted effective in rice mapping, especially to distinguish rice from NHV. The higher effectiveness of the S2 dataset was confirmed by the fact that the RF classifier performed better, implementing solely optical data than solely radar data (Table 5). On the other hand, the results of this investigation clearly highlight that the combination of these two datasets performs better than using them individually. This finding is particularly important since the synergetic combination of optical and microwave Sentinel datasets for rice mapping has so far been poorly investigated, except for the work by Cai et al. [26]. This combined use of dense optic and microwave datasets implies the use of a massive amount of data which, especially for very large areas, can become dramatically time-consuming and computationally difficult. From this point of view, the use of the Google Earth Engine platform, although not implemented in this study, can be utilized to overcome these limits and has already been effectively exploited in other studies [50,53] based on the use of the RF classifier.
The accuracy assessment found good overall accuracies for the three monitored years, thus indicating the steadiness of the classifier’s capacity to distinguish rice. However, our study was limited by a number of factors. The availability of Sentinel 1A, but not 1B, limited backscatter data input to 12-day time intervals. Regarding S2 scenes, although they are acquired with a 5-day revisiting time, the procedure implemented in this study led to two scenes per month of NDVI time series. At these time resolutions, it can sometimes be difficult to fully distinguish distinct crop phases, such as initial inundation, maximum values around flowering, and harvest. Moreover, several previously developed methodologies (among them: [16,54,55,56]) took advantage of the flooding period characteristic of rice cultivation to distinguish it from other land cover classes. In this investigation, such an advantage is reduced since all vegetated surfaces of lowland areas, except the trees LC class that is mostly located on the higher surfaces, usually have an inundation period. Finally, considering the confusion matrices of Table 4, it became apparent that specific confusion occurred between natural herbaceous vegetation (NHV) and rice. This can be explained by the fact that the average dynamics for these two classes are similar (Figure 8) and characterized by a high degree of intra-class pattern variability (Figure 9). As previously stated [57,58], the reflectance spectrum of a rice crop canopy is the result of a complex relationship between its biophysical and biochemical attributes. Changes in one or more growth conditions, such as climate, water supply, cultivation practices, or nutrition, may strongly affect reflectance and backscatter patterns [12]. Similar considerations can also be made for the NHV present in the non-cultivated lowland areas. Sources of variability for the NHV class are: (i) species, since several are present in lowland areas and each one is characterized by different reflectance and backscatter patterns; (ii) water availability, since this aspect, that depends primarily on site-specific pedo-morphology, leads to variations of S1 and S2 dynamics from the average pattern. Regarding rice, in the monitored study area, sources of variability are: (i) varieties—in the region, numerous genetically improved and traditional indigenous cultivars are used, each one with peculiar optical and backscatter dynamics; (ii) site-specific terrain and soil conditions that affect plant development; (iii) water availability, since the lack of soil levelling and site-specific soil permeability characteristics cause variations; (iv) cultivation techniques such as furrows and holes. The use of these traditional techniques generally implies lower seed densities, thus affecting NDVI values. As shown in Figure 8 and Figure 9, one of the main differences between rice and NHV is that the former usually shows higher maximum NDVI values and higher mean NDVI values from the beginning of the vegetative stage to the reproductive stage; therefore, where “billons” and “cuvettes” are used, this distinguishing element reduces or is less evident. Regarding S1 backscatters, the presence of such techniques causes variations in the bare soil scattering mechanisms in the first and final stages of the rice growing cycle since when the canopy does not cover the soil surface (i.e., before emergence/transplanting and after harvest), surface roughness become an important variable influencing backscatter. A decrease in classification accuracies due to the presence of specific soil preparation techniques such as furrows has also been reported by Nguyen and Wagner [59]. These authors also noted that the effect of furrows on backscatter dynamics was variable depending on their depth and direction (parallel or perpendicular) to the radar viewing direction, thus hampering classification tasks. In the context of this objective difficulty of the classifier to fully distinguish NHV from rice, the error matrices indicated that the commission error was always higher for NHV and that about 30% of NHV test samples were classified as rice; instead, only between 5% and 10% rice test samples were classified as NHV. This outcome indicates a bias of the classifier with consequent overestimation of the rice class. This finding is confirmed by the application of the ratio estimator to the rice area predicted for the 2019 growing season, which is reduced from 12,801 to 12,544 ha. The same correction significantly reduces the standard error of rice area estimation, i.e., increases its precision. In this study, implementation of the ratio estimator to adjust the remotely sensed rice area estimates can be also seen as an effective solution to overcome limitations due to lack of reliable statistics to compare with.
The methodology implemented in this investigation was specifically developed for the Sédhiou region study area. However, it can be directly applied to other areas of Senegal with analogous rice producing systems, such as the regions of Ziguinchor and Kolda (corresponding to Low and High Casamance), or to neighboring regions of Guinea Bissau. The developed methodology can however be easily adapted to other contexts where high spatial resolution is required, usually due to the high patchiness of the rice producing areas. Furthermore, the results of this study demonstrate the reliability and efficiency of S1 and S2 datasets that, among the various advantages they provide compared to previous satellite generations, are freely available; this factor is essential in contexts like that investigated in the present manuscript where a lack of economic resources is often a limitation to the application of remote sensing techniques for operational and research purposes.
With further analysis, the results of this investigation could be useful for forecasting rice production in the area and for a quantitative recognition of key phenological phases, such as transplanting, tillering, and harvesting. Moreover, the evidences of the present investigation could also be useful for the assessment of rice growth and cropping system efficiency.
6. Conclusions
In this study, the machine learning RF method and S1 and S2 time series data were used to obtain paddy rice information in the Sédhiou region, South Senegal. The study demonstrated the potential of using freely available optical and microwave data as input for an object-based RF classification to identify paddy rice at high resolution. The combination of S1 and S2 dense time series provided reliable predictors for RF classification. Predictors were selected using a GRRF methodology. The comparison of classification accuracies with different dataset combinations highlighted that the integration of S1 and S2 datasets improves accuracies compared to the use of single datasets.
Despite some factors affecting the classification accuracies (mostly due to similarities between natural herbaceous vegetation and rice patterns), the overall accuracy and Kappa coefficient were higher than 80% and 0.68, respectively, over the three monitored rice growing seasons. These values, even if not as high as those obtained in analogous studies for other areas, can be considered satisfactory given also the complexity of the local subsistence agriculture system and confusion induced by traditional crop practices. As demonstrated by the exemplary application of the ratio estimator to the observations of 2019, the method proposed in this paper can provide reliable rice production statistics at both the regional and local level and produce supporting information for technical assistance and restoration of production degraded areas.
Author Contributions
Conceptualization: E.F.; methodology: E.F., G.F., F.M.; data: E.F.; investigation: E.F., G.F., F.M.; software: E.F., E.D.G., G.F., F.M.; validation: E.F.; visualization: E.F.; supervision: E.F.; writing—original draft preparation: E.F., F.M.; Writing—review and editing: E.F., E.D.G., G.F., F.M. All authors have read and agreed to the published version of the manuscript.
Funding
This study has been carried out within the framework of PPAT&RD (“PAPSEN/PAIS Assistance Technique et Recherche pour le Développement”) Project. PPAT&RD was co-funded by the Italian Agency for Development Cooperation (AICS), National Research Council of Italy (CNR), and Senegalese Institute of Agricultural Research (ISRA).
Acknowledgments
The authors wish to warmly thank Alessandro Lapini (IFAC–CNR) for the useful suggestions in RF model tuning, as well as Simon Tendeng and Boubacar Bamba (ISRA) for explanations about the rice cropping system in Casamance and field sampling support. The authors also thank the anonymous reviewers who provided valuable comments and suggestions to improve the paper.
Conflicts of Interest
The authors declare no conflict of interest. The funders had no role in the design of the study; in the collection, analyses, or interpretation of data; in the writing of the manuscript, or in the decision to publish the results.
References
- Ahmadi, N.; Bouman, B. Riz et rizicultures, enjeux économiques, écologiques et scientifiques. Cahiers Agric. 2013, 2222, 333–335. [Google Scholar] [CrossRef]
- Mendez Del Villar, P.M.; Bauer, J.M. Le riz en Afrique de l’Ouest: Dynamiques, politiques et perspectives. Cah. Agric. 2013, 2222, 336–344. [Google Scholar] [CrossRef]
- Maclean, J.; Hardy, B.; Hettel, G. Rice Almanac: Source Book for One of the Most Important Economic Activities on Earth, 3rd ed.; IRRI: Manila, Philippines, 2013; pp. 216–217. ISBN 0-85199-636-1. [Google Scholar]
- FAOSTAT Statistical Database; FAO (Food and Agriculture Organization of the United Nations): Rome, Italy, 2020; Available online: http://www.fao.org/faostat/en/#home (accessed on 21 June 2020).
- Mendez Del Villar, P.; Bauer, J.M.; Maiga, A.; Ibrahim, L. Crise Rizicole, Évolution des Marchés et Sécurité Alimentaire en AFRIQUE de l’Ouest; Appraisal Report; CIRAD: Montpellier, France, 2011. [Google Scholar]
- Seck, P.A.; Togola, A.; Touré, A.; Diagne, A. Propositions pour une optimisation des performances de la riziculture en Afrique de l’Ouest. Cah. Agric. 2013, 2222, 361–368. [Google Scholar] [CrossRef]
- Gueye, A.A. Étude bibliographique sur la filière riz au Sénégal. Rapport final. Bamako (Mali): Observatoire national du Riz au Sénégal (ONRS), Atelier régional du PRIAF-RIZ (2004). Available online: http://hubrural.org/IMG/pdf/senegal-etude-biblio-filiere-riz.pdf (accessed on 21 June 2020).
- Programme National D’autosuffisance en Riz (PNAR). Ministère de l’Agriculture. 2009. Available online: https://www.ipar.sn/IMG/pdf/2009_Prog_Nat_Autosufisance_Riz.pdf (accessed on 21 June 2020).
- Mendez Del Villar, E. Rapport de Mission. Le Riz Pluvial en Casamance et Bassin Arachidier; CIRAD: Montpellier, France, 2019. [Google Scholar]
- Mosleh, M.K.; Hassan, Q.K.; Chowdhury, E.H. Application of remote sensors in mapping rice area and forecasting its production: A review. Sensors 2015, 15, 769–791. [Google Scholar] [CrossRef] [PubMed]
- Dong, J.; Xiao, X. Evolution of regional to global paddy rice mapping methods: A review. ISPRS J. Photogramm. Remote Sens. 2016, 119, 214–227. [Google Scholar] [CrossRef]
- Kuenzer, C.; Knauer, K. Remote sensing of rice crop areas. Int. J. Remote Sens. 2013, 34, 2101–2139. [Google Scholar] [CrossRef]
- Turner, M.D.; Congalton, R.G. Classification of multi-temporal SPOT-XS satellite data for mapping rice fields on a West African floodplain. Int. J. Remote Sens. 1998, 19, 21–41. [Google Scholar] [CrossRef]
- Busetto, L.; Zwart, S.J.; Boschetti, M. Analysing spatial–temporal changes in rice cultivation practices in the Senegal River Valley using MODIS time-series and the PhenoRice algorithm. Int. J. Appl. Earth Obs. Geoinf. 2019, 75, 15–28. [Google Scholar] [CrossRef]
- Bouvet, A.; Le Toan, T. Use of ENVISAT/ASAR wide-swath data for timely rice fields mapping in the Mekong River Delta. Remote Sens. Environ. 2011, 115115, 1090–1101. [Google Scholar] [CrossRef]
- Stroppiana, D.; Boschetti, M.; Azar, R.; Barbieri, M.; Collivignarelli, F.; Gatti, L.; Fontanelli, G.; Busetto, L.; Holecz, F. In-season early mapping of rice area and flooding dynamics from optical and SAR satellite data. Eur. J. Remote Sens. 2019, 52, 206–220. [Google Scholar] [CrossRef]
- Breiman, L. Random Forest. Mach. Learn. 2001, 45, 5–32. [Google Scholar]
- Hao, P.; Zhan, Y.; Wang, L.; Niu, Z.; Shakir, M. Feature selection of time series MODIS data for early crop classification using random forest: A case study in Kansas, USA. Remote Sens. 2015, 7, 5347–5369. [Google Scholar] [CrossRef]
- Li, Q.; Wang, C.; Zhang, B.; Lu, L. Object-based crop classification with Landsat-MODIS enhanced time-series data. Remote Sens. 2015, 7, 16091–16107. [Google Scholar] [CrossRef]
- Novelli, A.; Aguilar, M.A.; Nemmaoui, A.; Aguilar, F.J.; Tarantino, E. Performance evaluation of object based greenhouse detection from Sentinel-2 MSI and Landsat 8 OLI data: A case study from Almería (Spain). Int. J. Appl. Earth Obs. Geoinf. 2016, 52, 403–411. [Google Scholar] [CrossRef]
- Pelletier, C.; Valero, S.; Inglada, J.; Champion, N.; Dedieu, G. Assessing the robustness of Random Forests to map land cover with high resolution satellite image time series over large areas. Remote Sens. Environ. 2016, 187, 156–168. [Google Scholar] [CrossRef]
- Jin, X.; Li, Z.; Yang, G.; Yang, H.; Feng, H.; Xu, X.; Wang, J.; Li, X.; Luo, J. Winter wheat yield estimation based on multi-source medium resolution optical and radar imaging data and the AquaCrop model using the particle swarm optimization algorithm. ISPRS J. Photogramm. Remote Sens. 2017, 126, 24–37. [Google Scholar] [CrossRef]
- Van Tricht, K.; Gobin, A.; Gilliams, S.; Piccard, I. Synergistic use of radar sentinel-1 and optical sentinel-2 imagery for crop mapping: A case study for Belgium. Remote Sens. 2018, 10, 1642. [Google Scholar] [CrossRef]
- Veloso, A.; Mermoz, S.; Bouvet, A.; le Toan, T.; Planells, M.; Dejoux, J.F.; Ceschia, E. Understanding the temporal behavior of crops using Sentinel-1 and Sentinel-2-like data for agricultural applications. Remote Sens. Environ. 2017, 199, 415–426. [Google Scholar] [CrossRef]
- Hakdaoui, S.; Emran, A.; Pradhan, B.; Lee, C.W.; Nguemhe Fils, S.C. A collaborative change detection approach on multi-sensor spatial imagery for desert wetland monitoring after a flash flood in southern Morocco. Remote Sens. 2019, 11, 1042. [Google Scholar] [CrossRef]
- Cai, Y.; Lin, H.; Zhang, M. Mapping paddy rice by the object-based random forest method using time series Sentinel-1/Sentinel-2 data. Adv. Space Res. 2019, 64, 2233–2244. [Google Scholar] [CrossRef]
- Manzelli, M.; Fiorillo, E.; Bacci, M.; Tarchiani, V. Lowland rice production in southern Senegal (Middle Casamance): Challenges and prospects for sustaining their restoration and development. Cahiers Agric. 2015, 24, 301–312. [Google Scholar] [CrossRef]
- Manzelli, M.; Seppoloni, I.; Zucchini, E.; Bacci, M.; Fiorillo, E.; Tarchiani, V. La riziculture traditionnelle de bas-fond en Moyenne Casamance dans un contexte de changements globaux: Enjeux et perspectives. In Eaux et Sociétés Face au Changement Climatique Dans le Bassin de la Casamance; L’Harmattan: Paris, France, 2015. [Google Scholar]
- Manzelli, M.; Bacci, M.; Fiorillo, E.; Tarchiani, V. Diagnostique de la Riziculture de Bas-fonds Dans la Région de Sédhiou. Available online: https://www.papsen.org/data/files/PAPSEN_2_VALLEES_0913.pdf (accessed on 5 June 2020).
- Muller-Wilm, U.; Louis, J.; Richter, R.; Gascon, F.; Niezette, M. Sentinel-2 level 2A prototype processor: Architecture, algorithms and first results. In Proceedings of the ESA Living Planet Symposium, Edinburgh, UK, 9–13 September 2013; pp. 9–13. [Google Scholar]
- Savitzky, A.; Golay, M.J. Smoothing and differentiation of data by simplified least squares procedures. Anal. Chem. 1964, 3636, 1627–1639. [Google Scholar] [CrossRef]
- Simard, M.; Riel, B.V.; Denbina, M.; Hensley, S. Radiometric correction of airborne radar images over forested terrain with topography. IEEE Trans. Geosci. Remote Sens. 2016, 54, 4488–4500. [Google Scholar] [CrossRef]
- Torbick, N.; Chowdhury, D.; Salas, W.; Qi, J. Monitoring Rice Agriculture across Myanmar Using Time Series Sentinel-1 Assisted by Landsat-8 and PALSAR-2. Remote Sens. 2017, 9, 119. [Google Scholar] [CrossRef]
- Murugan, D.; Singh, D. Development of an approach for monitoring sugarcane harvested and non-harvested conditions using time series Sentinel-1 data. In Proceedings of the IGARSS 2018–2018 IEEE International Geoscience and Remote Sensing Symposium, Valencia, Spain, 22–27 July 2018; IEEE: Piscataway, NJ, USA, 2018; pp. 5308–5311. [Google Scholar]
- Phung, H.P.; Nguyen, L.D.; Thong, N.H.; Thuy, L.T.; Apan, A.A. Monitoring rice growth status in the Mekong Delta, Vietnam using multitemporal Sentinel-1 data. J. Appl. Remote Sens. 2020, 14, 014518. [Google Scholar] [CrossRef]
- Rouse, J.W.; Haas, R.H.; Schell, J.A.; Deering, D.W.; Harlan, J.C. Monitoring the Vernal Advancements and Retrogradation (Green Wave Effect) of Natural Vegetation; Final Report; NASA/GSFC: Greenbelt, MD, USA, 1974; pp. 371–385. [Google Scholar]
- Xiao, X.; He, L.; Salas, W.; Li, C.; Moore Iii, B.; Zhao, R.; Frolking, S.; Boles, S. Quantitative relationships between field-measured leaf area index and vegetation index derived from VEGETATION images for paddy rice fields. Int. J. Remote Sens. 2002, 23, 3595–3604. [Google Scholar] [CrossRef]
- Guan, X.; Huang, C.; Liu, G.; Meng, X.; Liu, Q. Mapping rice cropping systems in Vietnam using an NDVI-based time-series similarity measurement based on DTW distance. Remote Sens. 2016, 8, 19. [Google Scholar] [CrossRef]
- Escadafal, R.; Bohbot, H.; Mégier, J. Changes in Arid Mediterranean Ecosystems on the Long Term through Earth Observation (CAMELEO); Final Report of EU contract IC18-CT97-0155; Space Applications Institute, JRC: Ispra, Italy, 2001. [Google Scholar]
- Maselli, F.; Barbati, A.; Chiesi, M.; Chirici, G.; Corona, P. Use of remotely sensed and ancillary data for estimating forest gross primary productivity in Italy. Remote Sens. Environ. 2006, 100, 563–575. [Google Scholar] [CrossRef]
- Belgiu, M.; Csillik, O. Sentinel-2 cropland mapping using pixel-based and object-based time-weighted dynamic time warping analysis. Remote Sens. Environ. 2018, 204, 509–523. [Google Scholar] [CrossRef]
- Torbick, N.; Huang, X.; Ziniti, B.; Johnson, D.; Masek, J.; Reba, M. Fusion of moderate resolution earth observations for operational crop type mapping. Remote Sens. 2018, 10, 1058. [Google Scholar] [CrossRef]
- Son, N.T.; Chen, C.F.; Chen, C.R.; Minh, V.Q. Assessment of Sentinel-1A data for rice crop classification using random forests and support vector machines. Geocarto Int. 2018, 33, 587–601. [Google Scholar] [CrossRef]
- Hastie, T.; Tibshirani, R.; Friedman, J. The Elements of Statistical Learning: Data Mining, Inference, and Prediction; Springer Science: Berlin/Heidelberg, Germany; Business Media: Berlin/Heidelberg, Germany, 2009. [Google Scholar]
- Ghazaryan, G.; Dubovyk, O.; Löw, F.; Lavreniuk, M.; Kolotii, A.; Schellberg, J.; Kussul, N. A rulebased approach for crop identification using multi-temporal and multi-sensor phenological metrics. Eur. J. Remote Sens. 2018, 51, 511–524. [Google Scholar] [CrossRef]
- Lu, D. The potential and challenge of remote sensing-based biomass estimation. Int. J. Remote Sens. 2006, 27, 1297–1328. [Google Scholar] [CrossRef]
- Deng, H.; Runger, G. Gene selection with guided regularized random forest. Pattern Recognit. 2012, 46, 3483–3489. [Google Scholar] [CrossRef]
- Izquierdo-Verdiguier, E.; Zurita-Milla, R.; Rolf, A. On the use of guided regularized random forests to identify crops in smallholder farm fields. In Proceedings of the 2017 9th International Workshop on the Analysis of Multitemporal Remote Sensing Images 9th International Workshop on the Analysis of Multitemporal Remote Sensing Images (MultiTemp), Bruges, Belgium, 27–29 June 2017; pp. 1–3. [Google Scholar] [CrossRef]
- Izquierdo-Verdiguier, E.; Zurita-Milla, R. Use of guided regularized random forest for biophysical parameter retrieval. In Proceedings of the IGARSS 2018–2018 IEEE International Geoscience and Remote Sensing Symposium, Valencia, Spain, 22–27 July 2018; IEEE: Piscataway, NJ, USA, 2018; pp. 5776–5779. [Google Scholar]
- Sánchez-Ruiz, S.; Moreno-Martínez, Á.; Izquierdo-Verdiguier, E.; Chiesi, M.; Maselli, F.; Gilabert, M.A. Growing stock volume from multi-temporal landsat imagery through google earth engine. Int. J. Appl. Earth Obs. Geoinf. 2019, 83, 101913. [Google Scholar] [CrossRef]
- Millard, K.; Richardson, M. On the importance of training data sample selection in random forest image classification: A case study in peatland ecosystem mapping. Remote Sens. 2015, 7, 8489. [Google Scholar] [CrossRef]
- Cohen, J. A coefficient of agreement for nominal scales. Educ. Psychol. Meas. 1960, 20, 37–46. [Google Scholar] [CrossRef]
- Samasse, K.; Hanan, N.P.; Anchang, J.Y.; Diallo, Y. A high-resolution cropland map for the West African Sahel based on high-density training data, Google Earth Engine, and locally optimized machine learning. Remote Sens. 2020, 12, 1436. [Google Scholar] [CrossRef]
- Xiao, X.; Boles, S.; Liu, J.; Zhuang, D.; Frolking, S.; Li, C.; Salas, W.; Moore III, B. Mapping paddy rice agriculture in southern China using multi-temporal MODIS images. Remote Sens. Environ. 2005, 95, 480–492. [Google Scholar] [CrossRef]
- Xiao, X.; Boles, S.; Frolking, S.; Li, C.; Babu, J.Y.; Salas, W.; Moore III, B. Mapping paddy rice agriculture in South and Southeast Asia using multi-temporal MODIS images. Remote Sens. Environ. 2006, 100, 95–113. [Google Scholar] [CrossRef]
- Boschetti, M.; Busetto, L.; Manfron, G.; Laborte, A.; Asilo, S.; Pazhanivelan, S.; Nelson, A. PhenoRice: A method for automatic extraction of spatio-temporal information on rice crops using satellite data time series. Remote Sens. Environ. 2017, 194, 347–365. [Google Scholar] [CrossRef]
- Yang, C.M.; Cheng, C.H. Spectral characteristics of rice plants infested by brown planthoppers. Proc. Natl. Sci. Counc. Repub. China. B 2001, 25, 180–186. [Google Scholar] [PubMed]
- Yang, C.M.; Cheng, C.H.; Chen, R.K. Changes in spectral characteristics of rice canopy infested with Brown Planthopper and Leaffolder. Crop Sci. 2007, 47, 329–335. [Google Scholar] [CrossRef]
- Nguyen, D.B.; Wagner, W. European rice cropland mapping with Sentinel-1 data: The mediterranean region case study. Water 2017, 9, 392. [Google Scholar] [CrossRef]
Publisher’s Note: MDPI stays neutral with regard to jurisdictional claims in published maps and institutional affiliations. |
© 2020 by the authors. Licensee MDPI, Basel, Switzerland. This article is an open access article distributed under the terms and conditions of the Creative Commons Attribution (CC BY) license (http://creativecommons.org/licenses/by/4.0/).