Article

Assessment of the Accuracy of the Saastamoinen Model and VMF1/VMF3 Mapping Functions with Respect to Ray-Tracing from Radiosonde Data in the Framework of GNSS Meteorology

1
State Key Laboratory of Engineering in Surveying, Mapping and Remote Sensing, Wuhan University, 129 Luoyu Road, Wuhan 430079, China
2
Geodesy Observatory of Tahiti, University of French Polynesia, BP6570, Faa’a 98702, French Polynesia
*
Author to whom correspondence should be addressed.
Remote Sens. 2020, 12(20), 3337; https://doi.org/10.3390/rs12203337
Submission received: 29 August 2020 / Revised: 4 October 2020 / Accepted: 9 October 2020 / Published: 13 October 2020
(This article belongs to the Section Atmospheric Remote Sensing)

Abstract

:
In this paper, we assess, in the framework of Global Navigation Satellite System (GNSS) meteorology, the accuracy of GNSS propagation delays corresponding to the Saastamoinen zenith hydrostatic delay (ZHD) model and the Vienna Mapping function VMF1/VMF3 (hydrostatic and wet), with reference to radiosonde ray-tracing delays over a three-year period on 28 globally distributed sites. The results show that the Saastamoinen ZHD estimates have a mean root mean square (RMS) error of 1.7 mm with respect to the radiosonde. We also detected some seasonal signatures in these Saastamoinen ZHD estimates. This indicates that the Saastamoinen model, based on the hydrostatic assumption and the ground pressure, is insufficient to capture the full variability of the ZHD estimates over time with the accuracy needed for GNSS meteorology. Furthermore, we found that VMF3 slant hydrostatic delay (SHD) estimates outperform the corresponding VMF1 SHD estimates (equivalent SHD RMS error of 4.8 mm for VMF3 versus 7.1 mm for VMF1 at 5° elevation angle), with respect to the radiosonde SHD estimates. Unexpectedly, the situation is opposite for the VMF3 slant wet delay (SWD) estimates compared to VMF1 SWD estimates (equivalent SWD RMS error of 11.4 mm for VMF3 versus 7.0 mm for VMF1 at 5° elevation angle). Our general conclusion is that the joint approach using ZHD models and mapping functions must be revisited, at least in the framework of GNSS meteorology.

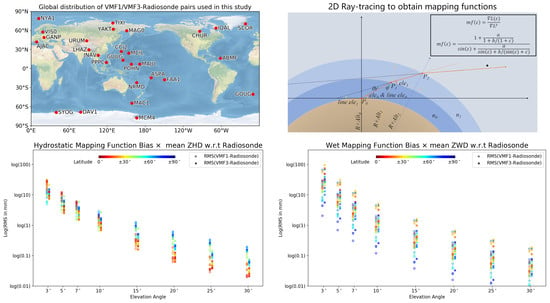
Graphical Abstract

1. Introduction

GNSS meteorology has become a very important part of GNSS studies, not only to improve positioning but also as a source of constraints for meteorological and climate models. The most important output of GNSS meteorology is the amount of water vapor contained in the atmosphere. This implies the separation between total propagation delays and the so-called hydrostatic (improperly called “dry”) delays. Total delays are provided by measured phase delays between the GNSS satellite and the ground station receiver. The hydrostatic delays must be provided by an external model. In this paper, we analyze these two facets of the water vapor modeling with respect to the latest developments for the modeling of total and dry delays.
Tropospheric propagation delay error models used in GNSS data processing [1,2] can be written as:
Δ L = Δ L h z · m f h ( ε ) + Δ L w z · m f w ( ε ) + δ
where Δ L is the slant total delay (STD), Δ L h z and Δ L w z are respectively the zenith hydrostatic delay (ZHD) and the zenith wet delay (ZWD), m f h ( ε ) and m f w ( ε ) are the corresponding mapping functions (MF), and ε is the elevation angle. δ represents higher-order terms such as horizontal gradients, which are not included in this study. Saastamoinen model [3], revised by Davis [4], shows that the ZHD can be calculated from air pressure as:
Δ L h z = 0.0022768 · P 0 ( 1 0.00266 · c o s ( 2 φ ) 0.28 × 10 6 · h )
where P 0 is the pressure measured at the antenna site in hPa, φ is the latitude, and h is the altitude of the antenna in meter. The hydrostatic part contributes more than 90% of the signal delay in most cases. Other ZHD models exist: the Hopfield model [5] and the Black model [6]. The Saastamoinen ZHD model is believed to be the most accurate and usable one [7,8]. Theoretical models for the ZWD are not accurate enough due to the large variability of the water vapor content of the atmosphere.
By definition, a mapping function (MF) is the ratio between (bent) slant and zenith delays, for both hydrostatic and wet cases. Mapping functions were first formally adopted for Very Long Baseline Interferometry (VLBI) data analysis [9,10] in the form of a continued fraction, which is now in widely use:
m f ( ε ) = 1 + a 1 + b / ( 1 + c ) s i n ( ε ) + a s i n ( ε ) + b / ( s i n ( ε ) + c )
where ε stands for the elevation angle, and a , b , and c are parameters determined from atmospheric conditions and specialized for the hydrostatic (ah, bh, ch) and wet (aw, bw, cw) mapping functions. For nearly two decades, the VMF1 mapping functions were (and still are) regarded as the most accurate mapping functions, and their use is recommended by the International Earth Rotation and Reference Systems Service [11] for high accuracy geodesy applications. The VMF1 uses the ECMWF Re-Analysis 40-years (ERA-40) meteorological model [12] from the European Centre for Medium-Range Weather Forecasts (ECMWF) as input for ray-tracing. Every six hours, at a specific set of stations of the International GNSS Service (IGS) and the International VLBI Service (IVS) as well as on a global grid, the first and most significant MF coefficients, a h and a w , are provided in a text file available at https://vmf.geo.tuwien.ac.at/trop_products/GNSS/VMF1/. Other parameters are either kept constant ( b h , b w , c w ) or provided in a formula ( c h ) with variable time and latitudes [13].
The Vienna mapping function VMF3 was released by Landskron and Böhm [14] and is built upon the ECMWF ERA-Interim products [15], with the goal to be more accurate, especially at low elevation angles. To avoid the VMF1 shortcomings of using simple empirical coefficients b and c , and the tuning at a specific elevation angle of 3°, the coefficients b and c for the VMF3 mapping function are still empirical but expand along a worldwide spherical harmonic basis with a maximum degree and order of 12, and the least-squares fitting of the coefficient a is done for seven elevation angles (3°, 5°, 7°, 10°, 15°, 30°, 70°). Similar to VMF1, VMF3 products are also provided both in grid version and site-tailored version [16]. We adopted the site-tailored VMF1 and VMF3 products for this comparison work to avoid doing any in-house interpolation (see Table 1). It should be noted that the format of the 6 h updated VMF3 products is the same as that of the corresponding VMF1 products (https://vmf.geo.tuwien.ac.at/trop_products/GNSS/VMF3/), but the end-user software code is different. In this study, we used the end-user Fortran code provided from the aforementioned website.
The Saastamoinen model has been used for a long time, and some studies claim that the Saastamoinen ZHD model has sub-millimeter accuracy if proper pressure measurements are made [8,17,18,19]. The VMF3 mapping function is new, and its accuracy is not yet fully tested. A preliminary evaluation showed that the VMF3 improvements have little impact on GNSS positioning, with estimated station height changing at a merely 0.25 mm level [14]. Similar studies have been done to assess the accuracy of other mapping functions by comparison with ray-tracing results [20,21,22,23]. Qiu et al. [23] showed that VMF1 corresponds to the ERA-I numerical weather model better than the Niell Mapping Function [24] and the Global Mapping Function [25] at low elevation angles. Other studies rely on positioning or baseline length accuracies [16,26]. For example, Kouba [16] showed that the daily repeatability of GPS coordinate solutions using VMF1-grid and VMF1-sites is nearly identical.
In this study, we make comparisons between modeled propagation delays from VMF1 and VMF3 mapping functions with reference to ray-tracing slant delays from radiosonde data. The Saastamoinen ZHD estimates are also compared with the radiosonde ZHDs by vertical column integration. In Section 2.1 and Section 2.2, we introduce the radiosonde data and our data selection and preprocessing. The atmospheric refractivity model and the ray-tracing method used to calculate the mapping function from radiosonde data are explained in Section 2.3. Assessment results are provided in Section 3 (Saastamoinen model) and Section 4 (VMF1/VMF3 mapping functions). In Section 5, we give a summary and discussion of these results.

2. Data and Methodology

2.1. Radiosonde Data

The Integrated Global Radiosonde Archive (IGRA) is maintained by the National Oceanic and Atmospheric Administration (NOAA) and consists of radiosonde observations over 2700 globally distributed stations since 1905 [27,28]. IGRA products include pressure, temperature, geopotential height, relative humidity, dew point temperature, wind direction and speed, and elapsed time since launch, until the balloon blows up under overpressure of its envelope at around 25,000–30,000 m altitude. The radiosonde technique is highly accurate for observations of the troposphere with a 1–2 hPa accuracy for pressure, 0.5 °C accuracy for temperature, and 5% accuracy for relative humidity [29,30]. We chose radiosonde stations that have nearby VMF tailored-sites (<6 km) and that achieved data completeness better than 70% during 2016–2018. Additionally, the station altitudes needed to be lower than the nearby VMF sites. We assumed that, within 6 km, the state of the atmosphere is almost constant. With such criteria, we found 32 available stations, and four of them were removed due to inconsistencies between ground meteorological station data and balloon data. The distribution and the detailed locations of all the 28 stations are shown in Figure 1 and summarized in Table 2, together with the nearby VMF stations used for comparison. The orthometric heights of VMF stations were obtained by subtracting Earth Gravitational Model 2008 (EGM2008) [31] geoid undulation from the ellipsoidal height. Since the 10-digit code used as the radiosonde marker is inconvenient, we refer to the sites by the capital four digital name of the corresponding VMF/IGS station.
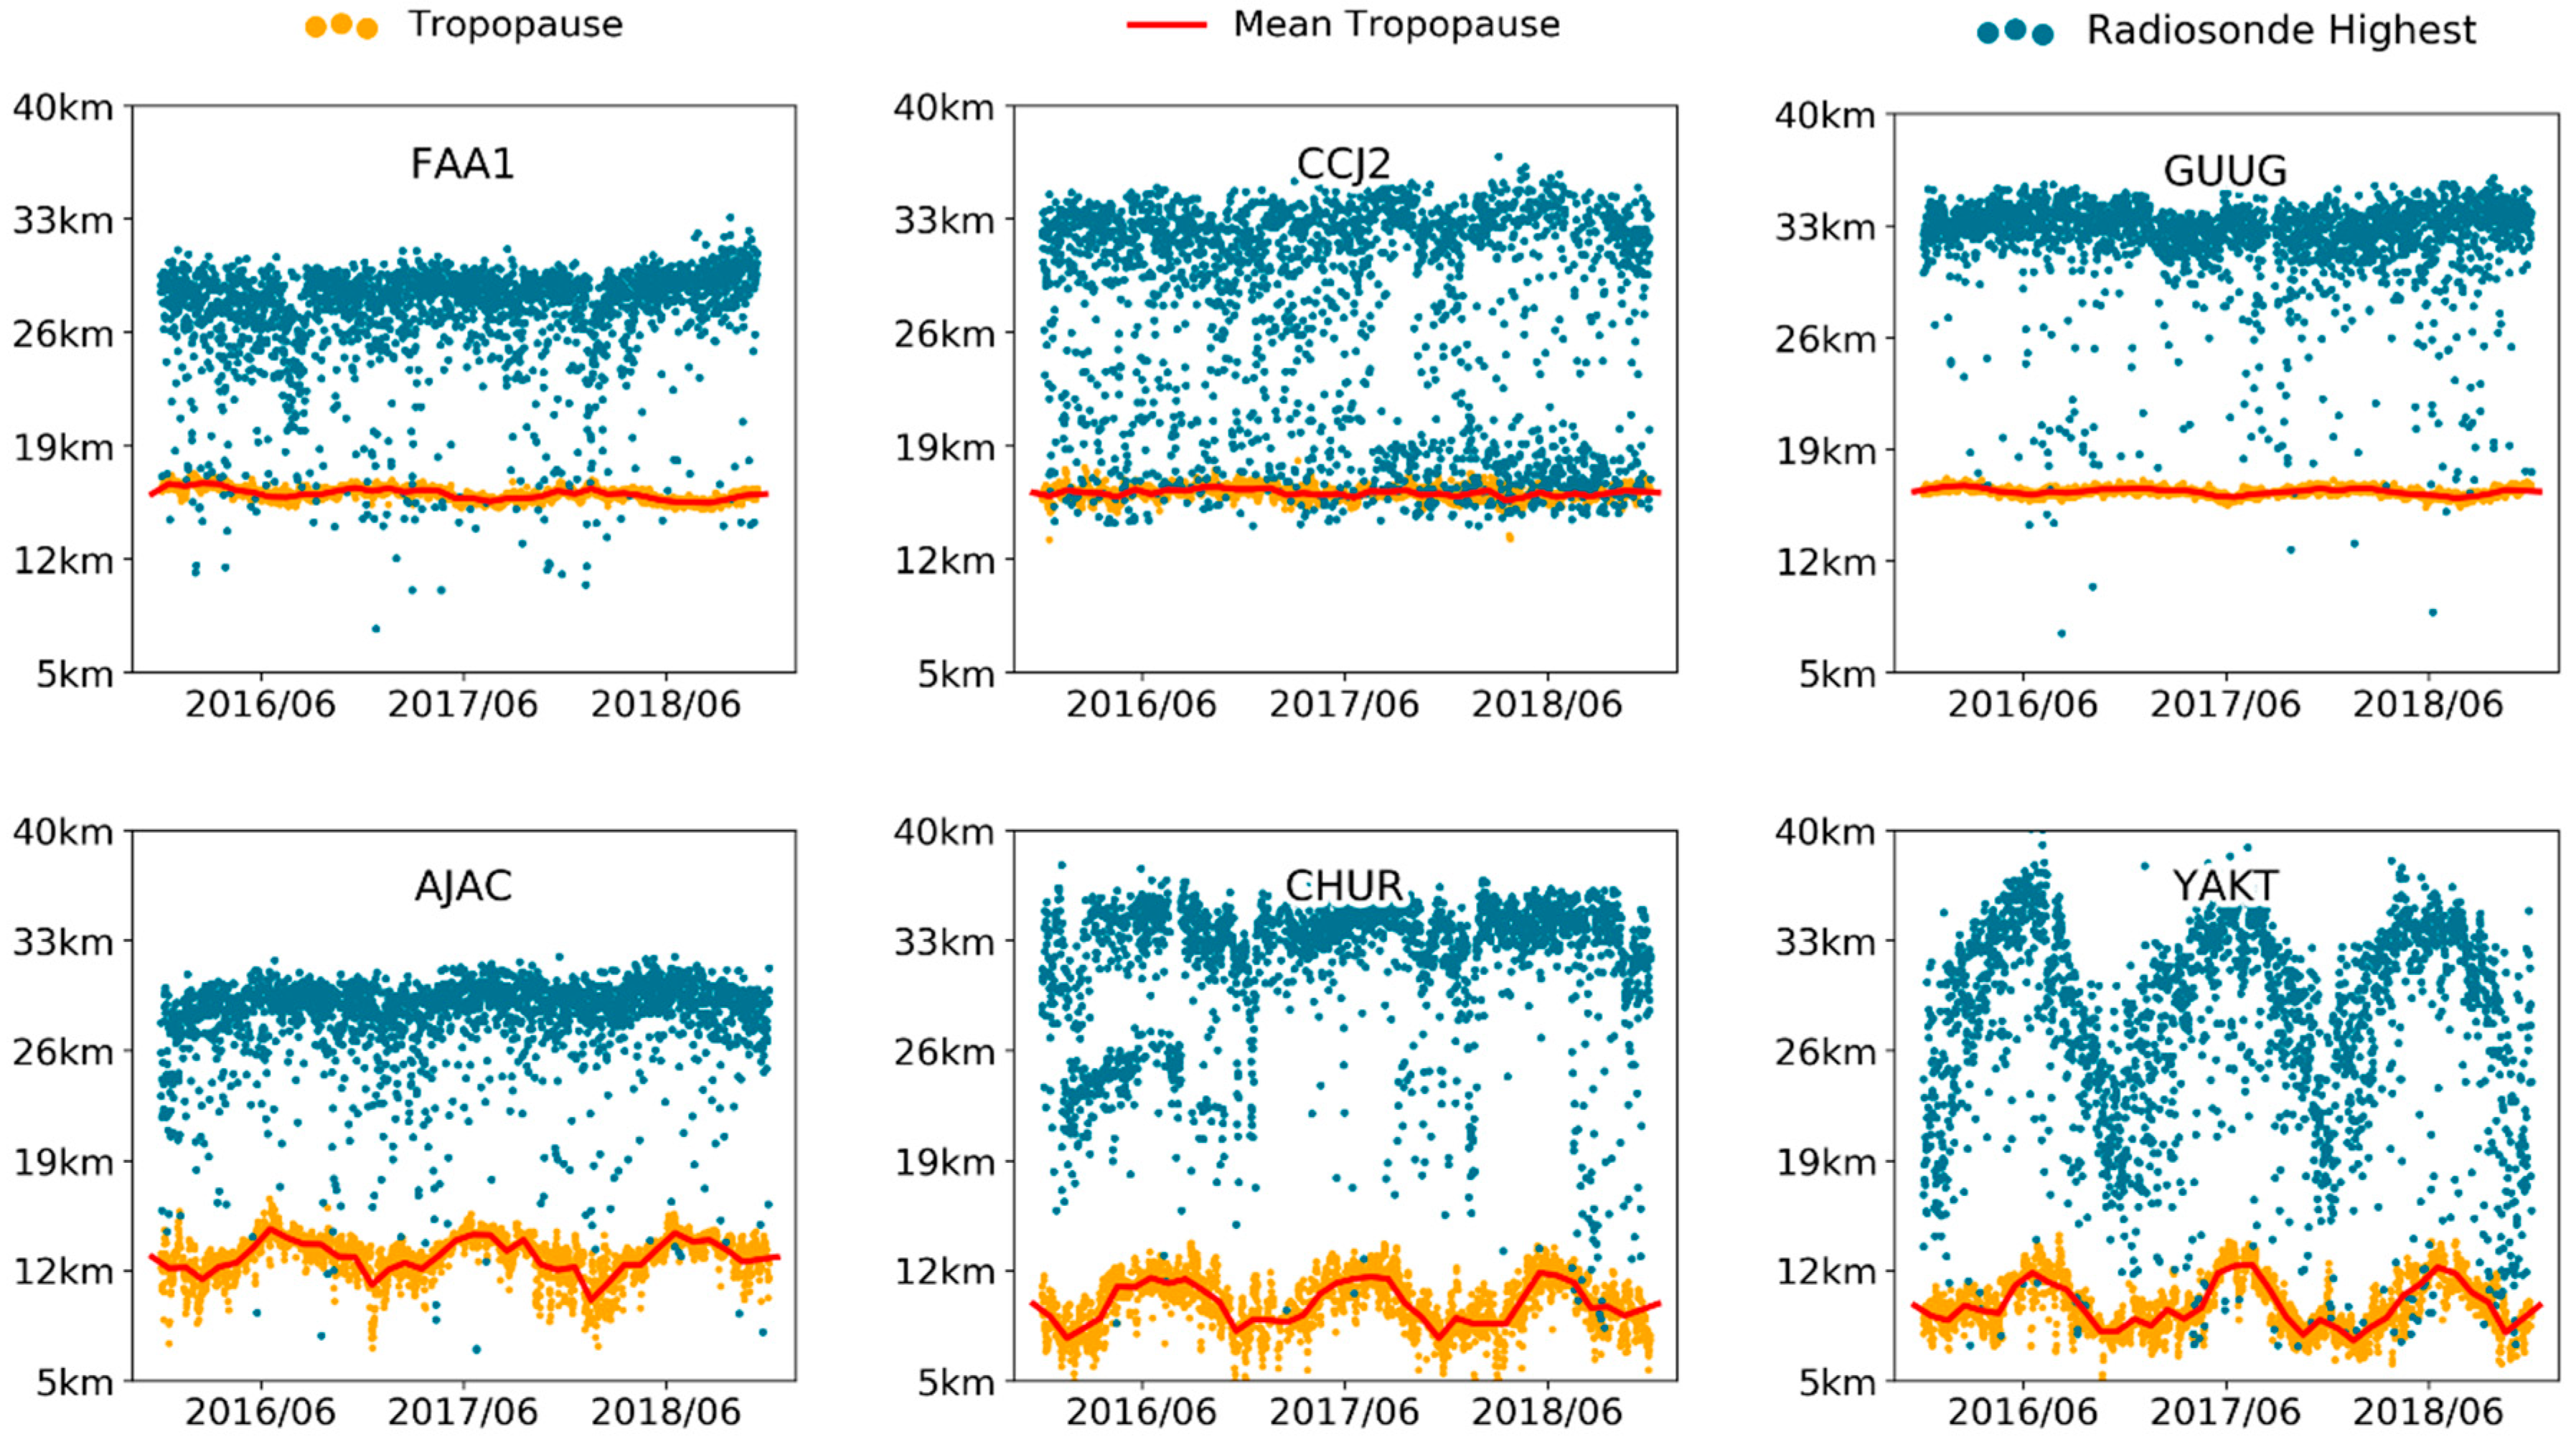
We considered in this study that all the water vapor is concentrated in the troposphere [32]. The World Meteorological Organization (WMO) defines the tropopause as the geopotential altitude higher than 500 hPa where the temperature lapse rate with altitude is kept smaller than 2 °C/km for at least 2 km. As the tropopause is not a sharp boundary, we defined it as the lowest altitude corresponding to the change of temperature lapse rate. Mendes [7] found that variation of tropopause height mainly depends on latitudes and seasons. Thereafter, all the daily tropopause height estimates for each station were smoothed with a monthly window to define a mean tropopause height estimate (Figure 2), and we did not consider the radiosonde data records that ended before reaching this threshold. The corresponding data rejection rate is summarized in Table 3.

2.2. Data Interpolation and Extension

The altitude records of the IGRA radiosonde products are reported in units of scaled geopotential (geopotential height) above mean sea level (MSL). For ray-tracing, we needed geometrical units. Hence, firstly, we converted geopotential heights to orthometric heights [33,34]. The data point records from the IGRA archive are unevenly distributed in altitude for data compression purposes, and only “characteristic points”, where large variations occur, are stored. For ray-tracing purposes, a sub-interpolation was necessary. As pressure follows closely an exponential decay with altitude, we used a linear interpolation of its logarithm, the same for vapor pressure, and a direct linear interpolation for temperature. We selected a 10 m interpolation step below 12 km altitude and 50 m thereafter. Based on former studies and experiments [35,36], these interpolation steps were small enough to assure a millimeter accuracy of ray-tracing of propagation delays at 3° elevation angle on the Earth atmosphere.
For obtaining the neutral atmosphere delay by ray-tracing, we needed the refractivity up to 100 km altitude [36]. We therefore supplemented balloon data with an atmosphere model. There are two commonly used standard atmosphere models. The first one is the US 1976 [37] standard atmosphere (referred to as ISA76), and the other is the COSPAR International Reference Atmosphere 1986 [38], referred to as CIRA86. Both ISA76 and CIRA86 give total pressure and temperature of a “standard” dry atmosphere for different altitudes. The differences are that the CIRA86 model takes latitude and monthly variation into account, while the ISA76 model takes only altitude into account, disregarding location and time of the year. Here, we used the ISA76 model for simplicity and consistency with the VMF mapping functions that also employ this model.

2.3. Refractivity and Ray-Tracing

The GNSS troposphere delay Δ L with respect to vacuum propagation can be written as [39]:
Δ L = L [ n ( s ) 1 ] d s + [ S G ]
where n ( s ) is the index of refraction along the curved ray path L , S is the length of the curved path between the receiver and the satellite, and G is the corresponding straight-line length. The integral part of the Equation (4) is the slowdown of the radio signals by the atmosphere, which is named as the direct delay effect. The second part [ S G ] corresponds to the extra delay caused by the bending of the ray and is of second-order compared to the direct delay effect. It contributes to about 1–2% in Equation (4) for low elevation angles. For a normal atmosphere, the excess total delay is about 2.3 m in the zenith direction and follows a nearly 1/sin( ε ) dependency.
For the Earth atmosphere, all constituents are either well-mixed or too few in quantitative terms to be considered in detail for the computation of the refractivity, except for the important case of water vapor. The atmosphere refractivity for radio signal up to 30 GHz can be written as [40,41,42]:
N r = K 1 P d T + K 2 P w T + K 3 P w T 2
where refractivity N r is defined as 106(n − 1), and n is the index of refraction. The unit of N r is the so-called N-units. P d is the dry pressure, and P w is the water vapor pressure, both in hPa, and T is the temperature in Kelvin. Rüeger [41] revised many previous studies [40,43] and gave, as the latest values, K 1 = 77.6890 (K/hPa), K 2 = 71.2952 (K/hPa), and K 3 = 375463 ( K 2 /hPa), respectively. The standard value for N r calculated on Earth surface is about 300 N units, and the accuracy of the Formula (5) is claimed to be better than 0.1% [42].
We computed N r from Equation (5) by using radiosonde data extrapolated up to the 100 km altitude with the standard atmosphere ISA76. The standard 2D ray-tracing method [35,44,45], similar to VMF1/VMF3 [14,44], was used to obtain signal delays in elevation angles of (90°, 30°, 25°, 20°, 15°, 10°, 7°, 5°, 3°), and the key elements of the algorithm are listed in Table 4. Hydrostatic and wet mapping functions were derived by applying the definition:
m f ( ε ) = Δ L ( ε ) Δ L z
where Δ L z is the delay in zenith, and Δ L ( ε ) is the delay for any given elevation angle ε , for both hydrostatic and wet delays.

3. Results: ZHD Comparison

3.1. Accuracy of Saastamoinen ZHD Model

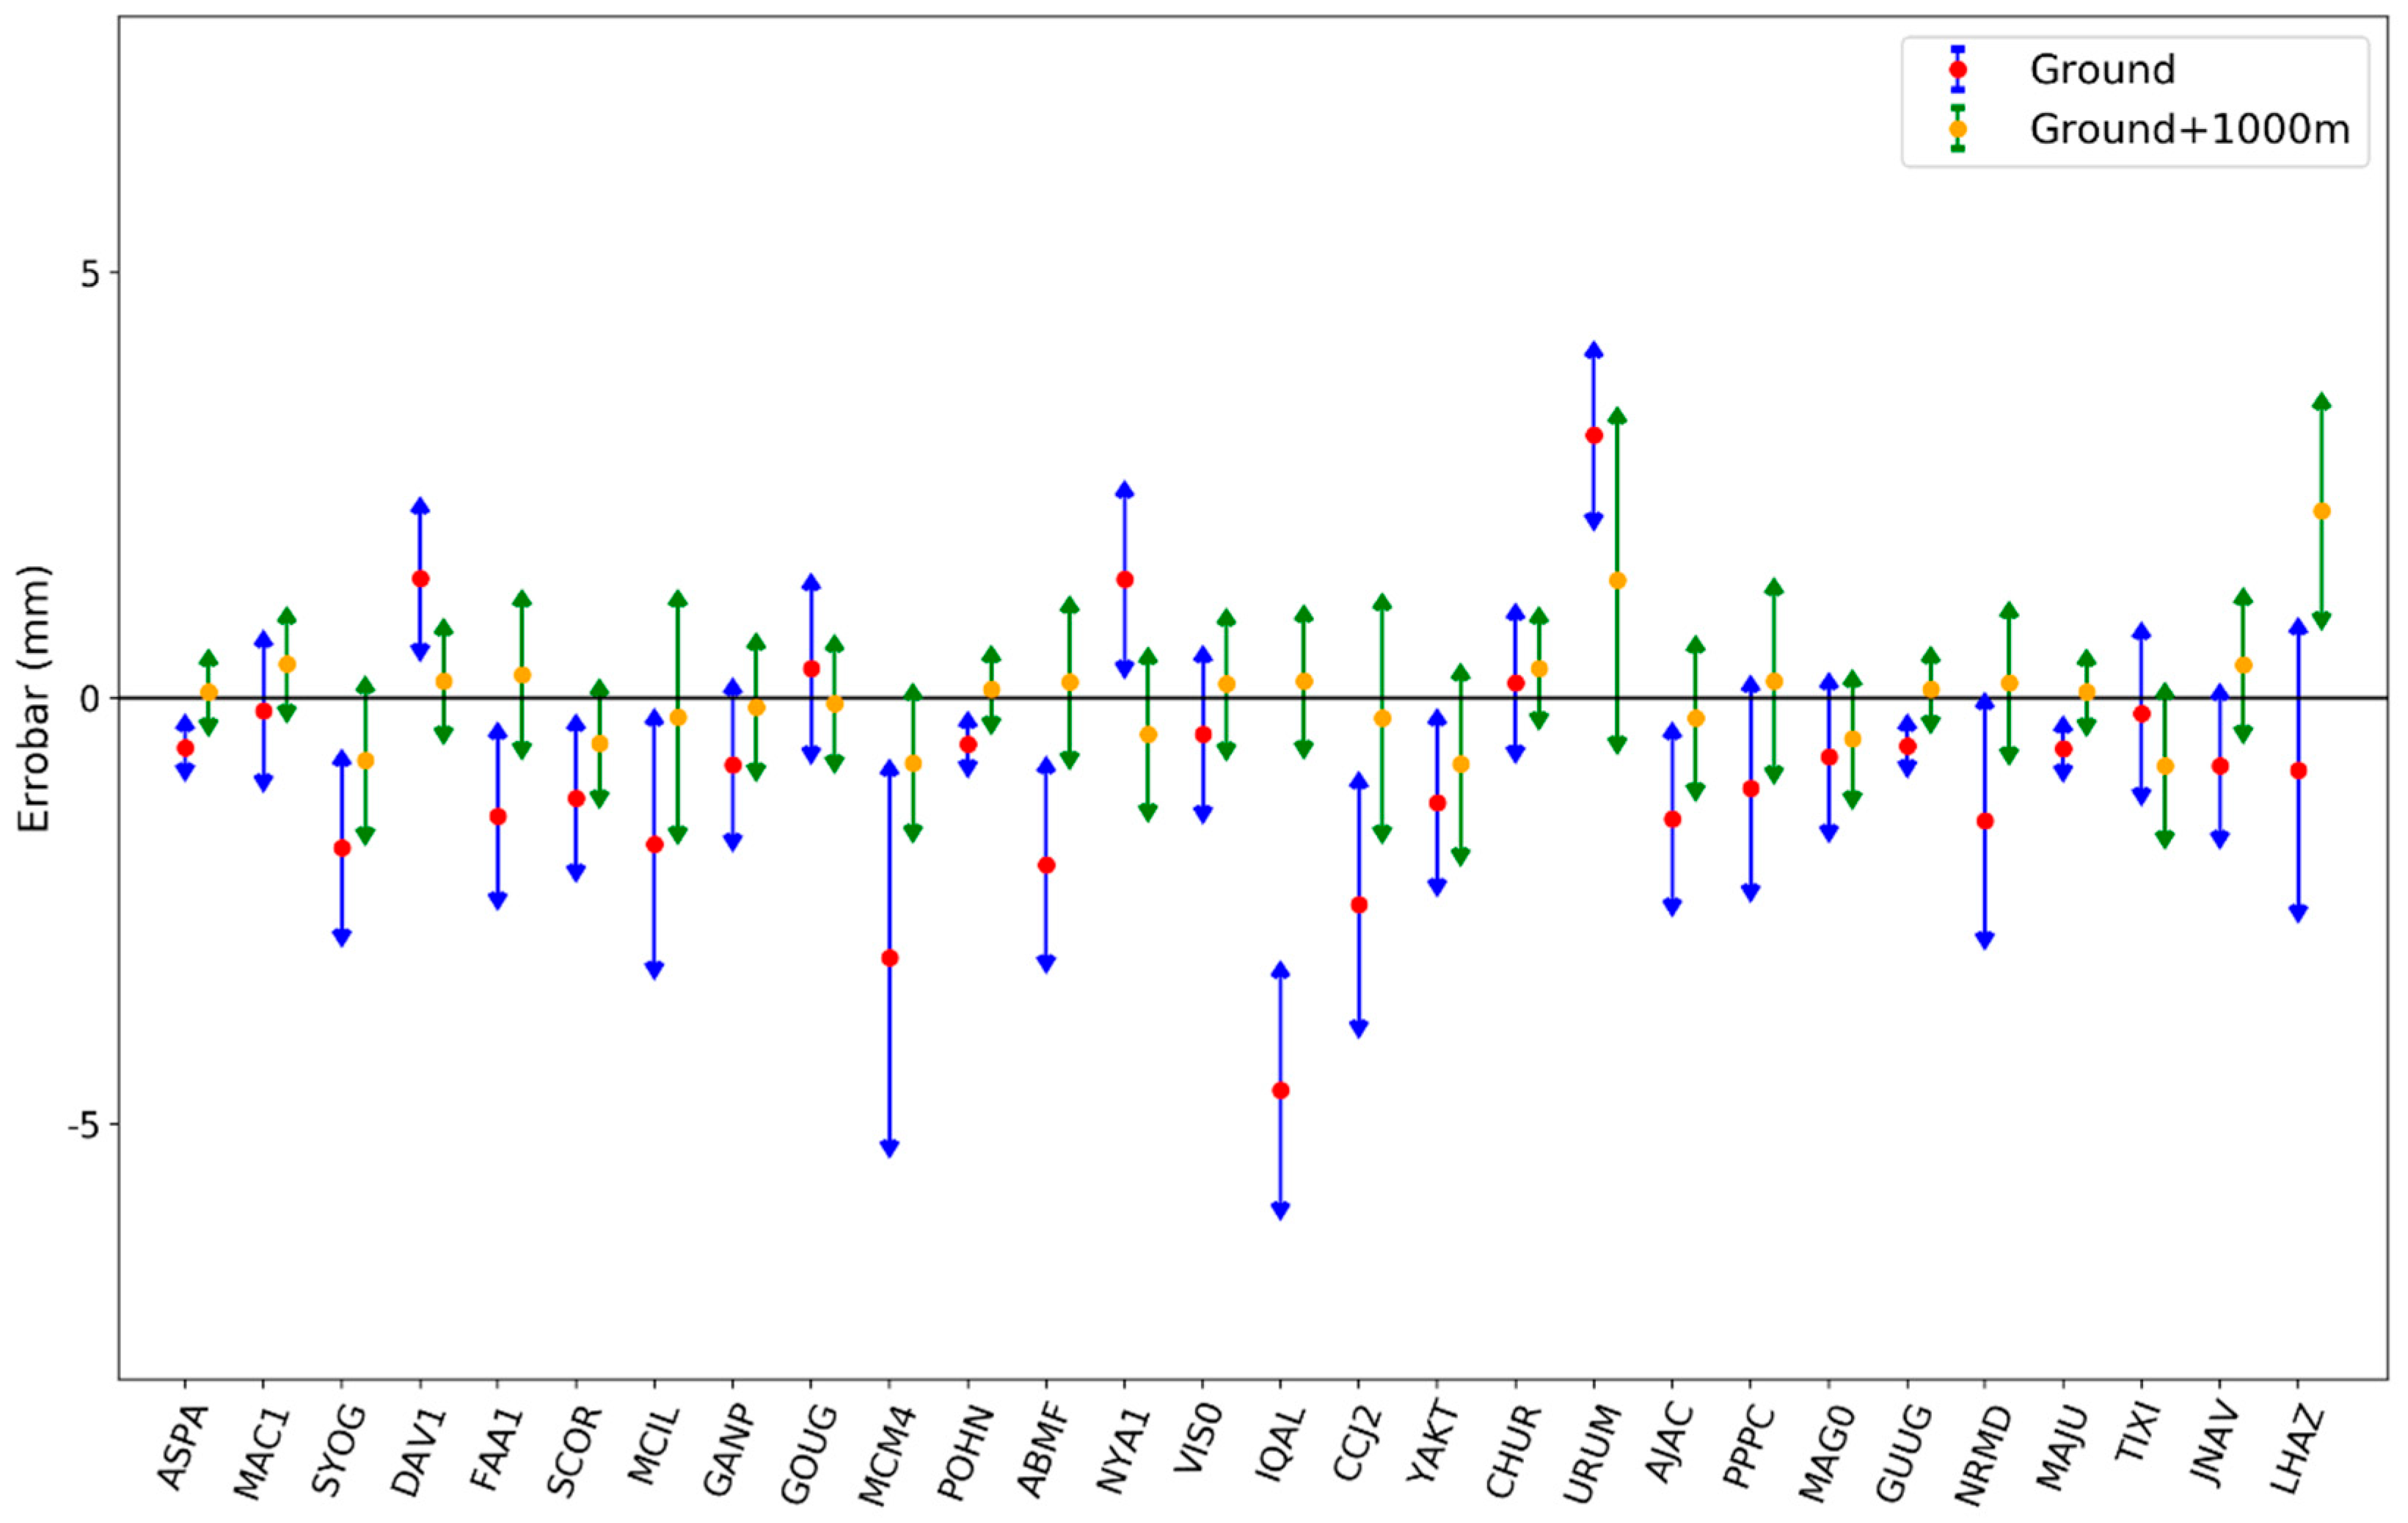
Figure 3 gives the biases and the error bars of Saastamoinen ZHD estimates with respect to o radiosonde integrated ZHD estimates for two different altitudes starting the vertical integration of refractivity: ground and ground + 1000 m altitude (the Saastamoinen formula was evaluated at these two altitudes). We used the pressures recorded by the balloon during its ascent to feed the Saastamoinen model. We found that, at ground level, probably due to turbulence (boundary layer), the balloon pressure measurements were less representative of the “true” mean surface pressure and thus they induced errors in the ZHD estimates of the Saastamoinen model. When we considered a ground + 1000 m starting point, these biases largely disappeared. The root mean square (RMS) of biases between the Saastamoinen ZHD estimates over the radiosonde ZHD estimates was 1.7 mm with integration starting at ground level and 0.92 mm with integration starting at ground level + 1000 m.
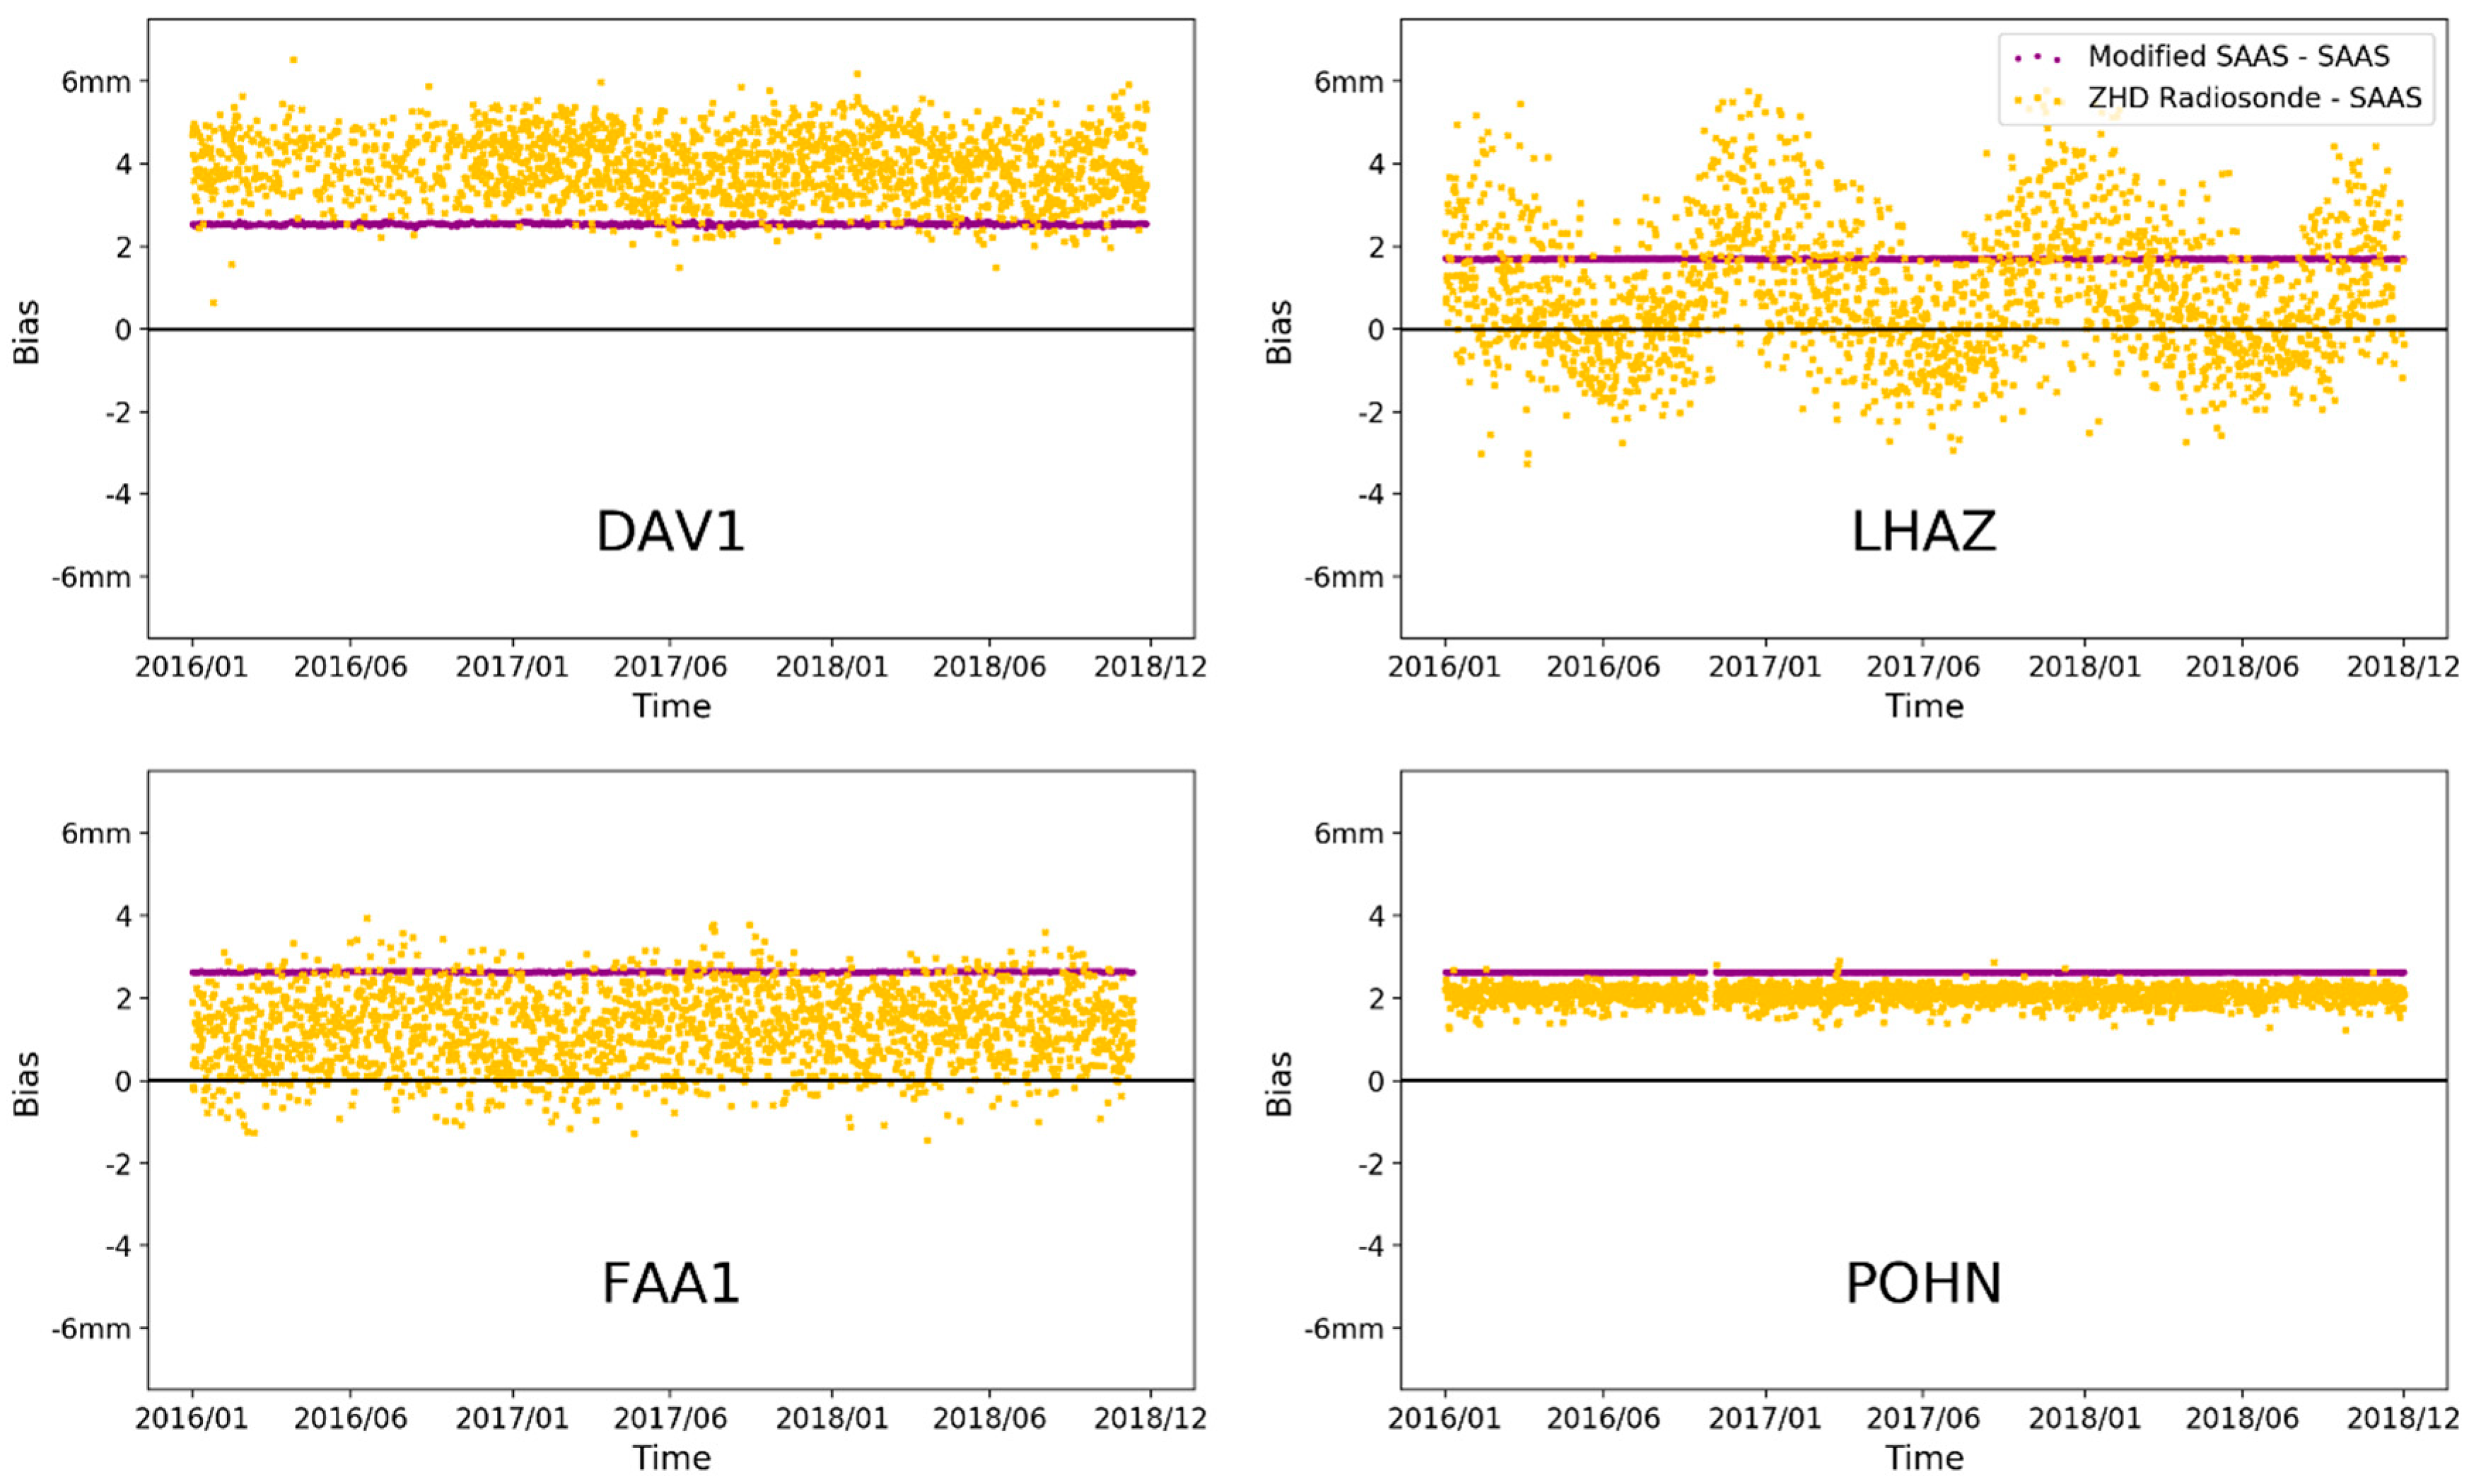
The constant numerator value of 0.0022768 in Equation (2), given by Saastamoinen (see also [46]), is based on a formula for atmosphere refractivity derived by Thayer [41]. However, Rüeger [42] pointed out that the Thayer formula was derived for optical wavelengths. Zhang et al. [19] studied this point and scaled up the numerator parameter in the original Saastamoinen model from 0.0022768 to 0.0022794, taking into account the updated refractivity formula from Rüeger, as shown in Equation (5). An error bar of 0.0000005 was given by Davis [4] for the Saastamoinen value of 0.0022768. Following the same idea, we can deduce the uncertainty of the updated constant numerator suggested by Zhang et al. [19] from the uncertainties of K 1 in Equation (5) [47], the molar mass of dry air, and the mean gravity in the air column [4]. This uncertainty is 0.0000003 with respect to 0.0022794. The difference between Zhang et al. [19] and Saastamoinen values is 0.0000026, more than five times the error bar given by Davis and eight times the error bar of the updated constant numerator. One can see in Figure 4 that the scaled-up value induces a nearly constant positive bias of 2.6 mm w.r.t to the original value. This is already several times larger than the claimed sub-millimeter accuracy of the original formula [8,17,18,19]. Figure 4 also displays the deviation of ray-traced ZHD over the Saastamoinen model, which can be regarded as a realistic accuracy of the Saastamoinen model. This 2.6 mm bias is of the similar magnitude of the Saastamoinen model error, thus it is not neglectable. Systematic biases in the ZHD model can lead to wrong precipitation water vapor (PWV) estimation in GNSS meteorology applications; 2.6 mm of ZWD corresponds to 0.4 mm of PWV error (total accuracy of GNSS PWV needs to be <2 mm to make a difference [48]). In Figure 3, we used the updated parameter from Zhang et al. [19].

3.2. Seasonal Bias in the Saastamoinen ZHD

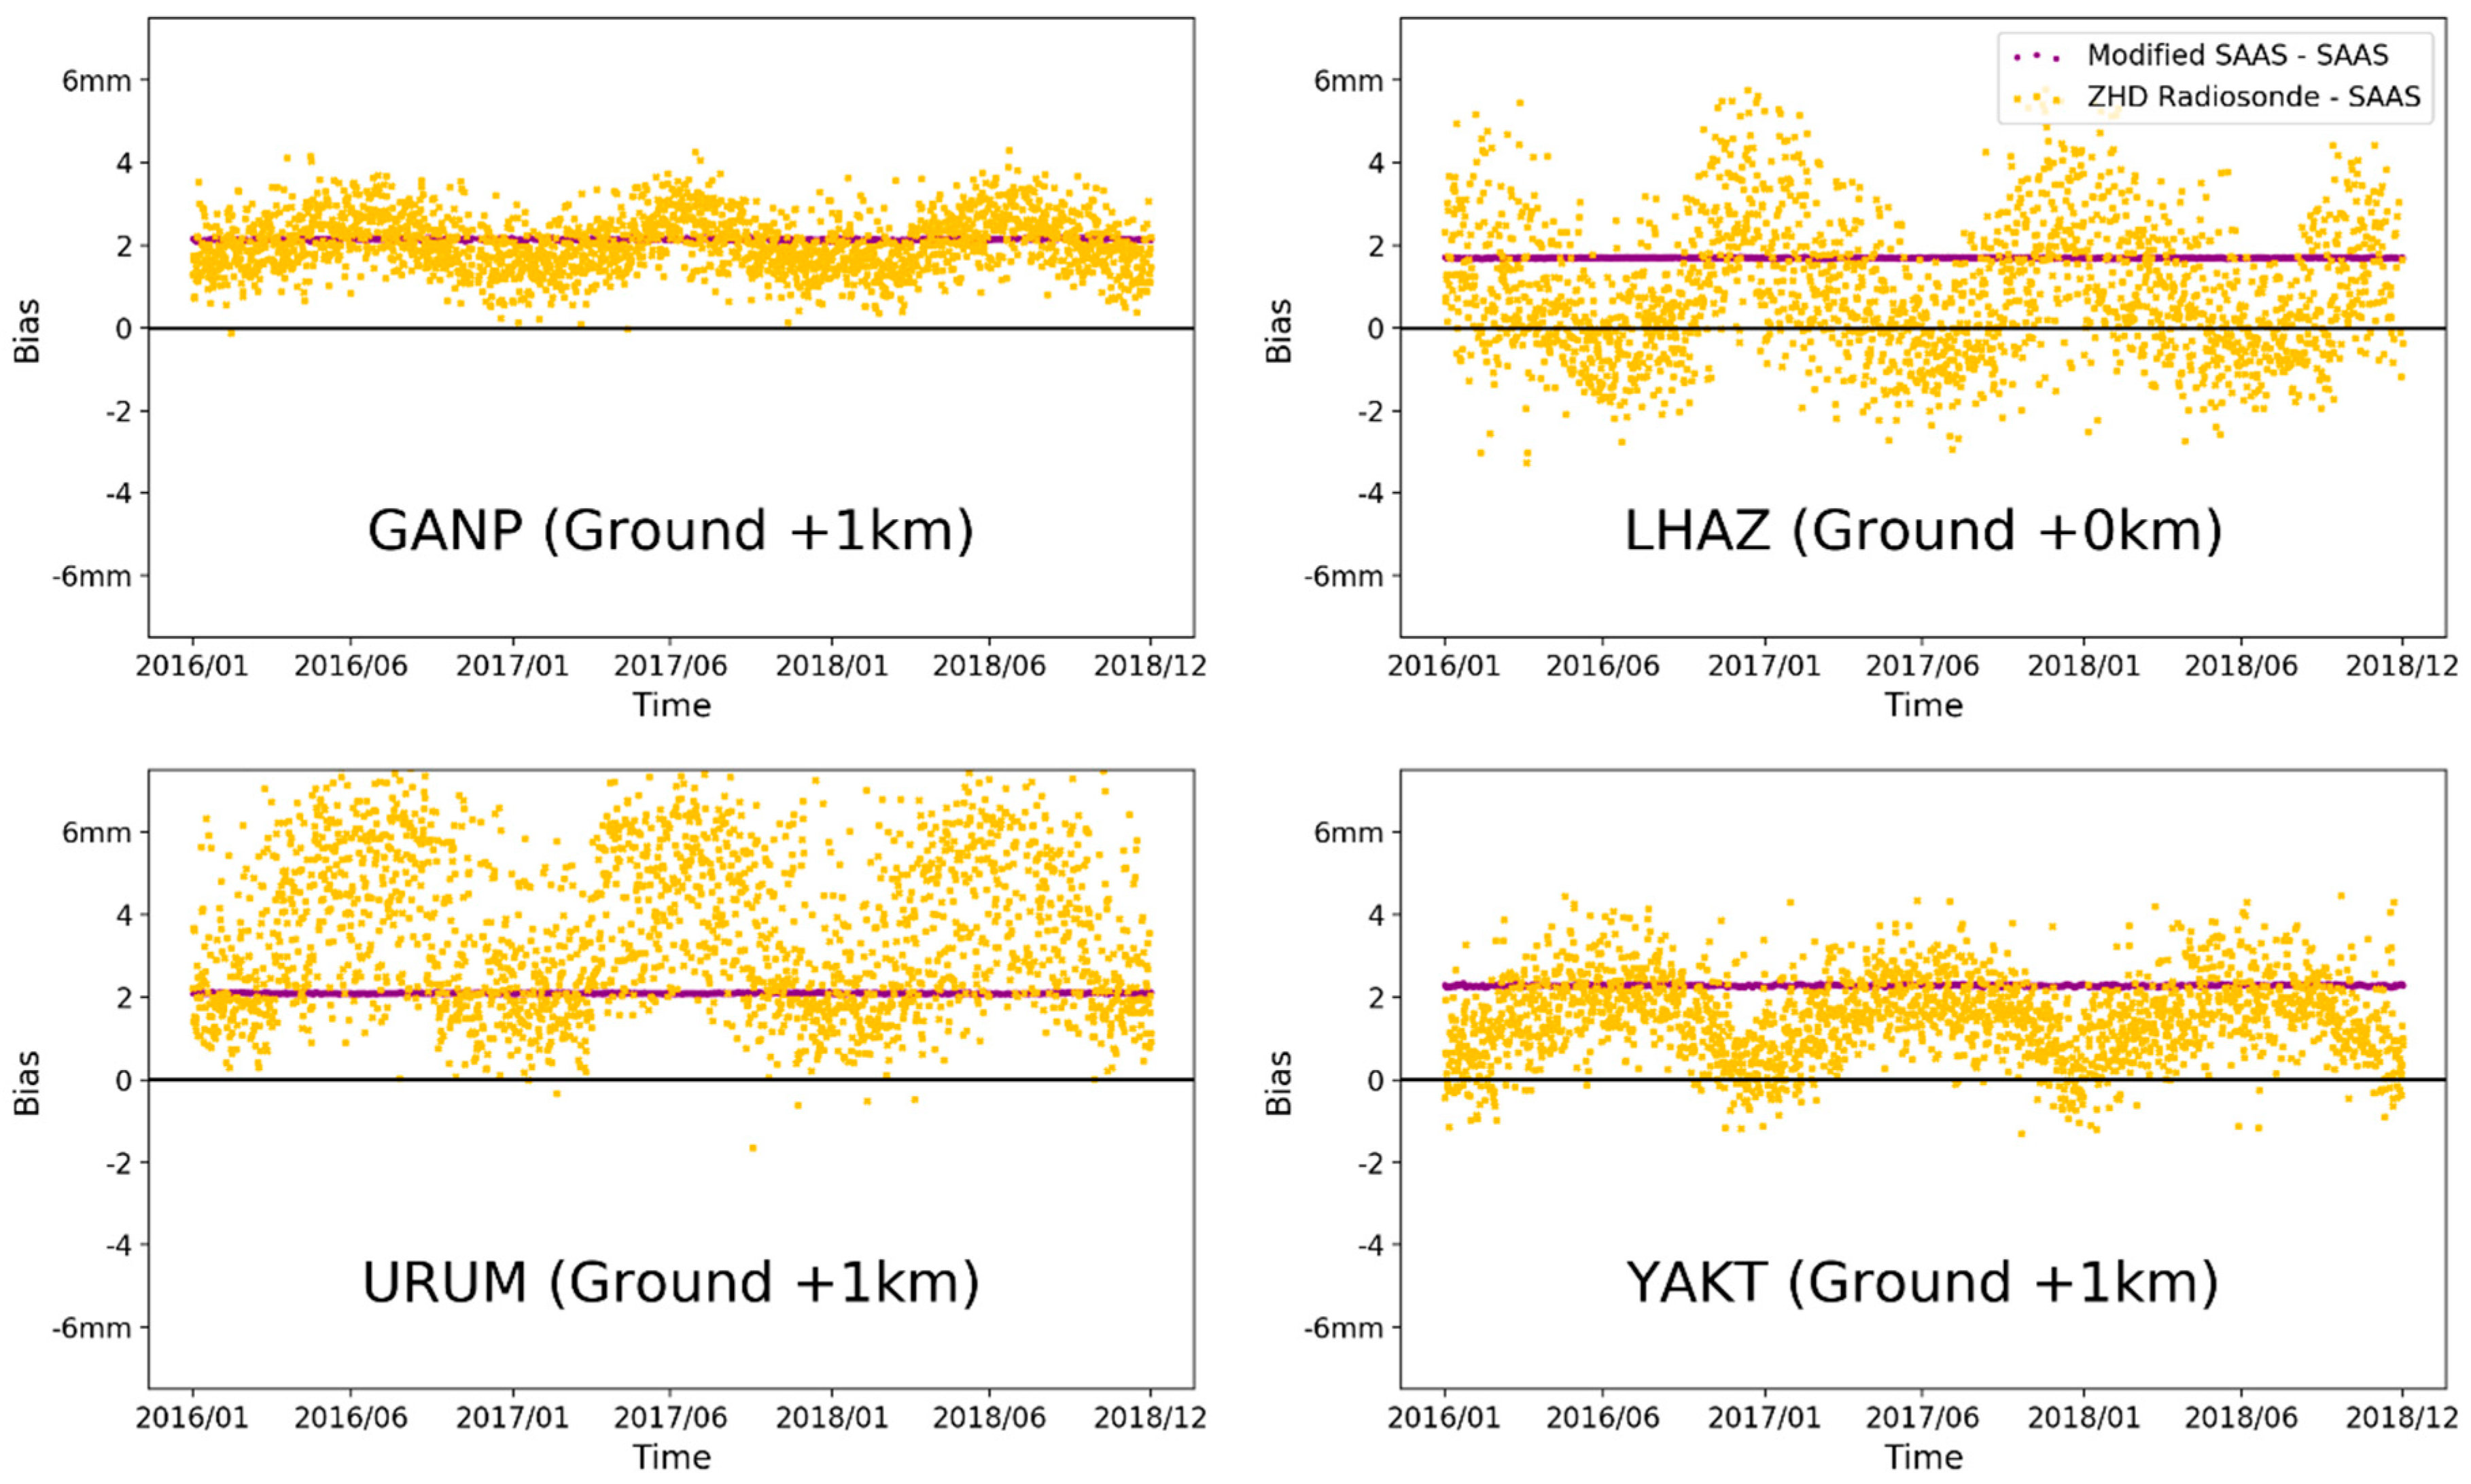
The seasonal biases between the Saastamoinen ZHD estimates and the radiosonde estimates were clearly visible for the LAHZ station, on the Tibet Plateau, with an altitude of about 3000 m. In other stations, no obvious seasonal biases were visible until we increased the altitude of the starting point to calculate ZHD by column integration along with the radiosonde profile, and that was entered as input in the Saastamoinen model, see Figure 5. This is in coherence with the fact that balloon pressure measurements taken at ground level are affected by boundary layer turbulence and are not a reliable estimate of the surface mean pressure. Bender [49] and Hauser [50] indicate that local departures of atmospheric pressure from local hydrostatic equilibrium can result in up to a 3 mm error on zenith total delay (ZTD) estimates. Fleagle and Businger [51] state that, under extreme weather conditions (thunderstorm or heavy turbulence), the vertical accelerations of the atmosphere can reach 1% of gravity, which corresponds to an error of about 20 mm for ZHD estimates computed from sea level.
We can see in Figure 6a that, generally, the stations with seasonal biases are located over continents and their coastlines, while stations surrounded by large open oceans present no such phenomena. For all the stations with seasonal biases, the biases are positive/larger for local summer, in both southern and northern hemispheres, except for the station LHAZ located on the Tibet Plateau. The comparison of Figure 6a seasonal biases on ZTD estimates and Figure 6b shows clearly that these biases are correlated with the mean pattern of the pressure field on the Earth’s surface. Correlations are particularly visible for North America, China, and North Siberia (biases going up with higher pressures), as well as the Antarctica coast (biases going down with lower pressures corresponding to the circumpolar Antarctica winds).

4. Results: Mapping Function Comparison

4.1. Hydrostatic Mapping Function

For this section, we considered 3 years of data (1 January 2016 to 31 December 2018) for the 28 stations of this study. Mean ZHDs in any given station are around 2300 mm with a standard deviation of 20 mm, except for several high-altitude stations such as LHAZ (altitude 3662 m), for which the 3-year mean ZHD is 1483 mm with a standard deviation of 9 mm. We multiplied the hydrostatic mapping function from VMF1/VMF3 and the radiosonde data by the mean ZHD from 3-year radiosonde estimates for each station to obtain a slant hydrostatic delay (SHD) for comparison purposes.
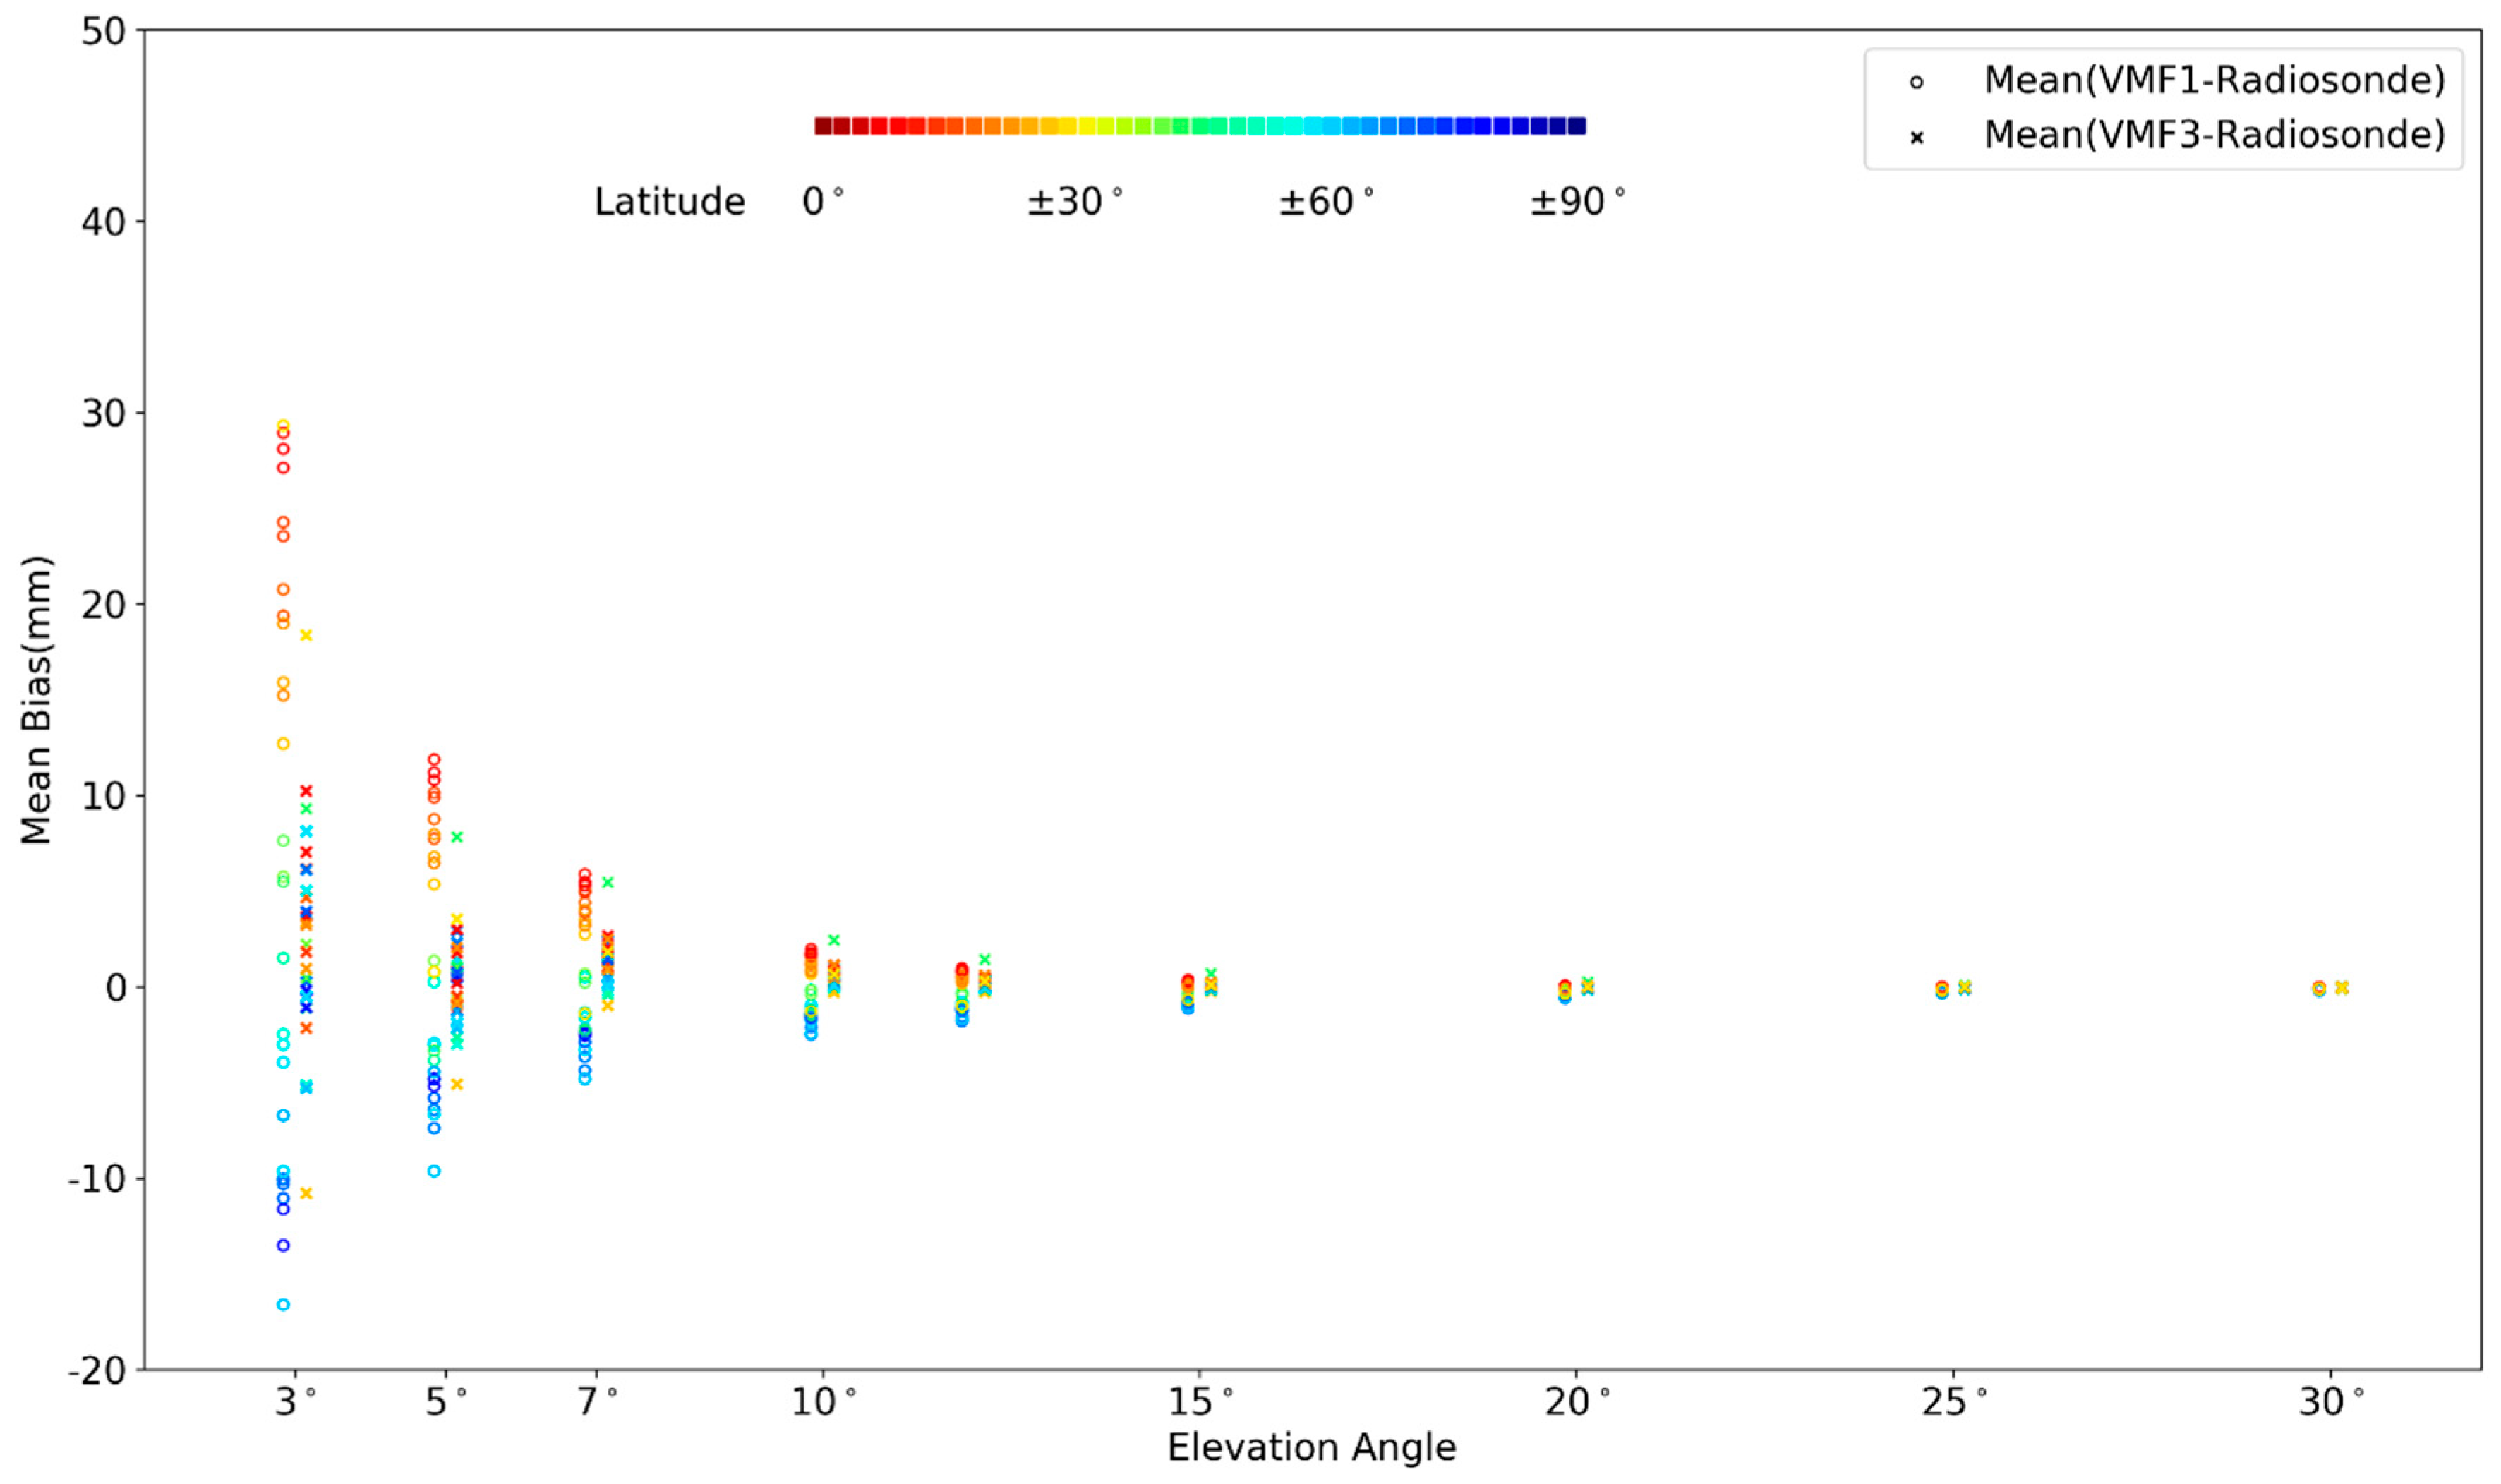
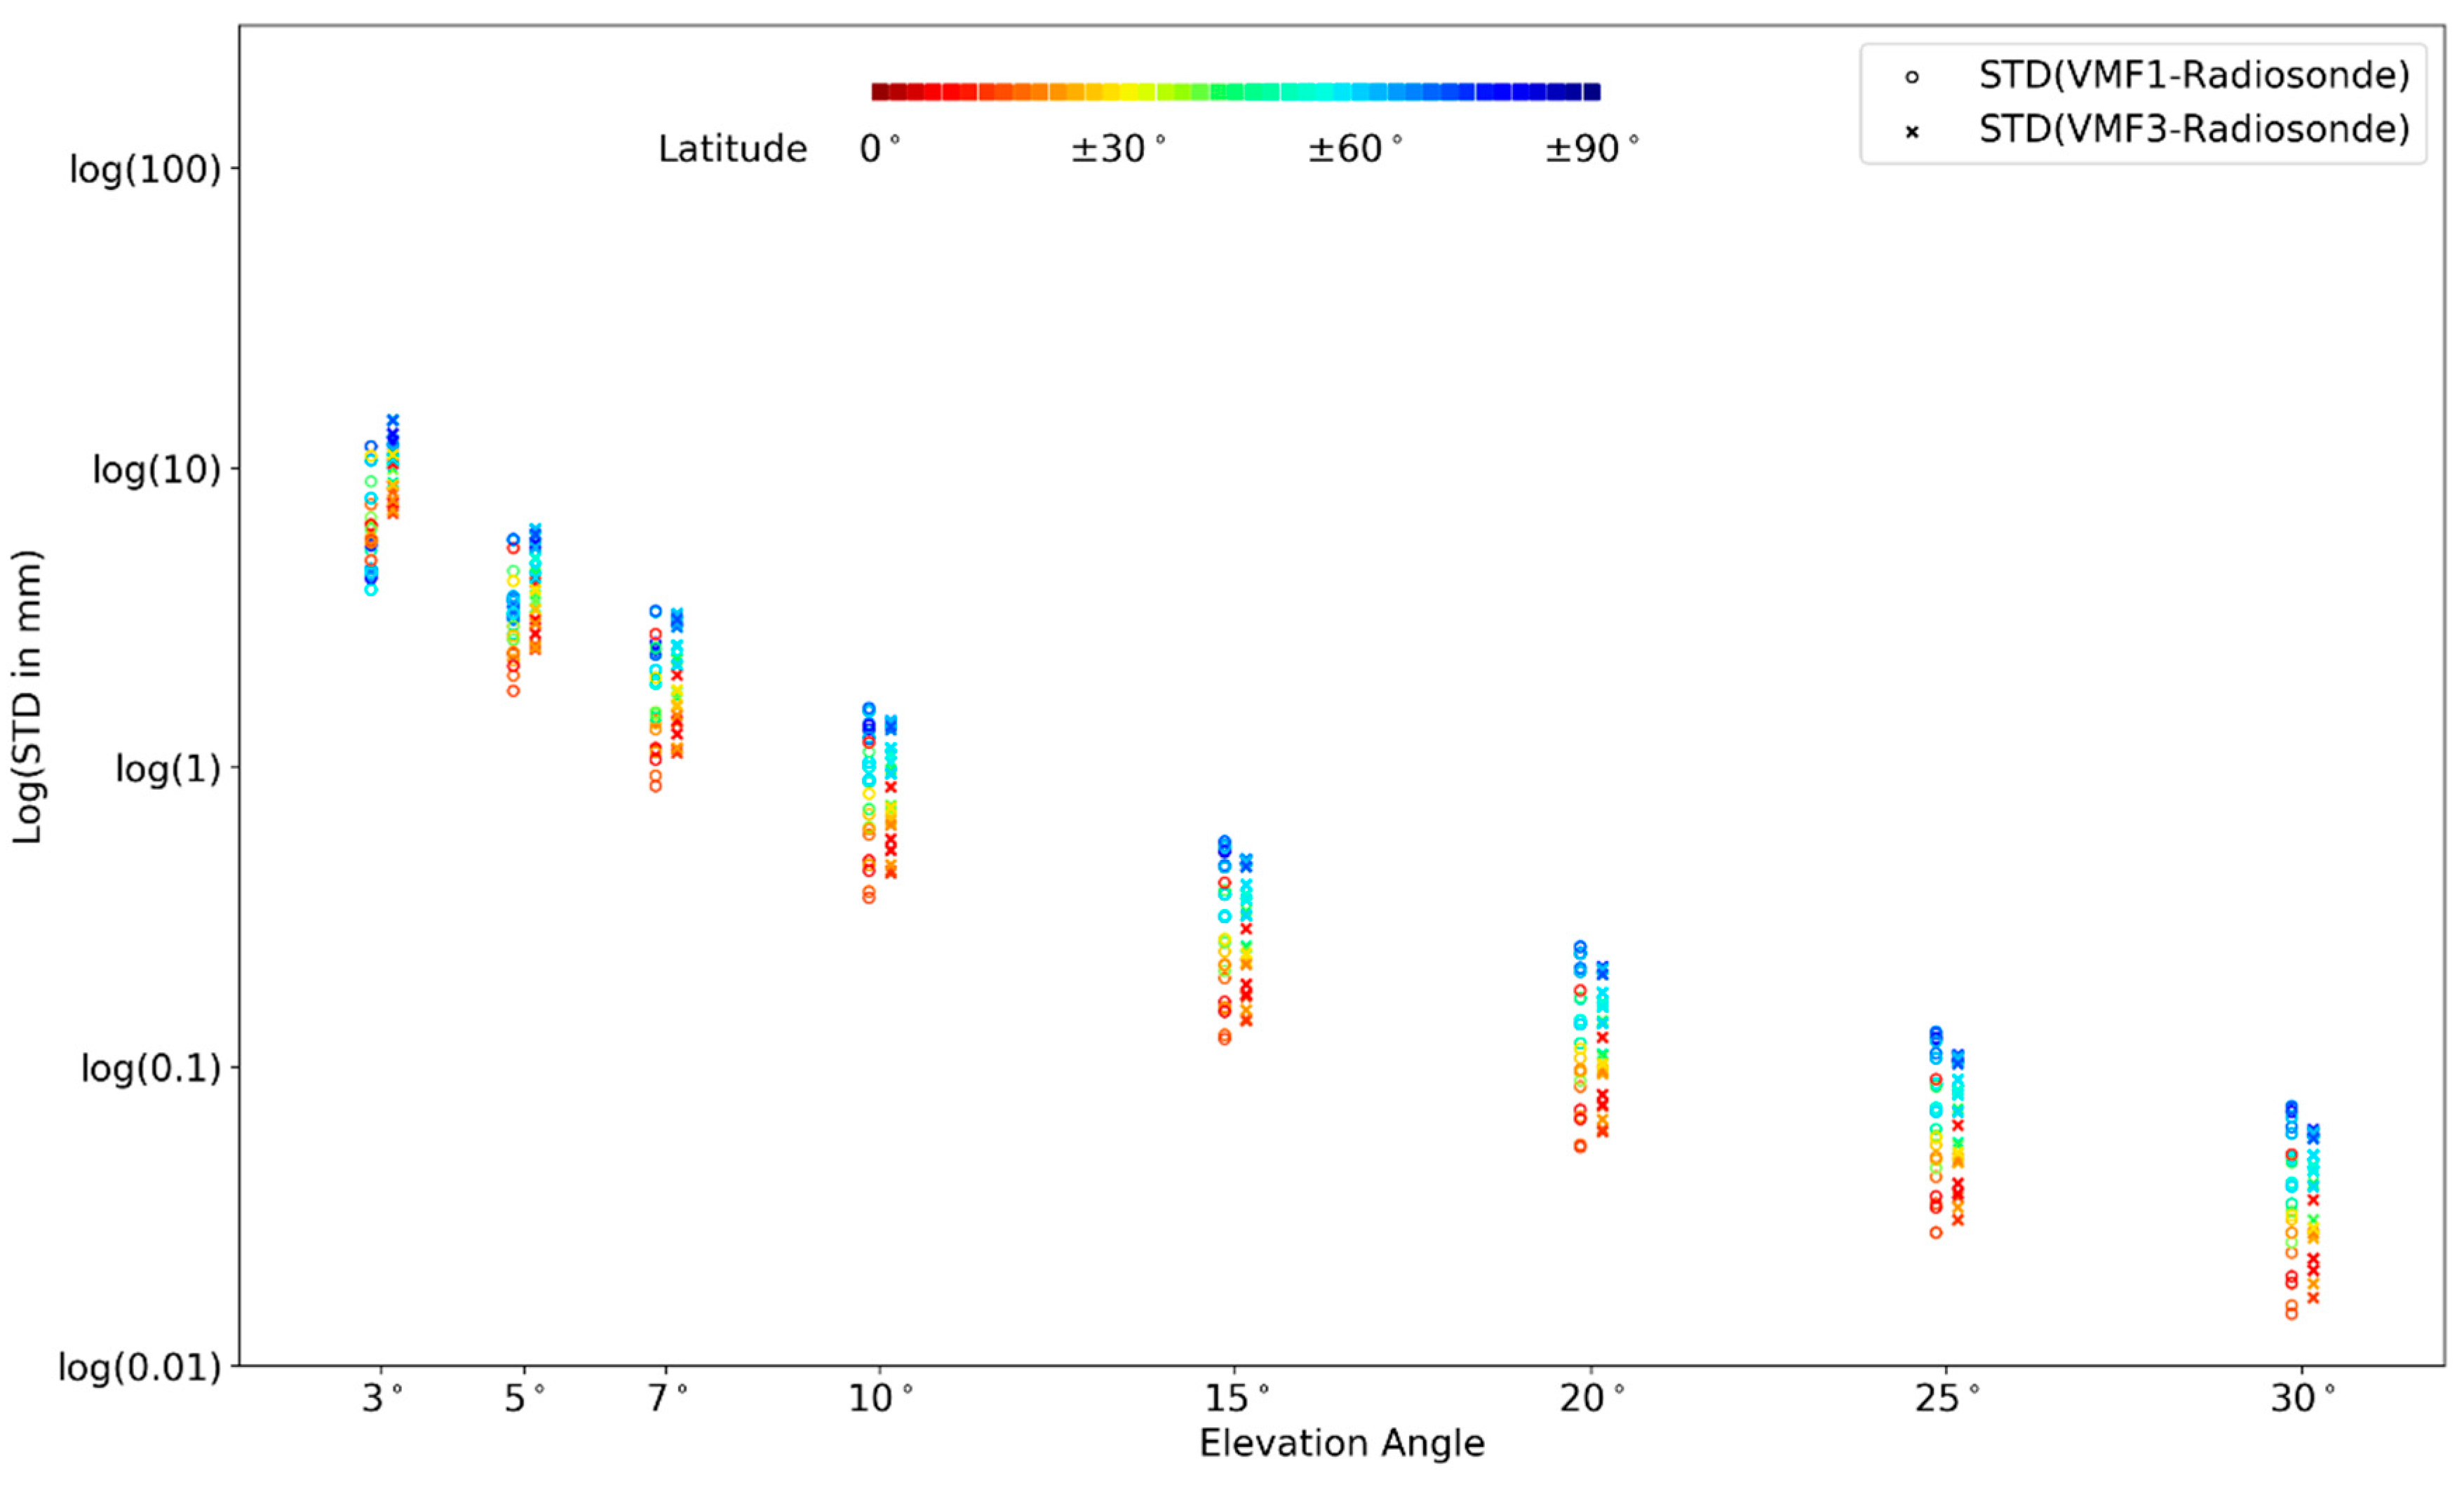
The logarithms of root mean square of the SHD estimates biases from the VMF1/VMF3 mapping functions are shown in Figure 7 (detailed results can be found in Table 5). Generally, the VMF3 SHD estimates are closer to the radiosonde/ISA76 SHD estimates obtained by ray-tracing than the VMF1 SHD estimates. From the color bar, we can see that, for the VMF1 case, equatorial stations perform better than high latitude stations in high elevation angles. High latitude stations present a better match when the elevation angles go below 10°. For the VMF3 case, high latitude stations generally perform poorer than middle/low latitude stations, except for the high altitude LHAZ station on the Tibet Plateau. A possible explanation is that VMF1 mapping functions are tuned for the very specific elevation angle of 3° [53]. On the contrary, VMF3 mapping functions are adjusted over seven elevation angles (3°, 5°, 7°, 10°, 15°, 30°, 70°), see Landskron and Böhm [14]. In Figure 8, VMF1 SHD estimates show a pattern of negative values at high latitudes and positive values at low latitudes, which is not apparent for the VMF3 SHD estimates. In Figure 9, we can see that the VMF3 SHD residuals present more scatters than the VMF1 SHD residuals with respect to their mean value. Therefore, we only see a slight improvement in RMS results for VMF3 SHD estimates compare to VMF1 SHD (see Figure 8 and Figure 9).
Table 5. Mean RMS, biases, and standard deviations (STD) of the differences between the hydrostatic VMF1 and VMF3 SHD estimates minus radiosonde/ISA76 SHD estimates computed by ray-tracing, for the 28 stations of this study, over a 3-year period (1 January 2016 to 31 December 2018), in mm. The post-fit rows are relative to the fit by a yearly sine function (see Figure 10 and Figure 11).
Elevation Angle30°25°20°15°10°
RMS (VMF1)0.100.160.300.611.73.87.115.8
RMS (VMF3)0.050.080.150.361.22.74.811.6
Bias (VMF1)−0.09−0.14−0.23−0.37−0.310.421.16.2
Bias (VMF3)−0.02−0.02−0.010.080.621.40.42.5
STD (VMF1)0.040.070.150.330.911.93.36.5
STD (VMF3)0.040.070.140.310.922.14.210.3
post-fit STD (VMF1)0.030.050.110.240.701.62.96.3
post-fit STD (VMF3)0.030.060.110.260.751.83.59.0
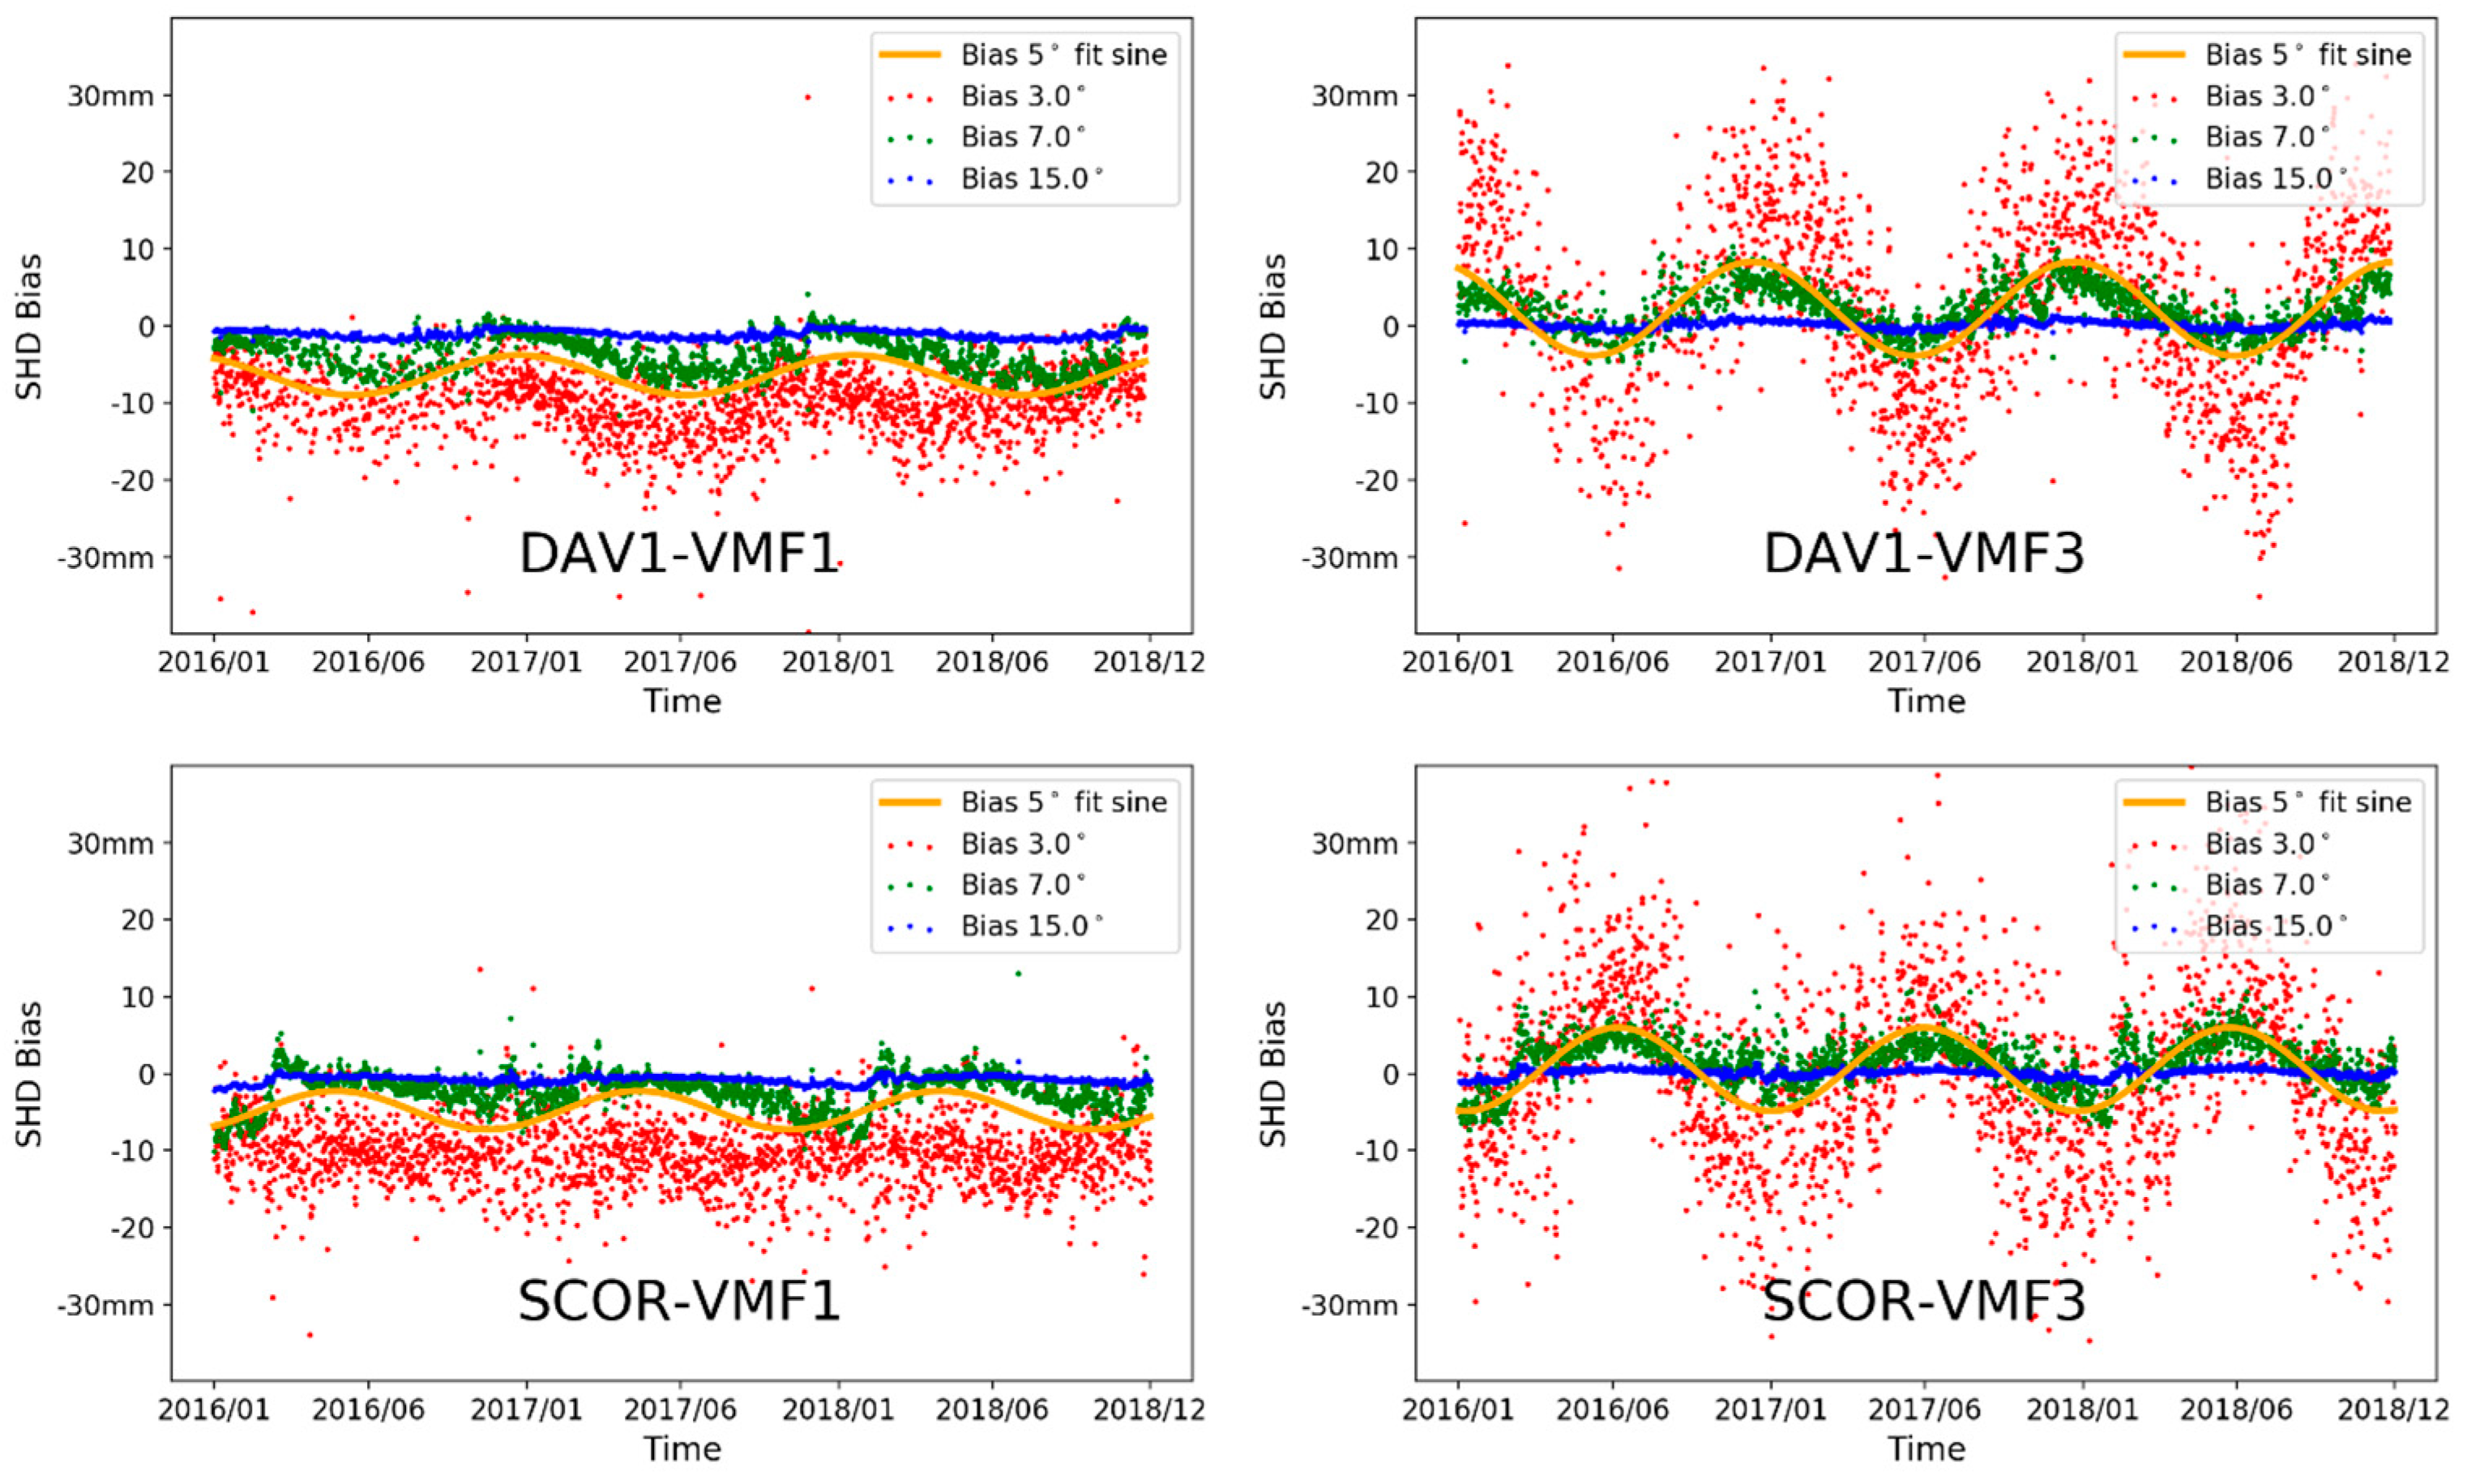
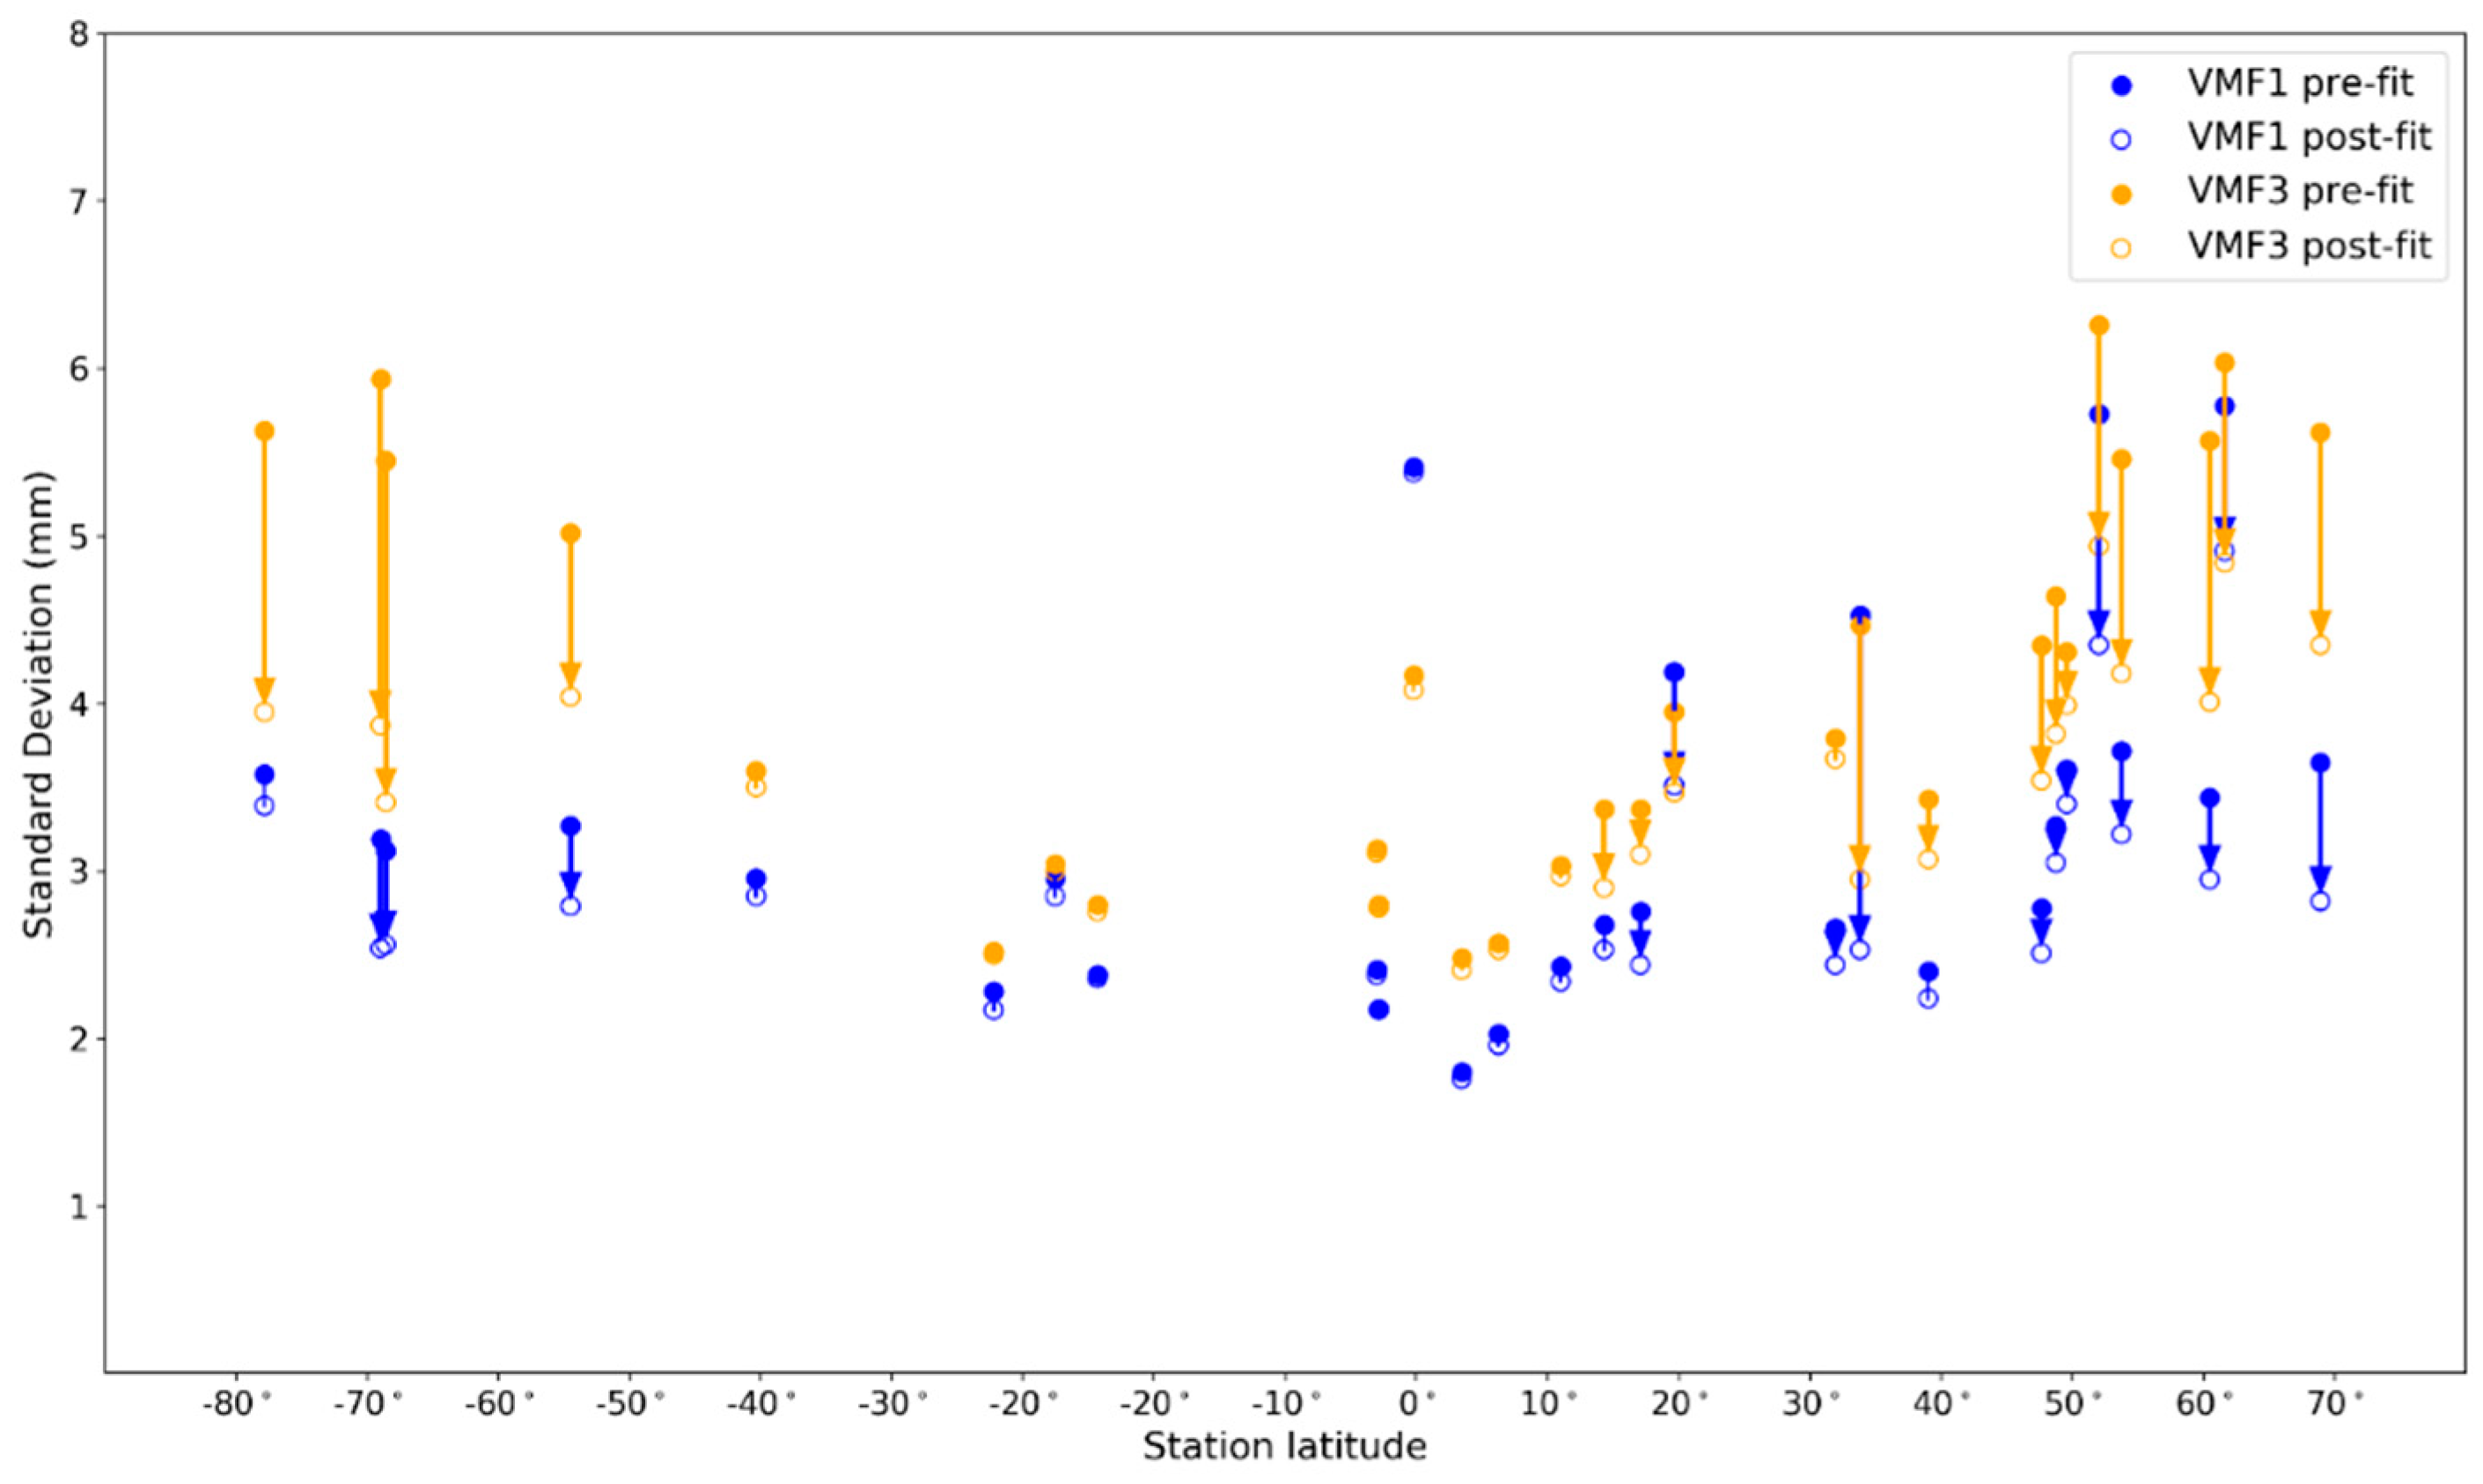
As shown in Figure 10, for the case of two stations, one off the Antarctica coast and the other one in Iceland, both VMF1 and VMF3 SHD estimates have seasonal biases with reference to ray-tracing SHD estimates computed from radiosonde data + ISA76 standard atmosphere. In general, the lower the elevation angle is, the larger these seasonal biases are. We also fitted these seasonal biases by using a simple yearly sine function, as it was done for Figure 6a. A summary of the fit results is plotted in Figure 11 and Table 5. This summary shows clearly that both VMF1 and VMF3 SHD estimates have seasonal discrepancies over radiosonde + ISA76 standard atmosphere estimates, but that this seasonal yearly imprint is more pronounced for VMF3 SHD estimates, as the post-fit residuals with respect to the yearly sine function are larger, especially at low elevation angles and high latitudes. We recall that the VMF3 team claims that the improvements over the VMF1 mapping function are coming both from a better weather source model and worldwide modeling of b and c coefficients.

4.2. Wet Mapping Function

For the comparisons over the wet mapping function, we multiplied VMF1 and VMF3 wet part of the mapping function by a sine function fitted mean ZWD specific for each location to obtain the slant wet delay (SWD), as we similarly did in Section 4.1. Unlike ZHDs that are always around 2.3 m at sea level, ZWDs can change dramatically in space and time. They are close to zero for dry places such as Antarctica or high-altitude plateaus such as the Tibet Plateau. Moreover, there is no need to extend the radiosonde records by standard atmosphere data, as almost all the water vapor is concentrated in the troposphere [32], as already indicated in Section 2.1.
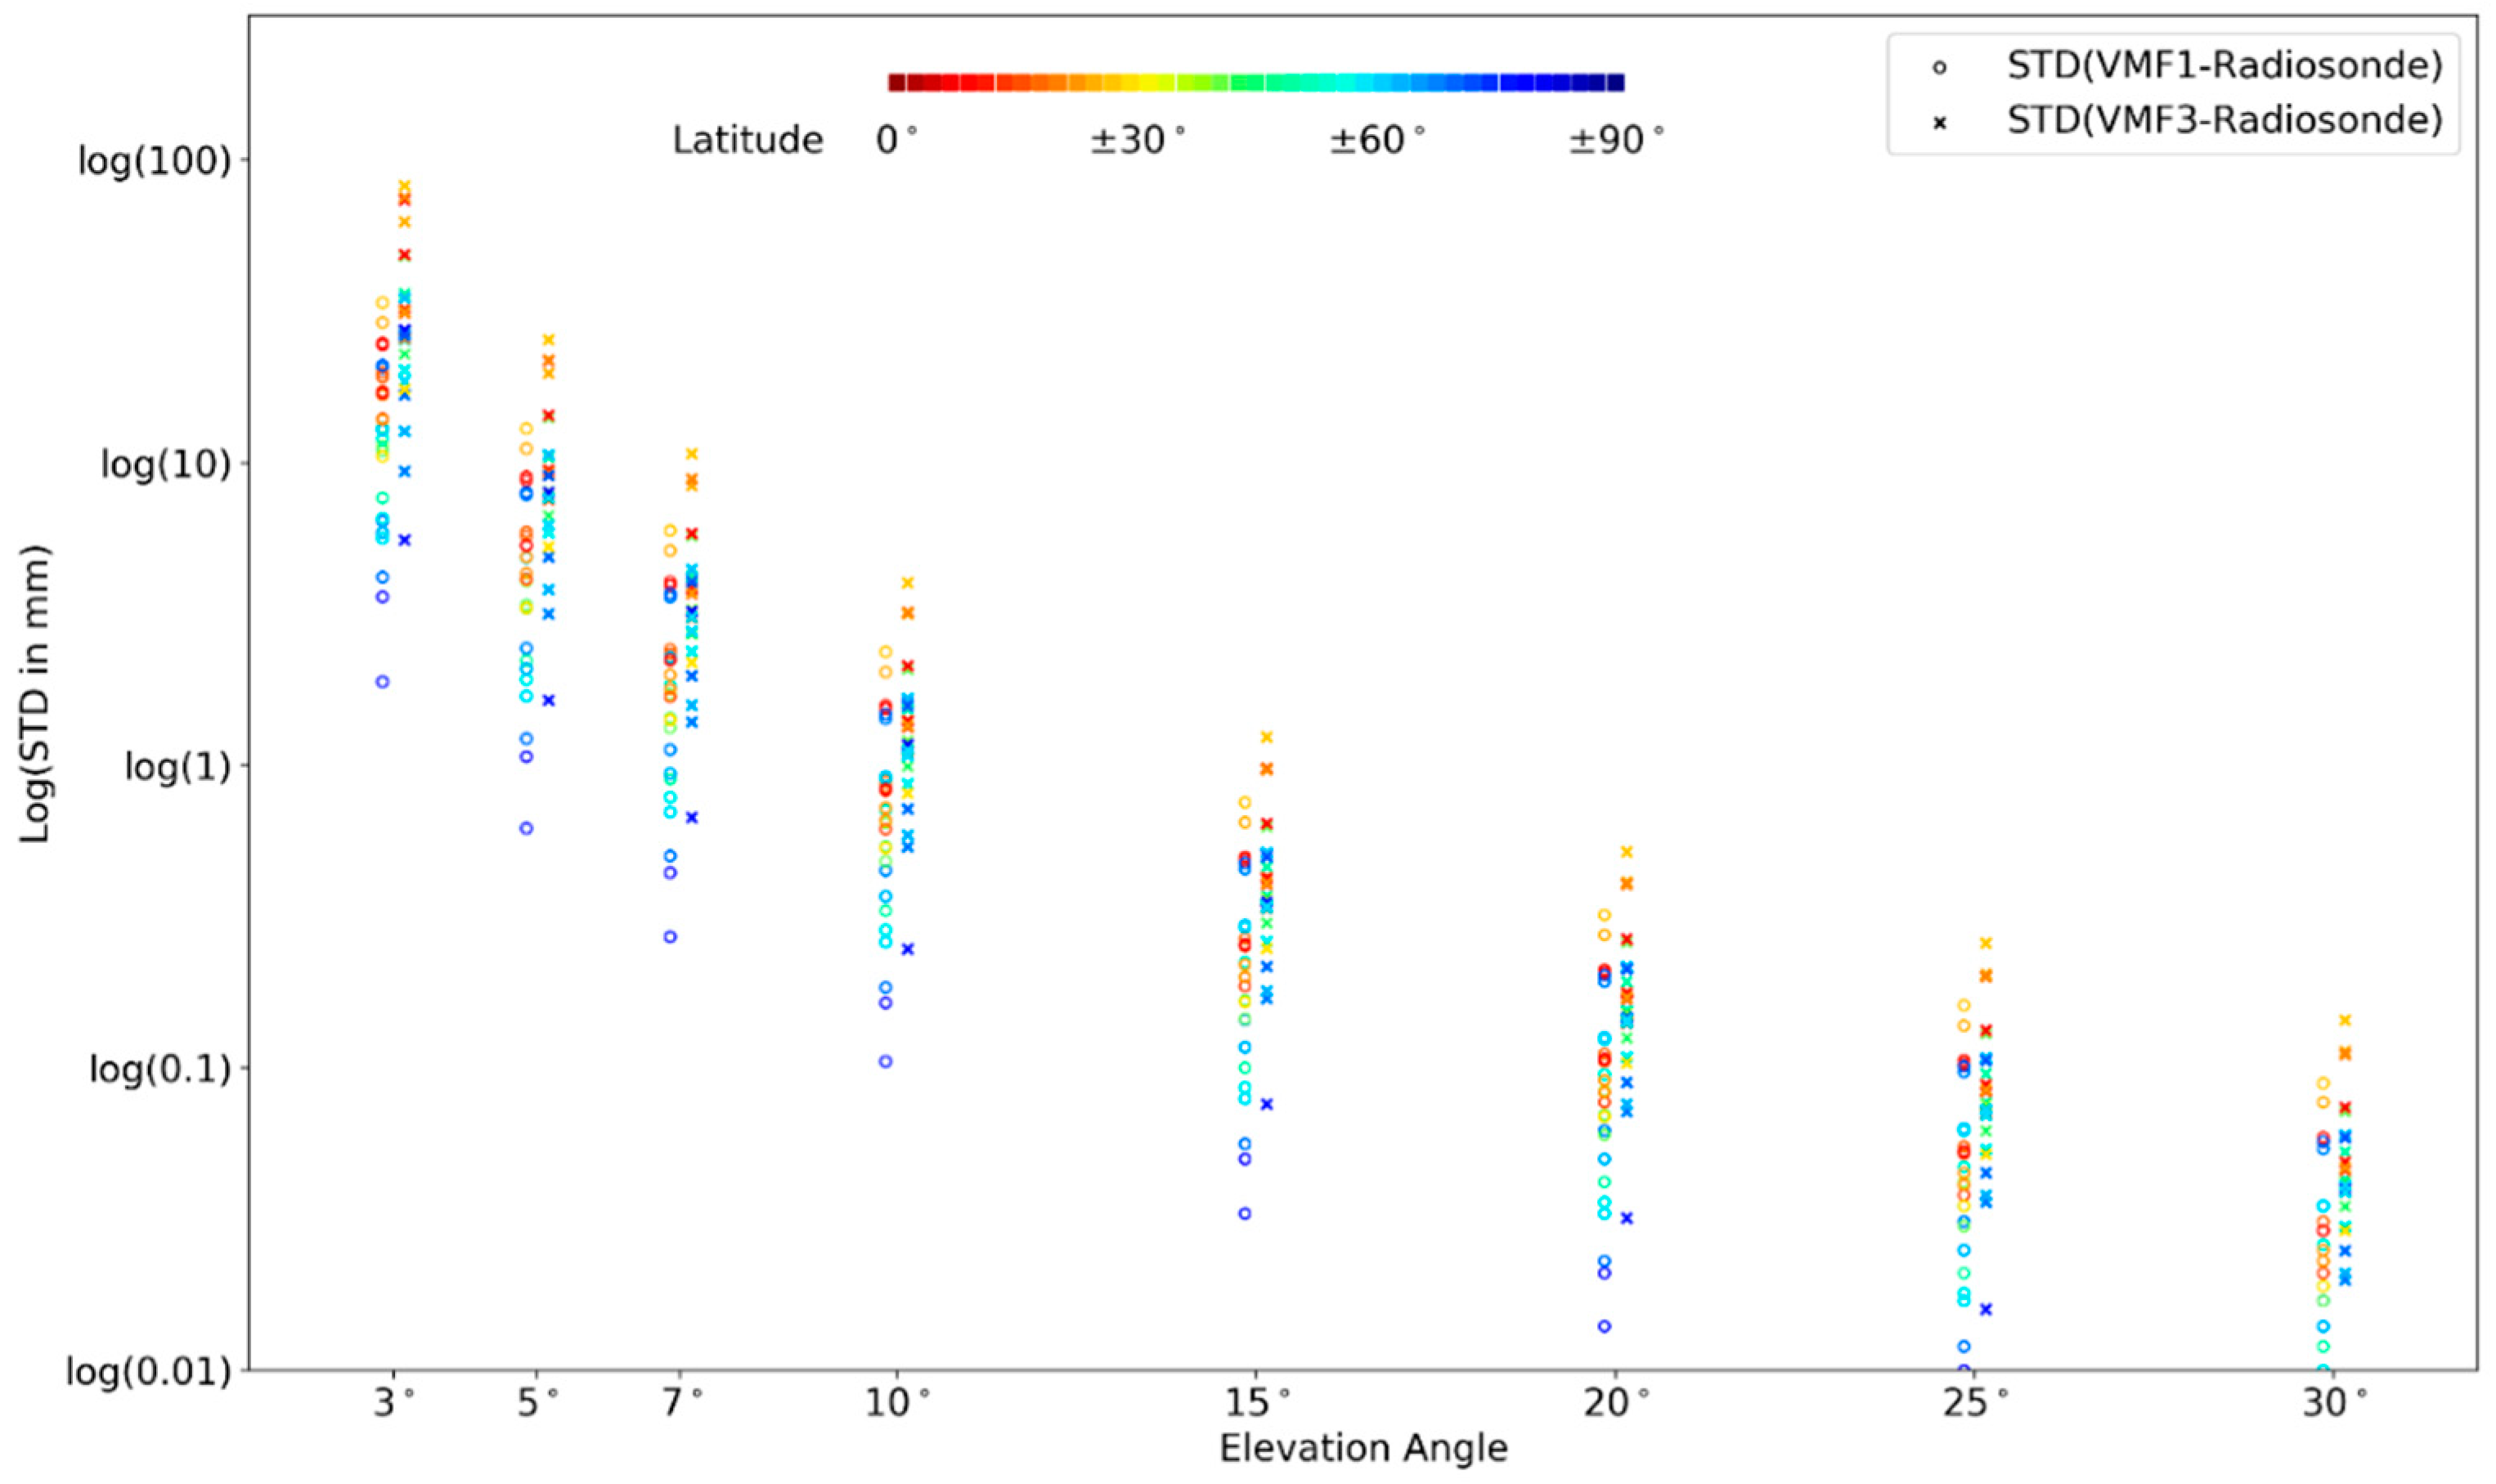
From Figure 12 and Table 6, one can see that, generally, the VMF3 SWD estimates offer a degraded performance over the VMF1 SWD estimates with respect to ray-tracing SWD estimates, and this is for all the elevation angles, from 3° to 30°. Compared to SHD estimates, the SWD estimates have smaller biases for high elevation angles but larger biases for low elevation angles for both the VMF1 and the VMF3 mapping functions. This is probably related to the fact that water vapor decays faster than the total air pressure over altitude (the water vapor scale height is about 2 km compared to a scale height of 8.5 km for the whole atmosphere). Average RMS, mean biases, and standard deviation of VMF1 and VMF3 wet mapping function are listed in Table 6. The mean RMS of VMF1 SWD estimates is 7.0 mm for a 5° elevation angle and 20.3 mm for a 3° elevation angle (respectively 11.4 mm and 36.9 mm for the VMF3 mapping function). The latitude dependency for the SWD biases is less obvious than for the SHD biases (Figure 7) for both VMF3 and VMF1 cases.
Figure 13 and Figure 14 give the mean biases and the standard deviations of VMF3/VMF1 SWD estimates with respect to radiosonde SWD estimates from ray-tracing. We can see that VMF3 and VMF1 SWD biases have similar magnitudes (always positive values for VMF1 SWD estimates, a more random pattern for VMF3 SWD estimates) but larger standard deviations for VMF3 SWD estimates.

5. Conclusions

As already stated in the introduction, this paper focuses on GNSS meteorology, and, more specifically, on the determination of ZWD estimates. The ZWD estimation is built on two pillars—accurate ZTD estimates and accurate ZHD estimates—as the ZWD estimates are the differences between them. For this purpose, we used an in-house ray-tracing algorithm fed by 3 years of radiosonde data supplemented with a standard atmosphere model up to 100 km for 28 globally distributed radiosonde stations to compute highly precise experimental wet and hydrostatics mapping functions. Every radiosonde station was selected to be close to an IGS station less than 6 km apart. The 2D ray-tracing program was validated against third-party software [54], with a 1 mm accurate radio propagation delay at a 3° elevation angle. We compared these experimental delays and mapping functions with the Saastamoinen ZHD delays and VMF1 and VMF3 mapping functions slant delays.
Our analysis shows clearly that the widely used Saastamoinen model, and its extension by Zhang et al. [19], have limitations, such as overestimation of the ZHD estimates in dry regions such as the Antarctica coast, and seasonal biases over continents, especially at high altitude. These effects are small, in the range of 2–5 mm, but no longer acceptable with the better accuracy and applicability offered by the Precise Point Positioning PPP orbits for ZTD estimations. These two ZHD models are basically fed by the ground pressure only. They are too sensitive to the ground pressure value in the sense that some kind of an “average” of the local ground pressure must be considered and not an instrumental, purely local value. The conclusion is clear—a simplistic ZHD delay model assuming hydrostatic equilibrium cannot embrace the complexity of the atmosphere at the level of accuracy required by modern applications.
The comparison between our experimental mapping function with VMF1 and VMF3 mapping functions also shows that the improvement claimed by the team that built the newer VMF3 mapping function is correct in most cases but not all. The comparison with ray-tracing shows that the VMF3 mapping function reduces systematic errors, but not seasonal biases, for the hydrostatic part for all latitudes and elevation angles, except for very low elevation angles where the VMF1 performs better, probably because it was tuned for the specific low elevation angle of 3 degrees. The wet part of the VMF3 mapping function is more problematic, with larger standard deviations with reference to ray-tracing than the wet part of VMF1. Nevertheless, the biases for the wet part of VMF3 show a more “random” pattern worldwide than the corresponding results for the VMF1 case.
Our results show similar error levels for the VMF1 mapping function and similar unmodeled seasonal signatures when compared to results from similar assessment studies of Niell Mapping Function (NMF), Global Mapping Function (GMF), and VMF mapping functions [20,21,22,23]. Unlike the significant leap seen between the NMF and the VMF1 mapping functions, however, there is no significant advantage to switch from the VMF1 to the VMF3 mapping functions, even though VMF3 adopts a more accurate atmosphere data source and fitting strategy. This leads to the same conclusion as that for the Saastamoinen hydrostatic model, i.e., the approach in mapping functions, at least for GNSS meteorology applications, must be revisited in-depth and not superficially. The mapping function concept was first derived for astronomy and positioning applications [9], considering integrated quantities along the radio ray path. This approach needs to be extended to take into account both dry and wet variations in refractivity along the ray path caused by the turbulent atmosphere [55] to meet the requirements of modern applications such as GNSS meteorology and data assimilation in numerical weather models.
The Saastamoinen ZHD model assumes atmospheric hydrostatic equilibrium, while the mapping function assumes an azimuthal isotropous atmosphere with smooth variation over time. Our assessment with in situ radiosonde data showed the limitation of these assumptions. These simplifications are no longer enough for modern applications. Current multi GNSS systems contain more visible satellites; in the future, low-earth orbit augmented GNSS constellations will deliver greater coverage and higher resolution in both space and time [56]. It will be possible to avoid simplifications for a more nuanced general model of tropospheric signal delay.

Author Contributions

P.F. designed the experiment, processed the data and wrote the paper under the supervision of J.-P.B. and F.L., J.Y. contributed to the discussion and reviewed the draft. F.Z. contributed to the analysis of data. All authors have read and agreed to the published version of the manuscript.

Funding

This study was done under the CaiYuanpei Scholarship from the Chinese Scholarship Council and Campus France, as a publish fulfillment for Feng Peng (LIESMARS, Wuhan University and Geodesy Observatory of Tahiti, University of French Polynesia). This work is also supported by the National Scientific Foundation of China (grant number 41874010, U1831132), Innovation Group of Natural Fund of Hubei Province (grant number 2018CFA087). Jean-Pierre Barriot was funded by a support grant to OGT given by the French Space Agency (CNES).

Acknowledgments

We thank the Vienna University of Technology for publishing Vienna Mapping function data. Figure 6b was accessed from www.ecmwf.int/en/forecasts/charts/ under the policy and permission from ECMWF. We also thank NOAA for providing the Integrated Global Radiosonde Archive (IGRA).

Conflicts of Interest

The authors declare no conflict of interest.

References

  1. Herring, T.A.; King, R.W.; Floyd, M.A.; McClusky, S.C. GAMIT Reference Manual: GPS Analysis at MIT, Release 10.6; Massachusetts Institute of Technology: Cambridge, MA, USA, 2010; ISBN 0099-2240. [Google Scholar]
  2. Dach, R.; Lutz, S.; Walser, P.; Fridez, P. (Eds.) Bernese GNSS Software Version 5.2; University of Bern, Bern Open Publishing: Bern, Switzerland, 2015; Volume 2, ISBN 1879621142. [Google Scholar]
  3. Saastamoinen, J. Atmospheric Correction for the Troposphere and Stratosphere in Radio Ranging Satellites. In Geophysical Monograph Series; American Geophysical Union: Washington, DC, USA, 1972; Volume 15, pp. 247–251. [Google Scholar]
  4. Davis, J.L.; Herring, T.A.; Shapiro, I.I.; Rogers, A.E.E.; Elgered, G. Geodesy by radio interferometry: Effects of atmospheric modeling errors on estimates of baseline length. Radio Sci. 1985, 20, 1593–1607. [Google Scholar] [CrossRef]
  5. Hopfield, H.S. Tropospheric Effect on Electromagnetically Measured Range: Prediction from Surface Weather Data. Radio Sci. 1971, 6, 357–367. [Google Scholar] [CrossRef]
  6. Black, H.D. An Easily Implemented Algorithm for the Tropospheric Range Correction. J. Geophys. Res. 1978, 83, 1825–1828. [Google Scholar] [CrossRef]
  7. Mendes, V.B. Modeling the Neutral-Atmospheric Propagation Delay in Radiometric Space Techniques. Ph.D. Thesis, University of New Brunswick, Fredericton, NB, Canada, 1999. [Google Scholar]
  8. Tuka, A.; El-Mowafy, A. Performance evaluation of different troposphere delay models and mapping functions. Measurement 2013, 46, 928–937. [Google Scholar] [CrossRef] [Green Version]
  9. Marini, J.W. Correction of Satellite Tracking Data for an Arbitrary Tropospheric Profile. Radio Sci. 1972, 7, 223–231. [Google Scholar] [CrossRef]
  10. Marini, J.W.; Murray, C.W. Correction of Laser Range Tracking Data for Atmospheric Refraction at Elevations above 10 Degrees; NASA Technical Report; Goddard Space Flight Center: Greenbelt, MD, USA, 1973. [Google Scholar]
  11. Petit, G.; Luzum, B. Chapter 9 Models for atmospheric propagation delays. In IERS Convention (2010); IERS Convention Centre: Frankfurt am Main, Germany, 2010; pp. 132–150. [Google Scholar]
  12. Uppala, S.M.; Kållberg, P.W.; Simmons, A.J.; Andrae, U.; da Costa Bechtold, V.; Fiorino, M.; Gibson, J.K.; Haseler, J.; Hernandez, A.; Kelly, G.A.; et al. The ERA-40 re-analysis. Q. J. R. Meteorol. Soc. 2005, 131, 2961–3012. [Google Scholar] [CrossRef]
  13. Boehm, J.; Werl, B.; Schuh, H. Troposphere mapping functions for GPS and very long baseline interferometry from European Centre for Medium-Range Weather Forecasts operational analysis data. J. Geophys. Res. Solid Earth 2006, 111, 1–9. [Google Scholar] [CrossRef]
  14. Landskron, D.; Böhm, J. VMF3/GPT3: Refined discrete and empirical troposphere mapping functions. J. Geod. 2018, 92, 349–360. [Google Scholar] [CrossRef]
  15. Dee, D.P.; Uppala, S.M.; Simmons, A.J.; Berrisford, P.; Poli, P.; Kobayashi, S.; Andrae, U.; Balmaseda, M.A.; Balsamo, G.; Bauer, P.; et al. The ERA-Interim reanalysis: Configuration and performance of the data assimilation system. Q. J. R. Meteorol. Soc. 2011, 137, 553–597. [Google Scholar] [CrossRef]
  16. Kouba, J. Implementation and testing of the gridded Vienna mapping function 1 (VMF1). J. Geod. 2008, 82, 193–205. [Google Scholar] [CrossRef]
  17. Mendes, V.B.; Langley, R.B. Tropospheric zenith delay prediction accuracy for high-precision GPS positioning and navigation. Navig. J. Inst. Navig. 1999, 46, 25–34. [Google Scholar] [CrossRef]
  18. Liu, Y.; Baki Iz, H.; Chen, Y. Calibration of zenith hydrostatic delay model for local GPS applications. Radio Sci. 2000, 35, 133–140. [Google Scholar] [CrossRef]
  19. Zhang, D.; Guo, J.; Chen, M.; Shi, J.; Zhou, L. Quantitative assessment of meteorological and tropospheric Zenith Hydrostatic Delay models. Adv. Sp. Res. 2016, 58, 1033–1043. [Google Scholar] [CrossRef]
  20. Niell, A.E. Preliminary evaluation of atmospheric mapping functions based on numerical weather models. Phys. Chem. Earth Part A Solid Earth Geod. 2001, 26, 475–480. [Google Scholar] [CrossRef]
  21. Ichikawa, R.; Hobiger, T.; Koyama, Y.; Kondo, T. An Evaluation of the practicability of current mapping functions using ray-traced delays from JMA Mesoscale Numerical Weather Data. In Proceedings of the internatIonal Symposium on GPS/GNSS; The Institute of Positioning, Navigation and Timing of Japan: Tokyo, Japan, 2008; pp. 5–12. [Google Scholar]
  22. Urquhart, L.; Nievinski, F.G.; Santos, M.C. Assessment of troposphere mapping functions using three-dimensional ray-tracing. GPS Solut. 2014, 18, 345–354. [Google Scholar] [CrossRef]
  23. Qiu, C.; Wang, X.; Li, Z.; Zhang, S.; Li, H.; Zhang, J.; Yuan, H. The Performance of Different Mapping Functions and Gradient Models in the Determination of Slant Tropospheric Delay. Remote Sens. 2020, 12, 130. [Google Scholar] [CrossRef] [Green Version]
  24. Niell, A.E. Improved atmospheric mapping functions for VLBI and GPS. Earth Planets Space 2000, 52, 699–702. [Google Scholar] [CrossRef] [Green Version]
  25. Boehm, J.; Niell, A.; Tregoning, P.; Schuh, H. Global Mapping Function (GMF): A new empirical mapping function based on numerical weather model data. Geophys. Res. Lett. 2006, 33, 3–6. [Google Scholar] [CrossRef] [Green Version]
  26. Sovers, O.J.; Lanyi, G.E. Evaluation of current tropospheric mapping functions by Deep Space Network very long baseline interferometry. Telecommun. Data Acquis. Rep. 1994, 42–119, 1–11. [Google Scholar]
  27. Durre, I.; Vose, R.S.; Wuertz, D.B. Overview of the integrated global radiosonde archive. J. Clim. 2006, 19, 53–68. [Google Scholar] [CrossRef] [Green Version]
  28. Durre, I.; Vose, R.S.; Wuertz, D.B. Robust automated quality assurance of radiosonde temperatures. J. Appl. Meteorol. Climatol. 2008, 47, 2081–2095. [Google Scholar] [CrossRef]
  29. Chen, B.; Liu, Z. A Comprehensive Evaluation and Analysis of the Performance of Multiple Tropospheric Models in China Region. IEEE Trans. Geosci. Remote Sens. 2016, 54, 663–678. [Google Scholar] [CrossRef]
  30. Manning, T. Sensing the Dynamics of Severe Weather Using 4D GPS Tomography in the Australian Region. Ph.D. Thesis, Royal Melbourne Institute of Technology (RMIT) University, Melbourne, Australia, 2013. [Google Scholar]
  31. Pavlis, N.K.; Holmes, S.A.; Kenyon, S.C.; Factor, J.K. The development and evaluation of the Earth Gravitational Model 2008 (EGM2008). J. Geophys. Res. Solid Earth 2012, 117. [Google Scholar] [CrossRef] [Green Version]
  32. Jiang, J.H.; Su, H.; Zhai, C.; Wu, L.; Minschwaner, K.; Molod, A.M.; Tompkins, A.M. An assessment of upper troposphere and lower stratosphere water vapor in MERRA, MERRA2, and ECMWF reanalyses using Aura MLS observations. J. Geophys. Res. Atmos. 2015, 120, 11468–11485. [Google Scholar] [CrossRef] [Green Version]
  33. FCM-H3. Federal Meteorological Handbook No. 3 Rawinsonde and Pibal Observations; Office of the Federal Coordinator for Meteorological Services and Supporting Research: Silver Spring, MD, USA, 1997. [Google Scholar]
  34. Vedel, H. Conversion of WGS84 geogeometric heights to NWP model HIRLAM geopotential heights. Danish Meteorol. Inst. Sci. Rep. 2000, 00-04, 1–16. [Google Scholar]
  35. Nafisi, V.; Urquhart, L.; Santos, M.C.; Nievinski, F.G.; Böhm, J.; Wijaya, D.D.; Schuh, H.; Ardalan, A.A.; Hobiger, T.; Ichikawa, R.; et al. Comparison of ray-tracing packages for troposphere delays. IEEE Trans. Geosci. Remote Sens. 2012, 50, 469–481. [Google Scholar] [CrossRef]
  36. Nievinski, F.G.; Santos, M.C. Ray-tracing options to mitigate the neutral atmosphere delay in GPS. Geomatica 2010, 64, 191–207. [Google Scholar] [CrossRef]
  37. Minzner, R.A.; Reber, C.A.; Jacchia, L.G.; Huang, F.T.; Cole, A.E.; Kantor, A.J.; Kenesbea, T.J.; Zimmerman, S.P.; Forbes, J.M. Defining Constants, Equations, and Abbreviated Tables of the 1975 U.S. Standard Atmosphere; NASA Technical Report R-459; NASA: Washington, DC, USA, 1976. [Google Scholar]
  38. Fleming, E.L.; Chandra, S.; Barnett, J.J.; Corney, M. Zonal mean temperature, pressure, zonal wind and geopotential height as functions of latitude. Adv. Space Res. 1990, 10, 11–59. [Google Scholar] [CrossRef]
  39. Bevis, M.; Businger, S.; Herring, T.A.; Rocken, C.; Anthes, R.A.; Ware, R.H. GPS meteorology: Remote sensing of atmospheric water vapor using the global positioning system. J. Geophys. Res. 1992, 97, 15787. [Google Scholar] [CrossRef]
  40. Boudouris, G. On the index of refraction of air, the absorption and dispersion of centimeterwaves by gases. J. Res. Natl. Bur. Stand. Sect. D Radio Propag. 1963, 67D, 631. [Google Scholar] [CrossRef]
  41. Thayer, G.D. An improved equation for the radio refractive index of air. Radio Sci. 1974, 9, 803–807. [Google Scholar] [CrossRef]
  42. Rüeger, J.M. Refractive Index Formulae for Radio Waves. In Proceedings of the FIG Technical Program; FIG XXII International Congress: Washington, DC, USA, 2002; pp. 1–13. [Google Scholar]
  43. Bevis, M. GPS meteorology: Mapping zenith wet delays onto precipitable water. J. Appl. Meteorol. 1994, 33, 379–386. [Google Scholar] [CrossRef]
  44. Boehm, J.; Schuh, H. Vienna Mapping Functions. In Proceedings of the 16th Working Meeting on European VLBI for Geodesy and Astrometry, Leipzig, Germany, 9–10 May 2003; pp. 131–143. [Google Scholar]
  45. Hobiger, T.; Ichikawa, R.; Koyama, Y.; Kondo, T. Fast and accurate ray-tracing algorithms for real-time space geodetic applications using numerical weather models. J. Geophys. Res. Atmos. 2008, 113, 1–14. [Google Scholar] [CrossRef]
  46. Herring, T.A. Modeling Atmospheric Delays in the Analysis of Space Deodetic Data. In Proceedings of the Symposium on Refraction of Transatmospheric Signals in Geodesy, The Hague, The Netherlands, 19–22 May 1992; Netherlands Geodetic Commission Publications on Geodesy: Delft, The Netherlands, 1992; pp. 157–164. [Google Scholar]
  47. Rüeger, J.M. Refractive Indices of Light, Infrared and Radio Waves in the Atmosphere; School of Surveying and Spatial Information Systems, UNSW: New South Wales, Australia, 2002. [Google Scholar]
  48. Foster, J.; Bevis, M.; Businger, S. GPS meteorology: Sliding-window analysis. J. Atmos. Ocean. Technol. 2005, 22, 687–695. [Google Scholar] [CrossRef] [Green Version]
  49. Bender, P.L. Atmospheric refraction and satellite laser ranging. Bull. Am. Astron. Soc. 1992, 1, 27–33. [Google Scholar]
  50. Hauser, J.P. Effects of Deviations From Hydrostatic Equilibrium on Atmospheric Corrections to Satellite and Lunar Laser Range Measurements. J. Geophys. Res. 1989, 94, 182–186. [Google Scholar] [CrossRef]
  51. Fleagle, R.G.; Businger, J.A. An Introduction to Atmospheric Physics, 2nd ed.; International Geophysics Series; Academic Press: Cambridge, MA, USA, 1980. [Google Scholar]
  52. Gates, W.L.; Boyle, J.S.; Covey, C.; Dease, C.G.; Doutriaux, C.M.; Drach, R.S.; Fiorino, M.; Gleckler, P.J.; Hnilo, J.J.; Marlais, S.M.; et al. An Overview of the Results of the Atmospheric Model Intercomparison Project (AMIP I). Bull. Am. Meteorol. Soc. 1999, 80, 29–55. [Google Scholar] [CrossRef] [Green Version]
  53. Zus, F.; Dick, G.; Dousa, J.; Wickert, J. Systematic errors of mapping functions which are based on the VMF1 concept. GPS Solut. 2015, 19, 277–286. [Google Scholar] [CrossRef]
  54. Möller, G.; Landskron, D. Atmospheric bending effects in GNSS tomography. Atmos. Meas. Tech. 2019, 12, 23–34. [Google Scholar] [CrossRef] [Green Version]
  55. Zhang, F.; Barriot, J.; Xu, G.; Hopuare, M. Modeling the Slant Wet Delays From One GPS Receiver as a Series Expansion With Respect to Time and Space: Theory and an Example of Application for the Tahiti Island. IEEE Trans. Geosci. Remote Sens. 2020, 1, 1–13. [Google Scholar] [CrossRef]
  56. Yang, Z.; Liu, H.; Qian, C.; Shu, B.; Zhang, L.; Xu, X.; Zhang, Y. Real-Time Estimation of Low Earth Orbit (LEO) Satellite Clock Based on Ground Tracking Stations. Remote Sens. 2020, 1–18. [Google Scholar] [CrossRef]
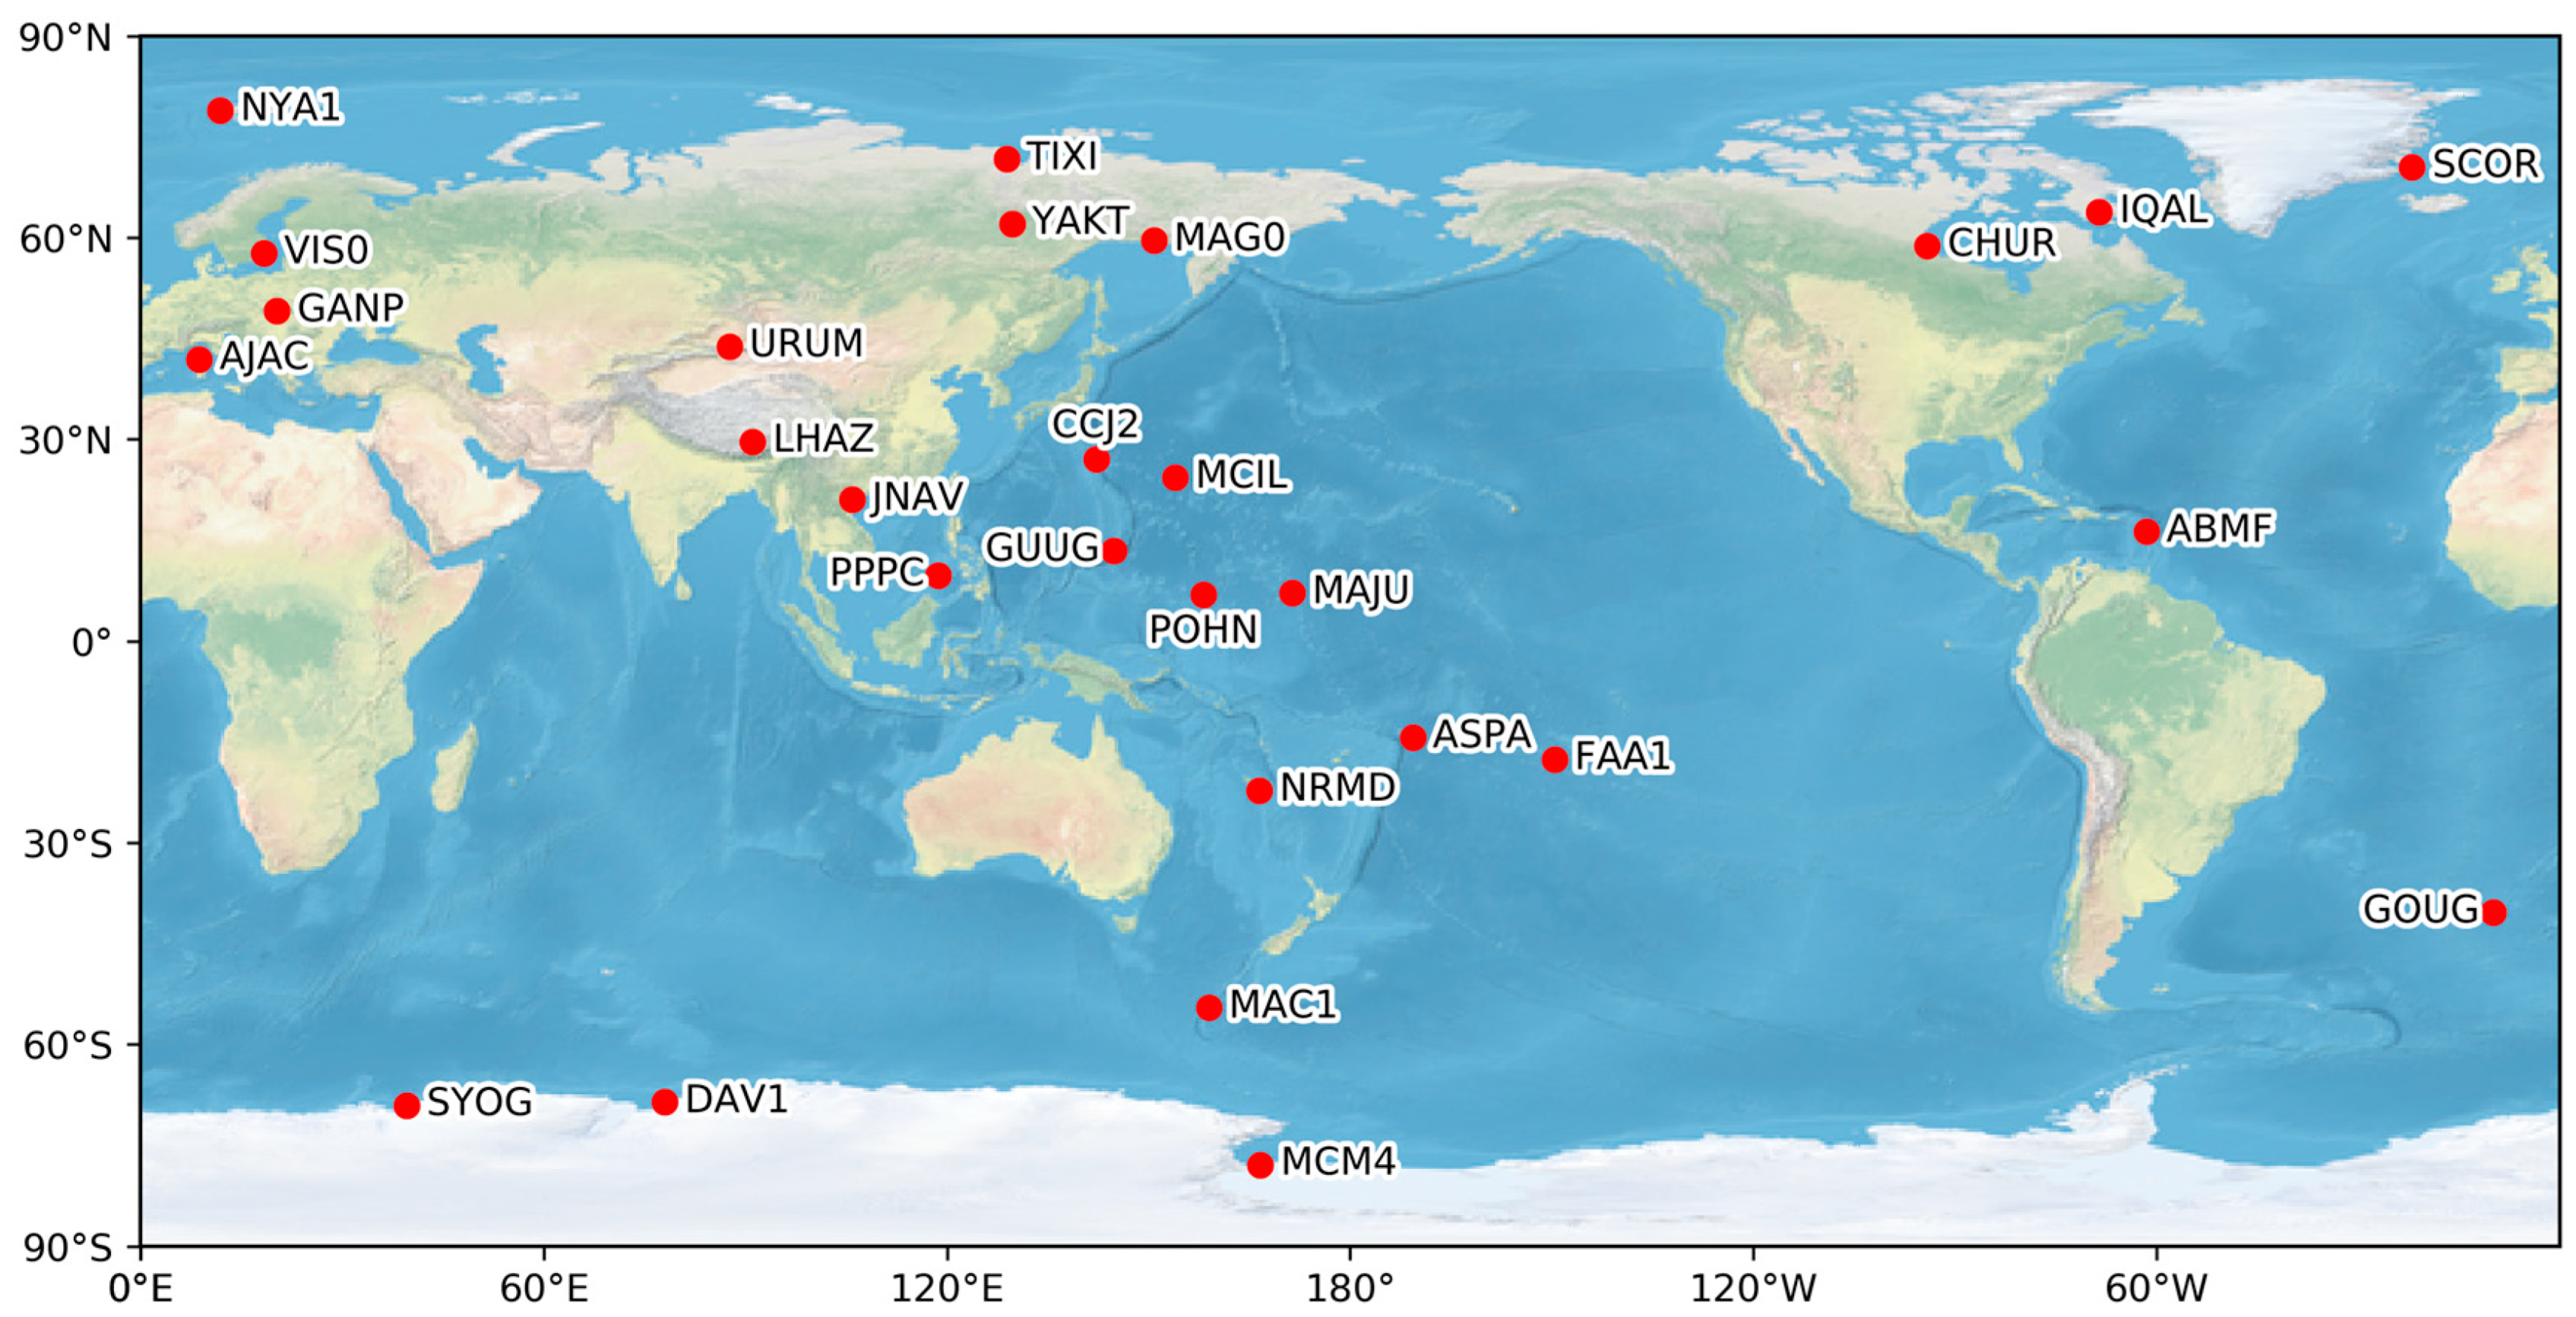
Figure 1. Global distribution of VMF1/VMF3 radiosonde close sites used in this study.
Remotesensing 12 03337 g001
Figure 2. Example of data rejection for incomplete records by using monthly mean tropopause height estimates. Tropopause raw (in yellow), mean tropopause (in red), and highest radiosonde altitude (in blue) are shown for the stations of FAA1 on Tahiti island in the southern Pacific, CCJ2 on Ogasawara Islands in Japan, GUUG in Guam in the western Pacific, AJAC in Ajaccio in France, CHUR in CHURCHILL in Canada, and YAKT in Yakutsk of Russian. Radiosonde data records which ended below the red line were not used in this study (see Table 3 for radiosonde data rejection rates based on these mean tropopause heights).
Remotesensing 12 03337 g002
Figure 3. Mean biases and standard deviations between Saastamoinen derived zenith hydrostatic delay (ZHD) estimates and radiosonde ZHD estimates for the 28 stations of this study. The radiosonde ZHD estimates were computed either from the ground (blue arrows) or from ground + 1000 m (green arrows).
Remotesensing 12 03337 g003
Figure 4. Example of modified Saastamoinen ZHD estimates (purple) and radiosonde derived ZHD estimates (yellow) biases, with respect to Saastamoinen ZHD estimates. The station DAV1 is located on the Antarctica coast, LHAZ is on the Tibet plateau, FAA1 is located on Tahiti island, and POHN is on Pohnpei island of the Federated States of Micronesia.
Remotesensing 12 03337 g004
Figure 5. Seasonal biases examples for GANP station (Ganovce, Slovakia, altitude 703 m), LHAZ station (Lhasa, China, altitude 3650 m), URUM station (Urumqi, China, altitude 919 m), and YAKT station (Yakutsk, Russian, altitude 98 m). The series of differences were calculated at ground + 1000 m altitude, with the exception of the LHAZ station (ground level).
Remotesensing 12 03337 g005
Figure 6. (a) Distribution of stations with seasonal biases between Saastamoinen ZHD estimates and radiosonde + ISA76 integrated ZHD estimates. The biases were fitted by a yearly sine function, including a phase factor. An upper (respectively lower) arrow means that the amplitude of the sine function was positive (respectively negative). No arrow means that no seasonal signal was visible. The statistics of the fit by the seasonal yearly sine function can be found in Table 5 (post-fit rows). (b) January and June 2018 worldwide pressure fields from the European Centre for Medium-Range Weather Forecasts (ECMWF) database [52]. This figure is to be compared with (a). The Antarctica coast is characterized by a ring of wind (Antarctic Circumpolar Current) that could be responsible for the seasonal excess value of Saastamoinen ZHD.
Remotesensing 12 03337 g006aRemotesensing 12 03337 g006b
Figure 7. Root mean square (RMS) of VMF1/VMF3 hydrostatic mapping function SHD estimates with respect to radiosonde + ISA76 SHD estimates obtained by ray-tracing in mm, for the 28 stations of this study, over 3 years (1 January 2016 to 31 December 2018). Cross marks stand for the VMF3 SHD estimates, and circle marks stand for the VMF1 SHD estimates (they are plotted with a small horizontal shift to avoid overlapping). The color bar indicates the station latitudes.
Remotesensing 12 03337 g007
Figure 8. Mean biases between the VMF1/VMF3 SHD estimates with respect to radiosonde + ISA76 SHD estimates by ray-tracing in mm, for the 28 stations of this study, over a 3-year period (1 January 2016 to 31 December 2018). Circle marks stand for the VMF1 case, and cross marks stand for the VMF3 case (the two cases are plotted with a small horizontal shift to avoid overlapping). The color bar indicates the station latitudes.
Remotesensing 12 03337 g008
Figure 9. Standard deviations of the biases between the VMF3/VMF1 SHD estimates with respect to radiosonde + ISA76 SHD estimates by ray-tracing in mm, for the 28 stations of this study, over a 3-year period (1 January 2016 to 31 December 2018). The circle stands for the VMF1 case, and cross marks stand for the VMF3 case (the two cases are plotted with a small horizontal shift to avoid overlapping). The color bar indicates the station latitudes.
Remotesensing 12 03337 g009
Figure 10. Time series of the biases between VMF1 and VMF3 SHD estimates with respect to radiosonde + ISA76 SHD estimates by ray-tracing for the two stations DAV1 (Antarctica) and SCOR (Iceland) for 3°, 7°, and 15° elevation angles.
Remotesensing 12 03337 g010
Figure 11. Standard deviations of biases for VMF1 and VMF3 SHD estimates with respect to radiosonde + ISA76 SHD estimates by ray-tracing for a 5° elevation angle, for the 28 stations of this study, over a 3-year period (1 January 2016 to 31 December 2018). The pre-fit and the post-fit are the standard deviations for the biases series before and after a yearly sine function fitting.
Remotesensing 12 03337 g011
Figure 12. RMS of VMF1/VMF3 SWD estimates with reference to radiosonde SWD estimates from ray-tracing in mm. Cross marks stand for VMF3 estimates, and circle marks stand for VMF1 estimates (they are plotted with a small horizontal shift to avoid overlapping), for the 28 stations of this study, over a 3-year period (1 January 2016 to 31 December 2018). The color bar indicates the station latitudes.
Remotesensing 12 03337 g012
Figure 13. Mean biases of VMF3/VMF1 SWD with respect to radiosonde SWD estimates from ray-tracing in mm. Cross marks stand for VMF3 SWD biases, and circle marks stand for VMF1 SWD biases (they are plotted with small a horizontal shift to avoid covering). The color bar indicates the station latitudes.
Remotesensing 12 03337 g013
Figure 14. Standard deviations of VMF3/VMF1 SWD biases with reference to radiosonde SWD estimates from ray-tracing in mm. Cross marks stand for VMF3 SWD biases, and circle marks stand for VMF1 SWD biases (they are plotted with a small horizontal shift to avoid covering). The color bar indicates the station latitudes.
Remotesensing 12 03337 g014
Table 1. Summary of VMF1 and VMF3 and radiosonde products.
VMF1 SiteVMF1 GridVMF3 SiteVMF3 GridRadiosonde
Lowest Elevation
Output a h , b h , c h
a w , b w , c w
a h , b h , c h
a w , b w , c w
a h , b h , c h
a w , b w , c w
a h , b h , c h
a w , b w , c w
Pressure, temperature, water vapor
Spatial resolutionIGS/VLBI sites   ×   2.5°IGS/VLBI sites   ×   Radiosonde sites
Temporal Resolution6 h6 h6 h6 h12 h
Height and DatumEllipsoidal height in IGS sitesEllipsoidal height, altitude 0Ellipsoidal height in IGS sitesEllipsoidal height, altitude 0Geopotential height
IGS: International GNSS Service (IGS); VLBI: Very Long Baseline Interferometry.
Table 2. Coordinates of radiosonde and VMF stations in Figure 1 and their horizontal distance.
Radiosonde CodeLatitude (°)Longitude (°)Orthometric Height (m)VMF StationEllipsoid Height (m)Orthometric Height (m)Horizontal Distance (km)
SVM0000100478.923311.922215.5NYA18448.41.3
RSM0002182471.5833128.91676TIXI4753.95.5
GLM0000433970.4844−21.951170SCOR128.571.50.6
CAM0007190963.7500−68.550021.9IQAL91.7102.12.3
RSM0002495962.0167129.716798.3YAKT103.4108.92.4
RSM0002591359.5500150.7833115.3MAG0361.9345.13.4
CAM0007191358.7333−94.066728.5CHUR−18.929.33.3
SWM0000259157.650018.350045VIS079.854.71.2
LOM0001195249.033320.3167703GANP746703.90.4
CHM0005146343.783387.6167919URUM858.9922.33.3
FRM0000776141.91818.79286AJAC9950.33.0
CHM0005559129.666791.13333650LHAZ36223656.73.3
JAM0004797127.0922142.19142.7CCJ2104.255.32.6
JAM0004799124.2883153.98337.1MCIL35.710.10.6
VMM0004882021.0333105.80005JNAV34.963.15.6
GPM0007889716.2639−61.516411ABMF−2515.91.5
GQM0009121213.4767144.794475.4GUUG134.779.85.2
RPM000986189.7403118.758613PPPC66.516.13.9
RMM000913767.0864171.39083.4MAJU33.95.15.0
FMM000913486.9500158.200038POHN90.739.41.6
AQM00091765−14.3383−170.71905.5ASPA53.721.10.9
FPM00091938−17.5553−149.61502FAA112.34.80.7
NCM00091592−22.2761166.452870NRMD160.4100.15.8
SHM00068906−40.3500−9.880054GOUG81.356.6<0.1
ASM00094998−54.4994158.93706MAC1−6.712.40.2
AYM00089571−68.574477.967218DAV144.527.20.6
AYM00089532−69.005339.581118.4SYOG50.127.90.5
AYM00089664−77.8500166.666724MCM498150.51.1
Table 3. Radiosonde data rejection rates using mean tropopause height estimates for all the 28 stations of this study (see Figure 2 for the definition of the mean tropopause height).
StationsASPAMAC1SYOGDAV1FAA1SCORMCIL
Data Usable2048211921781834206920872089
Rejection Rate (%)0.90.300.33.20.74.1
Mean Tropopause (km)16.210.510.19.91610.116.2
StationsGANPGOUGMCM4POHNABMFNYA1VIS0
Data Usable2149182216862036154017642000
Rejection Rate (%)01.90.41.32.100.2
Mean Tropopause (km)1212.48.916.4169.911
StationsIQALCCJ2YAKTCHURURUMLHAZAJAC
Data Usable1933203220852036214020722105
Rejection (%)0.26.640.31.34.61.2
Mean Tropopause (km)916.19.89.912.616.312.9
StationsPPPCMAG0GUUGNRMDMAJUTIXIJNAV
Data Usable1737213421222112211019982020
Rejection Rate (%)6.81.90.731.66.22.1
Mean Tropopause (km)16.59.916.41616.49.516.4
Table 4. Details of the ray-tracing algorithm used in this work.
Data SourcesStopping Height (km)Supplementary AtmosphereGravityCurvature of the EarthInterpolationMethod
Radiosonde100ISA 1976EGM2008Gaussian RadiusPressure: log-linear
Vapor Pressure: log-linear
Temperature: linear
2D
ISA 1976: US 1976 standard atmosphere; EGM2008: Earth Gravitational Model 2008.
Table 6. Mean RMS, bias, and standard deviation for 28 stations, 3 years of wet VMF1 and VMF3 compared to radiosonde in mm.
Elevation Angle30°25°20°15°10°
RMS (VMF1)0.040.080.150.371.23.17.020.3
RMS (VMF3)0.060.120.230.551.84.811.436.9
Bias (VMF1)0.030.050.100.240.772.04.613.2
Bias (VMF3)0.020.040.090.210.661.73.710.3
STD (VMF1)0.030.050.110.250.812.14.814.1
STD (VMF3)0.050.100.190.461.54.19.933.0