Article

Precipitation Regime Classification Based on Cloud-Top Temperature Time Series for Spatially-Varied Parameterization of Precipitation Models

1
Department of Water Management, Delft University of Technology, Stevinweg 1, 2628 CN Delft, The Netherlands
2
Delft Institute of Applied Mathematics, Delft University of Technology, Van Mourik Broekmanweg 6, 2628 XE Delft, The Netherlands
3
Environmental Hydrodynamics, Deltares, 2600 MH Delft, The Netherlands
*
Author to whom correspondence should be addressed.
Remote Sens. 2020, 12(2), 289; https://doi.org/10.3390/rs12020289
Submission received: 14 December 2019 / Revised: 10 January 2020 / Accepted: 12 January 2020 / Published: 16 January 2020

Abstract

:
Satellite and reanalysis precipitation products perform poorly over regions with low-density ground observation networks. In order to improve space-dependent parameterization of precipitation estimation models in data-scarce environments, the delineation boundaries of precipitation regimes should be accurately identified. Existing approaches to characterize precipitation regimes by seasonal or other climatological properties do not account for small scale spatial-temporal variability. Precipitation time series can be used to account for this small-scale variability in regime classification. Unfortunately, precipitation products with global coverage perform poorly at small time scales over data scarce regions. A methodology of using satellite-based cloud-top temperature (CTT) time series as a proxy of precipitation time series for precipitation regime classification was developed, and its potential and uncertainty were analyzed. A precipitation regime in this study was defined on the basis of characteristic small-scale temporal distribution and variability of precipitation at a given place. Dynamic time warping was used to calculate the distance between two time series. Criteria to select the optimal temporal scale of time series for clustering and the number of clusters were also developed. The method was validated over Germany and applied to Tanzania, characterized by complex climatology and low density ground observations. This approach was evaluated against precipitation regime classification based on a satellite precipitation product. Results show that CTT outcompetes satellite-based precipitation for classification of precipitation regime classification. The CTT-based classification can be used as precursor to spatially adapted precipitation estimation algorithms where parameters are calibrated by gauge data or other ground-based precipitation observations, and parameterization can be used for satellite-precipitation estimates, precipitation forecasts in numerical or stochastic weather models, etc.

Graphical Abstract

1. Introduction

Precipitation estimates at high spatial and temporal resolution are required for many meteorology, hydrology, and agriculture related applications, such as drought and flood warnings, water resources assessment and management, and sowing and irrigation planning. This need is on the increase nowadays, as extreme weather happens more frequently and more intensely, with increasing variability, due to climate change [1].
Gridded precipitation estimates can be achieved by: (i) interpolation of rain-gauge and/or other ground-based measurements, such as high-resolution gridded precipitation of the Climatic Research Unit Time Series [2], the Global Precipitation Climatology Project daily precipitation [3], and Climate Prediction Center (CPC) Unified Gauge-based analysis of daily precipitation [4]; (ii) ground-based radar precipitation estimation; (iii) reanalysis systems involving a numerical model to simulate precipitation-related physical mechanisms, such as the European Centre for Medium-range Weather Forecasts Reanalysis Interim [5] and National Centers for Environmental Prediction Climate Forecast System Reanalysis [6]; (iv) translating satellite radiance data (mostly infrared or passive microwave spectral information) to precipitation, such as Global Precipitation Climatology Project 1-Degree Daily Combination [7], the Tropical Rainfall Measuring Mission Multi-satellite Precipitation Analysis [8], Integrated Multi-satellite Retrievals for the Global Precipitation Measurement mission [9], and precipitation data derived from CPC MORPHing technique [10]; and (v) merging multiple sources of data, such as Multi-Source Weighted-Ensemble Precipitation [11] and Climate Hazards group InfraRed Precipitation with Stations [12].
The gauge or other in-situ measurements can provide direct and accurate local precipitation data at high time-resolution. However, spatial interpolations of these data are only valid over regions where the gauge density is sufficient to capture meteorological variability. The reanalysis and satellite-based gridded precipitation estimation methods provide a near-global coverage, typically at higher resolution than gauge networks, which is an attractive feature for many applications. However, they all require model/parameter calibration based on in-situ measurements (usually gauge data) to relate indirect remote sensing data or numerical precipitation simulation schemes to precipitation intensities [5,8]. Due to the high spatial and temporal variability of precipitation, it is a challenge to find calibration settings that reproduce temporal variability and to effectively extend the calibrated parameters to non-gauge locations, especially over gauge-scarce regions, such as much of Africa, southeast Asia, and Latin America [13]. A central question in developing parameterizations for precipitation estimation is to determine whether two locations belong to the same precipitation regime, so parameters at the two locations can be calibrated together, and whether parameters calibrated for one location are valid for others. This is an important reason why many precipitation products are performing much better at gauge-dense regions (such as Europe and US) than at gauge-scarce regions (such as Africa) [14]. For a full review of products over Africa, see [15]. For precipitation products using globally uniform parameters, data-scarce regions are strongly underrepresented in the calibration process. Even for products using spatially varied parameters, there can be large representitiveness errors over regions with low gauge-density.
To improve parameterization, schemes for precipitation estimation should use spatially varied parameters based on reliable classification of precipitation regimes. To do this, a reliable method is needed to identify: (1) which gauges have similar precipitation patterns so their data can be used together for parameter calibration, and (2) for non-gauge locations, which regime they belong to, so appropriate parameters can be selected for creating precipitation estimates.
Current methods for precipitation regime classification have two shortcomings. First, features of annual or seasonal precipitation patterns from long-term average climatologies are used for classification [16,17], such as annual mean, and maximum or minimum monthly means for a whole year, summer or winter seasons, etc. These features lack temporal variability and are not sufficient for the aim of replicating precipitation variability. To improve classification of precipitation regimes for spatially varied precipitation estimation, other features and statistical properties of precipitation should also be included to characterize the precipitation regime, such as dry-spell and wet-spell distribution, onset and the length of the wet season, occurrence and length of precipitation events, etc. These properties can be fully represented in time series of spatially varied precipitation estimates. Second, they use gridded precipitation estimates or data from weather stations [16,17], which have large uncertainties and representativeness errors over gauge-scarce regions. One possible solution is to use a time series extracted from a precipitation proxy dataset that has good spatial coverage and resolution, and is close to source data directly measured by satellite. This way, fewer uncertainties are introduced and it avoids intrinsic errors in the precipitation estimation products.
Cloud-top temperature (CTT) is one of the commonly used precipitation proxies, and many algorithms or indices for cloud classification and precipitation estimation have been developed from it. For instance, Arkin and Meisner [18] proposed the geostationary operational environmental satellite (GOES) precipitation index (GPI), which assigns a constant precipitation rate to pixels with a CTT below 235 K. Later on, a series of adjustments on GPIs were developed by giving time and space-calibrated GPIs [19], making the parameters variable in space or time [20], or fitting another CTT-precipitation relationship, such as a power-law function [21]. Precipitation products Climate Hazards group InfraRed Precipitation with Stations [12] and Tropical Applications of Meteorology using SATellite data and ground-based observations [22] link precipitation rates to the duration time of a cold cloud (with CTT below a precipitation-specified threshold, e.g., 235 K). More complicated schemes like Precipitation Estimation from Remotely Sensed Information using Artificial Neural Networks (PERSIANN) [23] and PERSIANN Cloud Classification System [24], use coldness variations in the neighborhood of a pixel or other coldness features of a cloud patch to estimate precipitation, classify cloud features into groups, and link precipitation rates to each group. This implies that CTT and precipitation are strongly related, and CTT time series can be used as an alternative to precipitation data to characterize and classify precipitation regimes.
In this study, we explored the potential of using CTT time series for precipitation regime classification. We define the precipitation regimes on the basis of similarity in characteristic small-scale temporal distribution and variability of precipitation at a given place. These temporal characteristics indirectly reflect loosely the physical association with oceanic and continental influences, latitude and physiography. To solve the space-time mismatch between satellite and ground observations, we used dynamic time warping (DTW, [25]) to find the optimal alignment between time series. We applied the method in two regions with very dense and sparse gauge networks and to a satellite-based precipitation dataset, to evaluate the performance. This work can be viewed as a precursor for developing regime-specific CTT-precipitation estimation models in our next research step. Such a regime-specific model will be computationally fast, since the parameterization is implemented offline, after which precipitation estimation will be applied separately for each individual regime. The regime classification method can also be used for other precipitation models that require parameter calibration by gauge data, especially over gauge-scarce regions.
The paper is organized as follows. Section 2 describes the datasets used in this study and the data preprocessing. Section 3 presents the methodology for precipitation regime classification, and for the extension of gauge-calibrated parameters to the whole regime domain. Section 4 shows results on exploration and interpretation of the CTT-precipitation relationships, followed by testing and validation of the methodology over Tanzania and Germany. Conclusions are presented in Section 5.

2. Datasets

2.1. Precipitation Climatology and Data for the Two Study Regions

Germany’s precipitation patterns are largely controlled by atmospheric cyclones embedded in general mid-latitude circulation [26]. Therefore, frontal or cyclonic precipitation occurs frequently under low-altitude clouds with relatively higher cloud temperature compared to convective precipitation. For Tanzania, tropical convective precipitation influenced by the intertropical convergence zone dominates the precipitation system. These storms are usually linked to low cloud temperature in the high-altitude clouds and are accompanied by a drop in the cloud temperature during the rising and cooling process of clouds [27].
Over Germany, quality-controlled rain-gauge data provided by Deutscher WetterDienst Climate Data Center (CDC) were used at daily scale, which can be downloaded from link (ftp://ftp-cdc.dwd.de/pub/CDC/observations_germany/climate/daily/more_precip/historical/). The quality control steps are explained by Kaspar et al. [28]. The data used in this study were collected from 728 DWD stations, covering the period from 2000 to 2015, with their locations shown in Figure 1a. The 728 stations were selected such that their data cover the period of study, and that one grid cell (at resolution 0 . 25 × 0 . 25 ) contains at most one station. This dataset represents one of the highest gauge density networks worldwide.
For Tanzania, daily rain-gauge data of high quality from the Tanzania Meteorological Agency (TMA) were used, which cover the years from 1970 to 2006. These country-level records can only be accessed privately and contain more data than those that are publicly available. Locations of the 16 TMA stations and topographical information of Tanzania are illustrated in Figure 1b. This dataset represents gauge density in data-scarce regions [13].
CTT time series on a daily scale were extracted from CM SAF cLouds, Albedo RAdiation data record, AVHRR-based, Edition 2 (CLARA-A2) product, which covers the period from 1982 until 2015, with a spatial resolution of 0 . 25 × 0 . 25 [29]. This product can be accessed by link (https://wui.cmsaf.eu/safira/action/viewProduktDetails?eid=21482&fid=18).
Satellite-based precipitation time series were extracted from CMORPH, a precipitation dataset based on CPC MORPHing technique; they cover years 1998 to present, with a spatial resolution of 0 . 25 × 0 . 25 [10]. This dataset can be downloaded from link (ftp://ftp.cpc.ncep.noaa.gov/precip/CMORPH_V0.x/RAW/0.25deg-DLY_00Z). There are also two other CMORPH products which merge gauge data; however, the chosen satellite-only dataset avoids bias towards gauged pixels as a result of the gauge-based merging. We chose to use CMORPH, because it is a satellite-only product with quasi-global coverage. It covers latitudes 60 S–60 N (https://www.cpc.ncep.noaa.gov/products/janowiak/cmorph_description.html), including Germany but not the polar regions. In fact, any satellite-only product with appropriate temporal and spatial coverage could have been used for the purpose of comparison to the CTT-based analysis. The aim is merely to provide a benchmark against which to compare the performance of CTT-based analysis when accounting for small scale spatial-temporal variability.
Based on the completeness of datasets in precipitation and CTT time series, the period 2000–2006 was selected over Tanzania, and 2000–2015 over Germany.

2.2. Data Preprocessing

Two data preprocessing steps were conducted. First was to fill in data gaps and second was to aggregate data from daily to 5-day moving average (i.e., mean of values over the previous n days), pentadal (5-day), dekadal (10-day), and monthly scales to investigate different time scales. We defined every calendar month to contain six pentads and three dekads; i.e., not exactly 5-days or 10 days for the last slots of some months.
CLARA contains 2.7% and 2.5% missing data over Germany and Tanzania, respectively; CMORPH contains 0.006% and 0%; TMA stations contain 0.09%; and CDC stations contain 0.003%. In-filling of missing data was conducted by different interpolation approaches for gauge data and satellite-based datasets. Missing data from the gauge precipitation time series were filled in by simply interpolating between the temporally closest good data, since the data gaps were small. Missing data from CLARA CTT and CMORPH precipitation gridded data were filled in by radial basis function interpolation [30] of good data in a neighborhood with spatial (horizontal) influence distance of σ h = 150 (km) (equivalent to about 5 pixels) and temporal influence distance of σ t = 3 (day). The weights were computed by normalizing a Gaussian kernel of the interpolated data computed by Equation (1):
w e i g h t ( d h , d t ) = e - d h 2 2 σ h 2 - f t d t 2 2 σ t 2 ,
where d h denotes the horizontal distance between interpolated data and target data, d t denotes the time difference, and f t = 2 is the scaling factor of temporal weighting. New time series of CTT and precipitation at a daily scale were extracted from the filled-in datasets, which were used to compute the 5-day moving-average, pentadal, dekadal, and monthly time series.

3. Methodology

3.1. Methodological Framework

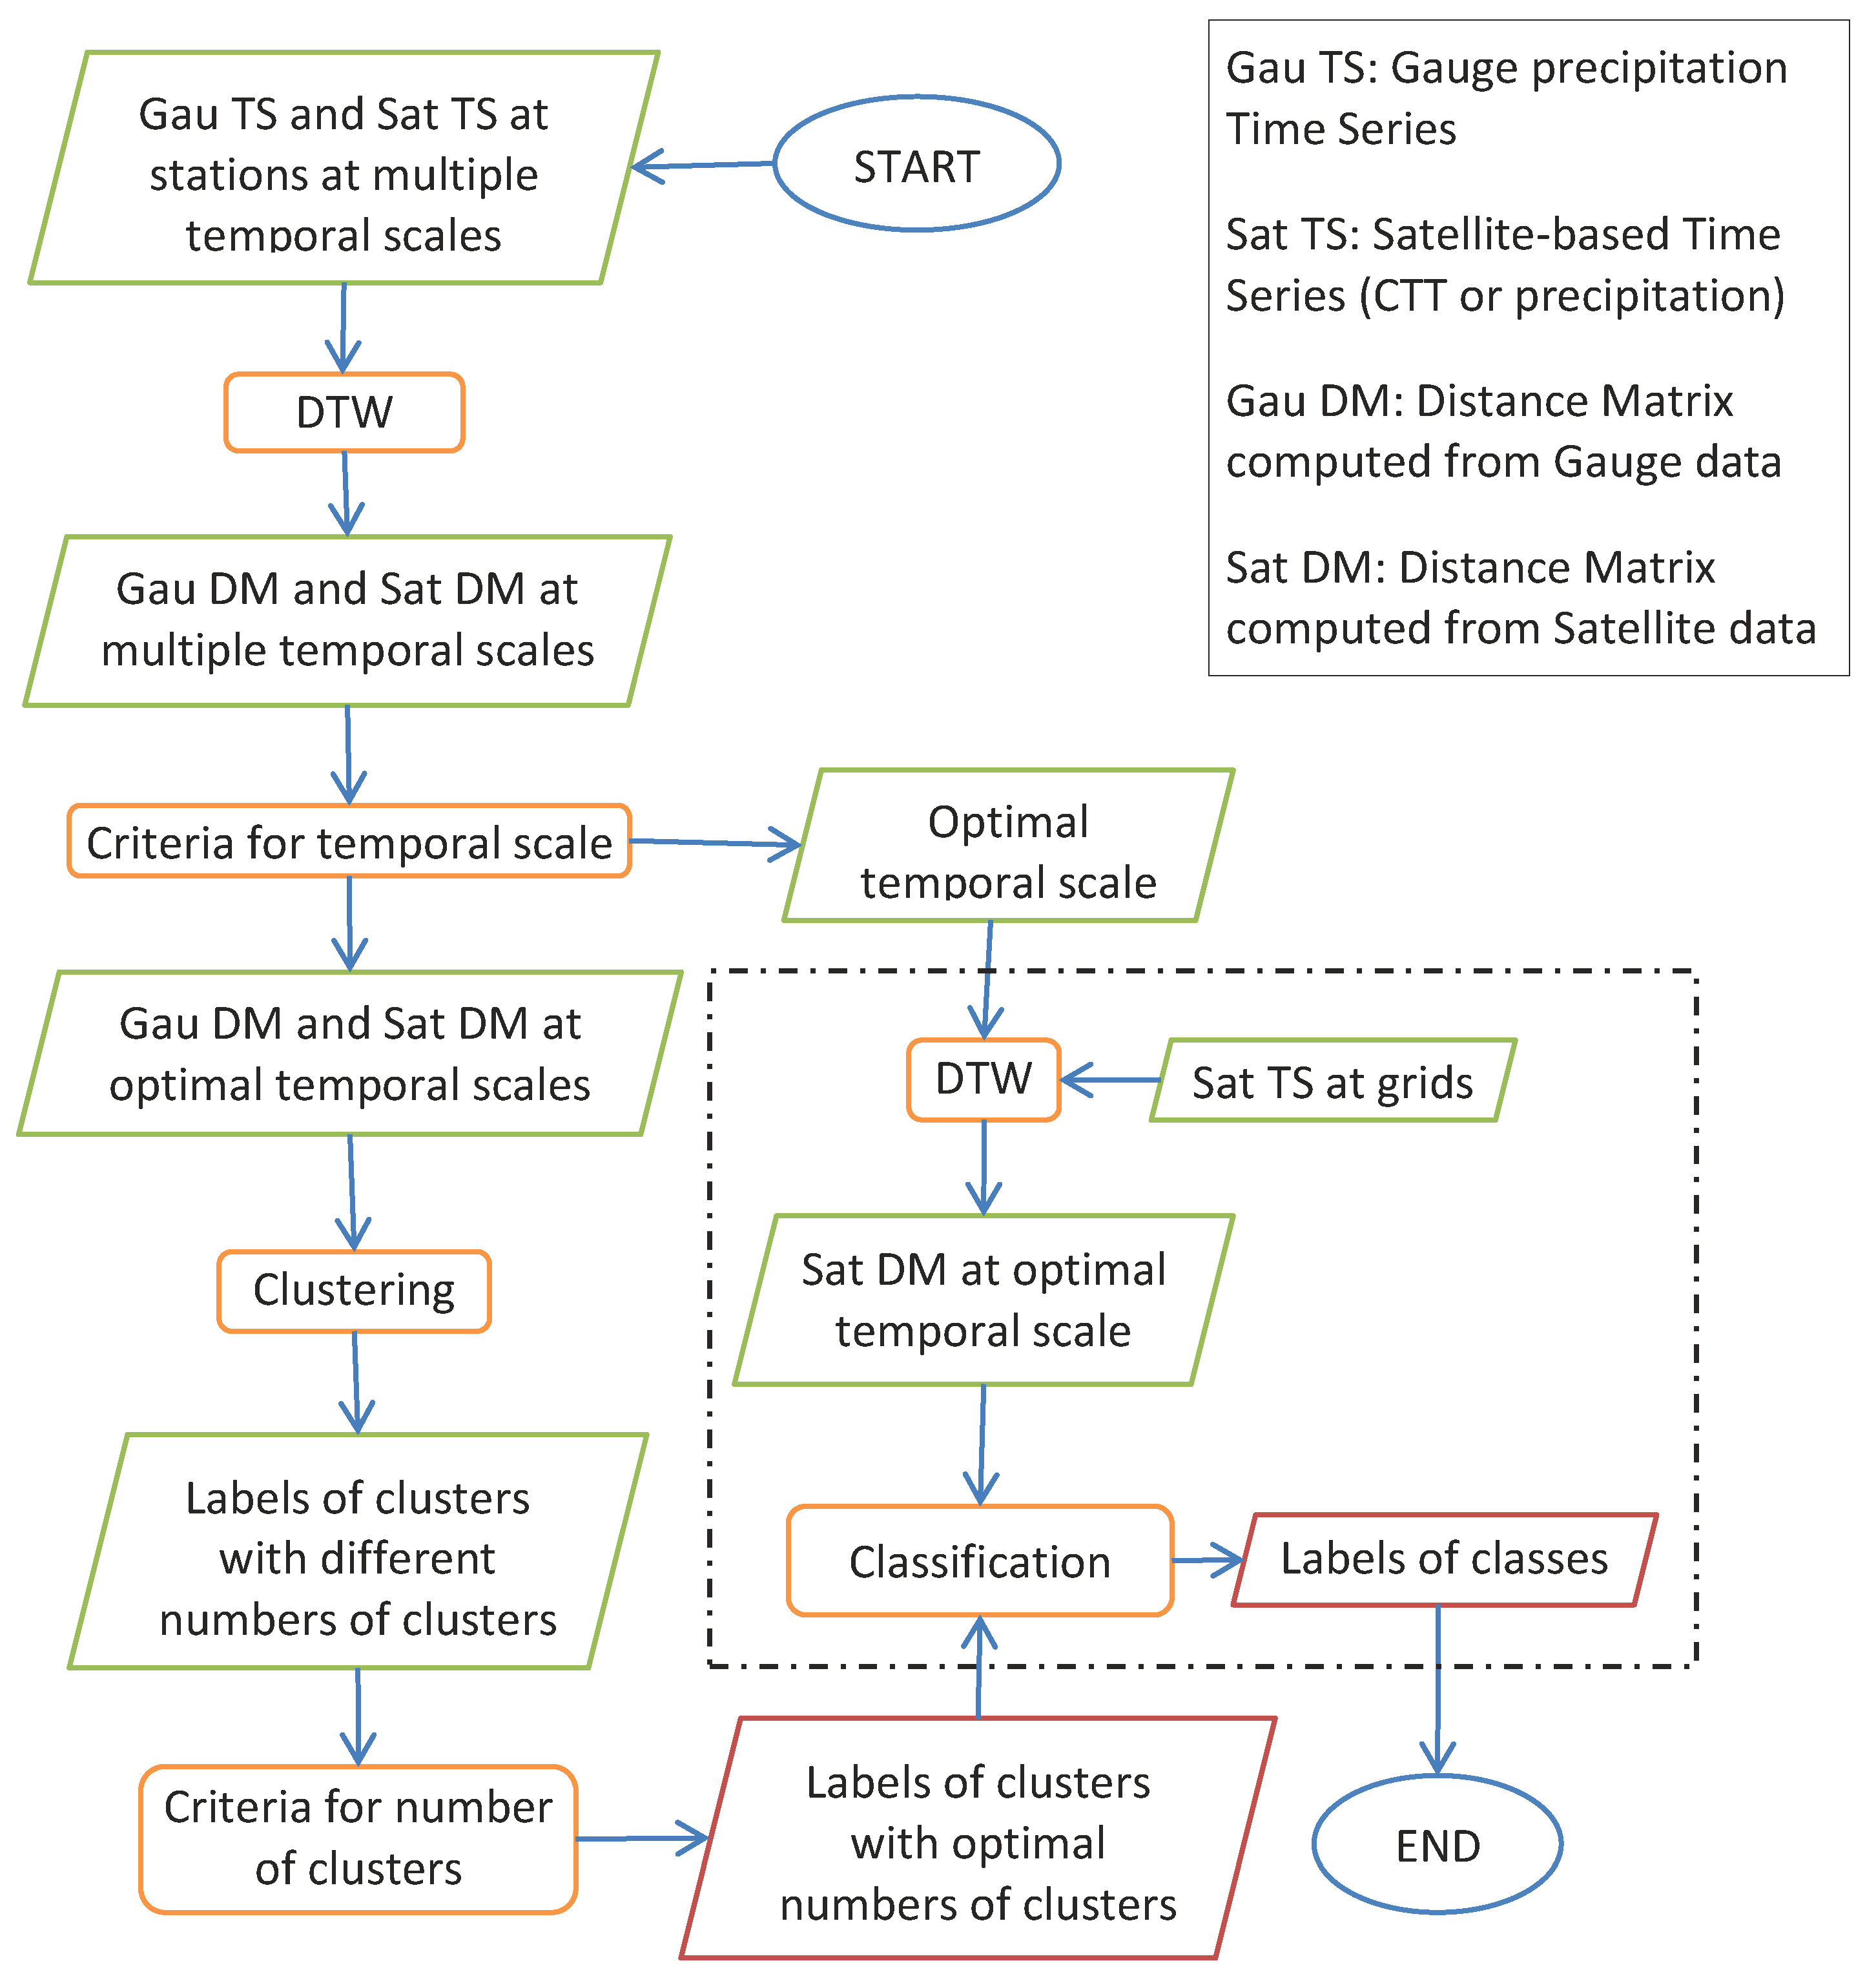
In order to effectively classify precipitation regimes using a precipitation proxy (CTT) with the help of in-situ observations (from gauges), we follow two steps, as illustrated in Figure 2. First, our proposed method clusters the gauges by clustering the satellite grid cells overlapping rain gauge locations based on similarity of precipitation regime. The precipitation regime is represented by time series of a proxy, in our case, CTT. Similarity of time series is computed by DTW as explained in Section 3.3. To achieve the most effective clustering and regime classification results, we search the optimal parameters for clustering, such as the optimal time scale and optimal number of regimes, based on criteria we developed, as explained in Section 3.4 and Section 3.5, respectively. Second, we used CTT time series to assign satellite grid cells in the whole domain to the identified precipitation regime clusters. Eventually, to investigate whether, using CTT, a precipitation predictor closer to source data is better than using precipitation estimates to classify precipitation regime, we applied the clustering-classification procedure to a reference precipitation product, CMORPH.
We have two study regions: Germany and Tanzania. Over Germany with high gauge density, the method was tested and validated. The gauges were divided into a “clustering” group and a “classification” group. Only 5 % (37) of the CDC stations were used for clustering, to mimic a gauge-scarce environment, and 95 % (691) of independent CDC stations were used for classification as validation. Cross validation was also conducted by resampling the 37 stations (for clustering) and repeating the whole process to test the robustness of the method. Over Tanzania, where stations are sparsely-distributed, the method was applied using all 16 TMA stations for clustering, after which satellite grid cells were classified according to the clusters. Both CTT and CMORPH data were applied and compared over the two regions. Since both datasets have a spatial resolution of 0 . 25 , the sizes of the grid cells in both regions are also 0 . 25 .
To summarize, we used time series from the same satellite-based datasets (either CTT or precipitation) for clustering and classification. Gauge data were used in clustering for optimal parameter searching procedure over both Germany and Tanzania, and for classification over Germany for validation.

3.2. Clustering of Stations and Classification of Satellite Grid Cells

Clustering is a technique that groups similar data points, such that a data point is more similar to a point in its own group than to any points in other groups (single-linkage), more similar to its group average than to other group averages (average-linkage), or following other linkage criteria. If the number of objects is large, k-means clustering is a preferred, as it has lower computational cost. Since the number of objects (i.e., 16 TMA stations and 5 % of CDC stations) was small in our case, hierarchical clustering was used, which is based on the dissimilarity distances between each possible pair of data points and pairs of clusters. Each data point starts as its own cluster (group), and the most similar pairs of clusters are merged to move up the hierarchy. A dendrogram can be used to show the hierarchy of clusters in a distance tree, as illustrated by Figure 3a. The tree can be cut by a threshold to form clusters. The threshold can be preset based on maximum distance or can be based on a preset number of clusters as needed. The latter was used.
Satellite-based time series (either CTT or precipitation) at pixel-containing stations were used to cluster the pixels representing the same precipitation regime based on dissimilarity distances, as explained in Section 3.3. This can be viewed as clustering of the stations. Average-linkage was applied to obtain clusters of stations, since the center (i.e., the mean) of a cluster was assumed to be most representative of its climatology.
Classification is a technique to assign data points to a set of predefined classes, in this case, the K clusters identified in the previous step. A given grid cell will be assigned to the cluster having the most similar satellite-based time series; i.e., having the smallest distance value computed by DTW (in Section 3.3). Over Germany, 95 % of CDC stations, an imitation of grids in the country, were classified to the clusters of the other 5 % of CDC stations using satellite data. Then, a comparison was made between results of clustering and classification using gauge data for validation. Over Tanzania, satellite grid cells were classified by satellite-based time series to the clusters of TMA stations identified based on time series from the same satellite-based datasets.

3.3. Time Series Distance Using Dynamic Time Warping

Clustering and classification techniques require a dissimilarity distance measure between data points, in our case, time series. As shown in Figure 2, distance matrices were generated from gauge- or satellited-based time series. Minkowski distance was used to compute the distance of two time series at different locations, following Equation (2):
D M i n k ( X , Y ) = ( i | X i - Y i | p ) 1 / p ,
where both X and Y are either CTT or precipitation time series, X i and Y i are the elements of time series series X and Y, respectively, at time level i. The value of p was chosen as 1 or 2 for tests in this study. When p = 2 , the distance is more sensitive to large distance values at some time levels, such as days with extreme precipitation, similar to root mean square error, while p = 1 indicates more of the average of the distances between X and Y over all time levels, resembling mean absolute error.
It is a challenge to find a match for identifying moving storms in different time series, or to relate multiple precipitation events in two time series to the same precipitation season. Therefore, dynamic time warping (DTW, [25]) was used to find the optimal alignment along the time axis between X and Y based on the defined distance measure (Equation (2)), following Equation (3):
D D T W ( X , Y ) = ( i | X i - Y i j | p ) 1 / p ,
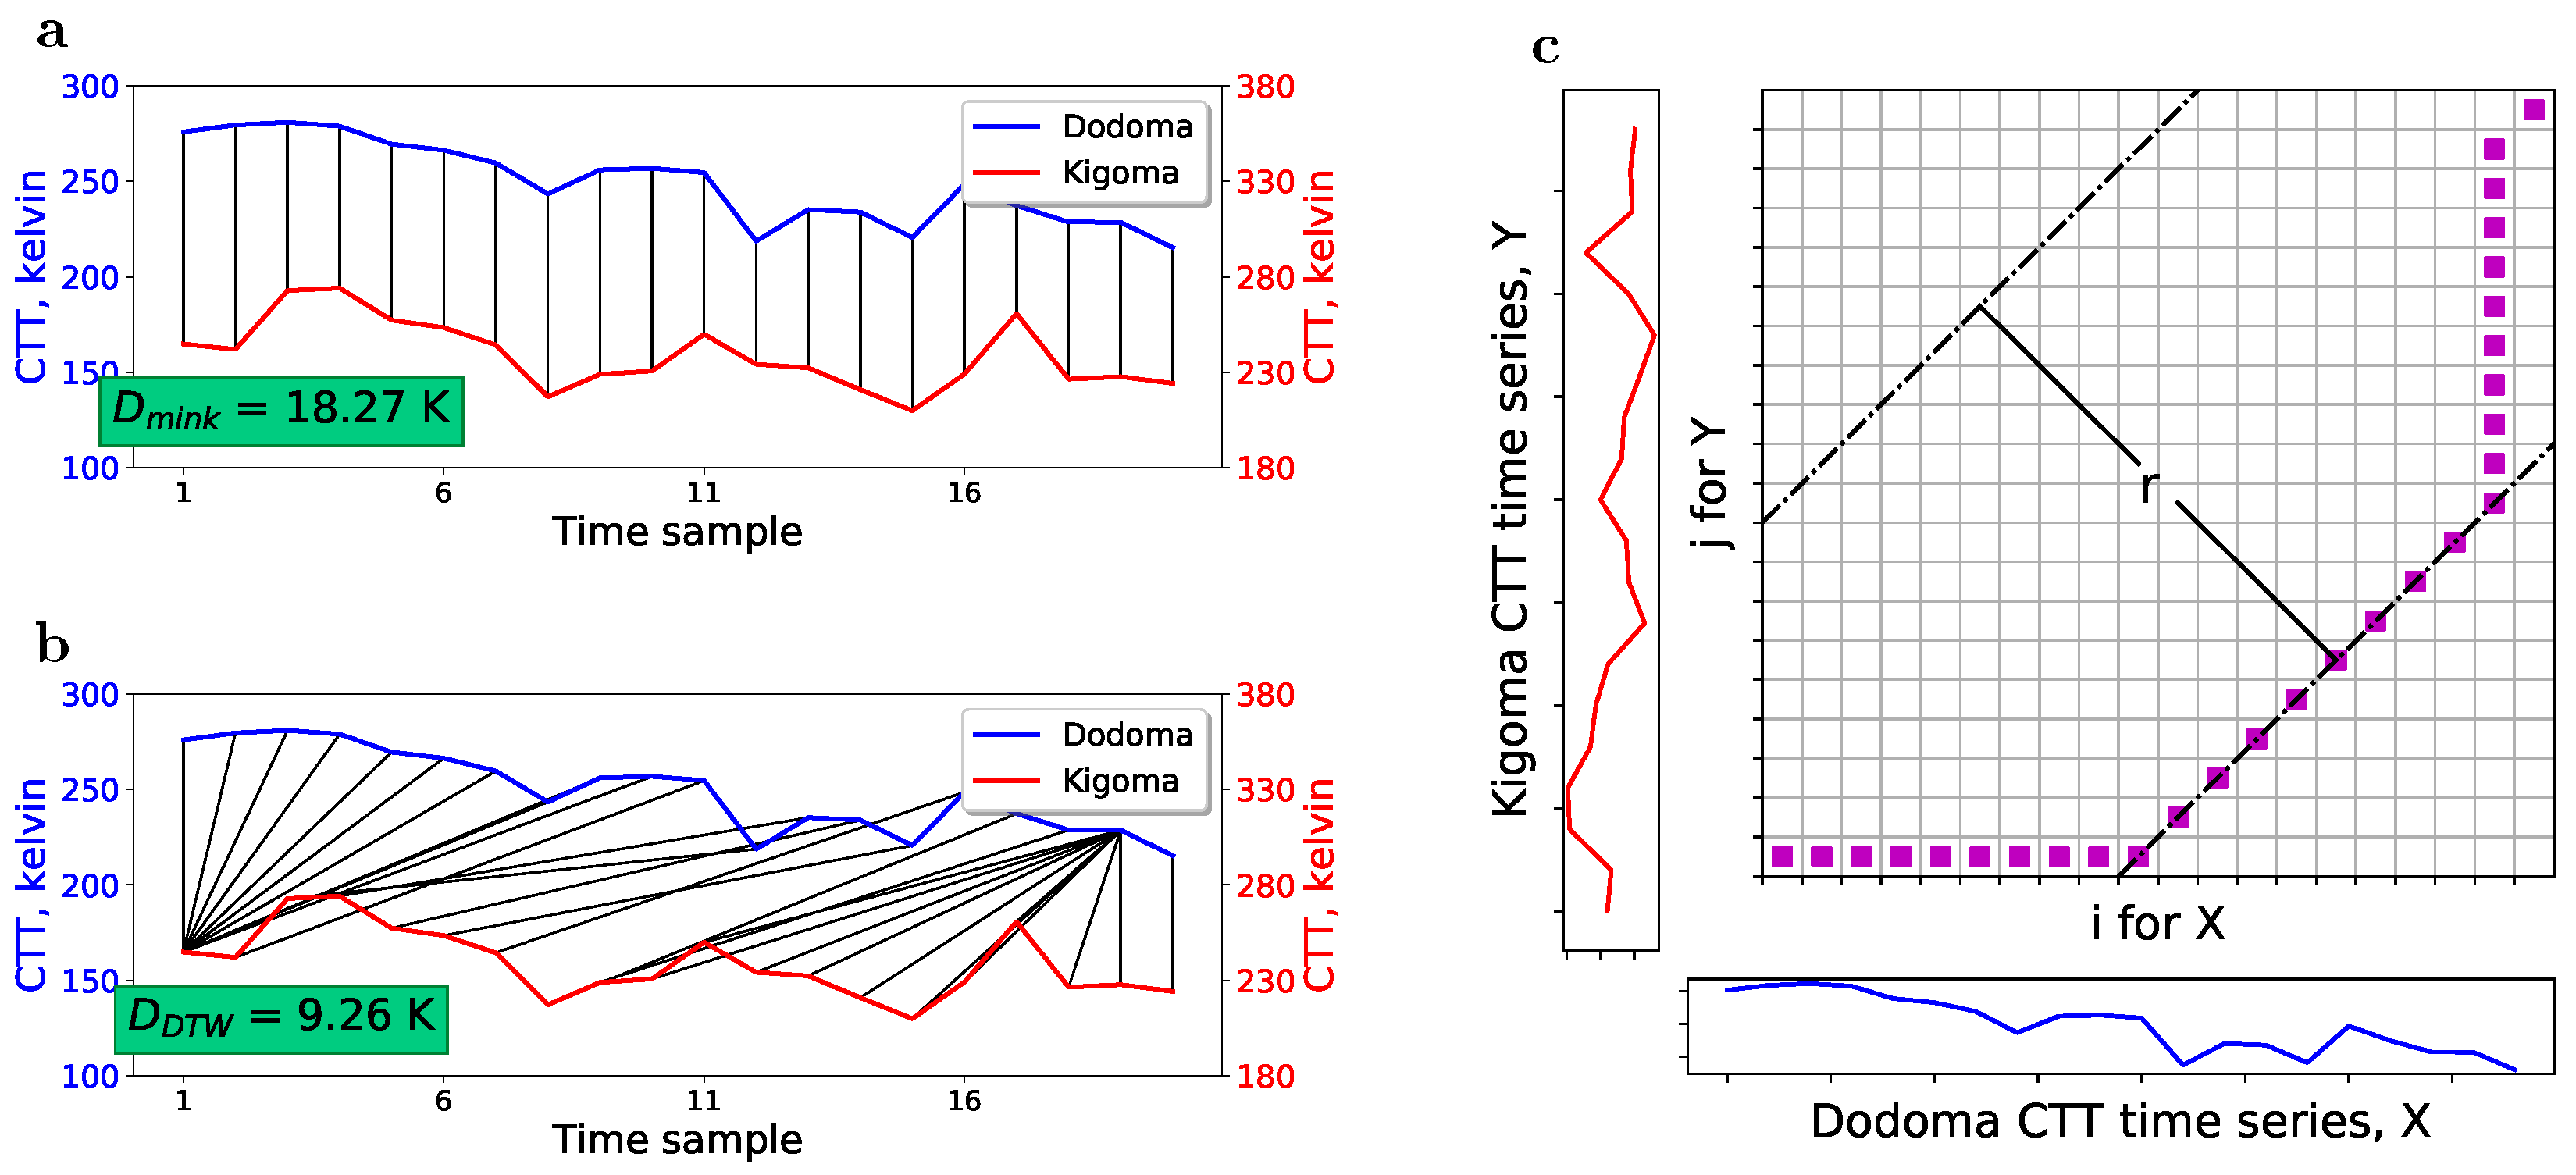
where i j represents the optimal path found by DTW, and Y j has closest value to X i in time series Y during a period around time i. DTW allows for time shifts and variations in duration of the corresponding precipitation events in the two time series, and the time shift in precipitation-rate to form the same precipitation season, as illustrated by Figure 4b, with a comparison of Minkowski distance as shown by Figure 4a.
Constraints in the form of Sakoe–Chuba Band [31] were added to the DTW algorithm, in order to speed up the computation and limit the maximum time shift length. Figure 4c illustrates the Sakoe–Chuba band method with bandwidth r being the distance between the dashed lines. This means event X i can only correspond to events during period of [ i - r , , i + r ] in sequence Y, or | i - j | r in Equation (3).
Finally, the distance between X and Y was scaled by the maximum of the mean of X or Y for precipitation and by the minimum of mean of X or Y for CTT, as follows:
D ( X , Y ) = D D T W ( X , Y ) m a x ( m e a n ( X ) , m e a n ( Y ) ) , if X and Y are precipitation time series D D T W ( X , Y ) m i n ( m e a n ( X ) , m e a n ( Y ) ) , if X and Y are CTT time series ,
where m e a n ( X ) and m e a n ( Y ) are means over the full time series. The scaling is necessary to align the distance between time series from two wet regions and from two dry regions to the same level, and to eliminate unexpected enlargement in the distance value resulting from heavy precipitation events (related to very cold CTTs).
Different maximum time shift lengths (r in Sakoe-Chuba Band) were tested, in the computation of DTW distance. For a daily scale and a 5-day moving-average, bandwidths of five and 10 days were tested; for the pentadal scale, one and two pentads; for dekadal and monthly scales, one dekad and one month, respectively.

3.4. Selection of Temporal Scale

Assume D j S a t = [ D j S a t ( 1 ) , , D j S a t ( j - 1 ) , D j S a t ( j + 1 ) , D j S a t ( M ) ] , j = 1 , , M , defines time series distances between pixels overlapping station j and all other stations based on satellite data (CTT or precipitation), and its counterpart D j G a u defines the time series distances based on gauge data, with M being the number of stations. The Pearson correlation coefficient and Spearman’s rank coefficient for distances of time series were computed between D j S a t and D j G a u , following Equations (5) and (6), and denoted as R D and R s D , respectively. The two correlation coefficients range from –1 to +1, and larger positive values indicate stronger correlations in this case. R D explores the linear correlation between D j S a t and D j G a u , while R s D explores monotonic correlation. Strong correlation between all pairs of D j S a t and D j G a u indicates that for two given locations, satellite time series are similar, when gauge time series are similar, and vice versa.
R D = 1 M j = 1 M i = 1 , i j M [ D j S a t ( i ) - D j S a t ¯ ) ( D j G a u ( i ) - D j G a u ¯ ] i = 1 , i j M [ D j S a t ( i ) - D j S a t ¯ ] 2 i = 1 N [ D j G a u ( i ) - D j G a u ¯ ] 2 ,
where D j S a t ¯ and D j G a u ¯ are means of D j S a t and D j G a u , respectively.
R s D = 1 M j = 1 M [ 1 - 6 i = 1 , i j M | r a n k ( D j S a t ( i ) ) - r a n k ( D j G a u ( i ) ) | 2 M ( M - 1 ) ( M - 2 ) ] ,
where r a n k ( D j S a t ( i ) ) is the rank of the i t h element by values of D j S a t in the ascending order, and r a n k ( D j G a u ( i ) ) defines similarly.
A criterion was developed to select among five temporal scales for clustering, daily, 5-day moving-average, pentadal, dekadal, and monthly, following Equation (7):
x ^ = arg max x max ( a b s ( R D ) , a b s ( R s D ) ) : = { x | x in the 5 temporal scales . }
This means we select the scale which gives the largest absolute values among all R D and R s D . Here we define the largest value as S c r i , i.e., S c r i = max ( a b s ( R D ) , a b s ( R s D ) ) , when x = x ^ .

3.5. Selection of Number of Clusters

In order to select the number of clusters, both satellite-based and gauge-based time series at gauge locations were used for clustering. After clustering, the stations were divided into k clusters, labeled as 1 , , k . An alignment score is proposed to measure how well the gauge-based clustering and the satellite-based clustering match. It is computed by a ratio as defined in Equation (8), the range being [ 0 , 1 ] , with 1 indicating the perfect match.
S a l i g n = N c r r / N t o t ,
where N c r r is the number of stations which have the same label in satellite-based clustering and gauge-based clustering, and N t o t is the total number of stations. Cluster numbers of 2 to 8 were tested, and the number K resulting in the largest S a l i g n was selected as optimal.
Since both satellite-based and gauge-based time series were used for classification over Germany, the alignment score S a l i g n was also used in the classification case to quantify the accuracy of satellite-based time series (CTT or precipitation) for precipitation regime classification.

4. Results and Analysis

4.1. Validation over Germany

This section validates our methodology of precipitation regime classification based on CTT time series and investigates its uncertainty. First, 37 of the CDC stations were used for clustering to construct the precipitation regime clusters. Then, 691 of CDC stations were assigned to the clustered precipitation regimes using CTT time series. The uncertainty was quantified by comparing the CTT-based classification to that of the gauge time series. Results based on the CMORPH precipitation were also compared to those based on CTT. Cross validation was conducted by repeating ten times the random selection of the 37 stations for clustering.
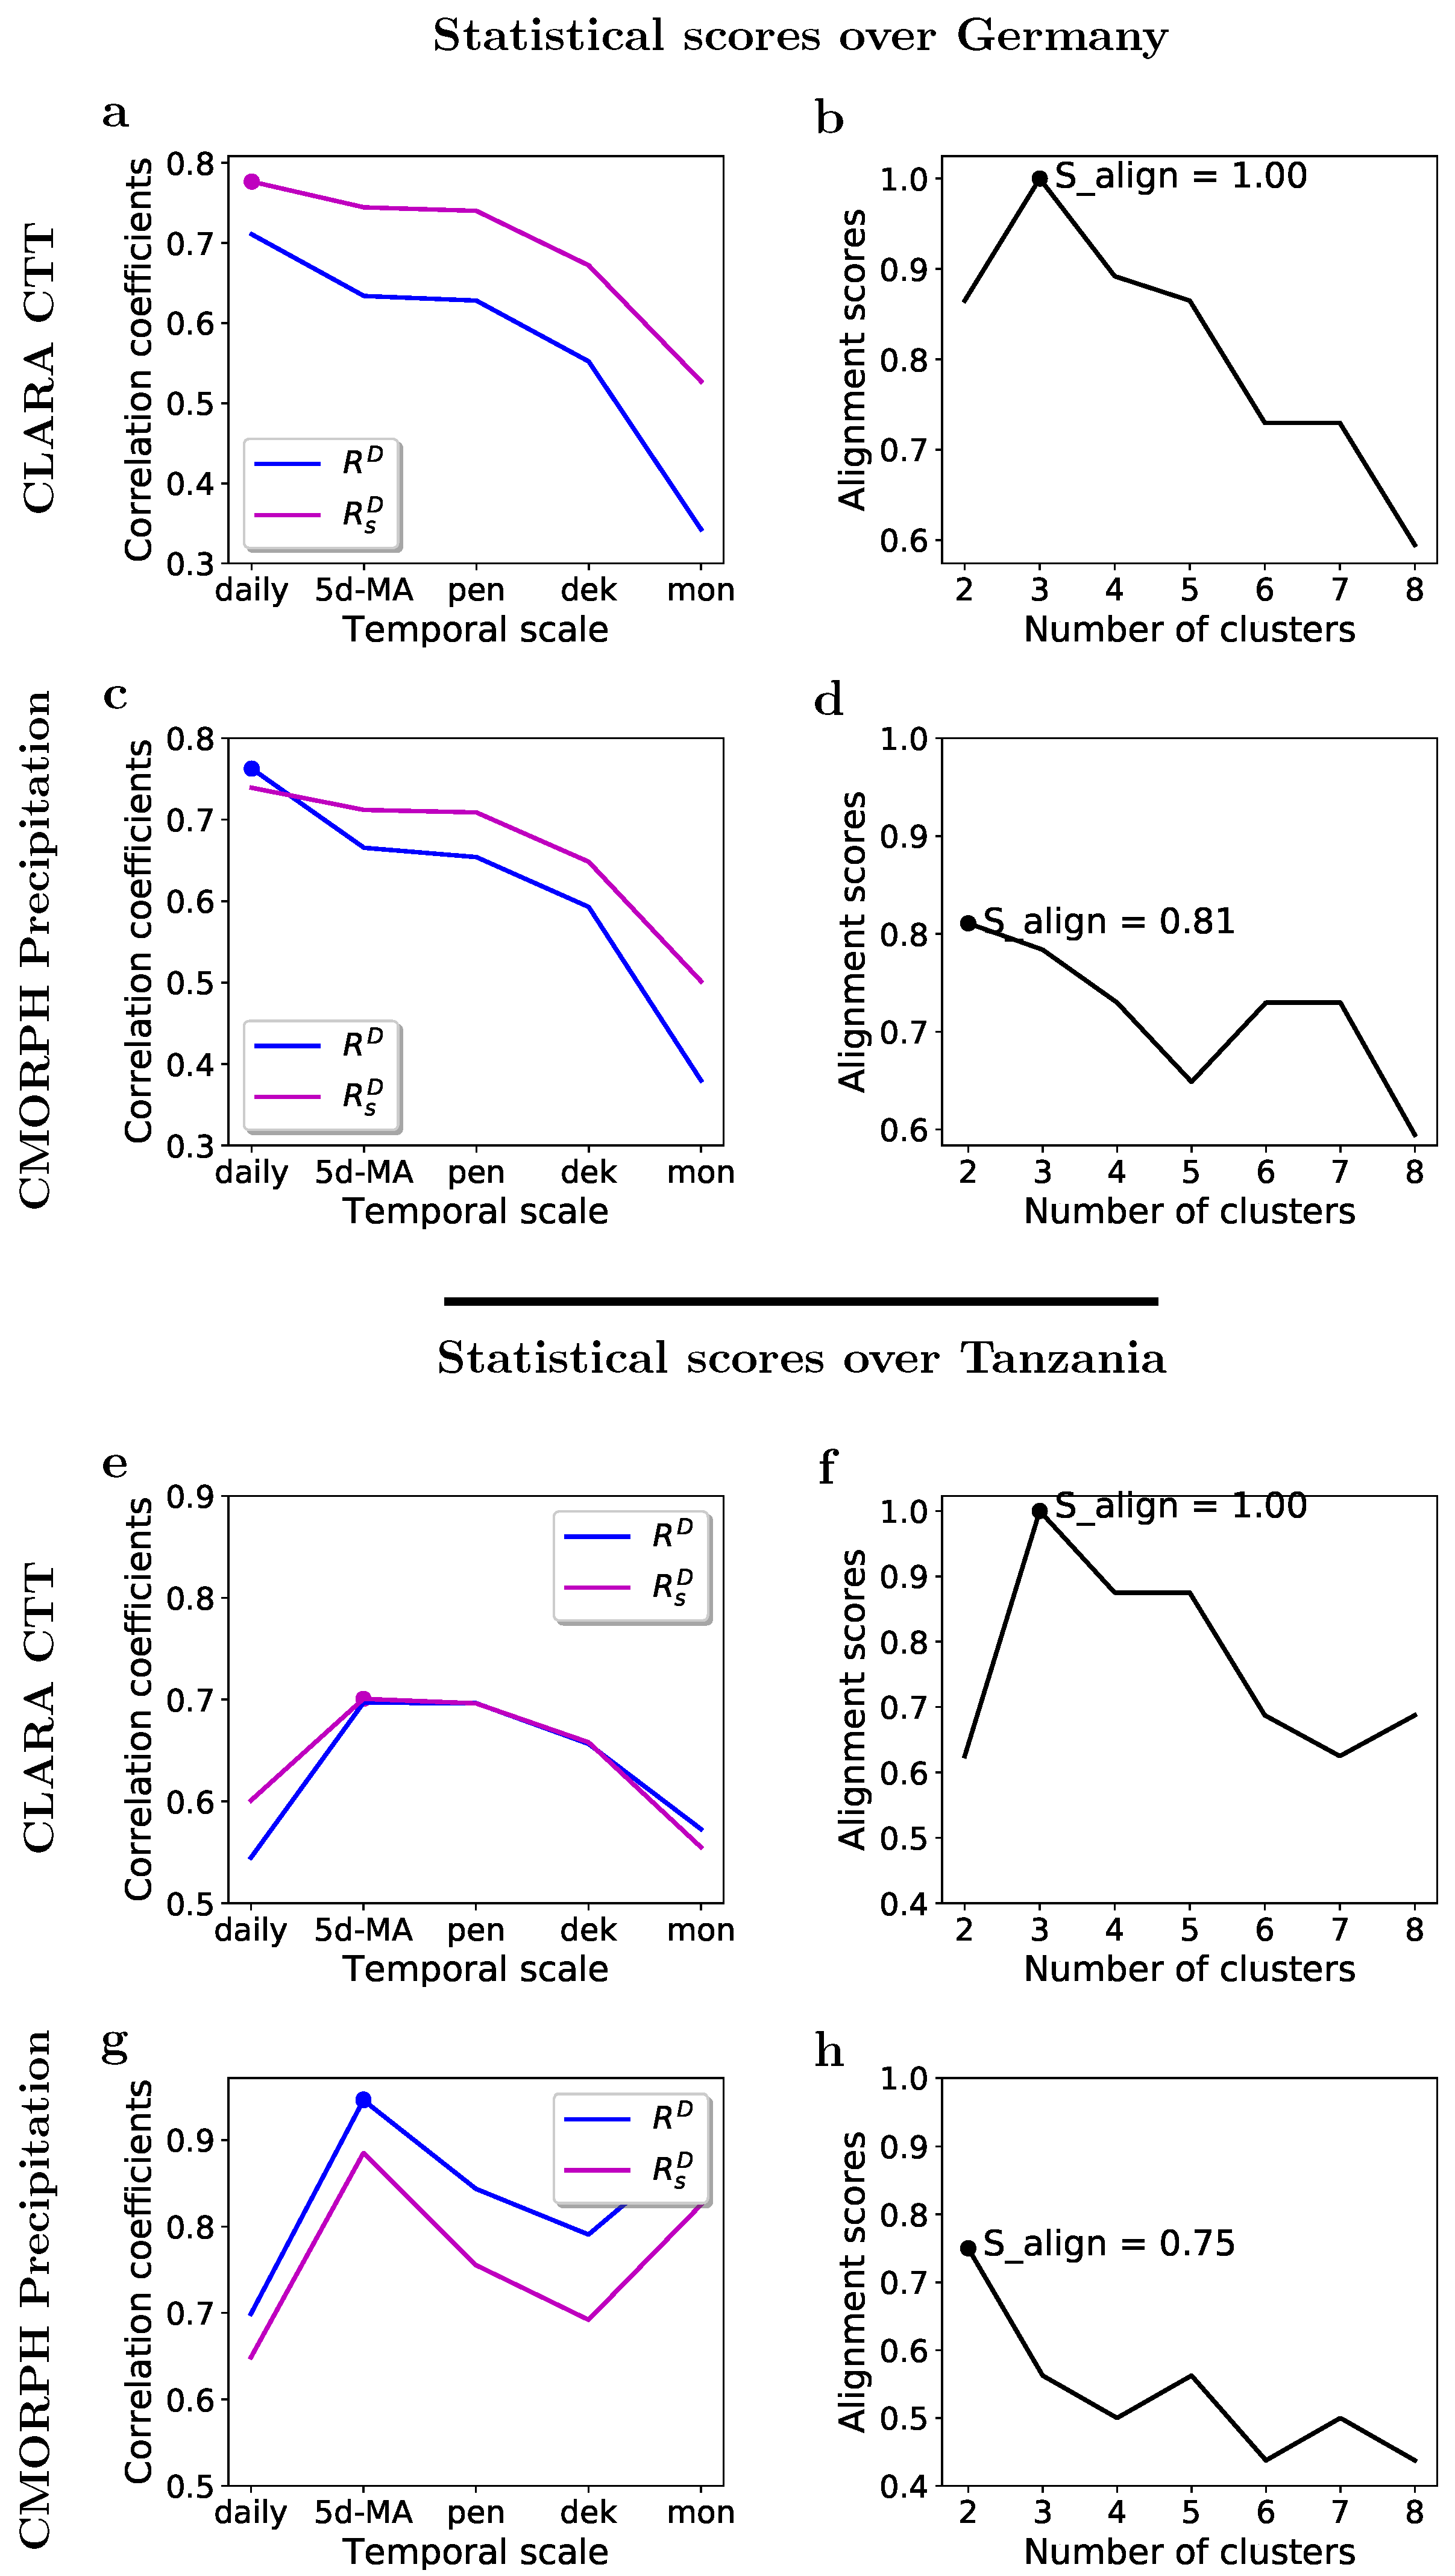
According to the correlation coefficients shown in Figure 5a,b, the daily scale was selected for the clustering of 37 CDC stations over Germany into three groups based on the highest alignment score ( S a l i g n = 1 ), and the results are shown in Figure 3a–f. Figure 3a,b illustrate dendrograms of the distance trees and the clusters defined based on distances for CDC precipitation time series and CLARA CTT time series. The dendrogram shows the distance between merged clusters in a monotonically ascending order starting at zero distance for single stations to, e.g., 0.7 mm/day and 0.018 K minimum distance between two stations in the CDC and CLARA datasets respectively. In Figure 3a, with a threshold of 1.06 mm/day, the precipitation distance tree can be cut into three groups that are illustrated by different colors. In Figure 3c, the CTT dendrogram can also be divided into three groups by a threshold of 0.035 K. The clustering based on gauge data and on CTT data match perfectly, as shown in Figure 3c,d.
Classification of the other 691 CDC stations was conducted on a daily scale as well, according to the three clusters (precipitation regimes). Results are shown in Figure 3e,f using gauge data and using CTT data, respectively. It can be observed that most of the stations are categorized into the same class for both cases, with S a l i g n = 0.96 . This means CTT time series is an effective proxy for precipitation regime classification for any location in Germany, with an accuracy equal to 0.96. Given that each grid cell contains at most one CDC station and 691 stations represent 94% of the total number of satellite grid cells over Germany, the classification result provides a validation of the method’s performance.
We implemented the method also for CMORPH data, in which case daily precipitation time series were used to cluster the stations into two clusters, based on the selection criteria shown in Figure 5c,d. After alignment, the clustering and classification results using CDC and CMORPH data are shown in Figure 3i,j. The alignment scores are S a l i g n = 0.81 for clustering and S a l i g n = 0.77 for classification, which indicate the accuracy of using CMORPH data is lower than using the CLARA dataset.
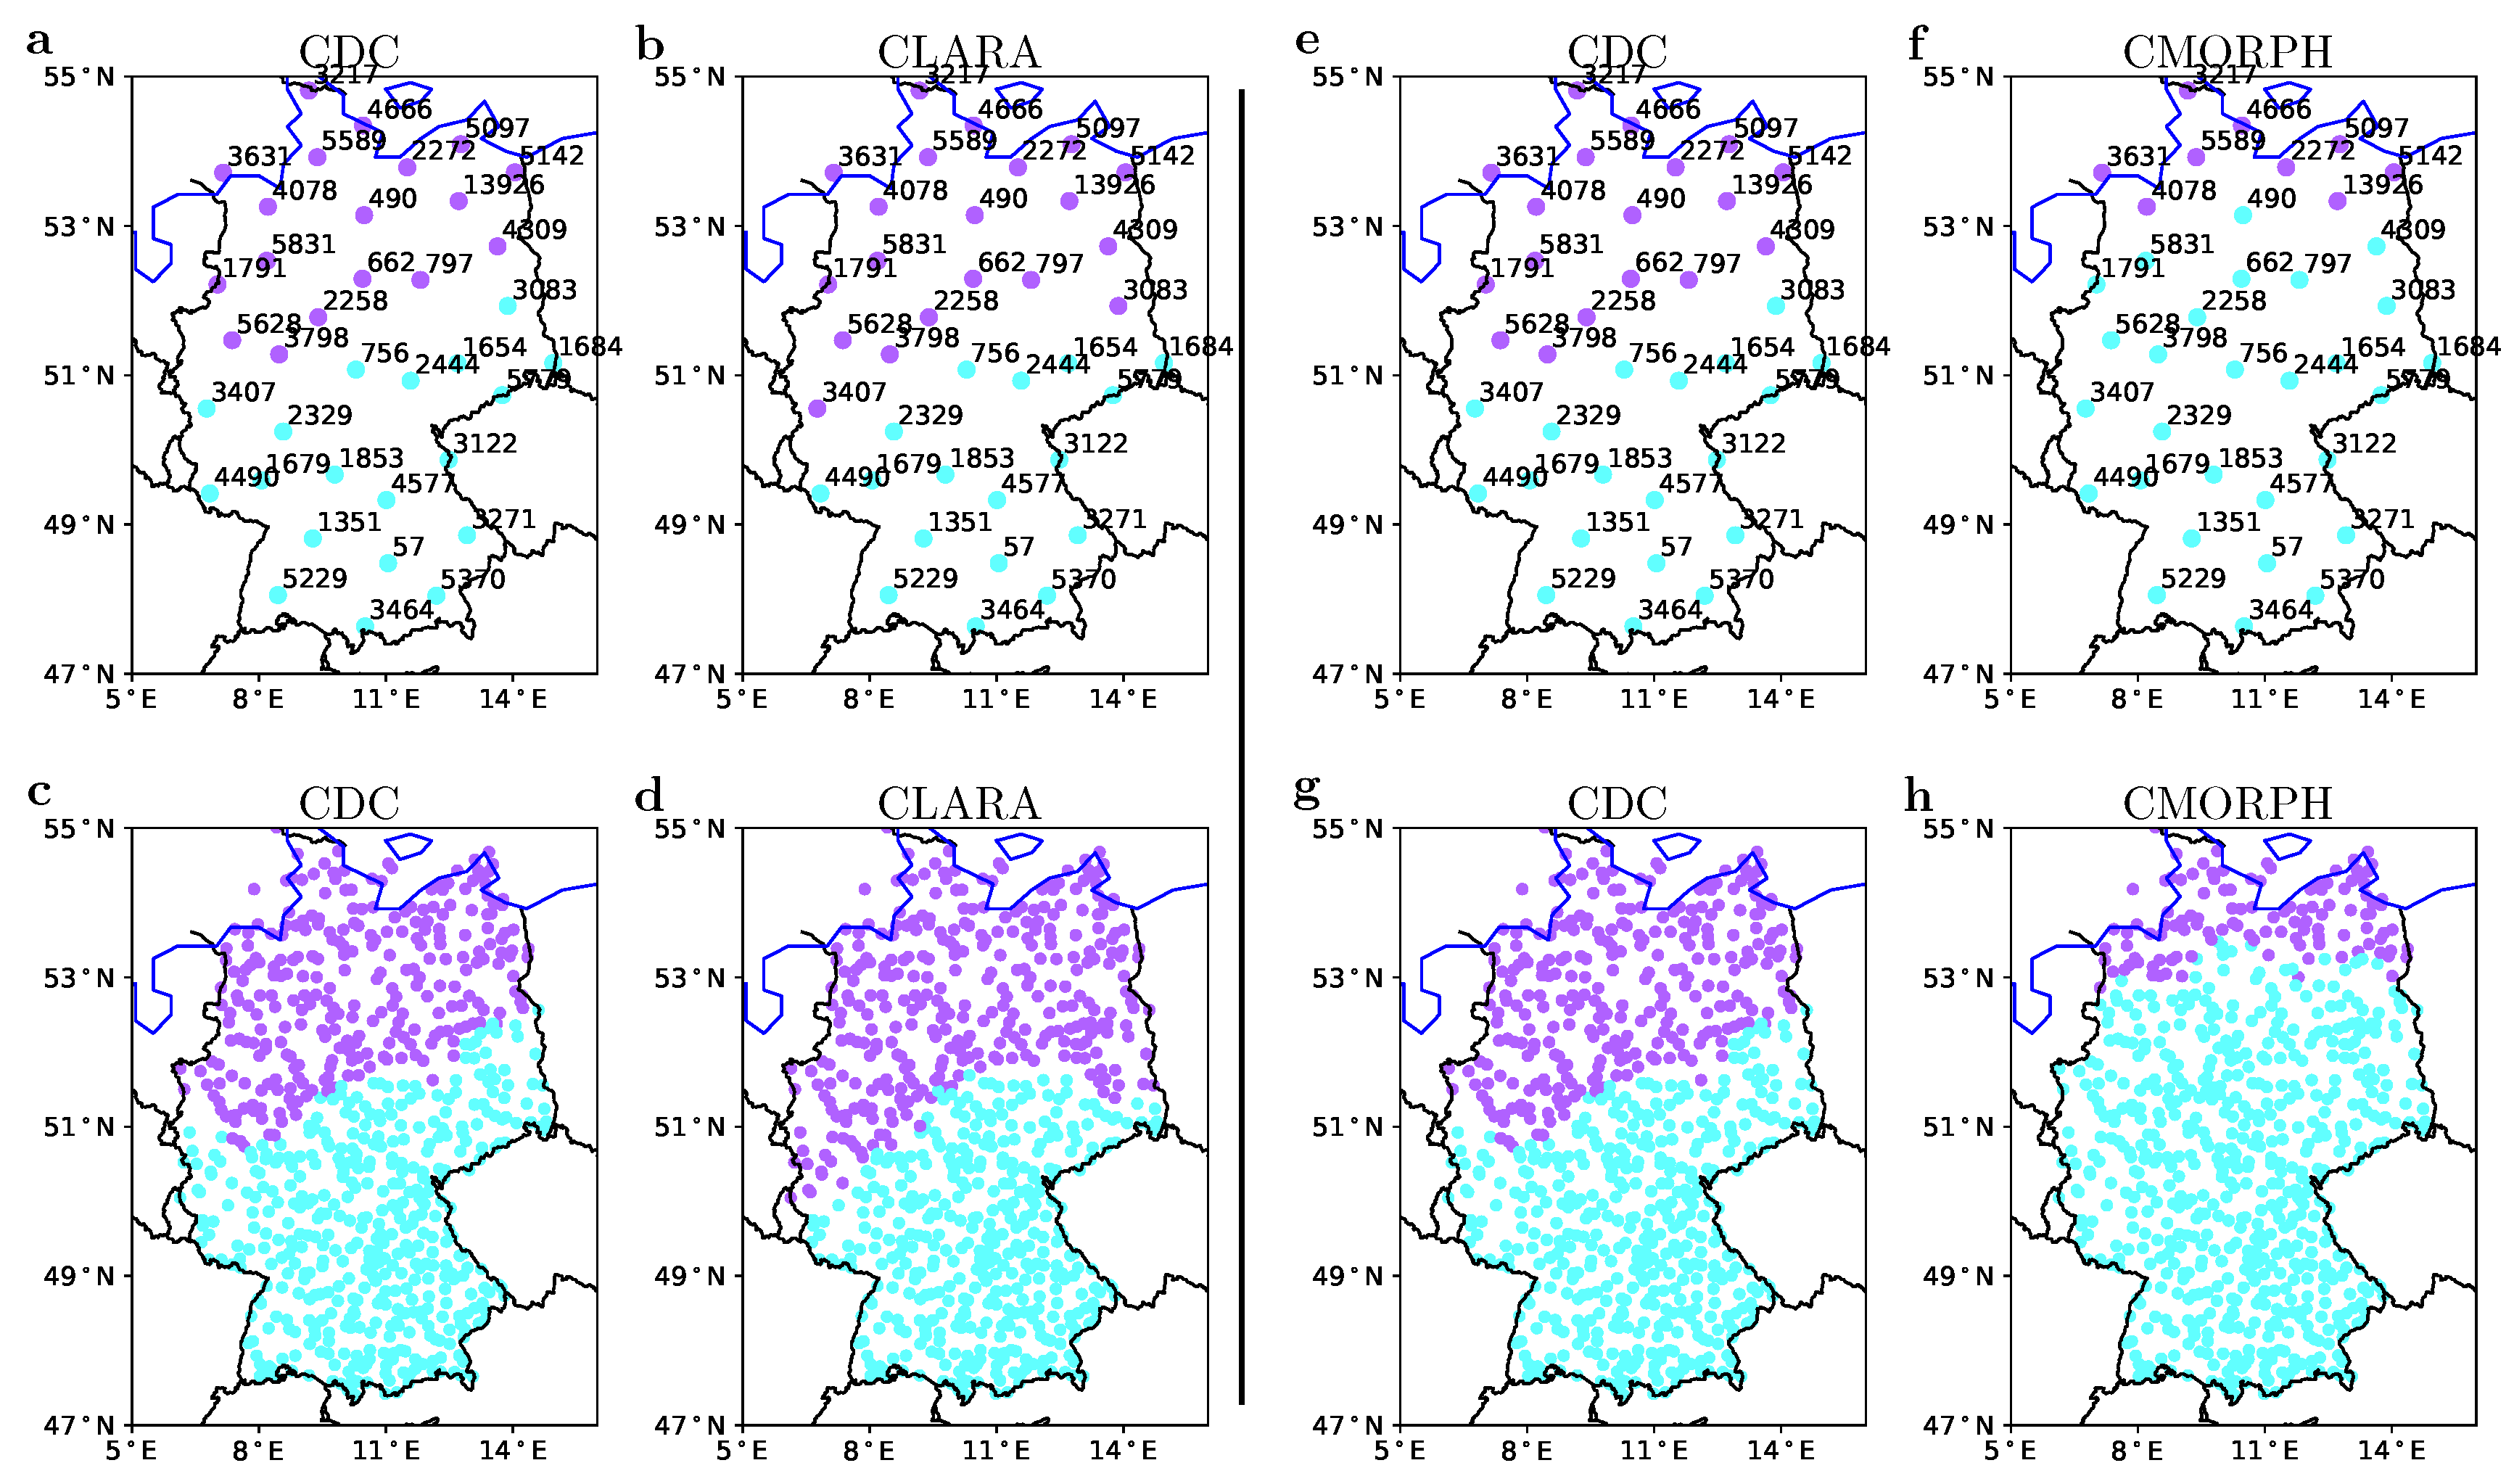
Cross validation gives an average alignment score S ¯ a l i g n = 0.95 for clustering and S ¯ a l i g n = 0.92 for classification using CLARA CTT; and S ¯ a l i g n = 0.80 for clustering and S ¯ a l i g n = 0.78 for classification using CMORPH precipitation. CTT is more robust for precipitation regime classification, since eight out of 10 experiments resulted in two regimes, but CMORPH can produce 2–6 regimes with similar possibilities. However, the resulting distributions of the regimes are similar, which can be observed by comparing Figure 3 and one of the samples in Figure 6. The performances of the ten samples for cross validation are summarized in the supplement.

4.2. Application over Tanzania, a Data-Scarce Environment

In this section we show the method over Tanzania, using TMA stations and CTT time series for clustering and comparing CLARA CTT time series and CMORPH precipitation time series for classification.
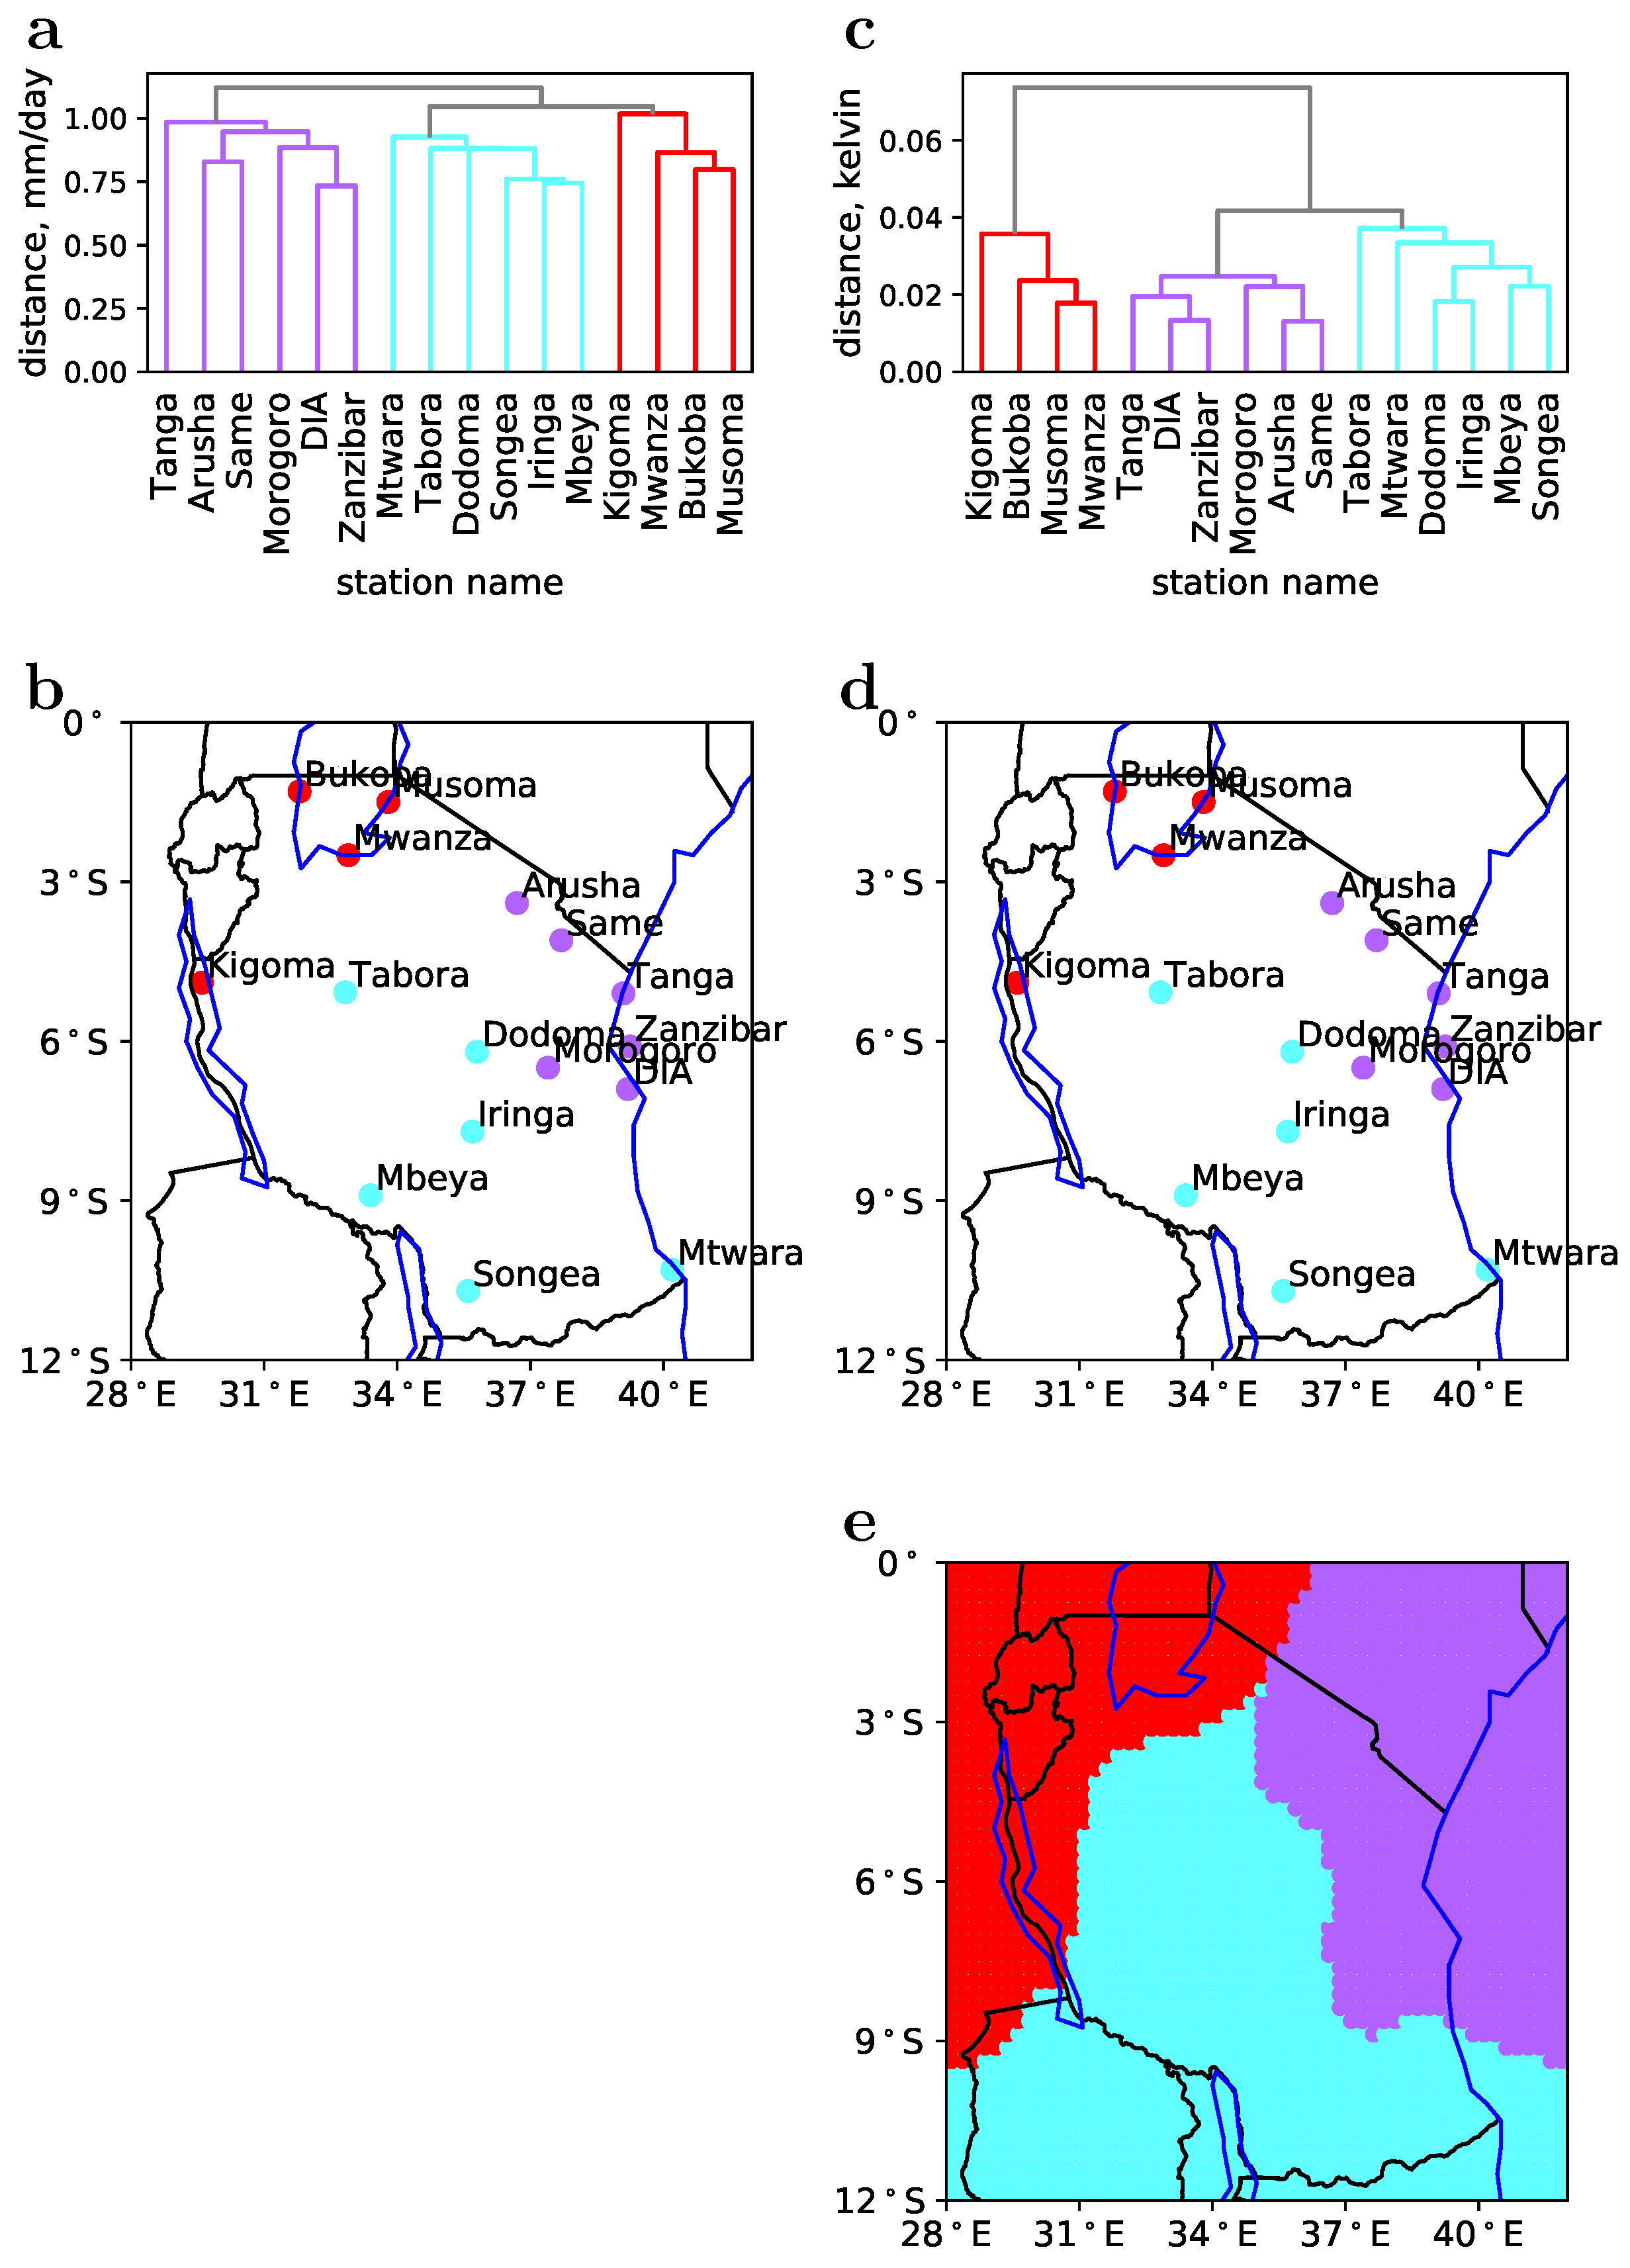
Based on correlation values shown in Figure 5e, a 5-day moving average was used for clustering CLARA and TMA time series and they were clustered into three groups, based on the alignment scores in Figure 5f. CTT clustering of grids cells overlapping TMA stations matches perfectly with the clusters based on TMA precipitation time series (Figure 7b,d), with S a l i g n = 1 . All satellite grid cells in the domain were then classified according to the identified clusters using CTT 5-day moving averages, as illustrated in Figure 7e, with precipitation regimes shown in different colors.
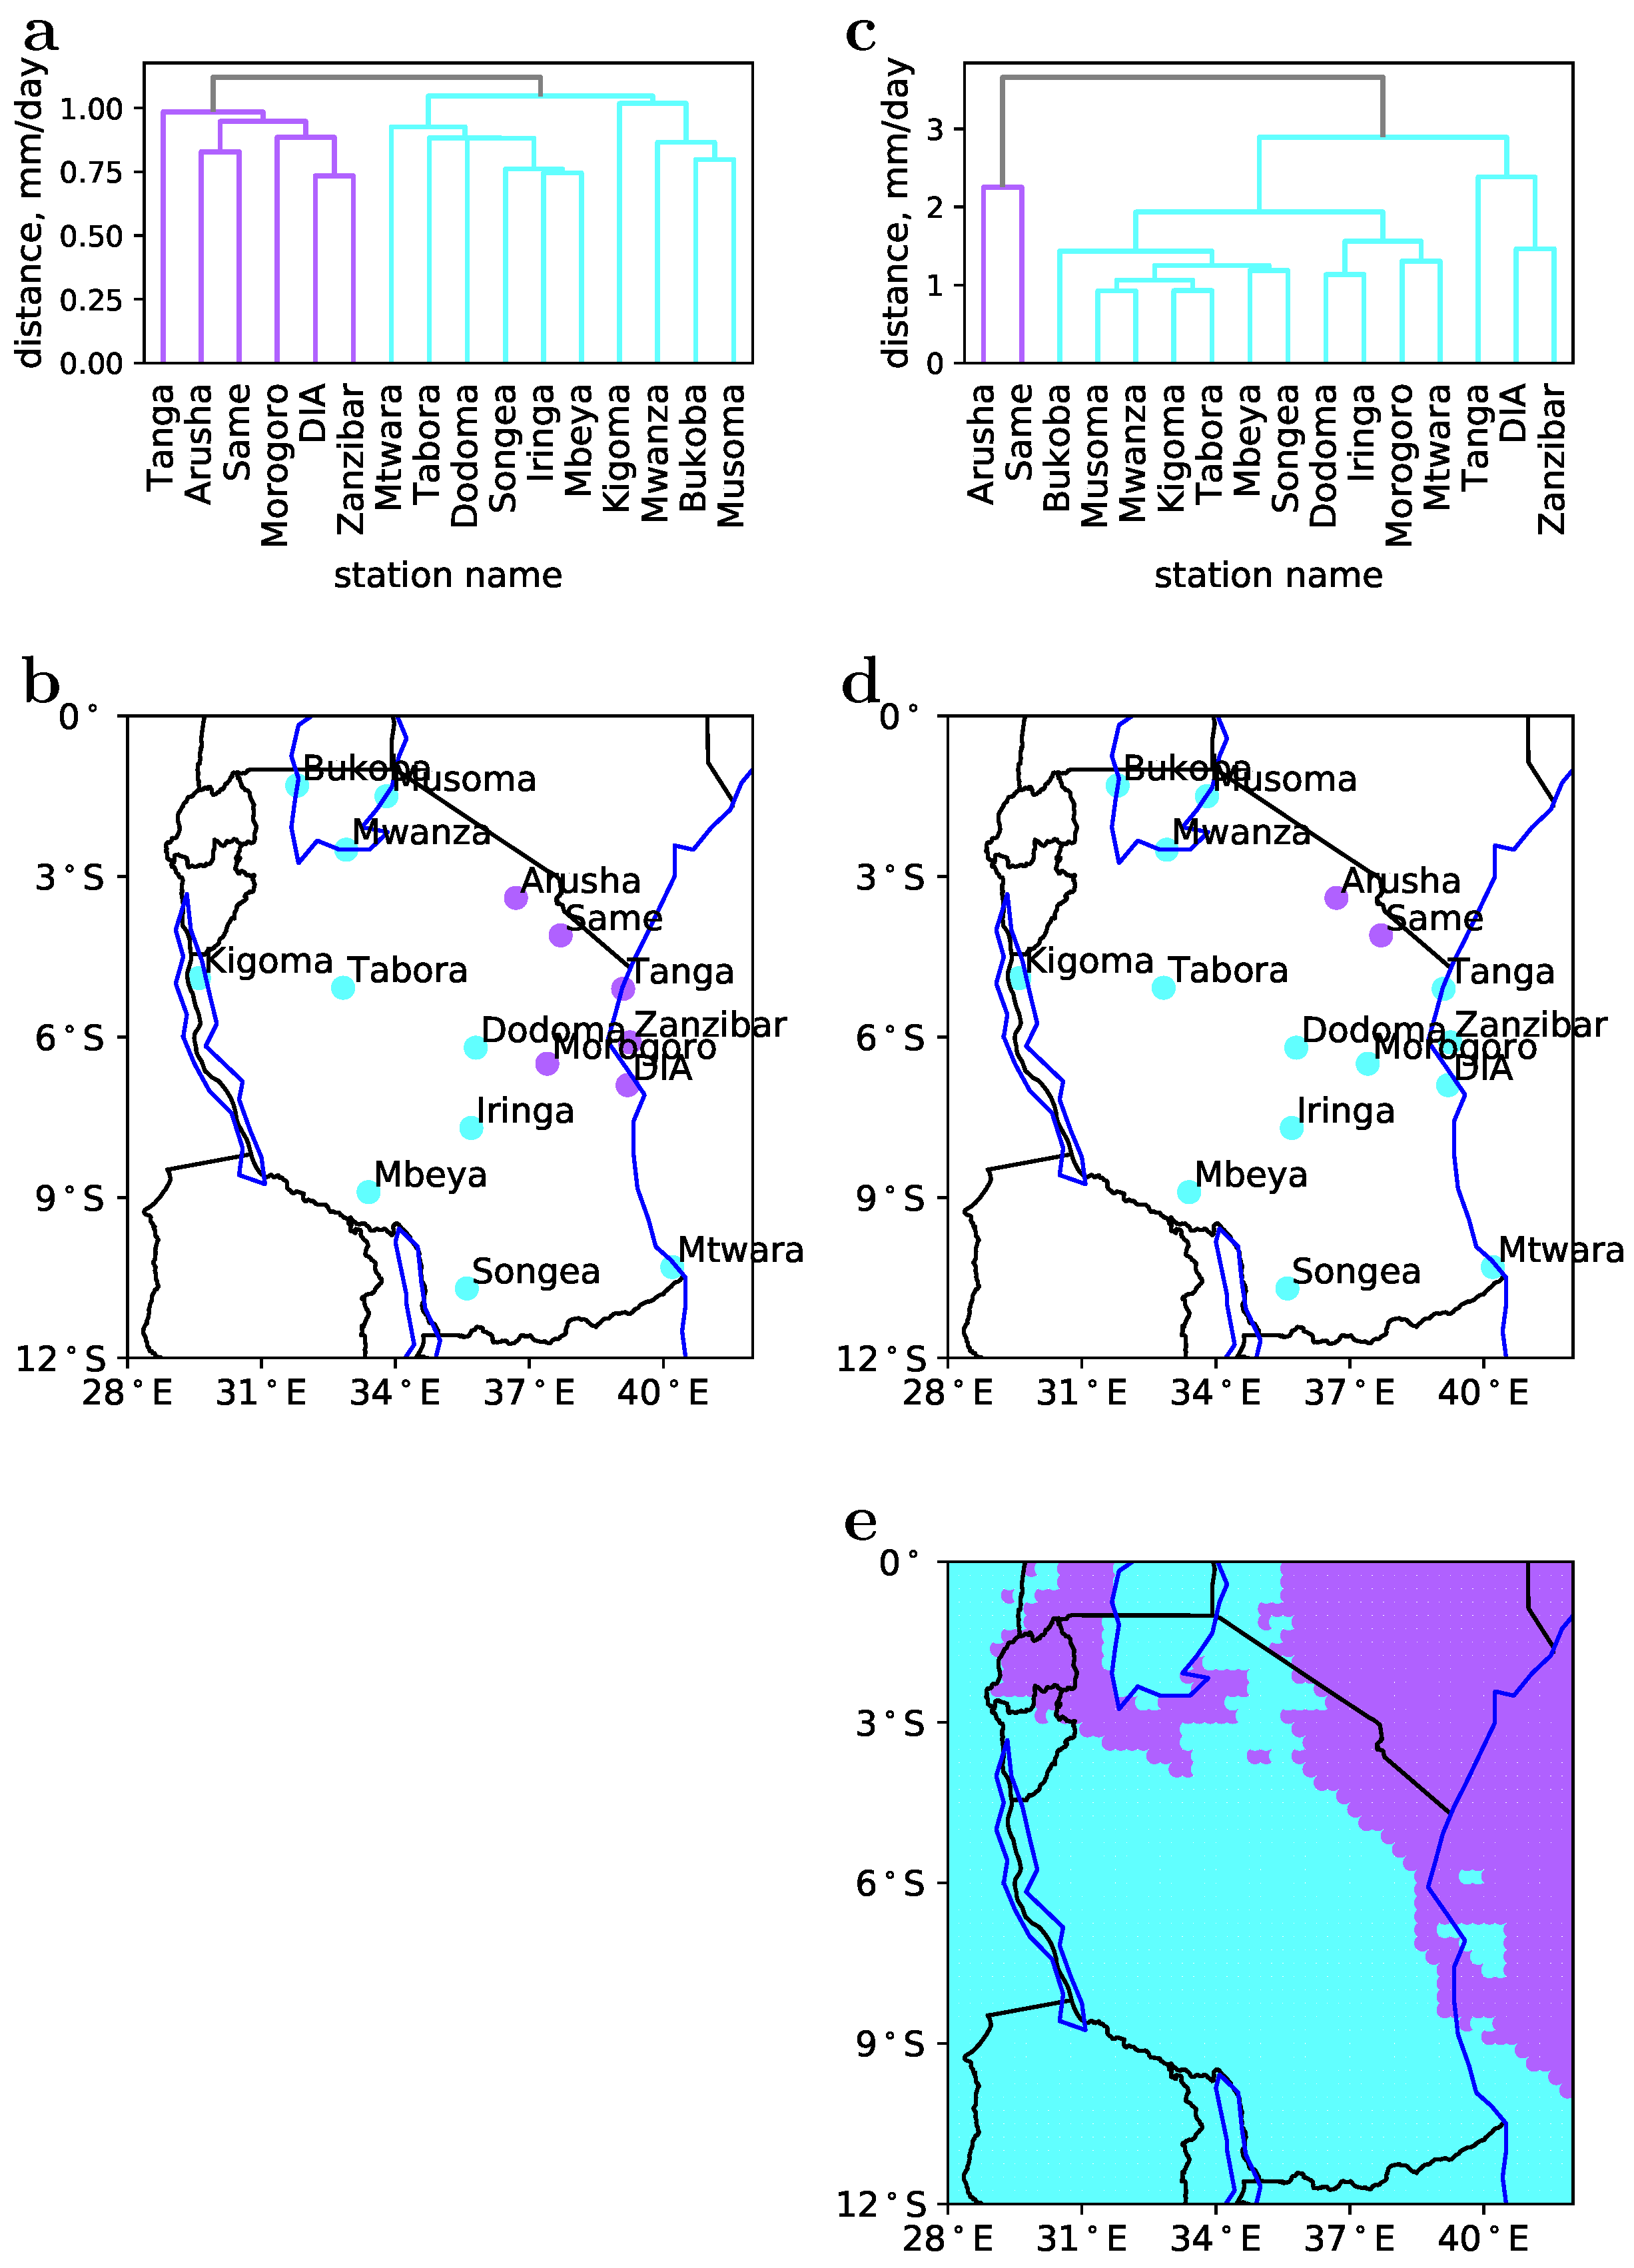
The same procedure was repeated using CMORPH data, based on 5-day moving averages and using two clusters based on selection criteria shown in Figure 5g,h. Comparing CMORPH and TMA-based clustering (Figure 8b,d) results in S a l i g n = 0.75 , much lower than that of the CLARA CTT time-series. Results in Figure 8 show that both the clusters of stations and the classification of grid cells are very different for CMORPH versus CLARA and TMA data. When one takes into consideration the topography of the stations (shown in Figure 1b), i.e., their horizontal distance, elevation, proximity to coast, and large waterbodies, the clustering and classification results using CTT data are more realistic than those for CMORPH. The purple region and cyan region in Figure 7e, respectively, correspond to the coastal plains and central plateau separated by north-to-south highlands in Figure 1b. The red region in Figure 7e covers large waterbodies along the boundary of Tanzania shown by blue lines in Figure 1b.

4.3. Discussion

The case studies over Germany and Tanzania show the feasibility of using CTT-time-series for identification and clustering of precipitation regimes. The results match very well with results from a recent study by the German Weather Service (https://www.dwd.de/EN/ourservices/rcccm/nat/rcccm_nat_monthly.html?nn=495490). However, our method uses full time series to characterize precipitation features, instead of monthly or annually precipitation statistics, which are more generally applicable, and more efficient and robust, especially for development of regime-specific precipitation models (satellite-based or physically-based). Moreover, the use of satellite-based CTT data extends applicability of the method to any region across the globe.
DTW is used in the computation of distance between time series. It can deal with the time shift of a corresponding precipitation event observed at two different locations, or match heavy precipitation seasons at two locations to the same period. This is more effective for taking into account heavy precipitation and seasonality in precipitation regime classification than the Minkowski distance.
The result was shown to be more effective than using satellite-based precipitation estimates (CMORPH). Possible reasons could be that CMORPH applies further steps to estimate precipitation fields from cloud properties (liquid content and ice particles in the cloud), which introduce model uncertainty or result in a loss of physical information when the precipitation estimation models based on human understanding are incapable of fully representing the reality of the physical relationship between clouds and precipitation.
The CTT-based precipitation regime method opens the possibility for parameter calibration in spatially varied precipitation models in two steps: (1) use precipitation from stations in one cluster and predictor data from grid cells overlapping the stations to calibrate model parameters, and (2) assign the calibrated parameters to all grid cells in the precipitation regime identified by the cluster.
There is extra information for the construction of a CTT-precipitation model. The R D and R s D scores show that correlation of CTT versus rain gauge data is strong at daily scale but decreases at larger temporal aggregation scales for both cases, with a stronger decreasing rate over Germany than over Tanzania. This implies that trends and variations and other characteristics of CTT time series capture the patterns in precipitation time series at small temporal scales. In addition, stations with similar CTT time series are clustered in the same precipitation regime where precipitation time series are also similar. This further indicates that similar CTT time series at two locations indicate similar precipitation time series at small temporal scales (5-day moving averages for Tanzania and daily for Germany), and vice versa. Since convective precipitation dominates the weather system over Tanzania and frontal precipitation occurs often over Germany, CTT time series may be used for precipitation estimation in all precipitation types, while current satellite-based CTT-precipitation models account mainly for convective precipitation.
Note that the missing records in the datasets are small over the study regions and periods; in-filling of the missing data does not influence the results significantly. The interpolation scheme in Section 2.2 may have a smoothing effect in space and time that could locally reduce the spatial-temporal variability of precipitation or CTT. The impact is limited given the small data gaps, but can be large if heavy precipitation or abrupt changes such as precipitation in dry season are removed. The effects of missing precipitation with similar events nearby is compensated for by using DTW.

5. Conclusions

Precipitation estimates based on satellite observations often perform poorly at small (daily, subdaily) time scales, especially in regions where ground observations are scarce. One of the reasons is that estimation products are often based on global parameterizations or parameterizations derived in gauge-dense regions (US, Europe) and extrapolated to other regions. In this paper, we present a methodology for precipitation regime clustering as a first step towards development of region-specific precipitation models. We use CTT data from a globally available satellite dataset (CLARA), independent of ground observations.
This method first identifies clusters of similar precipitation regimes using CTT time series at grid cells overlapping rain gauge locations. The optimal time scales for clustering and optimal number of clusters are decided upon based on correlation between CTT and rain gauge time series. Then, every satellite grid cell is assigned to a precipitation regime cluster in a classification step also using the CTT time series. For both clustering and classification steps, the time series distances were computed using dynamic time warping (DTW), which allows a pre-defined time shift to match rain gauge and CTT time-series, accounting for the frequently occurring time mismatch between rain gauge and satellite observations. The method was validated via comparison with precipitation regimes derived from rain gauge data over Germany, with a very dense rain gauge network and for Tanzania, covered by a much sparser network.
This is a step towards space-dependent precipitation models with parameters that vary over precipitation regimes for data-scarce regions. The models can be precipitation estimation from satellite observation, numerical weather models, or stochastic weather generators. The parameters in one precipitation regime can be calibrated by using the gauge data in the same cluster. The method can be extended to other ground-based precipitation observations (such as weather radar) by clustering CTT time series at observation locations.
A comparison was made using a satellite-based precipitation product, CMORPH, for clustering and classification. The results show that there is a 100 % consistency between CTT and gauge precipitation clustered gauges, and a 96 % consistency between CTT and gauge precipitation classified gauges. For clustering and classification based on satellite precipitation data, the accuracies are 0.81 and 0.77, respectively. When applied over Tanzania, a data-scarce region, the method had an accuracy of clustering 1.0 based on CTT and accuracy of 0.75 based on CMORPH precipitation. These results indicate that CTT time series are more effective for precipitation regime classification and that the satellite precipitation product performs worse over regions with low density of ground observations.
In addition, over both Germany with frontal precipitation and Tanzania dominated by convective precipitation, small temporal scales (daily and 5-day moving averages) of CTT time series were selected as optimal to represent precipitation time series. Locations with similar gauge precipitation time series also had similar CTT time series, as indicated by the good match between clustering based on CTT and on gauge data. This means, theoretically, CTT time series can be a predictor for precipitation time series for all precipitation types, and the variations and patterns at small scales may be more effective for precipitation modeling than averaged values over time. Experiments over more regions with more climate types should be conducted to be able to generalize conclusions to other regions.

Supplementary Materials

The following are available online at https://www.mdpi.com/2072-4292/12/2/289/s1, PDF S1: Summary of the Cross Validation.

Author Contributions

S.L. proposed the concept and wrote the paper. All authors contributed to the methodology design, results analysis, and reviewing and editing of the paper. All authors have read and agreed to the published version of the manuscript.

Funding

This research was funded by European Commission’s, Horizon 2020 research and innovation programme, grant number SC5-01-2016-2017.

Acknowledgments

This study was funded by European Commission’s Horizon 2020 research and innovation programme. It is part of project Oasis H2020_Insurance, with project number SC5-01-2016-2017, under work package 2.2.2 for Agricultural micro-Insurance, Tanzania (https://h2020insurance.oasishub.co/wp222-agricultural-micro-insurance-tanzania). We thank Tanzania Meteorological Agency for making the high-quality rain gauge data available, and Christoph Gornott from PIK for sharing these data. We also thank Surfsara, The Netherlands Supercomputing centre, for providing the Cartesius cluster as the computing facility.

Conflicts of Interest

The authors declare no conflict of interest.

References

  1. IPCC. IPCC, 2014: Climate Change 2014: Synthesis Report. Contribution of Working Groups I, II and III to the Fifth Assessment Report of the Intergovernmental Panel on Climate Change; Core Writing Team, Pachauri, R.K., Meyer, L.A., Eds.; Technical report; IPCC: Geneva, Switzerland, 2014. [Google Scholar]
  2. Harris, I.; Jones, P.D.; Osborn, T.J.; Lister, D.H. Updated high-resolution grids of monthly climatic observations–the CRU TS3. 10 Dataset. Int. J. Clim. 2014, 34, 623–642. [Google Scholar] [CrossRef] [Green Version]
  3. Schamm, K.; Ziese, M.; Becker, A.; Finger, P.; Meyer-Christoffer, A.; Schneider, U.; Schröder, M.; Stender, P. Global gridded precipitation over land: A description of the new GPCC First Guess Daily product. Earth Syst. Sci. Data 2014, 6, 49–60. [Google Scholar] [CrossRef] [Green Version]
  4. Xie, P.; Chen, M.; Shi, W. CPC unified gauge-based analysis of global daily precipitation. In Proceedings of the 4th Conference on Hydrology, Atlanta, GA, USA, 17–21 January 2010. [Google Scholar]
  5. Dee, D.P.; Uppala, S.; Simmons, A.; Berrisford, P.; Poli, P.; Kobayashi, S.; Andrae, U.; Balmaseda, M.; Balsamo, G.; Bauer, D.P.; et al. The ERA-Interim reanalysis: Configuration and performance of the data assimilation system. Q. J. R. Meteorol. Soc. 2011, 137, 553–597. [Google Scholar] [CrossRef]
  6. Saha, S.; Moorthi, S.; Pan, H.L.; Wu, X.; Wang, J.; Nadiga, S.; Tripp, P.; Kistler, R.; Woollen, J.; Behringer, D.; et al. The NCEP climate forecast system reanalysis. Bull. Ame. Meteorol. Soci. 2010, 91, 1015–1058. [Google Scholar] [CrossRef]
  7. Huffman, G.J.; Adler, R.F.; Morrissey, M.M.; Bolvin, D.T.; Curtis, S.; Joyce, R.; McGavock, B.; Susskind, J. Global precipitation at one-degree daily resolution from multisatellite observations. J. Hydrometeorol. 2001, 2, 36–50. [Google Scholar] [CrossRef] [Green Version]
  8. Huffman, G.J.; Bolvin, D.T.; Nelkin, E.J.; Wolff, D.B.; Adler, R.F.; Gu, G.; Hong, Y.; Bowman, K.P.; Stocker, E.F. The TRMM multisatellite precipitation analysis (TMPA): Quasi-global, multiyear, combined-sensor precipitation estimates at fine scales. J. Hydrometeorol. 2007, 8, 38–55. [Google Scholar] [CrossRef]
  9. Huffman, G.J.; Bolvin, D.T.; Braithwaite, D.; Hsu, K.; Joyce, R.; Kidd, C.; Nelkin, E.J.; Xie, P. NASA Global Precipitation Measurement (GPM) Integrated Multi-satellitE Retrievals for GPM (IMERG); Algorithm Theoretical Basis Document (ATBD) Version 4.5, NASA/GSFC, NASA/GSFC Code 612; NASA: Greenbelt, MD, USA, 2015.
  10. Joyce, R.J.; Janowiak, J.E.; Arkin, P.A.; Xie, P. CMORPH: A method that produces global precipitation estimates from passive microwave and infrared data at high spatial and temporal resolution. J. Hydrometeorol. 2004, 5, 487–503. [Google Scholar] [CrossRef]
  11. Beck, H.E.; Van Dijk, A.I.; Levizzani, V.; Schellekens, J.; Gonzalez Miralles, D.; Martens, B.; De Roo, A. MSWEP: 3-hourly 0.25 global gridded precipitation (1979-2015) by merging gauge, satellite, and reanalysis data. Hydrol. Earth Syst. Sci. 2017, 21, 589–615. [Google Scholar] [CrossRef] [Green Version]
  12. Funk, C.; Peterson, P.; Landsfeld, M.; Pedreros, D.; Verdin, J.; Shukla, S.; Husak, G.; Rowland, J.; Harrison, L.; Hoell, A.; et al. The climate hazards infrared precipitation with stations—a new environmental record for monitoring extremes. Sci. Data 2015, 2, 150066. [Google Scholar] [CrossRef] [Green Version]
  13. Van de Giesen, N.; Hut, R.; Selker, J. The Trans-African Hydro-Meteorological Observatory (TAHMO). Wiley Interdiscip. Rev. Water 2014, 1, 341–348. [Google Scholar] [CrossRef] [Green Version]
  14. Beck, H.E.; Vergopolan, N.; Pan, M.; Levizzani, V.; van Dijk, A.I.; Weedon, G.P.; Brocca, L.; Pappenberger, F.; Huffman, G.J.; Wood, E.F. Global-scale evaluation of 22 precipitation datasets using gauge observations and hydrological modeling. Hydrol. Earth Syst. Sci. 2017, 21, 6201–6217. [Google Scholar] [CrossRef] [Green Version]
  15. Le Coz, C.; van de Giesen, N. Comparison of rainfall products over sub-Sahara Africa. J. Hydrometeorol. 2019. [Google Scholar] [CrossRef]
  16. Peel, M.C.; Finlayson, B.L.; McMahon, T.A. Updated world map of the Köppen-Geiger climate classification. Hydrol. Earth Syst. Sci. Discuss. 2007, 4, 439–473. [Google Scholar] [CrossRef] [Green Version]
  17. Herrmann, S.M.; Mohr, K.I. A continental-scale classification of rainfall seasonality regimes in Africa based on gridded precipitation and land surface temperature products. J. Appl. Meteorol. Clim. 2011, 50, 2504–2513. [Google Scholar] [CrossRef]
  18. Arkin, P.A.; Meisner, B.N. The relationship between large-scale convective rainfall and cold cloud over the western hemisphere during 1982-84. Mon. Weather Rev. 1987, 115, 51–74. [Google Scholar] [CrossRef] [Green Version]
  19. Adler, R.F.; Negri, A.J.; Keehn, P.R.; Hakkarinen, I.M. Estimation of monthly rainfall over Japan and surrounding waters from a combination of low-orbit microwave and geosynchronous IR data. J. Appl. Meteorol. 1993, 32, 335–356. [Google Scholar] [CrossRef] [Green Version]
  20. Xu, L.; Gao, X.; Sorooshian, S.; Arkin, P.A.; Imam, B. A microwave infrared threshold technique to improve the GOES precipitation index. J. Appl. Meteorol. 1999, 38, 569–579. [Google Scholar] [CrossRef]
  21. Vicente, G.A.; Scofield, R.A.; Menzel, W.P. The operational GOES infrared rainfall estimation technique. Bull. Am. Meteorol. Soc. 1998, 79, 1883–1898. [Google Scholar] [CrossRef]
  22. Maidment, R.I.; Grimes, D.; Black, E.; Tarnavsky, E.; Young, M.; Greatrex, H.; Allan, R.P.; Stein, T.; Nkonde, E.; Senkunda, S.; et al. A new, long-term daily satellite-based rainfall dataset for operational monitoring in Africa. Sci. Data 2017, 4, 170063. [Google Scholar] [CrossRef]
  23. Hsu, K.l.; Gao, X.; Sorooshian, S.; Gupta, H.V. Precipitation estimation from remotely sensed information using artificial neural networks. J. Appl. Meteorol. 1997, 36, 1176–1190. [Google Scholar] [CrossRef]
  24. Hong, Y.; Hsu, K.L.; Sorooshian, S.; Gao, X. Precipitation estimation from remotely sensed imagery using an artificial neural network cloud classification system. J. Appl. Meteorol. 2004, 43, 1834–1853. [Google Scholar] [CrossRef] [Green Version]
  25. Salvador, S.; Chan, P. Toward accurate dynamic time warping in linear time and space. Intell. Data Anal. 2007, 11, 561–580. [Google Scholar] [CrossRef] [Green Version]
  26. Hofstätter, M.; Lexer, A.; Homann, M.; Blöschl, G. Large-scale heavy precipitation over central Europe and the role of atmospheric cyclone track types. Int. J. Clim. 2018, 38, e497–e517. [Google Scholar] [CrossRef] [PubMed] [Green Version]
  27. Scofield, R.A. The NESDIS operational convective precipitation-estimation technique. Mon. Weather Rev. 1987, 115, 1773–1793. [Google Scholar] [CrossRef]
  28. Kaspar, F.; Müller-Westermeier, G.; Penda, E.; Mächel, H.; Zimmermann, K.; Kaiser-Weiss, A.; Deutschländer, T. Monitoring of climate change in Germany - data, products and services of Germany’s National Climate Data Centre. Adv. Sci. Res. 2013, 10, 99–106. [Google Scholar] [CrossRef] [Green Version]
  29. Karlsson, K.G.; Anttila, K.; Trentmann, J.; Stengel, M.; Meirink, J.F.; Devasthale, A.; Hanschmann, T.; Kothe, S.; Jääskeläinen, E.; Sedlar, J.; et al. CLARA-A2: the second edition of the CM SAF cloud and radiation data record from 34 years of global AVHRR data. Atmos. Chem. Phy. 2017, 17, 5809–5828. [Google Scholar] [CrossRef] [Green Version]
  30. Torres, C.E.; Barba, L.A. Fast radial basis function interpolation with Gaussians by localization and iteration. J. Comput. Phys. 2009, 228, 4976–4999. [Google Scholar] [CrossRef]
  31. Sakoe, H. Dynamic programming algorithm optimization for spoken word recognition. IEEE Tran. Acoust. Speech Signal Process. 1978, 26, 43–49. [Google Scholar] [CrossRef] [Green Version]
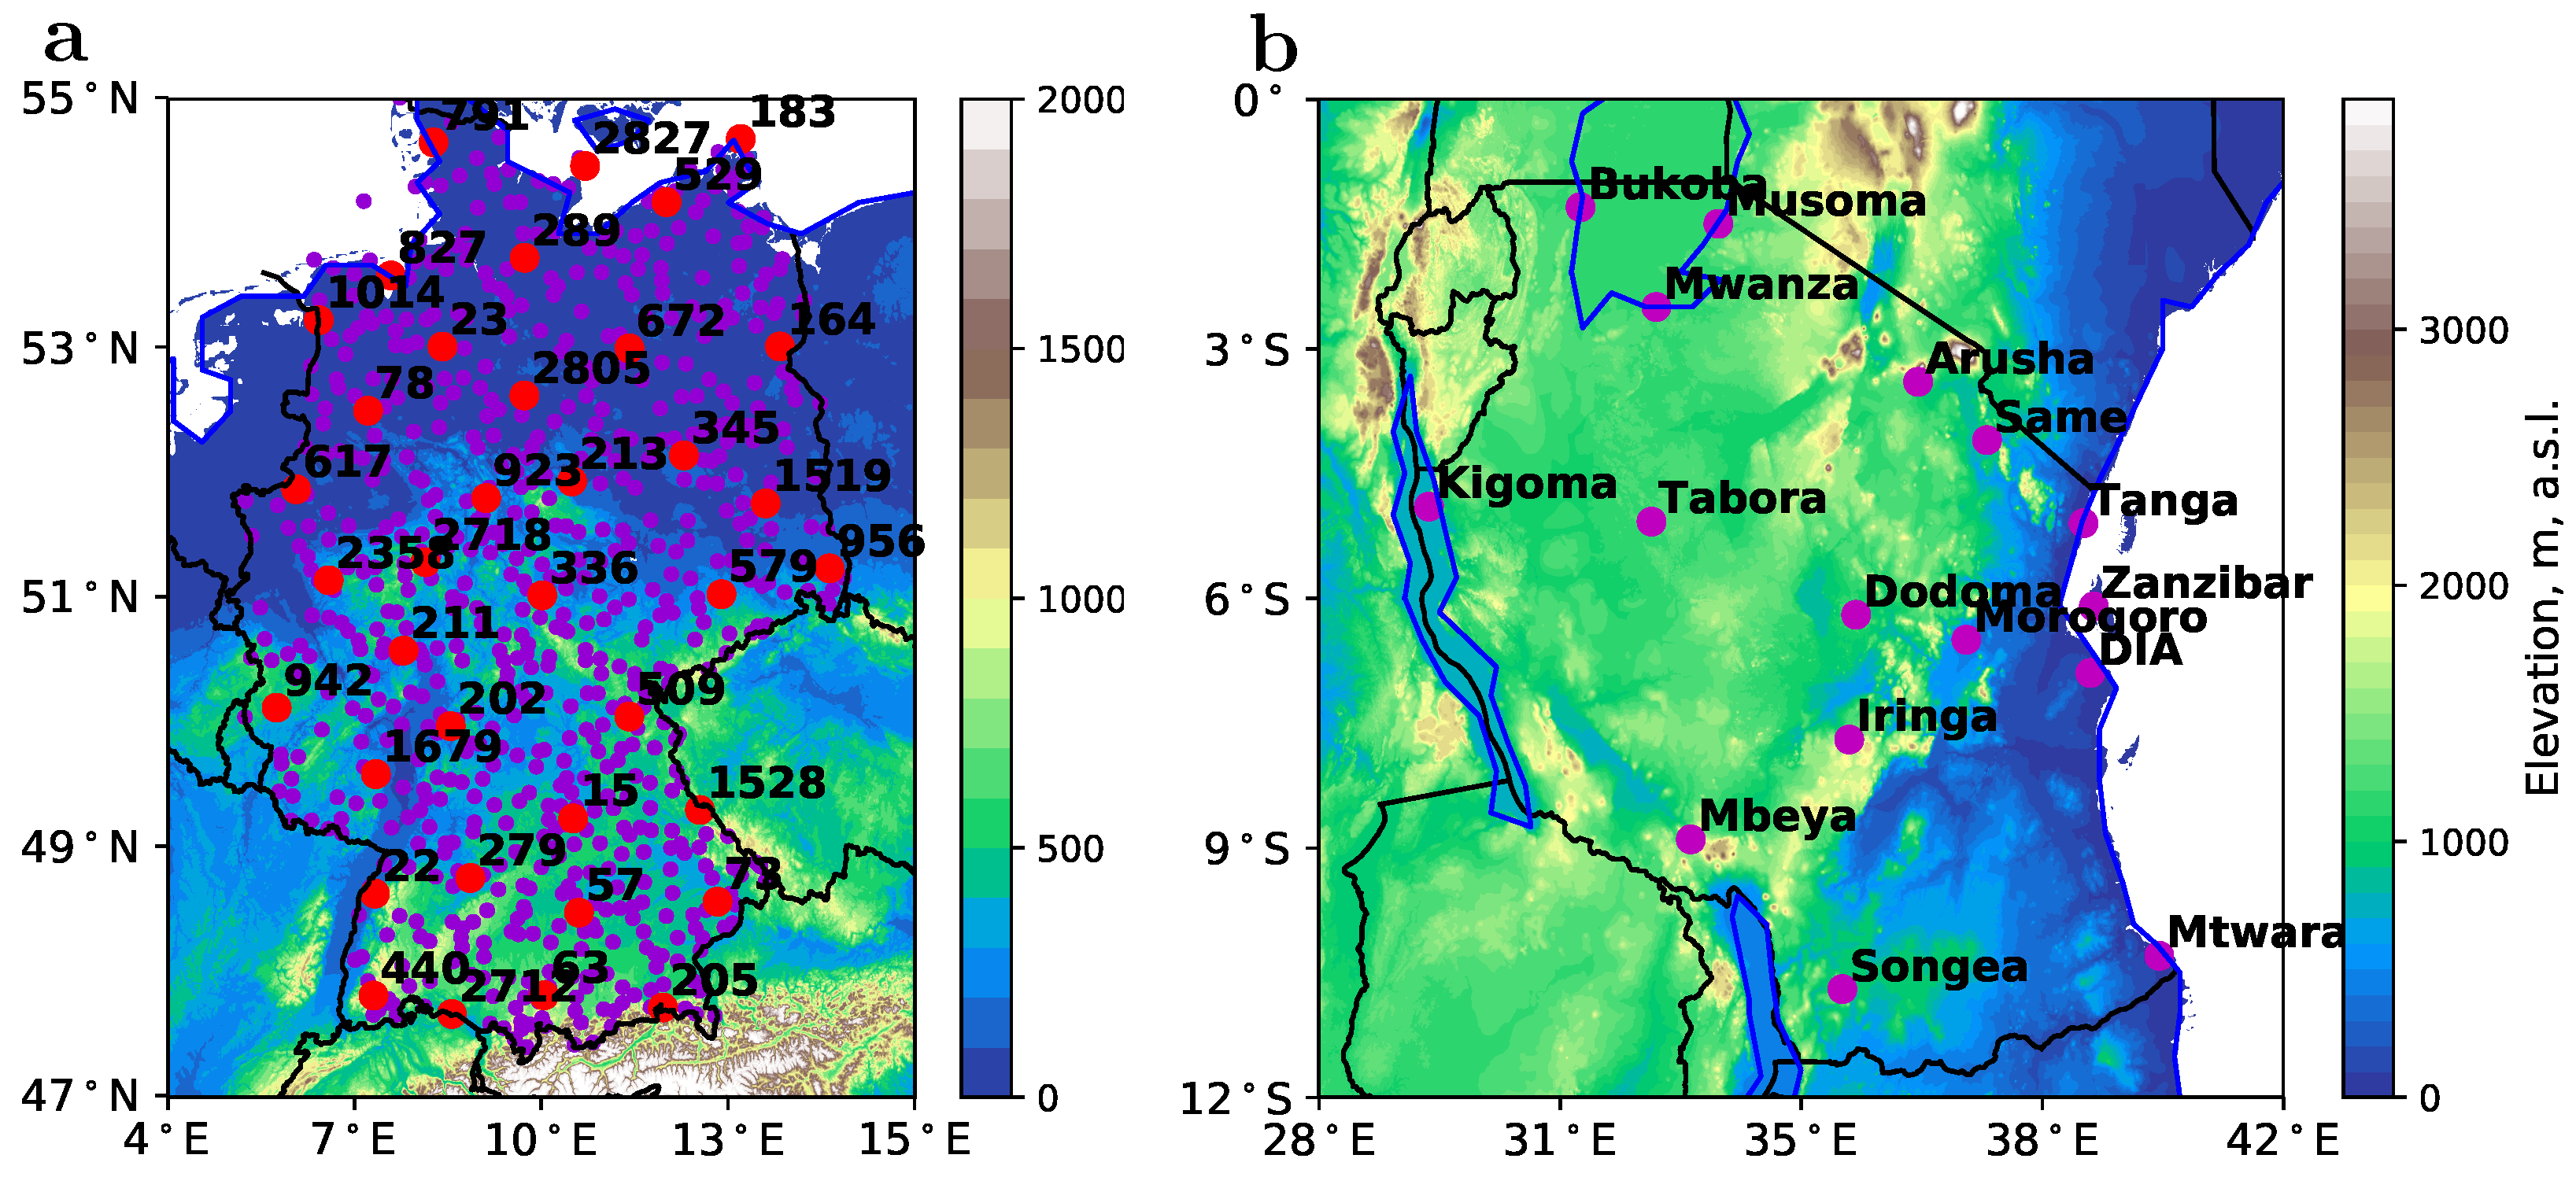
Figure 1. Locations of weather stations and topography of Tanzania and Germany with: (a) Climate Data Center (CDC) stations and topography over Germany, where red dots are stations for clustering with their CDC station numbers and purple dots are for classification; and (b) Tanzania Meteorological Agency (TMA) stations with their station names and topography over Tanzania. Black lines are political boundaries and blue lines are boundaries of waterbodies, such as lakes and oceans.
Remotesensing 12 00289 g001
Figure 2. Flowchart of the methodology. Red parallelograms are important outputs of the method; i.e., clustering of gauges and classification of grid cells, where labels of classes mean satellite pixels labeled to precipitation regime clusters. For the German case, we conducted the process of classification in the dashed rectangular using both satellite data and gauge data, and then compared the resulting two sets of labels for validation of the methodology.
Remotesensing 12 00289 g002
Figure 3. Dendrograms, clustering, and classification results using daily time series from CLARA CTT, CMORPH precipitation, and CDC stations over Germany. (a,b) Dendrograms based on CDC and CLARA, respectively. (c,d) Clustering of 37 CDC station locations using CDC and CLARA data, respectively. (e,f) Classifications of 691 CDC station locations using CDC and CLARA data over Germany. (g,h) Dendrograms based on CDC and CMORPH, respectively. (i,j) Clustering of CDC stations using CDC and CMORPH data, respectively. (k,l) Classification of CDC stations using CDC and CMORPH data over Germany.
Remotesensing 12 00289 g003
Figure 4. Illustration of Minkowski distance, dynamic time warping (DTW) distance and Sakoe–Chuba band using CTT time series at pixels of TMA stations Dodoma and Kigoma, with (a) Mikowski distance; (b) DTW distance and its optimal path along the time axis; and (c) Sakoe–Chuba band with bandwidth r = 10 .
Remotesensing 12 00289 g004
Figure 5. Statistical scores computed for CLARA CTT data and CMORPH precipitation data over Germany and Tanzania. The left column shows the criteria values (correlation coefficients) for selecting optimal temporal scales, with (a,c) computed respectively using CLARA and CMORPH data over Germany, and (e,g) respectively using CLARA and CMORPH over Tanzania. The right column shows the criteria values (alignment scores) for selecting numbers of clusters, with (b,d) computed respectively using CLARA and CMORPH data over Germany, and (f,h) respectively using CLARA and CMORPH over Tanzania. Dots in the plots represent the selections made by the criteria.
Remotesensing 12 00289 g005
Figure 6. One sample from cross validation for clustering and classification of CDC stations over Germany using daily CLARA CTT and CMORPH precipitation data. (ad) CLARA case and (eh) CMORPH case.
Remotesensing 12 00289 g006
Figure 7. Clustering of TMA stations and classification of grid cells over Tanzania using TMA or CLARA CTT 5-day moving averages. (a,b) Dendrogram and clustering of TMA stations based on TMA data. (ce) Dendrogram and clustering of TMA stations, and classification of Tanzania grid cells based on CLARA data.
Remotesensing 12 00289 g007
Figure 8. Clustering of TMA stations and classification of grid cells over Tanzania using TMA or CMORPH precipitation 5-day moving averages. (a,b) Dendrogram and clustering of TMA stations based on TMA data. (ce) Dendrogram and clustering of TMA stations, and classification of Tanzania grid cells based on CMORPH data.
Remotesensing 12 00289 g008