Abstract
Ground subsidences, either caused by natural phenomena or human activities, can threaten the safety of nearby infrastructures and residents. Among the different causes, mining operations can trigger strong subsidence phenomena with a fast nonlinear temporal behaviour. Therefore, a reliable and precise deformation monitoring is of great significance for safe mining and protection of facilities located above or near the mined-out area. Persistent Scatterer Interferometry (PSI) is a technique that uses stacks Synthetic Aperture Radar (SAR) images to remotely monitor the ground deformation of large areas with a high degree of precision at a reasonable cost. Unfortunately, PSI presents limitations when monitoring large gradient deformations when there is phase ambiguity among adjacent Persistent Scatterer (PS) points. In this paper, an improvement of PSI processing, named as External Model-based Deformation Decomposition PSI (EMDD-PSI), is proposed to address this limitation by taking advantage of an external model. The proposed method first uses interferograms generated from SAR Single Look Complex (SLC) images to optimize the parameter adjustments of the external model. Then, the modelled spatial distribution of subsidence is utilized to reduce the fringes of the interferograms generated from the SAR images and to ease the PSI processing. Finally, the ground deformation is retrieved by jointly adding the external model and PSI results. In this paper, fourteen Radarsat-2 SAR images over Fengfeng mining area (China) are used to demonstrate the capabilities of the proposed method. The results are evaluated by comparing them with leveling data of the area covering the same temporal period. Results have shown that, after the optimization, the model is able to mimic the real deformation and the fringes of the interferograms can be effectively reduced. As a consequence, the large gradient deformation then can be better retrieved with the preservation of the nonlinear subsidence term. The ground truth shows that, comparing with the classical PSI and PSI with unadjusted parameters, the proposed scheme reduces the error by 35.2% and 20.4%, respectively.
1. Introduction
Over 7269 million tonnes (Mt) of hard coal and 787 Mt of lignite are currently produced worldwide [1]. Mining activities may cause ground subsidence that can threaten the safety of nearby residents and can disturb agricultural and industrial activities [2]. Therefore, deformation monitoring in mining areas is of great significance for safe mining and protection of buildings and houses above the mined-out area. The conventional monitoring methods, which include leveling, Global Positioning System (GPS), and total stations, are laborious and time consuming [3]. On the other hand, Differential Interferometric Synthetic Aperture Radar (DInSAR), also known as Persistent Scatterer Interferometry (PSI), based monitoring has advantages regarding the size of the area that can be covered, its relative independence on the weather conditions, and good precision in the deformation time-series [4]. Continuously improved methods for selecting stable points and recombination of interferometric image pairs with different baselines increase the accuracy and robustness of PSI technology and expand its application to multiple cases like cities [5], volcanoes [6,7], earthquakes [8,9], landslides [10,11], and mining [12,13].
Classically there are two deformation estimation approaches: one requires the phase unwrapping of the interferograms [14], and the other adjusts a velocity model to data and retrieves the nonlinear term [15]. The former can directly obtain the deformation time-series, while the latter requires two steps. In both methods, the errors of the Digital Elevation Model (DEM) used for generating the differential interfreograms as well as an estimation of the atmospheric artifacts that can contaminate the interferograms are retrieved.
However, large deformation gradients may lead to inaccuracies of PSI monitoring results. For the first method, the phase difference between two adjacent points, either in space or time, are assumed to be within half a cycle in order to properly unwrap the phase. With the second method all or some, depending on the implementation, interferometric phases among neighbouring pixels have to be within half a cycle. Large deformation patterns can cause phase jumps in the interferograms larger than half a cycle among pixels. Methods working with interferogram at full resolution, in comparison with multi-look based ones, help to reduce the chances having wrapped phases beyond the half cycle limit [16]. Higher pixel densities help also to reduce the phase differences among neighbouring points.
For large deformation gradients, phases will be severely wrapped and other solutions are required, like the offset-tracking method [17]. This method can effectively retrieve large gradient deformations by using amplitude information instead of the interferometric phase. This alternative presents some limitations: (1) Its performance is affected by changes in the surface cover, the amplitude value may change, and the image registration process disturbed. (2) The deformation accuracy is related to the resolution of the SAR images, and so, it is far below the results provided by the interferometric phase.
For most of the SAR acquisition modes, image resolutions are in the order of meters, but for spotlight data, it can be under the meter. The image registration accuracy is not better than 0.01 pixels for the most suited cases. Therefore, the accuracy of surface deformation measurement by offset tracking is mostly at the meter or centimeter levels, which is by far lower than PSI phase-based approaches.
Another method to retrieve deformation beyond the ability of phase unwrapping is to use settlement model logistic [18]. Similar to the previous method, the external model is used to calculate the deformation which cannot be obtained correctly by phase unwrapping. This method can obtain the subsidence at any position in the monitoring area. However, both the subsidence and the sinking velocity of the logistic model at the initial mining moment are not zero. As a result, the accuracy of the estimation and simulation in the initial mining period is low. Moreover, the model needs several feature points to ensure accuracy during the mining simulation process. The insufficiency of feature points could have a large effect on the accuracy of the model fitting results [19]. Probability Integration Method (PIM) is a more suitable model for mining subsidence calculation. It was firstly proposed by J. Litwiniszyn [20] and is based on the random medium model that can well describe the surface deformation caused by coal mining [21]. The missing integer phase cycles caused by large gradient deformations are calculated through the PIM model, so the deformation can be obtained completely [22]. This method does not discard the information monitored by InSAR, and theoretically, it can get more detailed information. However, it assumes that phases other than those calculated by the PIM model (including atmospheric errors, DEM errors, and deformation phases not simulated by PIM) are less than one full cycle. This is unreasonable. The fringes of the interferograms may be too dense to allow for calculating the deformation correctly. Thus, like an external DEM is used to eliminate the fringes associated with the topographic phase when generating the differential interferograms, PIM is used to reduce the number of fringes associated with deformation [23]. However, the determination of some parameters in the PIM model depends on the actual working face geological conditions and mining conditions. Different geological mining conditions will cause a large estimation error of the parameters, and when the estimated parameters are different from the actual situation, it will cause a negative impact on the subsequent fitting estimation of the model.
Several methods have also been proposed to improve the performance of the constant velocity model in large gradient deformation monitoring. The Gaussian velocity model is used to estimate velocity fields and DEM errors [24]. This method can also fill areas where PS/Distributed Scatterer (DS) pixels are sparse or absent, but it requires the sinking area to be known. Still, a linear model is used and the nonlinear deformation can only be obtained by the residual phase. A third-order polynomial model is used to solve the nonlinear deformation [25]. This method can obtain the obvious time-series deformation of nonlinear characteristics, but the cubic polynomial is not applicable to all PS points because different subsidence phenomena appear in different mining phases.
Inspired by the aforementioned methods and in order to avoid the above constraints, in this paper, a new method with less parameter dependence and better nonlinear retrieving ability is presented. This method is named External Model-based Deformation Decomposition PSI(EMDD-PSI) and it uses PIM and a constant velocity model to retrieve first the linear and later with spatiotemporal filters the nonlinear deformation. Firstly, the differential interferograms are generated from the SLC images and the parameters of PIM are optimized using the information contained on individual interferograms. After that, fringes of the differential interferograms are eliminated or strongly reduced with the simulations provided by PIM with the optimized parameters. Then, subsidence is estimated from the residues to retrieve the remaining subsidence not considered by the model. Finally, the complete time-series deformation is retrieved. To assess the performance of the proposed EMDD-PSI, it has been tested with 14 Radarsat-2 images over Fengfeng mining area (China). The benefits of the proposed EMDD-PSI have been evaluated and discussed.
This paper is organized as follows. Section 2 describes the principals and detailed procedures of the proposed EMDD-PSI. In Section 3, data sets and study area are briefly introduced. Then, the results obtained with the proposed and traditional methods are compared with the ground truth in Section 4. In Section 5, some procedures and results are discussed. Finally, conclusions are made in Section 6.
2. Methodology
2.1. The Probability Integration Method
Probability integration, firstly proposed by J. Litwiniszyn [20], is a mining subsidence simulation method based on stochastic medium theory. It considers the movement of particles, such as sand or tiny rock masses, as a random event, which makes the relationship between particles irrelevant. The mining area can be divided into a number of differential units with the assumption that they are mined. The total impact of the complete mining on the rock formation and the surface can be regarded as the integral of the small impact generated during the mining of the differential units. As shown in Figure 1a, when the ball (named ) on the first floor is taken away, one of the balls on the second floor ( and ) will fall, so the probability of falling for each of the two balls is . Then, one of the balls on the third floor will fall, and the falling probabilities for each of the three are , , and , respectively (in Figure 1b).
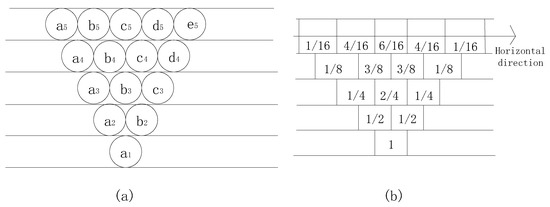
Figure 1.
Theoretical model of particulate medium; (a) theoretical model and (b) distribution of particulate movement probability.
On this basis, the differential equation of the probability distribution function of the sinking event is obtained. The surface subsidence at point x is as follows:
where stands for the subsidence value at x, is the max value of the subsidence curve, r is the major influencing radius, is the error function, and . The location of is the coal mining boundary.
The integral can be extended to two dimensions. The length and width of the working surface are l and L, respectively; then, the subsidence value of point on the surface is as follows:
The parameters in Equation (2) can be calculated as follows:
In Equation (3), q is the subsidence coefficient; m is the mining thickness; is the dip angle of the coal seam; is the average distance of the coal seam from the ground surface; is the tangent of main effect angle; is the main influence radius of the downhill direction; is the main influence radius of the uphill direction; is the propagation angle of extraction; k is the propagation coefficient of extraction; is the length of the mining face; is the width of the mining face; l and L are the equivalent length and width of the mining face; and , , and are the deviations of the inflection point. These parameters have to be set to simulate the subsidence.
2.2. Psi Processing
SUBSIDENCE-GUI, the software implementation of the Coherence Pixels Technique (CPT) developed at Universitat Politècnica de Catalunya (UPC), is used to perform the PSI processing. CPT consists of five main parts: interferograms selection and generation, pixel selection, linear deformation estimation, nonlinear deformation estimation, and final result generation [26,27]. First, the interferograms are generated and persistent pixels are selected. The selection criterions are basically divided in two families: those working at full-resolutions, like amplitude dispersion, [15], or Temporal Phase Coherence (TPC) [28], and those working with multi-looked interferograms which rely on the coherence, [26,29,30]. The former is, in principle, more suited for detecting deterministic targets, while the latter is better suited for distributed ones. The surface of the mining area is often covered by soil, so coherence has been used to select the pixels with a multilook in order to preserve resolution and a mean coherence threshold of . The phase standard deviation of the selected coherence threshold and multi-look is 32.
Then, the linear deformation is calculated. The phase at each interferogram pixel contains five components as described in Equation (4),
where is the wrapping operator. , , , , , and are the linear deformation phase, nonlinear deformation phase, atmospheric phase, orbit inaccuracies induced phase, DEM error phase, and the noise phase. First, the DEM and orbital error phases appear during generation of the differential interferograms in which the phase terms associated with the topography are cancelled with the satellite orbits and an external DEM of the area. Nowadays, the orbits of the satellites are usually very precise and most of the residual errors are caused by DEM inaccuracies. Small errors are not a problem as the DEM is refined as a side product of the linear processing step. After applying the selected pixel selection criteria, a Delaunay triangulation is carried out to establish relations among the selected persistent pixels. The objective of this triangulation is to work with phase increments among pixels instead of absolute phases, thus canceling the phase offset among interferograms [31]. A linear model that considers not only the linear velocity term but also the DEM error change among neighbouring pixels is adjusted, using the Conjugate Gradient Method (CGM), to all phase increments. The absolute values for all selected pixels are obtained through an integration process of the increments, using a different implementation of the CGM. In practice, relations with deformation differences over can be retrieved correctly with CPT, but the performance strongly depends on the distribution of temporal and spatial baselines. After that, the nonlinear deformation is calculated over the residual phases. According to Equation (4), the residual phase includes the nonlinear deformation, atmosphere, and noise terms. Nonlinear deformation and atmosphere are separated through spatial low-pass and temporal high-pass filters. Finally, the linear and nonlinear deformations are integrated to obtain the deformation time-series of the selected persistent pixels.
2.3. Ground Subsidence Retrieval with Psi And Pim
When PSI techniques try to monitor deformations with large gradients in a mining area, one of the challenges is the error caused by the so-called phase saturation. When the Line-of-Sight (LOS) deformation difference between two adjacent pixels exceeds [32], with as the wavelength of the carrier frequency, the correct deformation cannot be retrieved. As mentioned in Section 1, a proper model of the subsidence phenomena can be used to reduce the phase difference among adjacent pixels. However, inaccurate model parameters may introduce additional fringes in the interferograms instead of reducing them.
In this paper, a method is proposed to increase the accuracy of PSI monitoring of large gradient deformations by reducing the fringes of the interferograms, as shown in Figure 2. The differential interferograms are referred to as original interferograms. The subsidence maps generated by the PIM model are called the model-simulated maps. The proposed approach mainly consists of three steps: (a) optimizing the adjustment of the model parameters using individually all or a subset of the original interferograms and then generating model simulated maps; (b) removing or reducing the deformation fringes in all interferograms with the simulated maps; and (c) PSI processing the cleaned interferograms, obtaining the residual deformation not considered by the model, and finally generating the deformation time-series adding the model-simulated maps to the calculated residual deformations.
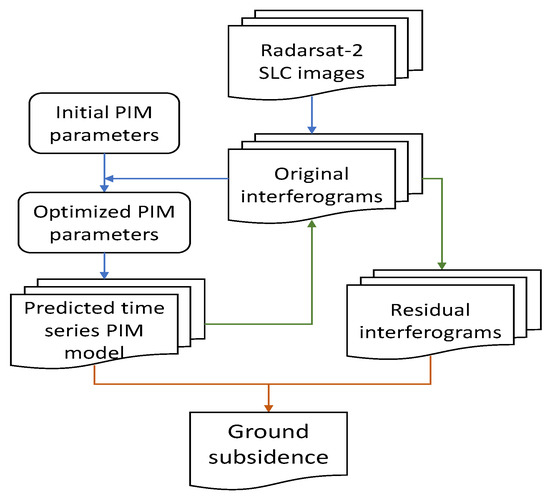
Figure 2.
Overall processing scheme.
- (a)
- Parameter optimization
The purpose of parameter optimization is to make the model simulated deformation as close as possible to the original interferograms by adjusting the parameters of the PIM model. Generally, there are two ways to obtain these parameters. One is by inversion according to the ground subsidence value; the subsidence can be acquired by measurement of InSAR, GPS, or leveling, while the other is from a priori knowledge. All the parameters are listed in Table 1 with their obtaining methods and effects.

Table 1.
Obtaining method and effect of Probability Integration MEthod (PIM) parameters.
Obviously, not all the parameters need to be optimized. The parameters obtained from the measurements should not be changed because they represent the actual situation of the working panel. According to [33], different working panels should be simulated with different PIM parameters obtained by a priori knowledge because of their different geological structure and mining conditions. Similarly, not all the parameters from a priori knowledge need to be optimized either. Here, mainly two factors are considered: one is due to the simplification of the model, and the other is “the curse of dimensionality”.
Due to simplification of the model, the coal seam is considered horizontal. Under these circumstances, some parameters do not need to be optimized anymore, such as the maximum sinking angle, which represents the influence caused by the tilt of the coal seam. When the coal seam is horizontal, the maximum sinking angle is . Also, since the horizontal deformation is ignored, the horizontal movement coefficient is not necessary as its role is to calculate the maximum horizontal movement.
Inflection point offsets are used to determine the horizontal distance between inflection points and the working panel boundaries. The tangent of main effect angle represents the ratio between the depth and the distance from basin center to the inflection points. Once the coordinates and depth of the working panel are determined, these parameters will have the same influence on the basin, i.e., they are in same dimensionality. The four inflection point offsets correspond to the four boundaries of the working panel. Since the model is considered symmetrical, it is enough to just optimize the tangent of the main effect only.
In order to increase the condition number of the adjustment and to make the simulation more accurate, two additional offset parameters are added. They are not PIM parameters, but they are used to correct the subsidence location to compensate for the impact of faults and adjacent goafs. With the three PIM parameters, there are a total of five parameters participating in the optimization. These five parameters are named parameters that can be optimized (PMCBO).
After the PMCBOs are defined, the next step is optimization to better match the model-simulated deformation to the original interferograms. A brute force approach is used, i.e., given a search range (max and min values) and step size for the parameters, the values of all possible combinations are fed into the PIM model to get all possible simulated maps. Then the model-simulated maps are transformed from deformation to interferometric wrapped phases in radar coordinates to be consistent with the original interferograms. After that, the phase difference between the simulated model maps and the original interferograms is calculated to measure the degree of compliance of the model for each parameter combination.
In addition, only those PS pixels with a coherence beyond 0.6 and located within the PIM-simulated basin are used to calculate the phase difference. The average of the absolute values of the phase differences is considered the metric to evaluate the agreement between the simulated model maps and the original interferograms.
- (b)
- Fringe reduction
The purpose of reducing the number of fringes in the interferograms is to improve the accuracy and reliability of the solution by reducing phase ambiguities among adjacent points in the PSI processing. After obtaining the optimized PMCBOs, model-simulated maps are generated using PIM. After converting the model-simulated subsidence values into interferometric phases in radar coordinates, the cleaned interferograms are obtained by subtracting the model phase from the original interferograms. The cleaned interferograms are also mentioned as residual interferograms. Ideally, if the model simulated maps were absolutely consistent with the original interferograms, that is, the phase difference between both would be zero and all fringes in the original interferograms would have been removed. This situation is clearly unrealistic as both the model and their parameter adjustments present limitations. In fact, the objective is to reduce the fringes under an acceptable level and not to remove them completely.
- (c)
- Deformation retrieval
CPT is applied to obtain the time-series deformation and subsidence velocity from the residual interferograms, which is called the residual deformation information. This deformation is added to the one simulated by the model to determine the complete deformation time-series.
3. Study Area and Data Set
3.1. Study Area
The 15235 working face of the Jiulong mining area is selected as the test site. It is located in Fengfeng coalfield, Hebei Province (China), and is surrounded by villages, industrial plants, and farmlands. The working face presents a length of 935 m in the strike direction, a length of 142 m in the dip direction, an average coal mining thickness of 4.5 m, and an average mining depth of 740 m. The inclination of the working face is between 12 and 15 with an average of 14. To the south of the study area, there is the 15221N working face goaf; to the north is the northern boundary of the minefield; and to the west is the DF4 fault and the Daqing waterproof coal pillar. Due to the proximity of the DF4 fault, there may be some small faults to the west of the 15235 working face.
3.2. Data Set
Fourteen ascending Radarsat-2 Stripmap images were collected from 4 April 2015 to 5 March 2016, with HH polarization. The incidence angle ranges from 33.9 to 37.1. The pixel resolution is approximately 2.66 m in the range direction and 2.91 m in the azimuth one. Radarsat-2 works at C-band and has a revisit period of 24 days. The wavelength of the carrier is 5.55 cm. A Digital Elevation Model (DEM) with pixels spacing of 10 m from the Shuttle Radar Topography Mission (SRTM) is used to help with coregistration and to remove the topographic phase.
The characteristics of the area of interest, barely urbanized and covered with vegetation mainly consisting of wheat that induces temporal decorrelation, and the strong gradient deformation introduce a severe constraint on the maximum temporal baselines that can produce useful interferograms. The interferograms are generated using a Delaunay triangulation, where the maximum temporal baseline has been set to 48 days while the maximum spatial baseline has been set to 360 m. A total of 16 interferograms have been generated for which the details are summarized in Table 2.
Table 2.
Parameters of interferogram pairs.
In order to validate the InSAR monitoring result, leveling data provided by China University of Mining and Technology (CUMT) is used as the ground truth. It was collected on 24 April 2015 and 4 March 2016, and the accuracy of the leveling data is better than 1 mm. The positions of the leveling stations are shown in Figure 3 as blue points. The station number gets higher from northeast to southwest in the strike direction and from south to north in the dip direction.
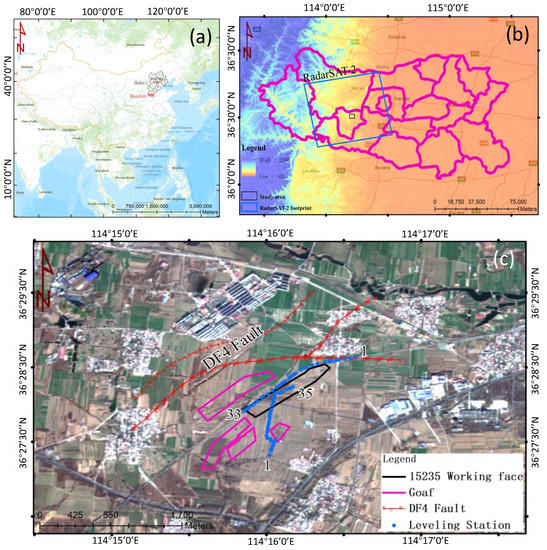
Figure 3.
Study area overview: (a) shows the location of the study area. (b) shows the coverage of RADARSAT-2 images and the altitude of the study area. (c) shows the goafs, working faces, faults, and leveling stations. The numbers around the blue points indicate the name of the leveling station.
4. Results
In this section, the performance of the proposed method is evaluated in terms of the consistency of the model-simulated maps and the original interferograms, the comparison with the traditional PSI processing, and finally, verification with the available ground-truth data.
4.1. Consistency of the Model-Simulated Deformation Maps with the Original Interferograms
Figure 4 shows the wrapped phase maps of the 16 original interferograms generated from the 14 SLC images (the first and fourth columns), simulated by PIM (the second and fifth columns) and residual interferograms (the third and sixth columns), in radar coordinates.
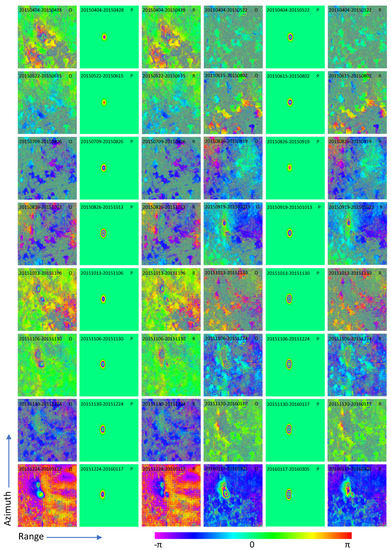
Figure 4.
Phase maps of 16 original interferograms, model-simulated deformation, and residual interferograms in image coordinates: The acquisition dates of master image and slave image of each interferogram is on the top; O indicates original interferogram, P means the phase map derived from PIM model, and R represents the residual interferogram. For each interferogram, the vertical axis is azimuth direction and the horizontal axis is range.
Some of the original interferograms clearly show that there are two adjacent subsidence basins. They are caused by working panels 15235 and 15221N. Compared with UTM, the radar coordinate system is upside down. Therefore, in Figure 3 and Figure 5, 15235 is located above 15221N, while in Figure 4, 15235 is below 15221N.
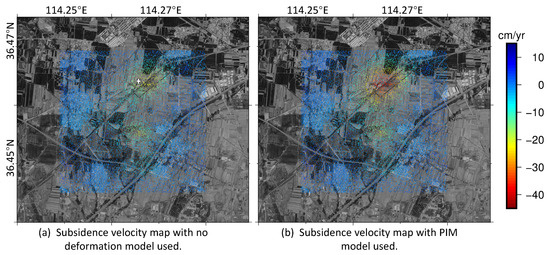
Figure 5.
Deformation velocity maps of the study area in vertical direction: the white cross symbol is the point with maximum deformation velocity.
It can be seen from the original interferograms that the sinking basin induced by the 15235 working face has an offset towards adjacent basins and faults. The borders of the two mining basins are even connected together. In some interferograms, fringes are barely visible due to the poor quality of the phase, which is heavily decorrelated. Although there are only two different temporal baselines (24 days and 48 days) in the dataset, the number of interferometric fringes varies widely along time, highlighting the nonlinear behaviour of the subsidence pattern.
Some strange horizontal thick fringes appear in the interferogram 20151224–20160117. Four possible reasons are examined: DEM error, ground surface change, groundwater caused deformation, and atmospheric artefacts. DEM is checked, and its shape does not match these features. Ground surface did not change so much during that time. There are some villages in this area, and the domestic water of local people is from groundwater (it is normal in China). The decline of the groundwater may cause subsidence like this. However, if these fringes were caused by groundwater, mining activities should affect the groundwater and the subsidence basins caused by groundwater and mining will become a large one, instead of two separate basins. Since other possibilities are ruled out and the strange area is large enough (at least 3 km), the most likely reason for the strange fringes are atmospheric artifacts.
The model-simulated maps are first back-geocoded from UTM coordinates into radar coordinates and then phase wrapped. As it can be seen in Figure 4, in contrast to the original interferograms, the simulated basins do not develop towards surrounding basins and faults and they have the characteristics of regular shape and neat boundary while the rest has a phase equal to 0. This is because the model considers the rock formations above the working panel as having the same mechanical properties, and the information of other goafs and faults is not considered.
In residual interferograms, it can be seen that there are still small residual phases distributed around the 15235 basin because the upper basin and faults are not considered in the model. In general, the number of fringes has been reduced in the interferograms showing clear and significant fringes. It can be clearly seen that the number of fringes in the lower basin has been reduced, which proves the accuracy of the model despite their boundaries being not perfectly adjusted. It has to be kept in mind that the goal was to reduce the high-frequency fringes but that cancelling them completely was not compulsory.
4.2. Comparison with the Traditional Psi Processing
Figure 5 shows the subsidence vertical velocity maps obtained with SUBSIDENCE-GUI in UTM coordinates without and with the deformation model. The upper subsidence basin, caused by the mining of 15235 working face, is the one that has been modeled. By comparing the two figures, it can be seen that the PS density and location are almost identical in both cases. The difference of mean coherence of the original and cleaned interferograms in the subsidence area is only 0.03, which is too small to influence the pixel selection step. The reason that the coherence has only a small improvement after fringe removal is because the frequency of the fringes caused by mining are not extremely high and the multi-look is small, only . The key contribution of the PIM model in this case is to compensate the periods influenced by decorrelation instead of coherence improvement.
The characteristics of the mining area make it not specially suited for PSI processing. In order to have an acceptable density of pixels, the coherence threshold has been set to 0.5, which corresponds to a phase noise standard deviation of 33 with the 3 × 3 multi-look used. This is a lower value than usual, with coherence thresholds around 0.65 and associated phase standard deviations around 20. This makes the results noisier, but this loss of precision is compensated by the large values of deformation. The results in stable areas are almost identical with both approaches. As expected, the density of selected points is higher in urbanized areas than in rural fields. The subsidence basins in the two figures are not symmetrical. There is an offset to the southwest direction due to the influence of nearby faults and adjacent goafs. The subsidence basin induced by 15235 in Figure 5b is larger in extension and deformation values than in Figure 5a. The rationale of the differences will be detailed in Section 4.3.
A comparison of the time-series deformation obtained with the two methods in the location with the maximum subsidence velocity is shown in Figure 6. As it can be seen, the two time-series present the same trend, but it is steepest when using the subsidence model. They both have a slowly deformation rate tending to stabilization from 26 August to 19 September 2015. When the subsidence accelerates, from 19 September 2015 to 15 March 2016, the orange curve is almost a line, while the blue one shows that the subsidence rate starts to slow down. The behaviour of the blue line is consistent with the law of sinking after the surface point is affected by underlying mining. The deformation time-series are better retrieved thanks to the fringe reduction provided by PIM, which considers nonlinear deformation.
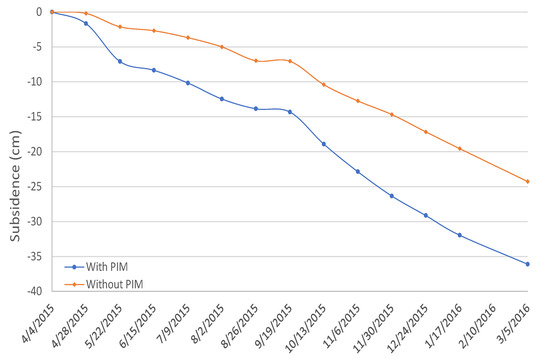
Figure 6.
The time-series subsidence in the Line-of-Sight (LOS) direction at the location with the maximum subsidence value.
4.3. Leveling Data Verification
The deformations obtained by PSI with and without PIM assistance are compared with leveling data in Figure 7. In the plots, the deformation retrieved with PIM without parameter optimization [23] is also included for comparison purposes. In order to be consistent with the leveling data, the deformation results have been transformed from the LOS to vertical directions. As the subsidence measured by leveling is from 24 April 2015 to 4 March 2016, the deformation monitored by PSI has been limited to the period from 28 April 2015 to 5 March 2016. It can be seen that the green and purple curves, PSI with PIM, decrease faster than the red one, PSI with no model, in both the dip and strike directions. This is because, compared to traditional PSI, PIM reduces the number of interferometric fringes in the sinking area, that is, the phase gradient. Thus, as the phase ambiguity of the relationship among PS points is reduced, the network is more robust. Moreover, part of the deformation is a priori retrieved by the external model. Therefore, PSI processing can achieve better results.
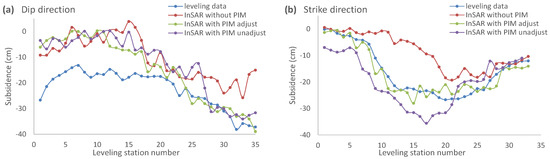
Figure 7.
Results comparison of different methods.
There are some differences with leveling stations 1 to 19 in Figure 7a because the subsidence in the dip direction is also affected by another working face not included in the model and so the subsidence is clearly underestimated. This result highlights the importance on the selection of the proper model. Meanwhile, it can be seen that the purple curve is shifted towards north and east compared to the green curve due to the setted offset in parameter optimization. As it can be seen in Figure 7b, the purple curve has a larger subsidence value than the green and blue ones. This is due to the unadjusted parameters used that generate a basin with subsidence larger than the actual one. After subtracting the over-modeled deformation, PSI obtains uplifts in the subsidence area when retrieving deformation from the residual interferograms. However, the over-modeled deformation is so large that there is ambiguity among PSs in the residual interferograms; therefore, the uplifts cannot be obtained completely. Then, the retrieved uplifts are not enough to neutralize the over-modeled deformation, so the final deformation is larger than it actually is. The purple curve in Figure 7a has no greater subsidence value because the basin produced by unadjusted parameters is shifted away from the leveling station, so the deformation value at the station becomes smaller.
Finally, the root mean square error (RMSE) of the three processing strategies is calculated according to the ground truth. The RMSE of PSI without modeling, with non-optimized, and with optimized modeling are 11.47, 9.34, and 7.43, respectively. This means that the accuracy of PSI with non-optimized modeling increased by 18.6% compared to conventional PSI, the accuracy of PSI with optimized modeling increased by 35.2% compared to conventional PSI, and the accuracy of PSI with optimized modeling increased by 20.4% compared to PSI with non-optimized modeling. The ground truth demonstrates the effectiveness of the proposed method.
In order to understand the effect of the parameters in the final results, Figure 8 shows the relationship between the error factor (as mentioned in Section 2.3, the average of the absolute values of the phase differences) and the sinking coefficient when the propagation angle of extraction changes. The searching range is expanded to 0∼1, and the step size is reduced to 0.01. It can be seen that, as the sinking coefficient increases, the factor gradually decreases and its fluctuation becomes smaller. Taking the curve of the propagation angle of extraction of 90 as an example, the minimum values are obtained periodically at 0.15, 0.32, and 0.67, respectively. This periodic phenomenon is due to the use of the wrapped phase for verification. The sinking coefficient controls the subsidence value; after transforming subsidence into the wrapped phase, the simulated deformation from the integer multiples values will have similar phases. Therefore, once one value of sinking coefficient can minimize the error factor, its integer multiples. This miscalculation can be avoided by setting the minimum estimated sinking coefficient as the final optimized result.
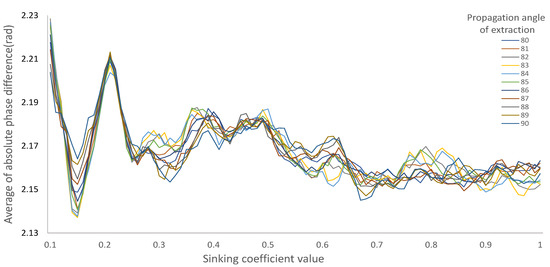
Figure 8.
Parameter variation law.
5. Discussion
5.1. Analysis of the Relationship Among Pmcbos
When the propagation angle of extraction is 83, the sinking coefficient which minimizes the error factor is 0.15. Figure 9 shows the relationship between the error factor and the propagation angle of extraction when the sinking coefficient is 0.15. It can be seen that, as the propagation angle of extraction increases, the error factor first decreases and then increases and the minimum value is obtained when the mining influence propagation angle is 83. It is worth noting that, in Figure 8, not all curves are at their minimum value when the sinking coefficient is 0.15. For example, when the mining influence propagation angle is 89, the sinking coefficient that minimizes the average of the phase difference is 0.68. When the propagation angle is 90, the sinking coefficient which minimizes the average value of the phase difference is 0.67. It is indicated that the optimal value of one parameter is affected by other parameters, which is why the brute force is used in this paper to optimize all values at the same time instead of determining the optimal parameters in turn, although that would cause a lower computational burden.
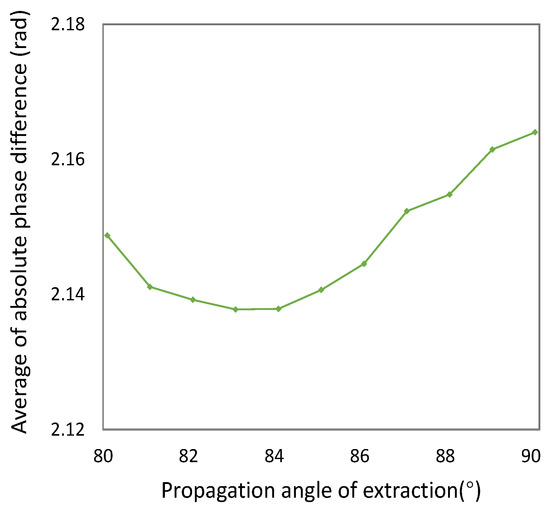
Figure 9.
Relationship between phase difference and propagation angle of extraction.
5.2. Analysis of the Parameter Optimization
The searching range, step size, and final optimization results of PMCBOs are shown in Table 3. The setting of step size and search range need to consider the balance between the calculation burden and the experiment accuracy.
Table 3.
Optimization of parameters that can be optimized (PMCBOs).
It can be seen that, compared with the parameters before optimization, the sinking coefficient, tangent of the main effect angle, and the propagation angle of extraction become smaller. Offsetting x and y to 150 and 90 from 0 means the basin shifts 150 m towards west and 90 m towards south.
The subsidence coefficient represents the ratio of the surface subsidence value to the thickness of the coal seam. The non-optimized sinking coefficient represents the ratio of the sinking value to the thickness of the coal seam when the ground surface becomes stable and no longer sinks. In this experiment, the working surface was still being mined during SAR imaging. The surface deformation during this time period was still continuous and did not reach stability. Therefore, the surface deformation value was smaller than it is when it is stable, so the corresponding sinking coefficient should be smaller.
The subsidence basin expanded due to the influence of the surrounding faults and goafs. The tangent of main effect angle represents the relationship between the depth of the mining and the radius of the sinking basin. According to Equation (3), , the tangent of the main effect angle becomes smaller, meaning the sinking basin becomes larger. This is consistent with the actual situation.
When the inclined coal seam is mined, the inflection point is not directly above the calculation boundary but it presents an offset to the direction of the diphead. The angle between the offset point and the ipsilateral calculation boundary and the horizontal line in the downhill direction is the propagation angle of extraction. When the propagation angle of extraction becomes smaller, it means the inflection point moves towards diphead. The diphead direction is the direction in which the basin spreads.
The positive directions of the two offsets are the west and south directions, respectively. These two directions are the directions of the fault and the adjacent goaf.
Compared to rock formations without the influence of other geological structures and mining activities, the faults and goafs contain more pores and fractures. Once the surrounding rock formations move, these pores and cracks are further compacted, causing the surface to sink. When the faults and goafs are close to the mining working face, the ground surface above them could be induced to sink. For coal mining, when the sinking basin caused by the working face being mined and the sinking basin caused by the further compaction of the rock are very close, they are connected together; it looks like there is a displacement of the sinking basin caused by the mining face. Due to the lack of information on adjacent working faces and faults, this experiment has only modeled the 15235 working face. To compensate for the basin offset, two offset parameters are set. It can be seen from Table 3 that the basins with optimized parameters have offsets of 150 m and 90 m respectively in the west and south directions compared to the basin without parameter optimization. This phenomenon can also be seen in Figure 7. Compared to the modeling of all surrounding geological structures and goafs, it is clear that setting two offset parameters is more efficient, although there could be some slight shape mismatch. As it can be seen in the residual interferogram part of Figure 4, there are clear residual phases at the right of the modeled basin. Through the calculation of RMSE in Section 4.3, it is shown that the benefits outweigh the disadvantages.
6. Conclusions
In this paper, a new method to extract large gradient deformations using PSI and an external model is proposed. The proposed method uses original interferograms to optimize the model parameters to reduce the dependence of the monitoring results on the model parameters and to improve the consistency between the model simulation results and the interferograms.
The 15235 working face in the China Fengfeng mining area has been used to evaluate the presented method. Experiments show that the PIM model with optimized parameters can effectively reduce the fringes in the original interferograms. By reducing the phase ambiguity between PS points and by extracting partial deformation in a nonlinear form, the PIM model can help PSI obtain more accurate time-series deformation. Through verification of the leveling data, the proposed method reduces the monitoring error by 35.2% compared to the traditional PSI and by 20.4% compared to PSI with non-optimized modeling. The results have shown that an appropriate external model can effectively improve the accuracy of PSI. Besides PIM, other models like the logistic and Gaussian models can also be used as long as they are able to adjust to the deformation pattern and temporal behaviour [18,24].
The methods and results of parameter optimization are discussed and analyzed. The optimization of the model parameters can prevent surrounding geological structures and goafs from effecting the modeling, and it can also avoid unsuitable parameters affecting the final PSI results. The method, validated with this particular dataset, can be used in different scenarios as long as the model is able to roughly replicate the extended and temporal behaviour of the area affected by subsidence.
There are still open issues though. If the impact of geological structures and goafs on the model could be removed, the modeling would be more accurate. Optimization of the model parameters with high efficiency and high precision would allow for a better modeling result.
Author Contributions
S.D., J.J.M., H.F. and M.Z. developed the methodologies and designed the experiments; S.D. and M.Z. performed the experiments; J.J.M. and S.D. analyzed and validated the results; S.D. wrote the paper and J.J.M. improved it. All authors have read and agreed to the published version of the manuscript.
Funding
This research was funded by China Scholarship Council (grant No.201806420035); by the Spanish Ministry of Economy, Industry, and Competitiveness (MINECO); by the State Research Agency (AEI); by the European Funds for Regional Development (EFRD) under project TEC2017-85244-C2-2-P; and by the CommSensLab. CommSensLab is Unidad de Excelencia Maria de Maeztu MDM-2016-0600 financed by the Agencia Estatal de Investigación, Spain.
Acknowledgments
The authors would like to thank the colleagues of School of Environment Science and Spatial Informatics of China University of Mining and Technology for collecting experimental data.
Conflicts of Interest
The authors declare no conflict of interest.
References
- Coal Mining. Available online: https://www.worldcoal.org/coal/coal-mining (accessed on 1 August 2020).
- Fan, H.; Gao, X.; Yang, J.; Deng, K.; Yu, Y. Monitoring mining subsidence using a combination of phase-stacking and offset-tracking methods. Remote Sens. 2015, 7, 9166–9183. [Google Scholar] [CrossRef]
- Zheng, M.; Deng, K.; Fan, H.; Huang, J. Monitoring and analysis of mining 3D deformation by multi-platform SAR images with the probability integral method. Front. Earth Sci. 2019, 13, 169–179. [Google Scholar] [CrossRef]
- Bamler, R.; Hartl, P. Synthetic aperture radar interferometry. Inverse Probl. 1998, 14, R1. [Google Scholar] [CrossRef]
- Khan, S.D.; Huang, Z.; Karacay, A. Study of ground subsidence in northwest Harris county using GPS, LiDAR, and InSAR techniques. Nat. Hazards 2014, 73, 1143–1173. [Google Scholar] [CrossRef]
- Pritchard, M.E.; Simons, M. An InSAR-based survey of volcanic deformation in the central Andes. Geochem. Geophys. Geosyst. 2004, 5, 1–42. [Google Scholar] [CrossRef]
- Henderson, S.T.; Pritchard, M.E. Decadal volcanic deformation in the Central Andes Volcanic Zone revealed by InSAR time series. Geochem. Geophys. Geosyst. 2013, 14, 1358–1374. [Google Scholar] [CrossRef]
- Cheloni, D.; De Novellis, V.; Albano, M.; Antonioli, A.; Anzidei, M.; Atzori, S.; Avallone, A.; Bignami, C.; Bonano, M.; Calcaterra, S.; et al. Geodetic model of the 2016 Central Italy earthquake sequence inferred from InSAR and GPS data. Geophys. Res. Lett. 2017, 44, 6778–6787. [Google Scholar] [CrossRef]
- Klein, E.; Vigny, C.; Fleitout, L.; Grandin, R.; Jolivet, R.; Rivera, E.; Metois, M. A comprehensive analysis of the Illapel 2015 Mw8. 3 earthquake from GPS and InSAR data. Earth Planet. Sci. Lett. 2017, 469, 123–134. [Google Scholar] [CrossRef]
- Schlogel, R.; Doubre, C.; Malet, J.P.; Masson, F. Landslide deformation monitoring with ALOS/PALSAR imagery: A D-InSAR geomorphological interpretation method. Geomorphology 2015, 231, 314–330. [Google Scholar] [CrossRef]
- Calò, F.; Calcaterra, D.; Iodice, A.; Parise, M.; Ramondini, M. Assessing the activity of a large landslide in southern Italy by ground-monitoring and SAR interferometric techniques. Int. J. Remote Sens. 2012, 33, 3512–3530. [Google Scholar] [CrossRef]
- Ge, L.; Rizos, C.; Han, S.; Zebker, H. Mining subsidence monitoring using the combined InSAR and GPS approach. In Proceedings of the 10th International Symposium on Deformation Measurements, Orange, CA, USA, 19–22 March 2001; pp. 1–10. [Google Scholar]
- Samsonov, S.; d’Oreye, N.; Smets, B. Ground deformation associated with post-mining activity at the French–German border revealed by novel InSAR time series method. Int. J. Appl. Earth Obs. Geoinf. 2013, 23, 142–154. [Google Scholar] [CrossRef]
- Hooper, A.; Zebker, H.; Segall, P.; Kampes, B. A new method for measuring deformation on volcanoes and other natural terrains using InSAR persistent scatterers. Geophys. Res. Lett. 2004, 31, 1–5. [Google Scholar] [CrossRef]
- Ferretti, A.; Prati, C.; Rocca, F. Permanent scatterers in SAR interferometry. IEEE Trans. Geosci. Remote Sens. 2001, 39, 8–20. [Google Scholar] [CrossRef]
- Zhao, C.; Yang, C.; Zhang, Q.; Lu, Z.; Zhu, W. Mining collapse monitoring with SAR imagery data: A case study of Datong mine, China. J. Appl. Remote Sens. 2014, 8, 083574. [Google Scholar] [CrossRef]
- Chen, B.; Deng, K.; Fan, H.; Yu, Y. Combining SAR interferometric phase and intensity information for monitoring of large gradient deformation in coal mining area. Eur. J. Remote Sens. 2015, 48, 701–717. [Google Scholar] [CrossRef]
- Yang, Z.; Li, Z.; Zhu, J.; Yi, H.; Hu, J.; Feng, G. Deriving dynamic subsidence of coal mining areas using InSAR and logistic model. Remote Sens. 2017, 9, 125. [Google Scholar] [CrossRef]
- Yang, Z.; Zhu, J.; Li, Z.; Wang, C.; Wang, Y.; Chen, G. Dynamic subsidence analysis of mining area based on InSAR and level data. J. Cent. South Univ. Nat. Sci. 2015, 10, 3743–3751. (In Chinese) [Google Scholar]
- Litwiniszyn, J. The model of a random walk of particles adopted to researches on problem of mechanics of loose media. Bull. L’Academie Pol. Sci. 1963, 9, 61–70. [Google Scholar]
- Li, H.; Zhao, B.; Guo, G.; Zha, J.; Bi, J. The influence of an abandoned goaf on surface subsidence in an adjacent working coal face: A prediction method. Bull. Eng. Geol. Environ. 2018, 77, 305–315. [Google Scholar] [CrossRef]
- Diao, X.; Wu, K.; Zhou, D.; Li, L. Integrating the probability integral method for subsidence prediction and differential synthetic aperture radar interferometry for monitoring mining subsidence in Fengfeng, China. J. Appl. Remote Sens. 2016, 10, 016028. [Google Scholar] [CrossRef]
- Fan, H.; Lu, L.; Yao, Y. Method Combining Probability Integration Model and a Small Baseline Subset for Time Series Monitoring of Mining Subsidence. Remote Sens. 2018, 10, 1444. [Google Scholar] [CrossRef]
- Goel, K.; Adam, N. A distributed scatterer interferometry approach for precision monitoring of known surface deformation phenomena. IEEE Trans. Geosci. Remote Sens. 2013, 52, 5454–5468. [Google Scholar] [CrossRef]
- Zheng, M.; Deng, K.; Du, S.; Liu, J.; Liu, J.; Feng, J. Joint Probability Integral Method and TCPInSAR for Monitoring Mining Time-Series Deformation. J. Indian Soc. Remote Sens. 2019, 47, 63–75. [Google Scholar] [CrossRef]
- Mora, O.; Mallorqui, J.J.; Broquetas, A. Linear and nonlinear terrain deformation maps from a reduced set of interferometric SAR images. IEEE Trans. Geosci. Remote Sens. 2003, 41, 2243–2253. [Google Scholar] [CrossRef]
- Blanco-Sanchez, P.; Mallorquí, J.J.; Duque, S.; Monells, D. The coherent pixels technique (CPT): An advanced DInSAR technique for nonlinear deformation monitoring. Earth Sci. Math. 2008, 165, 1167–1193. [Google Scholar]
- Zhao, F.; Mallorqui, J.J. A temporal phase coherence estimation algorithm and its application on DInSAR pixel selection. IEEE Trans. Geosci. Remote Sens. 2019, 57, 8350–8361. [Google Scholar] [CrossRef]
- Berardino, P.; Fornaro, G.; Lanari, R.; Sansosti, E. A new algorithm for surface deformation monitoring based on small baseline differential SAR interferograms. IEEE Trans. Geosci. Remote. Sens. 2002, 40, 2375–2383. [Google Scholar] [CrossRef]
- Lanari, R.; Mora, O.; Manunta, M.; Mallorqui, J.J.; Berardino, P.; Sansosti, E. A small-baseline approach for investigating deformations on full-resolution differential SAR interferograms. IEEE Trans. Geosci. Remote Sens. 2004, 42, 1377–1386. [Google Scholar] [CrossRef]
- Gonzalez, R.I.; Franquet, J.J.M.; Canovas, X.F. High-Resolution Space-Borne and Ground-Based SAR Persistent Scatterer Interferometry for Landslide Monitoring. Ph.D. Thesis, Universitat Politècnica de Catalunya (UPC), Barcelona, Spain, 2015. [Google Scholar]
- Massonnet, D.; Feigl, K.L. Radar interferometry and its application to changes in the Earth’s surface. Rev. Geophys. 1998, 36, 441–500. [Google Scholar] [CrossRef]
- National Coal Industry Bureau. Rules for Coal Pillar Retention and Coal Mining in Buildings, Water Bodies, Railways and Main Shafts; Coal Industry Press: Beijing, China, 2000. [Google Scholar]
© 2020 by the authors. Licensee MDPI, Basel, Switzerland. This article is an open access article distributed under the terms and conditions of the Creative Commons Attribution (CC BY) license (http://creativecommons.org/licenses/by/4.0/).