Article

Terrestrial Water Storage Change Retrieved by GRACE and Its Implication in the Tibetan Plateau: Estimating Areal Precipitation in Ungauged Region

1
Department of Hydraulic Engineering, Tsinghua University, Beijing 100084, China
2
State Key Laboratory of Hydro-Science and Engineering, Tsinghua University, Beijing 100084, China
3
State Key Laboratory of Hydro-Water Resources and Hydraulic Engineering, Nanjing Hydraulic Research Institute, Nanjing 210029, China
*
Author to whom correspondence should be addressed.
Remote Sens. 2020, 12(19), 3129; https://doi.org/10.3390/rs12193129
Submission received: 21 August 2020 / Revised: 7 September 2020 / Accepted: 22 September 2020 / Published: 24 September 2020
(This article belongs to the Section Remote Sensing in Geology, Geomorphology and Hydrology)

Abstract

:
The Tibetan Plateau (TP) is referred to as the water tower of Asia, where water storage and precipitation have huge impacts on most major Asian rivers. Based on gravity recovery and climate experiment data, this study analyzed the terrestrial water storage (TWS) changes and estimated areal precipitation based on the water balance equation in four different basins, namely, the upper Yellow River (UYE), the upper Yangtze River (UYA), the Yarlung Zangbo River (YZ), and the Qiangtang Plateau (QT). The results show that the TWS change exhibits different patterns in the four basins and varies from −13 to 2 mm/year from 2003 to 2017. The estimated mean annual precipitation was 260 ± 19 mm/year (QT), 697 ± 26 mm/year (UYA), 541 ± 36 mm/year (UYE), and 1160 ± 39 mm/year (YZ) which performed better than other precipitation products in the TP. It indicates a potential method for estimating basin-scale precipitation through integrating basin average precipitation from the water balance equation in the poorly gauged and ungauged regions.

1. Introduction

The Tibetan Plateau (TP) is the highest plateau on Earth and contains the headwaters of several major Asian rivers, including the Yangtze River, the Yellow River, and the Yarlung Zangbo River. As a result, the TP is regarded as the water tower of Asia and plays a significant role in the Asian hydrological cycle [1,2,3]. In the TP, terrestrial water storage (TWS), including groundwater, soil moisture, glaciers, and snow, is an important component of the hydrological cycle [4,5]. Therefore, it is valuable to reveal the spatial and temporal change in TWS in the TP, to understand the hydrological response to global warming and predict the future change in water resources [6,7,8].
Precipitation is an important component in hydrological and climate change studies. Generally, areal precipitation can be estimated from four primary sources, namely, gauge observations, weather radar, remote-sensing satellites, and atmospheric reanalysis, among which gauge observations provide a basis for ground-truth and bias-correcting for the other datasets. In some mountainous regions, especially in the TP, there are sparse gauge stations and high spatial variability of precipitation due to complex terrain conditions, which causes difficulty in accurately estimating precipitation using radar and satellites in this region [9,10]. Based on the daily data from approximately 2400 national meteorological stations, Shen and Xiong [11] produced the China Gauge-based Daily Precipitation Analysis (CGDPA) dataset, which is a widely used precipitation dataset for mainland China. For example, Qin et al. [12] used CGDPA to study the eco-hydrological processes in the Yellow River source region. Shen et al. [13] used CGDPA to analyze the attribution of runoff changes in 224 catchments in China. It is noteworthy that there were no more than 80 meteorological stations in the TP, as of the year 2012 [14]. The low number of stations and the complex terrain conditions decrease the reliability of CGDPA in the TP [15].
In the past, the TWS is very hard to estimate, due to the difficulties in measuring the whole components of the TWS and the sparse gauge station network, especially in mountainous regions like TP [16,17]. Fortunately, with the launch of Gravity Recovery and Climate Experiment (GRACE) satellites, there is an alternative method to estimate the change in TWS. In recent years, GRACE data has been widely used in detecting the water storage changes at large scales [18,19,20,21,22,23]. Hassan and Jin [24] found that the TWS increased in the river basins of major African rivers, such as the Nile and Zambezi, with a trend of 1.10 and 11.60 mm/year, respectively. Recently, GRACE data was also used to analyze the changes in TWS in the TP. Muskett [25] analyzed the water equivalent mass and found the Himalaya region lost 17.9 ± 11.0 km3/year from 2002 to 2006. Sato et al. [26] used GRACE to calculate TWS at the source of the Yellow River and concluded that the water storage in this region had increased by 0.51 mm/month, due in part to permafrost degradation. Additionally, Jiao et al. [27] revealed a significant increasing trend in TWS from 2003 to 2012. Remarkably, those studies examined the plateau as a single entity and ignored regional variation. However, the TP covers a vast area and consists of different types of basins, including endorheic areas and outflow areas, which have different responses to climate change. Furthermore, GRACE data has been widely used to monitor different hydrological components of TWS, such as soil moisture [28], groundwater [29,30,31], and snow [32].
On a basin scale, based on the water balance, we could estimate several components of TWS, such as runoff [33] and evapotranspiration [34,35], when the other parts could be isolated with some data products or observations. Considering that the existing precipitation products of the TP performed poorly and the estimated precipitations have much larger uncertainties than the estimated evapotranspirations have [9], based on the water balance equation using GRACE data and some ET datasets, an alternative method for estimating areal precipitation in the TP can be suggested as:
P = ET + R + ΔTWS
where P, ET, R, and ΔTWS represent precipitation, evapotranspiration, runoff, and TWS change, respectively. Using this method, Behrangi et al. [36] estimated precipitation and evaluated several popular satellite precipitation products for two basins in China under the simple condition of P = E + ΔTWS, where there is no outflow.
Therefore, the objective of this study is to analyze the spatial variation in TWS change in the main basins of the TP, namely, the upper Yellow River basin (UYE), the upper Yangtze River basin (UYA), the Yarlung Zangbo River basin (YZ), and the Qiangtang Plateau basin (QT), in order to understand the inter-basin differences in hydrological responses to climate change based on GRACE data. More importantly, this study will estimate precipitation using the water balance method according to TWS change and compare it with CGDPA to understand the uncertainty of estimated precipitation estimating in the TP. Furthermore, it provides an alternate method to evaluate satellite precipitation products and correct their bias.

2. Data and Methods

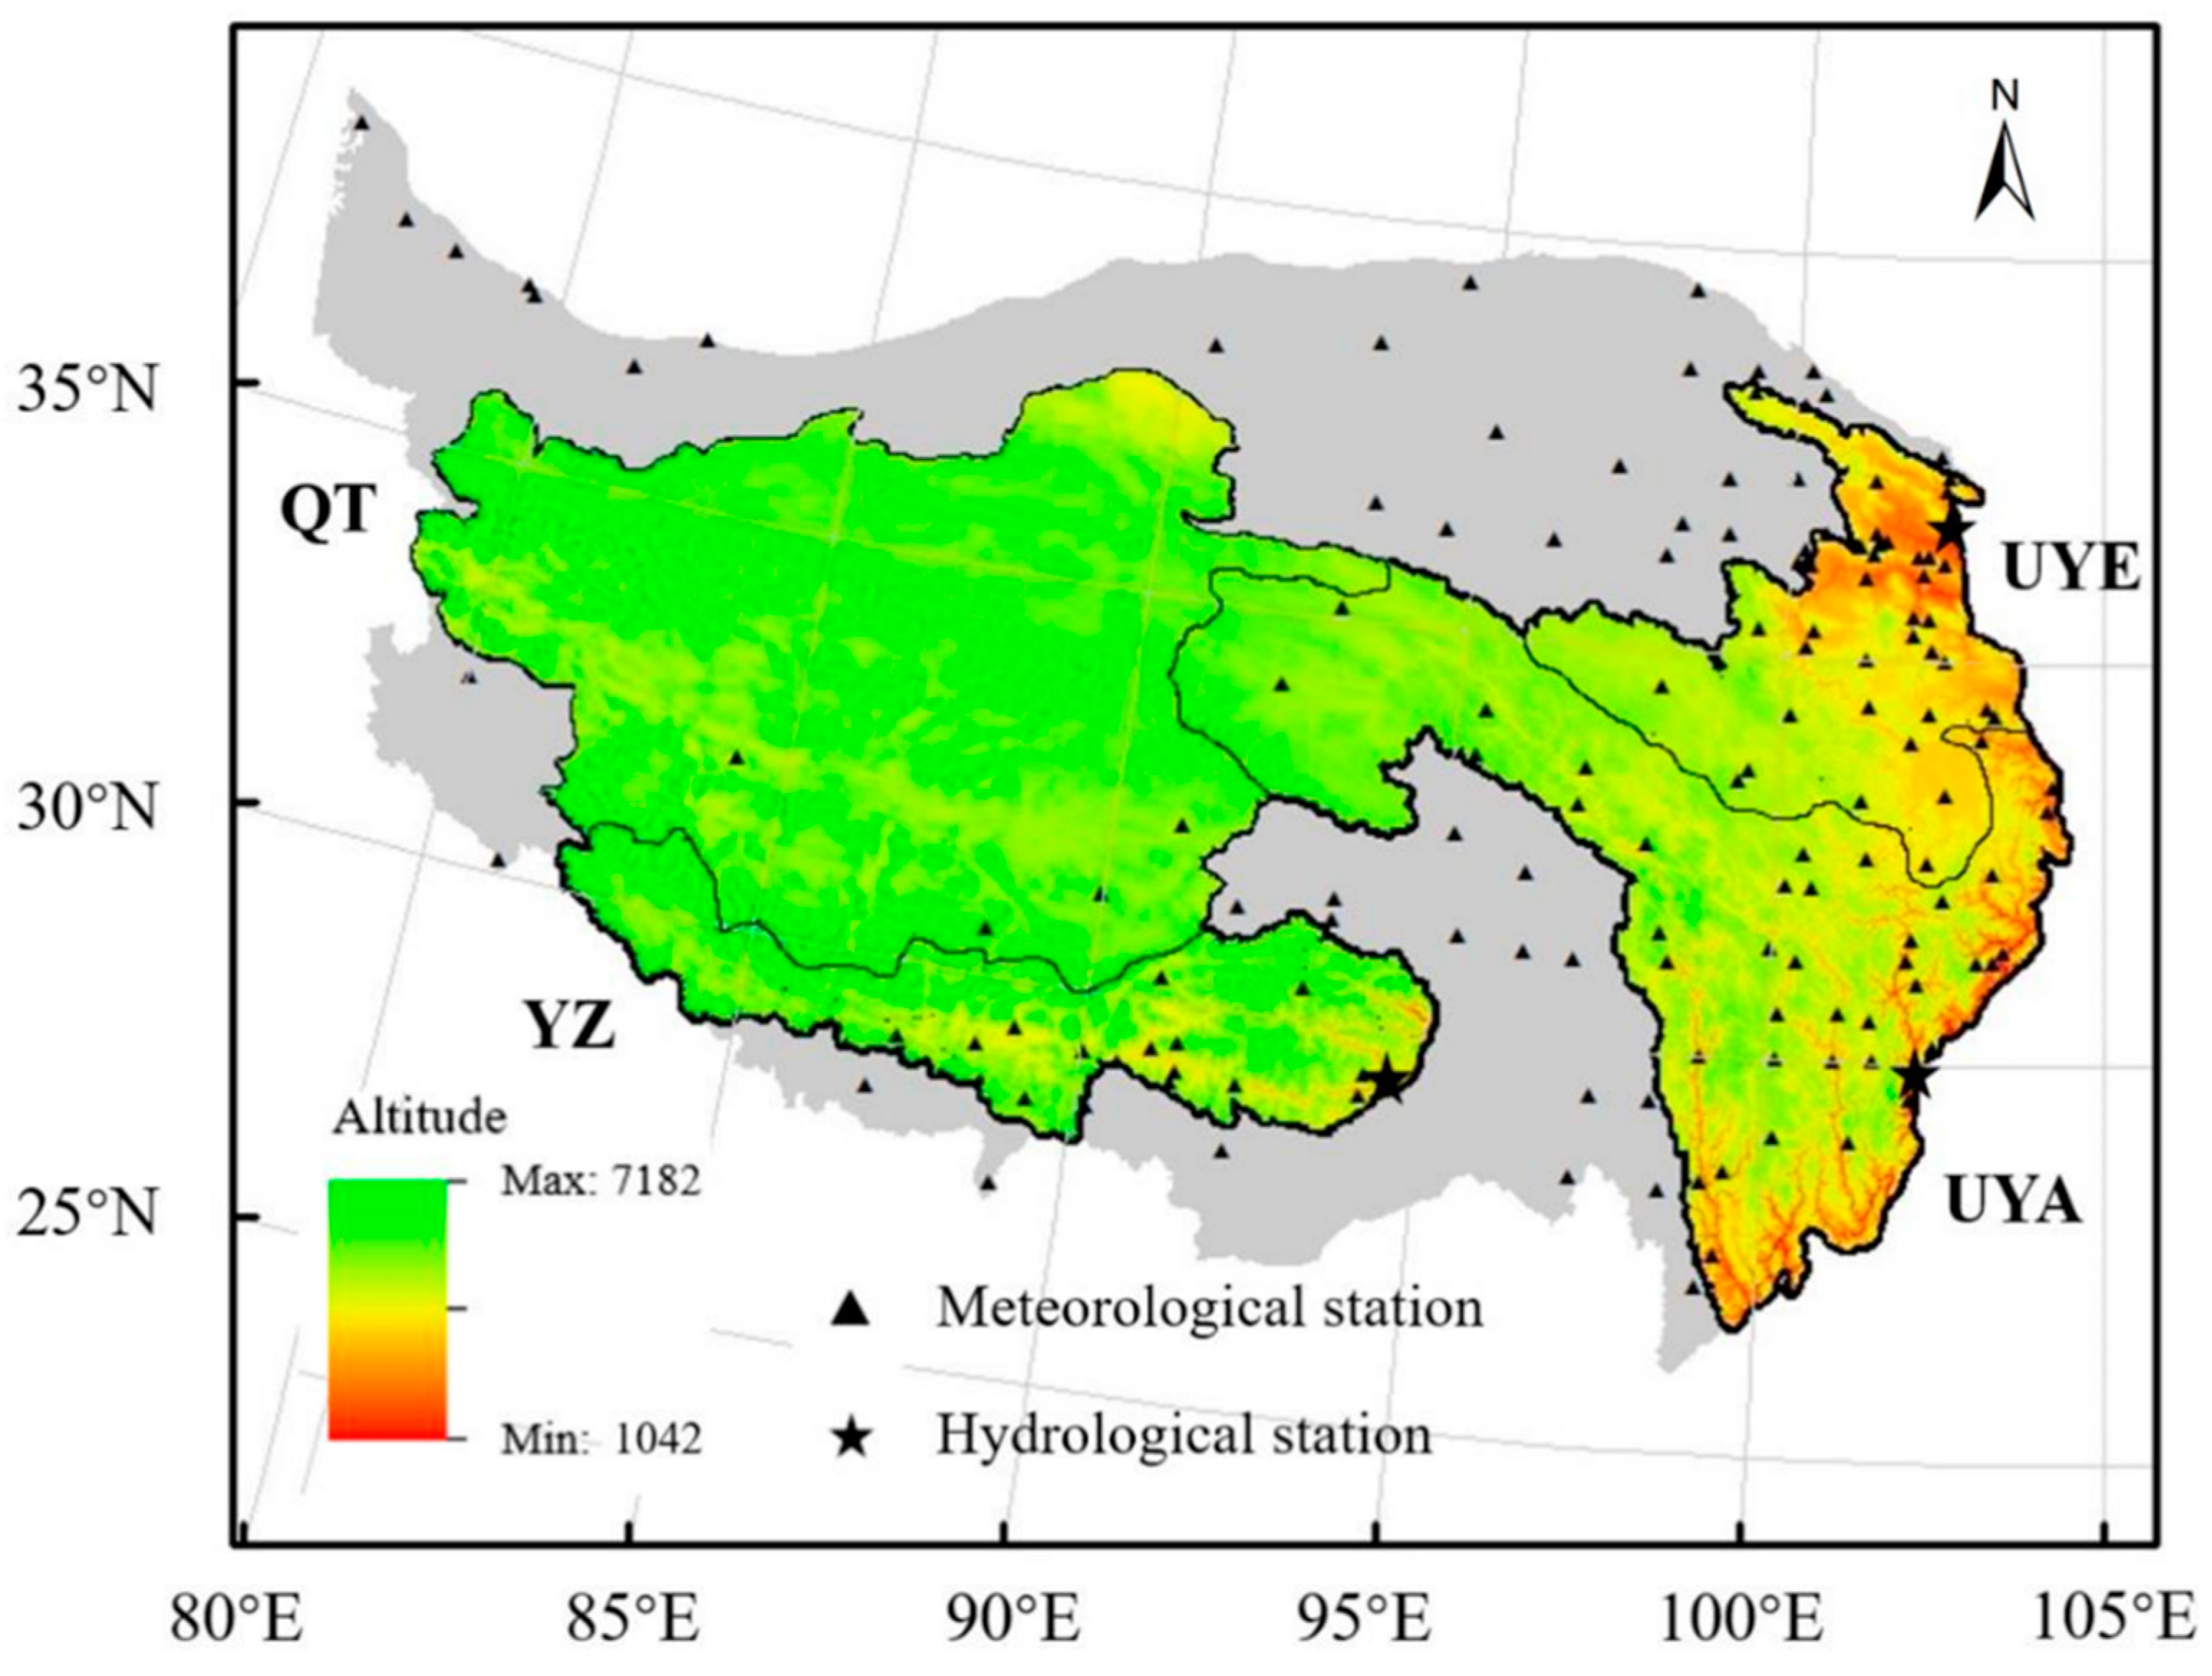
2.1. Study Area and Data

In this study, we choose four representative hydrological basins, namely the Qiangtang Plateau basin (QT), the Upper Yellow River basin (UYE), the Upper Yangtze River basin (UYA), and the Yarlung Zangbo River basin (YZ). Among the four basins, the QT is the biggest endorheic basin in the TP, located in the western TP. The UYE and the UYA, located in the eastern TP, are outflow basins with many cryolithozone areas, while the YZ, in the southern TP, is an outflow basin with many canyon areas. The locations of the four basins, together with the meteorological stations and hydrological stations, are exhibited in Figure 1.
Monthly TWS was estimated according to the GRACE Release-06 dataset (RL-06) observations, which were processed by the Center for Space Research at the University of Texas (CSR), Jet Propulsion Laboratory (JPL), and Geoforschungs Zentrum Potsdam (GFZ), respectively [16,37]. These datasets differ in signal processing parameters like degree and order, spherical harmonic coefficient, and smoothing factor. All the three GRACE datasets incorporate corresponding modifying factors assimilated into GLDAS to improve the accuracy of TWS estimates, considering the influence of topographic conditions. The TWS is recorded in terms of equivalent water height (mm), with a spatial accuracy of 1° × 1° (resampled) [38]. In this study, we used GRACE data for 163 consecutive months (from January 2003 to June 2017), with the exception of June 2003, August 2006, January 2011, June 2011, May 2012, October 2012, March 2013, August 2013, September 2013, February 2014, July 2014, September 2016, and October 2016. The data for the missing months were processed by linear interpolation with data from the adjoining months. For each basin, TWS was derived by the weighted average method according to the basin area proportion in each grid and the modifying factor provided by each center as weight. Additionally, we divide time series into three parts (P1 for 2003 to 2006, P2 for 2007 to 2010, and P3 for 2011 to end) and analyze the periodical TWS change to explore the differences among the four basins.
The monthly evapotranspiration (ET) data were obtained from three products, namely GLEAM (Global Land surface Evaporation: the Amsterdam Methodology, with a 0.25° spatial resolution), ERA (the ERA-Interim archive, #182 evapotranspiration, with a 1.0° spatial resolution), and NOAH (Global Land Data Assimilation System/NOAH model, evapotranspiration, with a 1.0° spatial resolution) [39,40,41]. Among these three products, ERA and NOAH were reanalysis products based on the land surface model, while GLEAM was a product derived from the Priestley and Taylor evaporation model with satellite observations. Monthly runoff was observed at the outlets of the three outflow basins, namely the Nuxia, Zhutuo, and Tangnaihai hydrological stations (see Figure 1). As the QT is an endorheic area, its runoff was regarded as zero.

2.2. Precipitation Estimation Based on Water Balance

We estimated annual precipitation at the catchment scale using the water balance equation (WBE, Equation (1)). To estimate precipitation (P) based on water balance (Equation (1)), ET, ΔTWS, and R are required. We used five evaluation metrics to compare the results with the precipitation from CGDPA, namely, correlation coefficient (r), relative bias (Rbias), root-mean-square error (RMSE), Nash–Sutcliffe efficiency coefficient (NSE), and Kling–Gupta efficiency (KGE, a comprehensive indicator including correlation, means and dispersion of two paired datasets) [42]. For r, NSE, and KGE, the value of 1 donates the perfect fit while for Rbias and RMSE, the value of 0 donates the perfect fit. All the formulas are shown below. In addition, the information of the 2416 stations, such as latitude, longitude, and elevation, was also collected.
r = i = 1 n ( x i x ¯ ) ( y i y ¯ ) i = 1 n ( x i x ¯ ) 2 i = 1 n ( y i y ¯ ) 2
R b i a s = i = 1 n x i i = 1 n y i i = 1 n y i × 100 %
RMSE = i = 1 n ( x i y i ) 2 n
NSE = 1 i = 1 n ( x i y i ) 2 i = 1 n ( y i y ¯ ) 2
KGE = 1 ( r 1 ) 2 + ( β 1 ) 2 + ( γ 1 ) 2
In Formulas (2)–(6), x i denotes precipitation estimated from WBE; y i denotes precipitation estimated from CGDPA; x ¯ and y ¯ denote the mean; n is the number of time series; r denotes the correlation coefficient; β denotes the ratio of y ¯ to x ¯ ; γ denotes the ratio of the standard deviation of x i to the standard deviation of y i .
Besides, we used RMSE to quantify the uncertainties in the main components of basin water balance. The uncertainties of ΔTWS and ET in the four basins were estimated from different products using the ETC (extend triple collocation) method (more details were given in Appendix A) [43,44,45]. Both for ΔTWS and ET, the one with the least uncertainty was chosen for estimating P. Runoff was obtained from hydrological stations and its uncertainty mainly came from observational errors, which was estimated at 5% of the runoff [46]. According to Equation (1), we calculated the uncertainties of precipitations as follows:
U P = U E T 2 + U R 2 + U Δ T W S 2
where UET represents the uncertainty of ET, estimated by the ETC method (described in Appendix A); UR represents the uncertainty of runoff, regarded as 5% of R; UTWS represents the uncertainty of ΔTWS, estimated by the ETC method.

3. Results

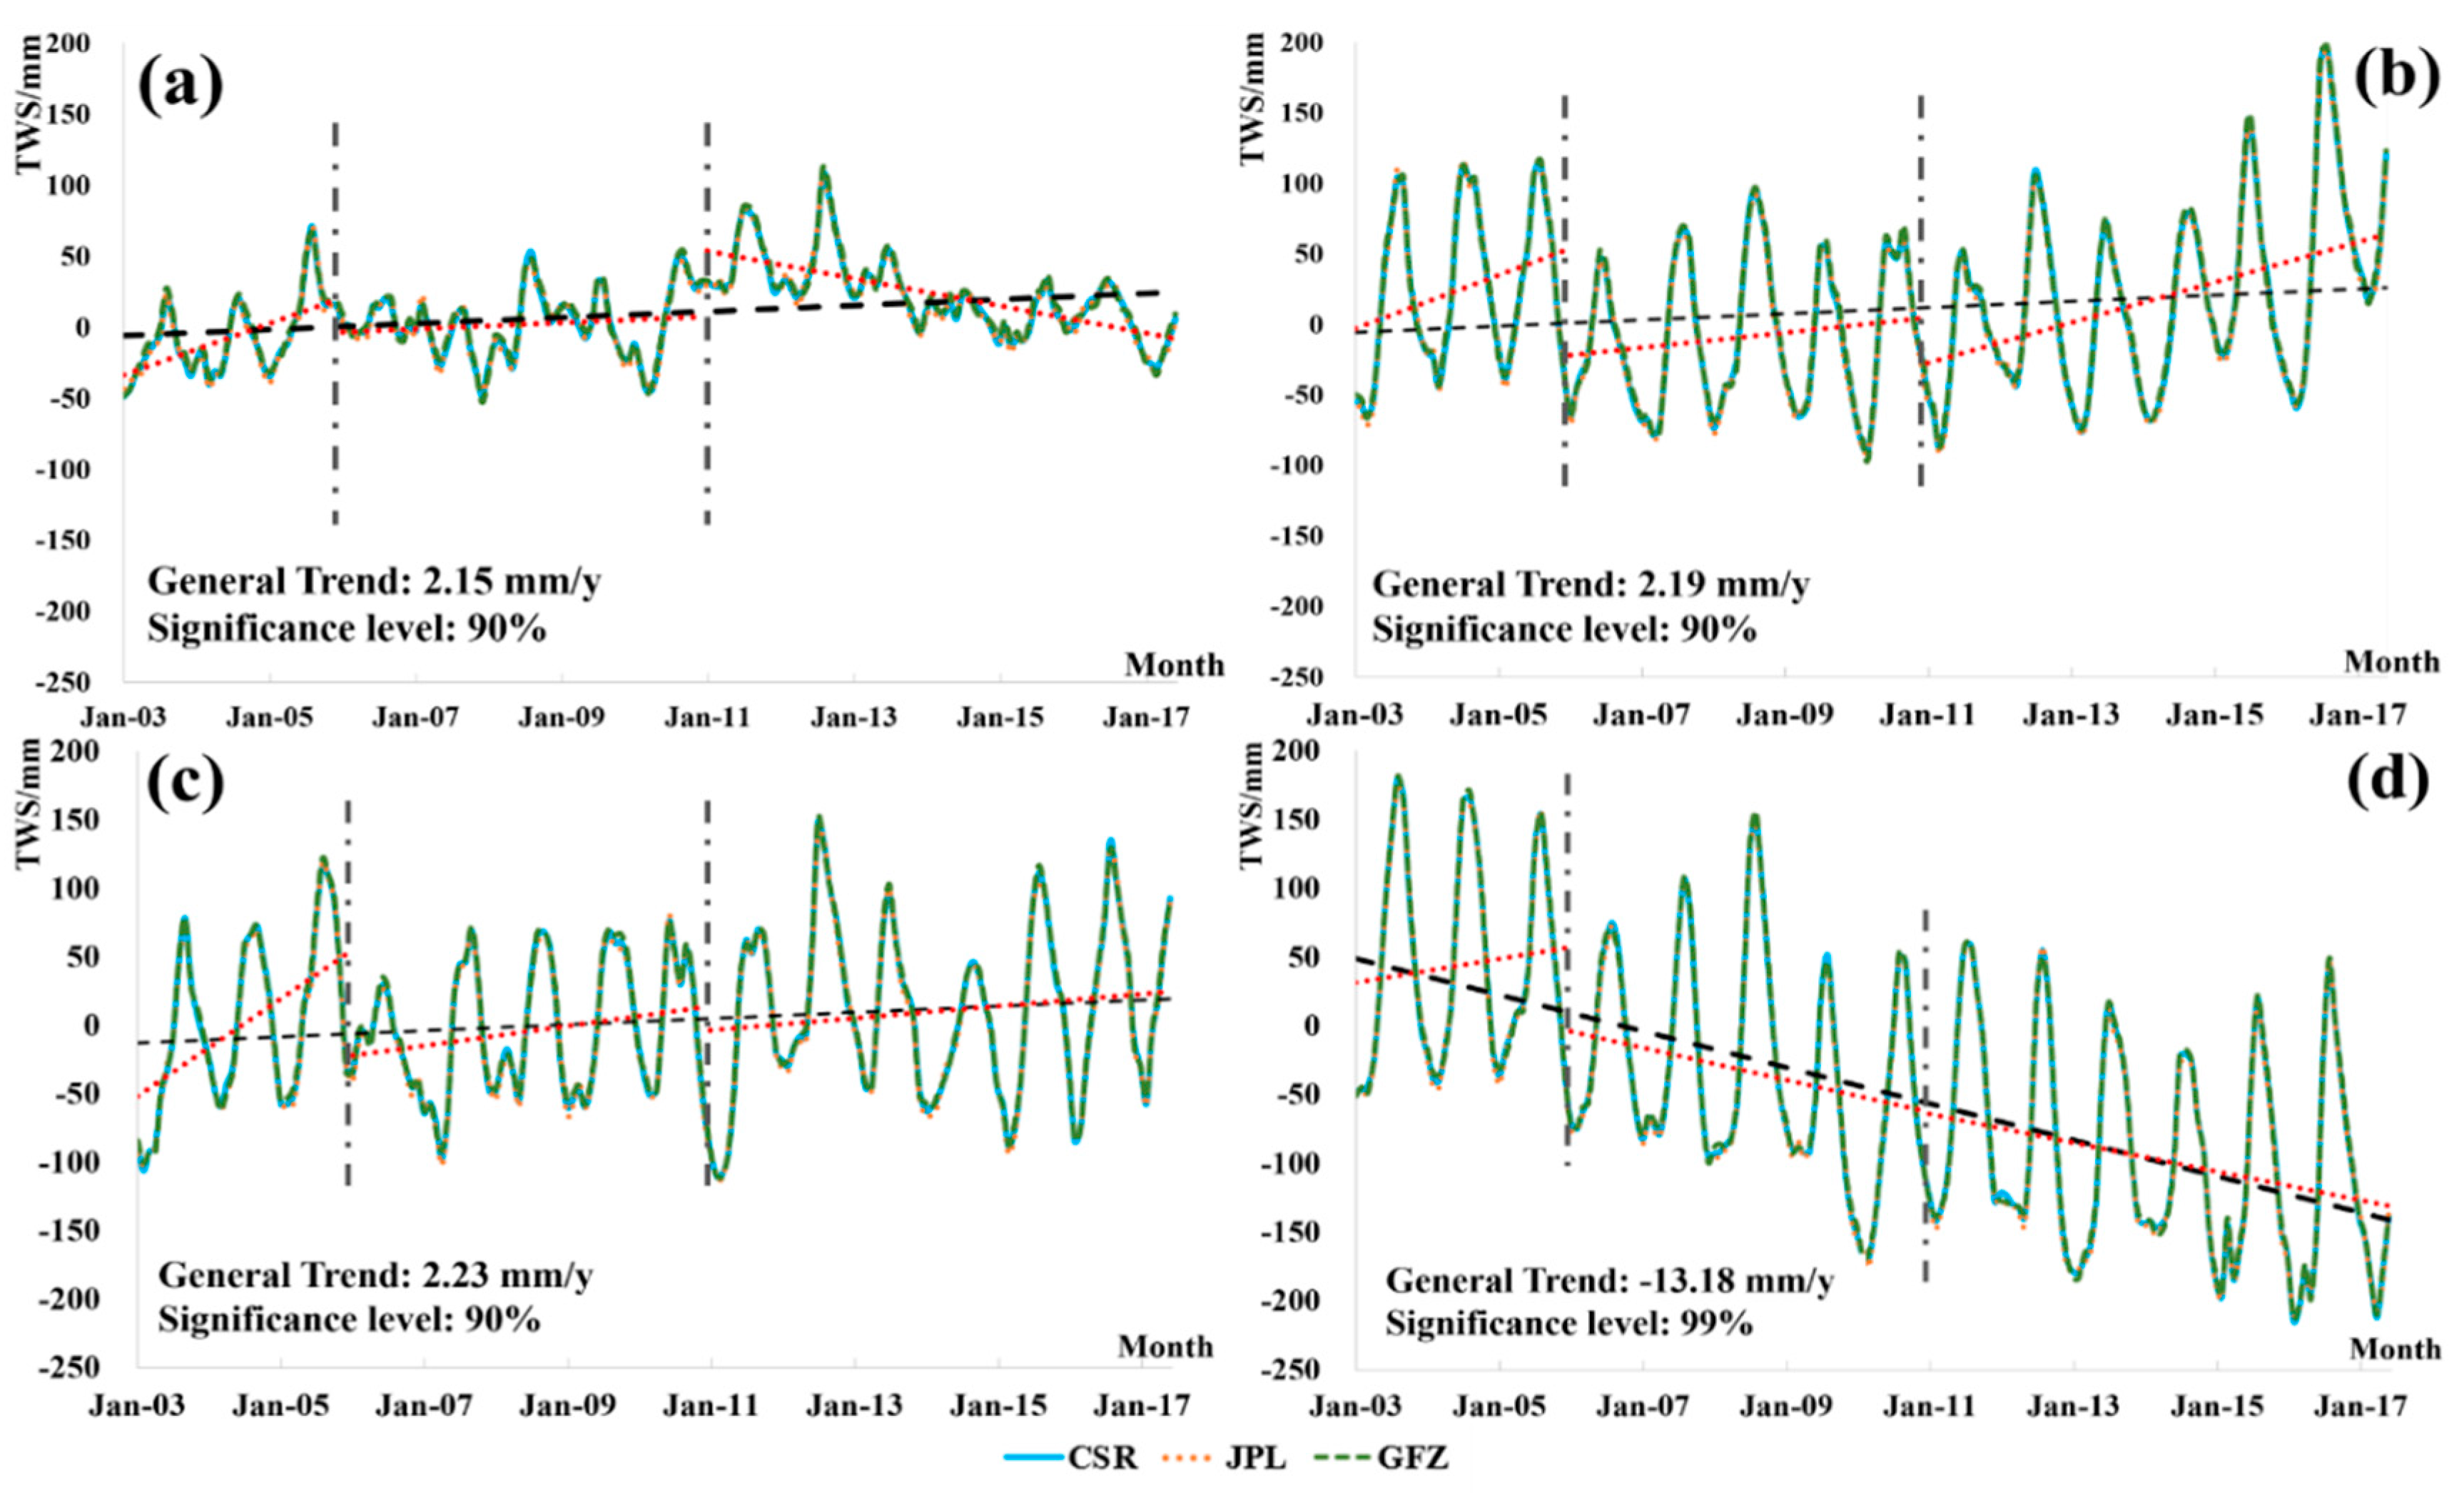
3.1. Terrestrial Water Storage Variations

Figure 2 shows the monthly TWS series in the four basins. Generally, TWS exhibits a clear decrease (at a significance level of 99%) in the YZ while a slight increase (at a significance level of 90%) in the other three basins. The average TWS change was −13.18 mm/year for the YZ, 2.19 mm/year for the UYA, 2.15 mm/year for the QT, and 2.23 mm/year for the UYE, which is consistent with relative research [47,48]. Besides, seasonal variation in TWS in the outflow basins is significantly greater than that in the endorheic basin. The YZ has the largest amplitude in annual TWS change, while the QT has the smallest.
Additionally, TWS change showed significant phased characters. Before 2006, the TWS increasesd obviously and drops suddenly in 2006 in the four basins. From 2006 to 2010, the TWS seems to be stable in the QT, while it increased slightly in the UYA and the UYE, and decreased slightly in the YZ. After, the TWS in the QT showed a sharp rise and increased continuously. In the UYA and UYE, the TWS showed a slight increase after 2010. Oppositely, the TWS maintained a decreasing trend in the YZ after 2006.
The maxima of TWS shows synchronization among the four basins, i.e., the peak values appeared in August or September, while the minimum values occurred in February or March, similar to the precipitation changes. Hence, the TWS in summer and autumn is much higher than that in spring and winter because the rainfall in summer and autumn accounts for most of the annual total. The TWS change in the YZ exhibits a continuous downward trend, while that in the other three basins show more variability.

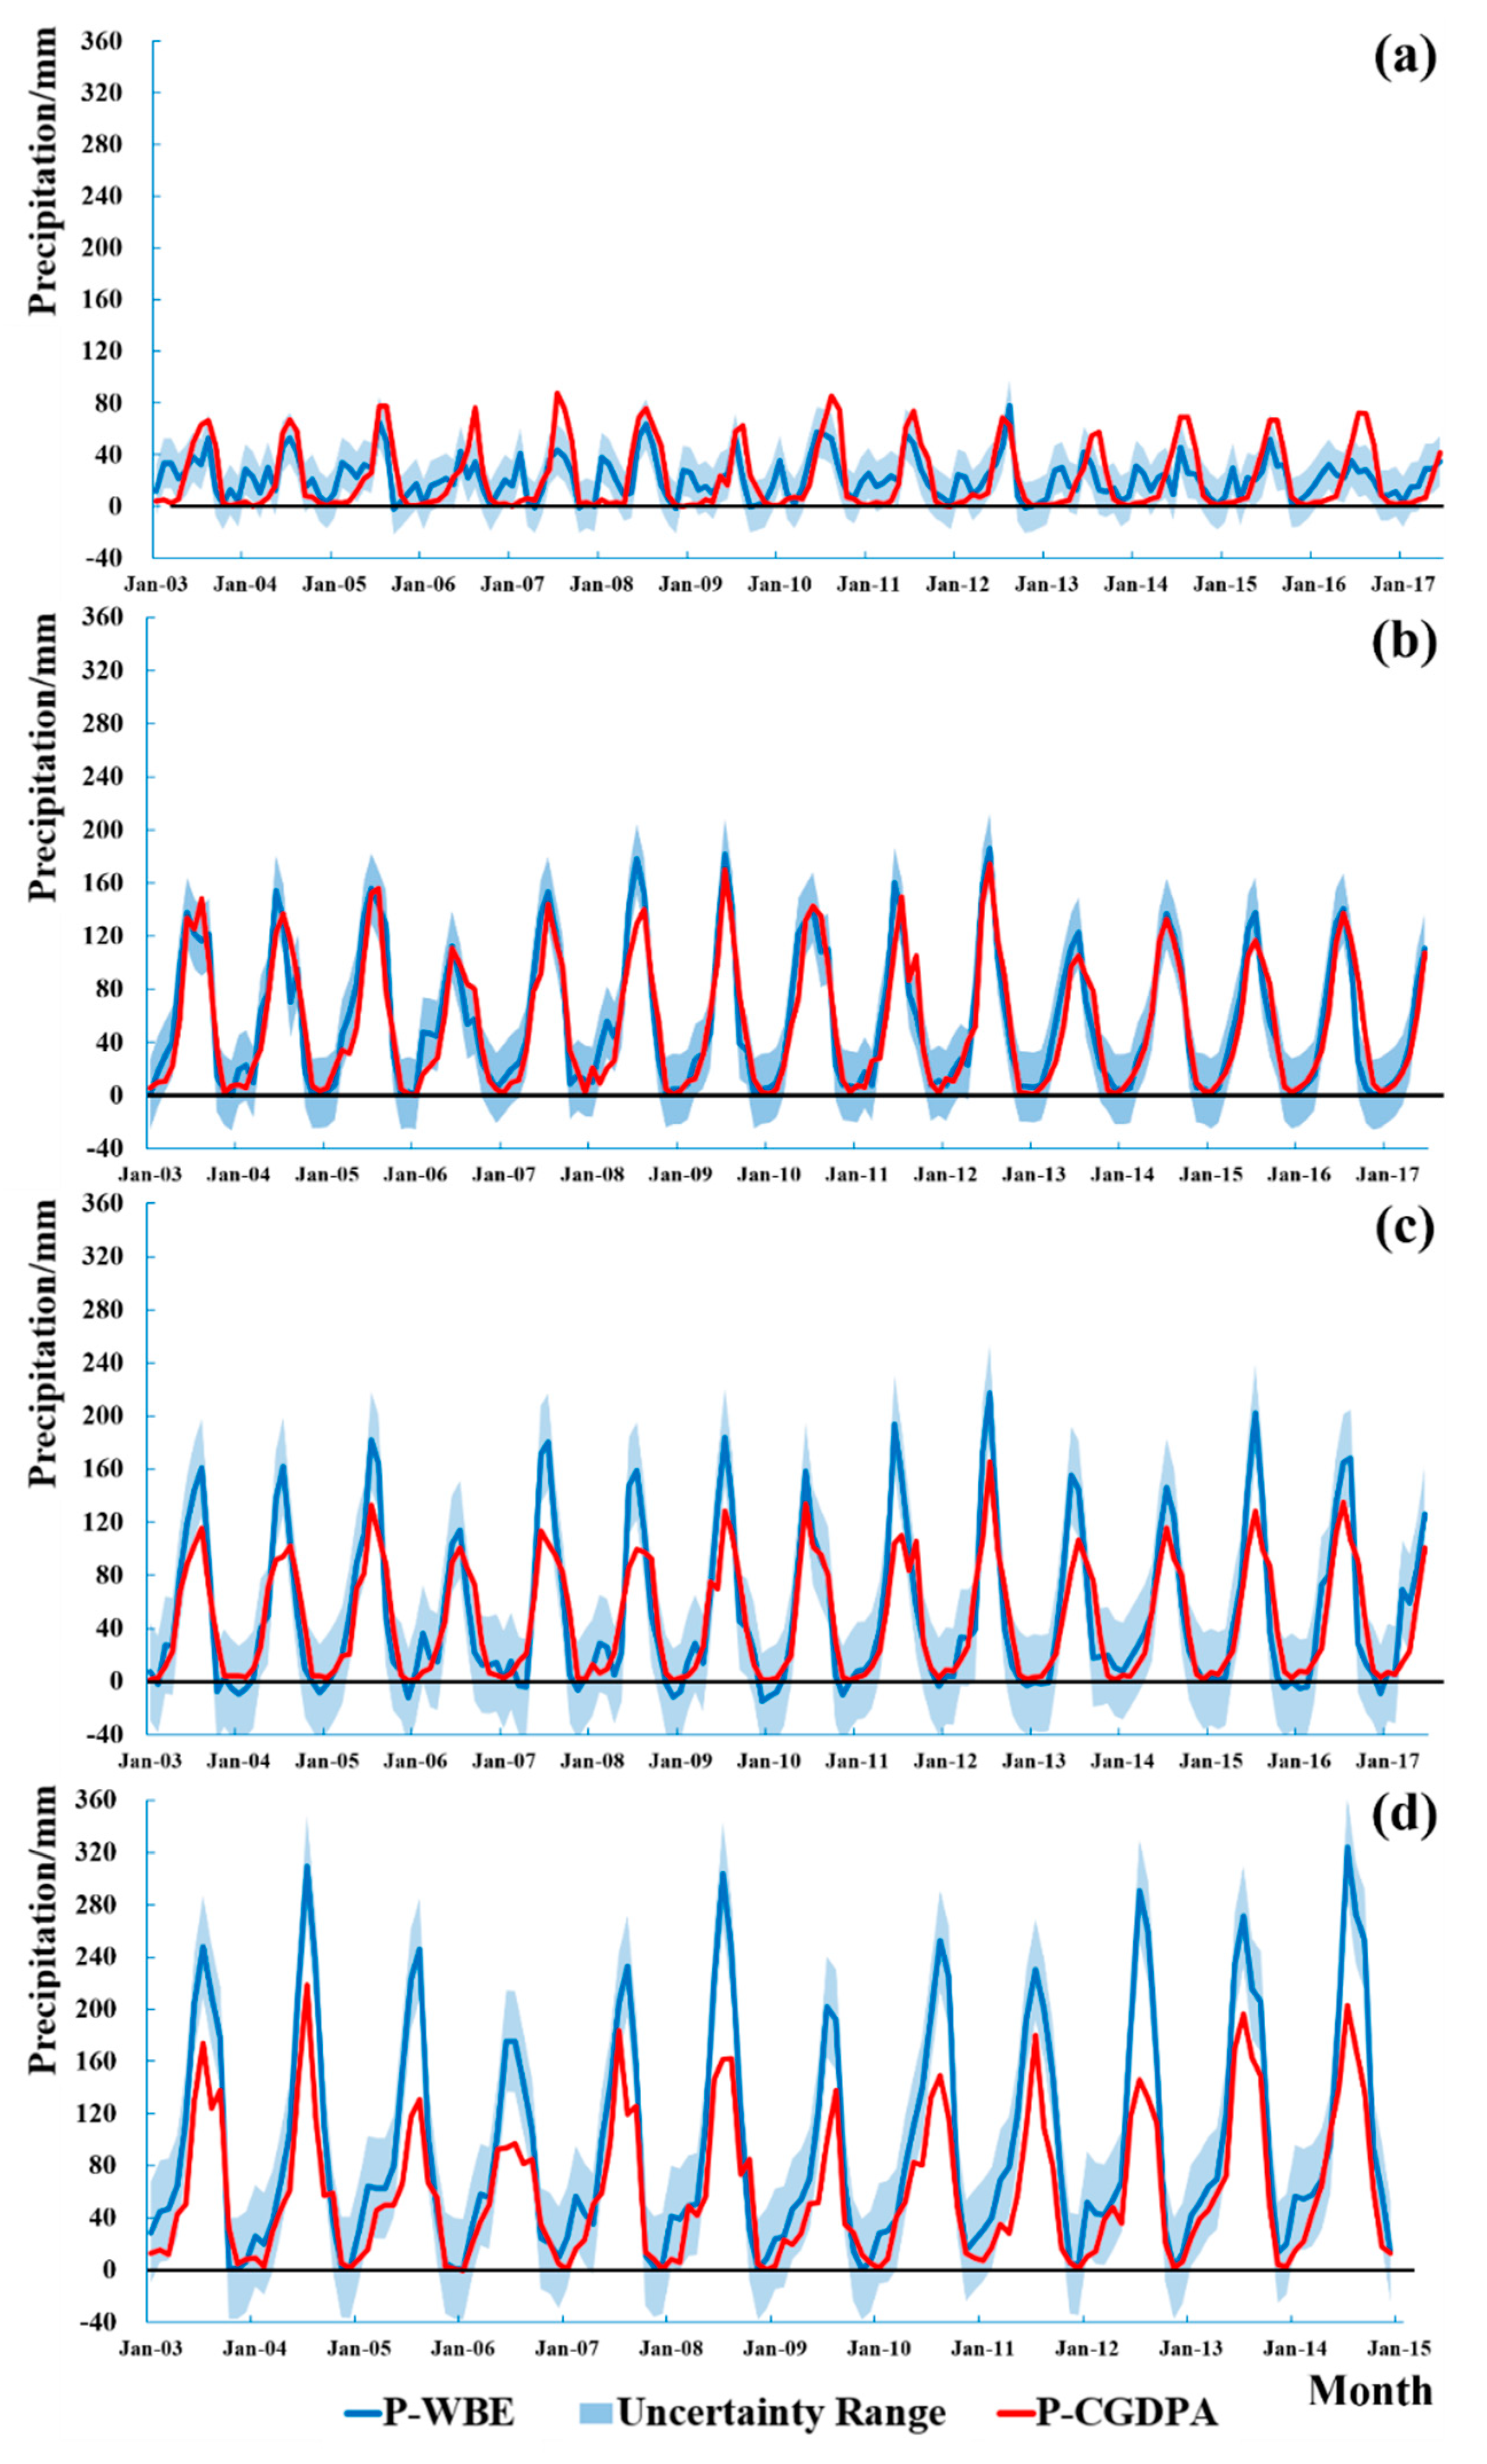
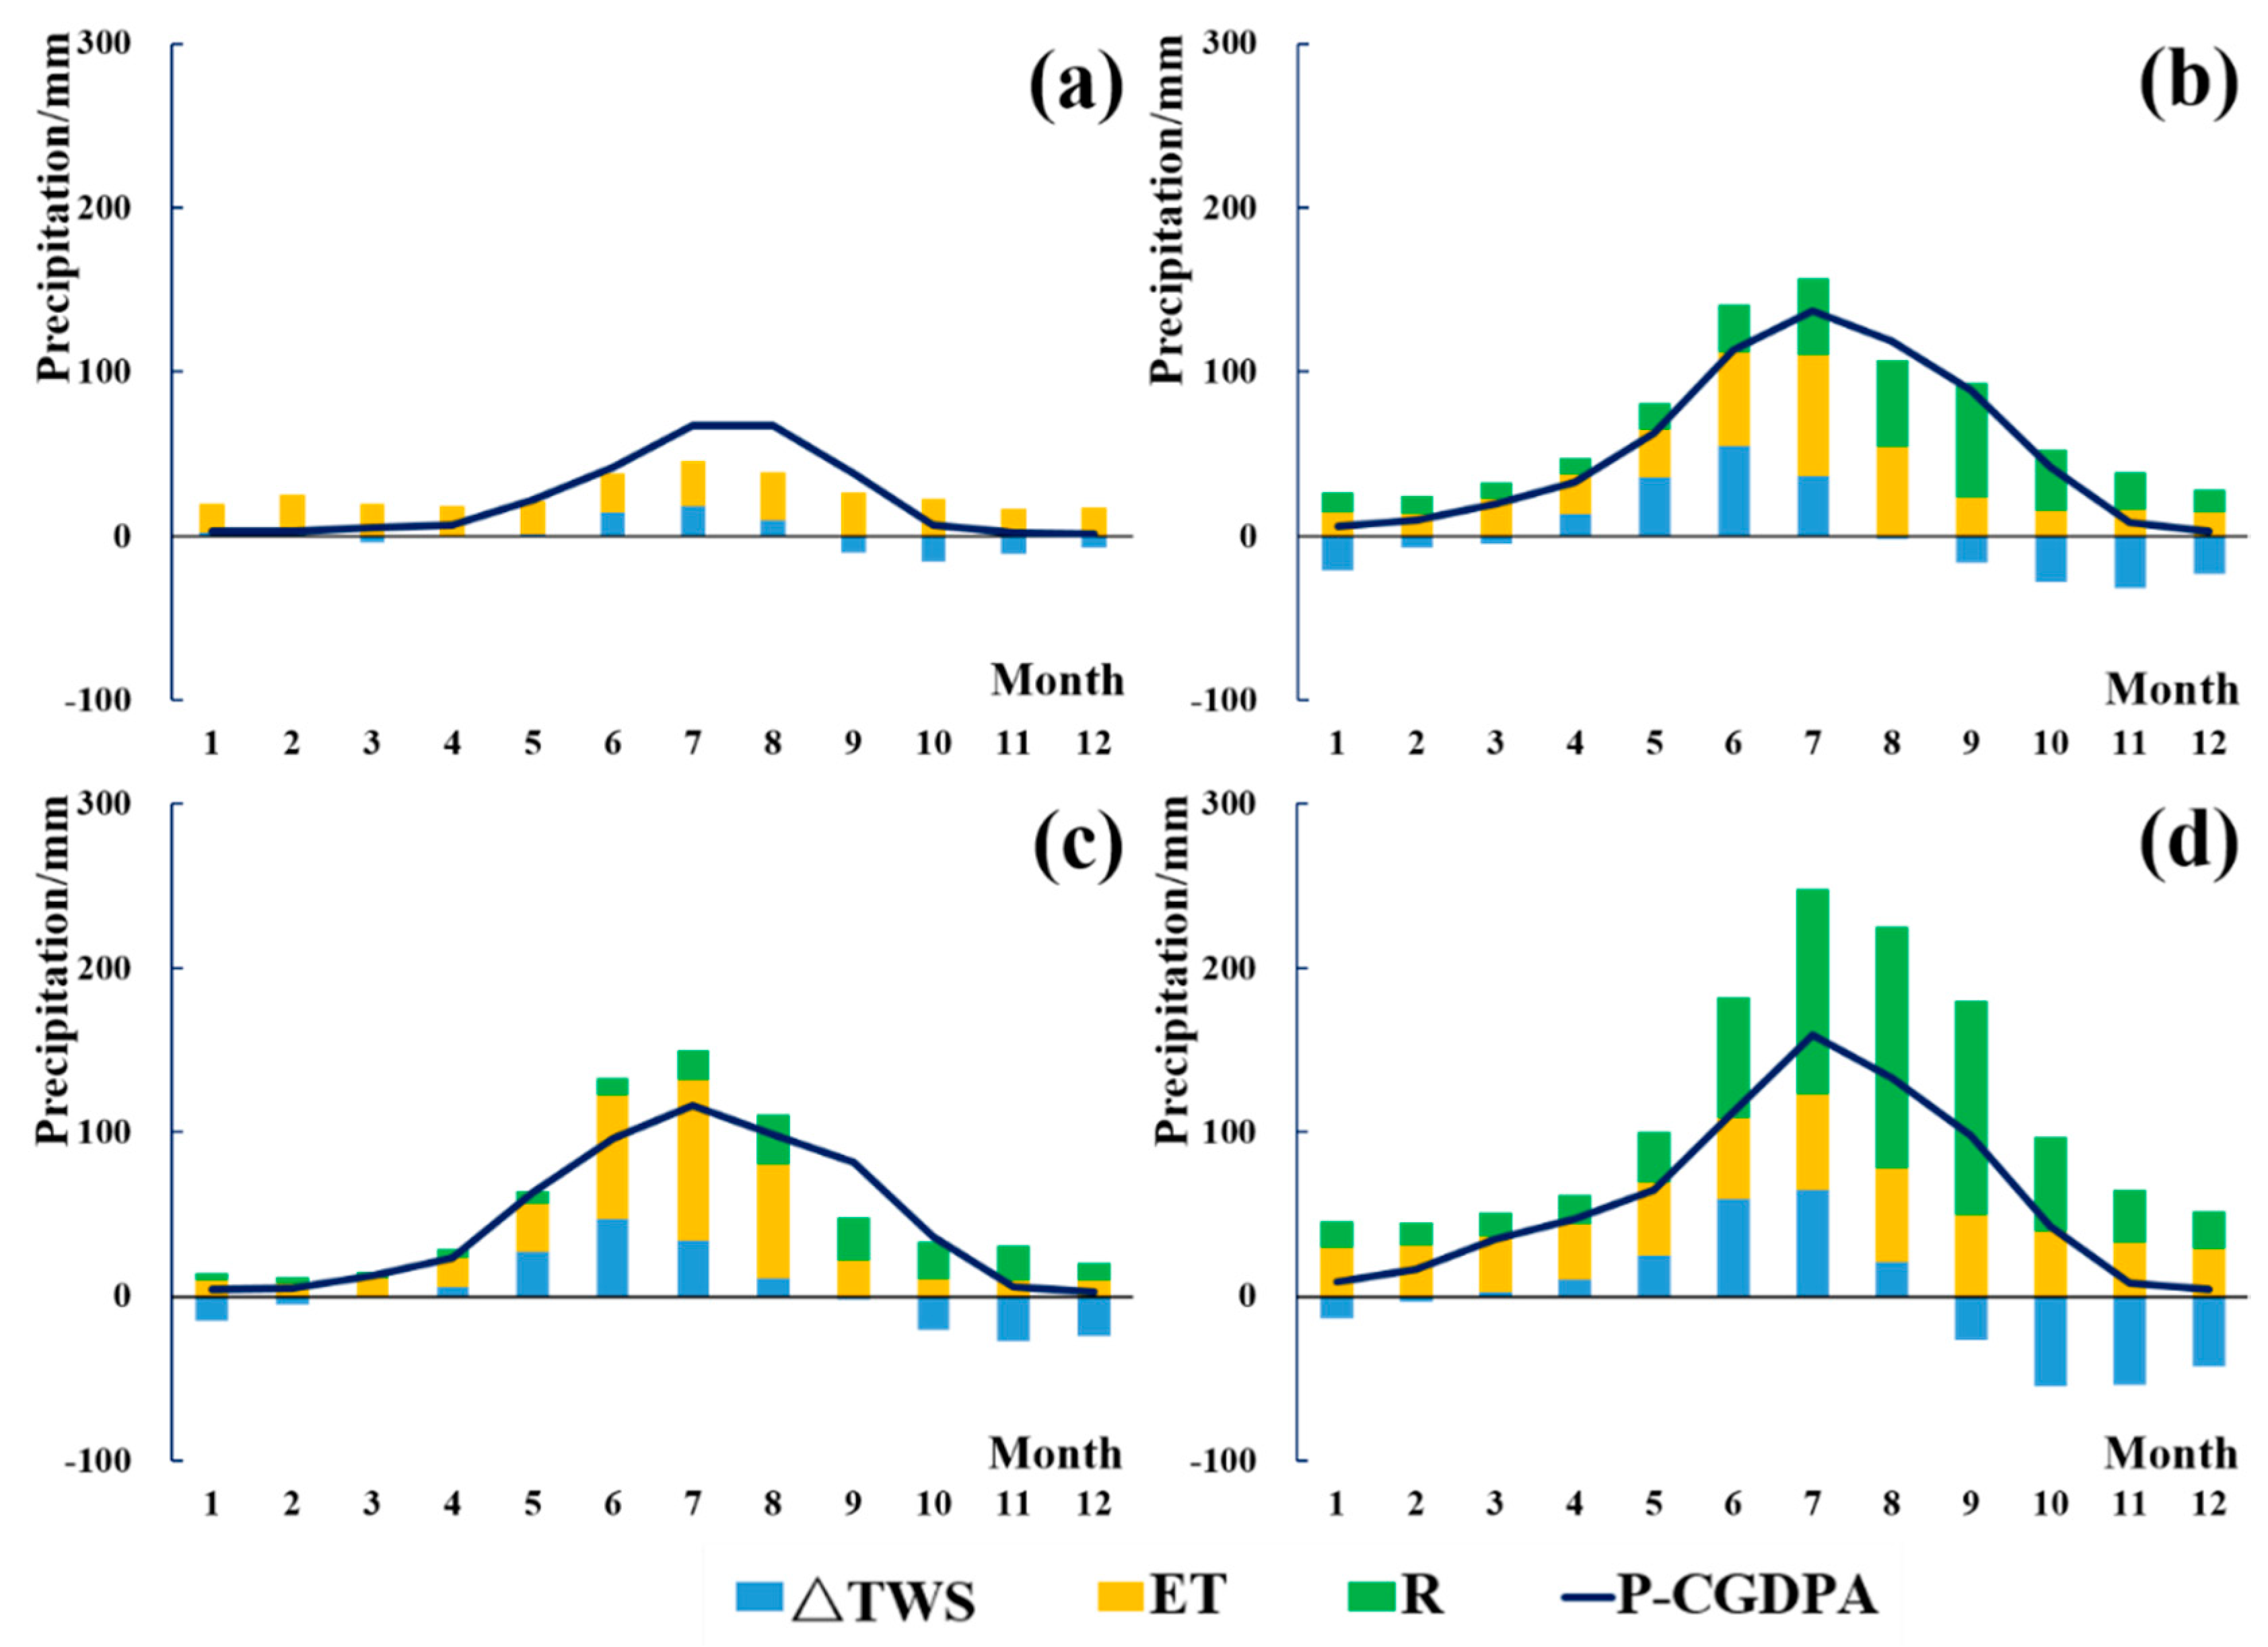
3.2. Estimated Precipitation Based on Water Balance

We estimated areal annual precipitation using the WBE method and analyzed the annual average and tendency of each component in WBE (Table 1). In general, ET presented a significant increasing trend in the QT, the UYA, and the UYE, varying from 3 to 10 mm/year, while it presented a slightly decreasing trend in the YZ, around −1.5 mm/year. As for runoff, it decreased slightly in the UYA (−2 mm/year) and in the UYE (−5 mm/year), however, it sharply increased in the YZ, over 30 mm/year.
Using the ETC method, we estimated the uncertainties of ΔTWS with three GRACE products and find that CSR performs best among the three. Similarly, we calculate the uncertainties of the three ET products and find that the GLEAM product has the best ET estimation results in the four basins (Table 1). Our result show good consistency with other research [16,49,50,51]. Hence, we chose CSR product for ΔTWS and GLEAM product for ET in estimating precipitation using the water balance equation.
Figure 3 shows precipitations from CGDPA and that estimated according to the water balance equation (WBE) for each basin. The shades represent the uncertainty range of the estimated precipitation based on WBE methods. Table 2 shows the evaluation metrics for precipitation estimated by WBE relative to that from CGDPA. Compared with CGDPA, the precipitation estimated by WBE performed well in the UYA and the UYE with Rbias less than 10% and NSE more than 0.70, while it performed ordinarily in the QT. However, in the YZ, precipitation from WBE yielded a higher estimate than CGDPA during the high precipitation periods such as July and August. The annual precipitation from the CGDPA was lower than that from the water balance equation by ~60 mm/year in the UYA and ~430 mm/year in the YZ. Furthermore, we analyzed the monthly precipitation in the four basins and the results are shown in Figure 4. On the month scale, precipitations from WBE were also consistent with those from CGDPA in the UYA and the UYE. Comparatively, in WBE, runoff was the main component of precipitation in the YZ, while ET takes a larger part of precipitation in the other three basins.

4. Discussion

4.1. TWS in Different Basins

The TWS change shows regional variation in the TP. In the QT, TWS has increased over the past 10 years at a rate of approximately 2.2 mm/year. In this endorheic basin, meltwater from glaciers and snowcaps can be stored as surface water or groundwater. It was reported that from 2000 to 2010, glaciers and snowcaps have reduced by 23% in the TP [52]. In the QT, the meltwater mostly remains in the basin, which leads to an increase in water levels and expansion of the water surface area of the inland lakes [53]. Previous studies found that the water level of 105 lakes increased by 0.24 m/year on average, and the Selinco Lake, the largest lake in the QT, has increased its water storage by 12.51 × 10⁸ m3/year from 2003 to 2012 [54,55].
In the UYA and the UYE, the degradation of permafrost and seasonally frozen grounds augments the permeability and water-holding capacity of the ground, which possibly causes part of the meltwater to be stored in the basin. Previous studies have shown that some permafrost regions transitioned into seasonally frozen land due to global warming, which contributed to an increase in the TWS in the UYE [18,56].
TWS shows a significant decline at a rate of −13.2 mm/year in the YZ, which is an outflow basin in canyon areas. The ablation of glaciers and snowcaps has increased the amount of meltwater, which mainly increases runoff, instead of remaining in the basin. The results (Table 1) show that from 2003 to 2014, the runoff in the YZ increased ~30 mm/year, which leads to a sharp decline in TWS.
Since the TP is considered to be the water tower of Asia, its TWS variation will have an impact on the hydrological cycle in the TP. The accumulation of TWS in the QT leads to an expansion of the lake area and an increase in water level. With the submergence of wetlands and oases, the biological diversity in these areas is reduced [27]. Additionally, the increase in TWS leads to an increase in evapotranspiration, which may accelerate regional hydrological circulation. On the other hand, similar to the YZ, other outflow rivers in the southern TP, such as the Lancang River and the Nu River, show a significant decrease in TWS [48]. This indicates that the water stored in the form of glaciers and snow caps in the Tibetan Plateau has continued to decline, which implies that runoff, as the most important regional water resource, will possibly decrease in the future.

4.2. Precipitation from the Water Balance Equation

The uncertainties of precipitations derived from WBE in the four basins are 19 (QT), 26 (UYA), 36 (UYE), and 39 (YZ) mm/year, respectively (Table 1). Previous research showed that the uncertainties of CGDPA are around 112.6 mm/year for the gauged region and 160.7 mm/year for the ungauged region [18,20,24,57], which is larger than the uncertainties of our results. Moreover, in the UYA and the UYE, our results are pretty well compared with precipitation from CGDPA.
However, there are differences between the precipitations estimated according to WBE and from CGDPA. In the YZ, the mean annual precipitation derived from WBE using GRACE data is 1119 mm/year, which is much larger than the 730 mm/year estimated by the CGDPA. As a reference, previous research [58] shows the mean annual precipitation of the YZ, derived from the climate model, is about 1000 mm/year, while the National Water Bulletin reports that precipitation in YZ is approximately 1100 mm/year [59]. It shows that WBE based on GRACE might provide a better estimate of precipitation. Regarding the underestimate of the CGDPA, a possible cause is the sparsely and unevenly distributed gauge stations in the TP (see Figure 1). Table 3 shows that the station density is 2.52 per 104 km2 for China, while it is only 0.58 per 104 km2 for the TP. Table 4 shows an uneven distribution along the elevation. Similar to the QT, there are only four gauges in the basin, which leads to the inaccuracy of CGDPA in estimating precipitation. As a result, CGDPA likely does not accurately reflect the spatial characteristics of precipitation. As mentioned above, our precipitations result possibly has higher accuracy than CGDPA has in TP.
In the YZ, nearly 80% of the stations are located in the intermediate and low elevation areas, which accounts for no more than 20% of the entire basin. As a result, the gauge network cannot capture the rainfall centers when strong convection rainfall occurs on a smaller scale during the rainy season. It leads to an underestimation in the interpolated areal precipitation, especially in summer. Moreover, the gauge network cannot capture the effect of orographic rainfall due to the lack of stations at high elevation, especially in the YZ where the topography is more complex. In contrast, the gauge station network has a higher density and a more even distribution in the UYA and UYE (see Figure 1 and Table 4).
As shown from Table 1 and Figure 4, in the estimation of monthly precipitation, ET contributes the most in the QT, the UYA, and the UYE while runoff contributes the most in the YZ. Besides, the uncertainty of estimated monthly precipitation is mainly from the ET. That is to say, the quality of ET product and runoff would have a great impact on the result of precipitation estimated by WBE in these regions. To improve the accuracy of our results, it is necessary to choose three different ET products and use ETC method to select the well-performed product in precipitation estimation with the WBE method.
Figure 3 shows that the estimated monthly precipitation is negative in winter in the QT and the UYE. To some extent, it might attribute to the uncertainty of ET product and runoff, as we could find from Figure 3 that the upper boundaries of the uncertainty range are all above zero in the four basins. Another possible cause is that a portion of groundwater runoff cannot be measured, which leads to an underestimation of R and P using Equation (1). Chen and Jiang [7] reported that the annual leakage exceeds 1.0 × 10¹¹ m3 in the inner area of the TP, which includes the QT and the UYE, and speculated the leakage water is outflowed in faraway locations, such as the Ordos in Inner Mongolia. Similarly, Chen et al. [60] found that the snowmelt on the Qilian Mountain infiltrates into deep groundwater that outflows into lakes in a desert 500 km away from the mountain by way of deep percolation.
In recent decades, different satellite precipitation products have been released that are able to provide spatial information on precipitation. However, these products generally require a bias correction based on reliable ground measurements [36]. In addition, satellite precipitation products have relatively large uncertainty. For example, Xu at al. [61] evaluated the performance of two satellite precipitation products, namely Global Precipitation Measurement Integrated Multi-Satellite Retrievals (GPM) and Tropical Rainfall Measuring Mission 3B42V7 (TRMM) in the southern Tibetan Plateau, and the results show that the RMSE is 139 and 143 mm/year for GPM and TRMM, respectively. Corresponding to the southern Tibetan Plateau, our results show that the RMSE of the estimated precipitation is less than 25 and 45 mm/year (Table 1) in UYA and YZ. According to data from GRACE, ET, and runoff, the water balance equation could be used to calculate the total precipitation amount in the poorly gauged or ungauged regions, which provides a good estimate of precipitation and a constraint on the bias correction of satellite precipitation. It indicates a potential method for estimating basin-scale precipitation by integrating total precipitation amounts from the water balance equation and spatial distribution of precipitation from remote sensing precipitation products in the poorly gauged and ungauged regions.

5. Conclusions

Using GRACE data, this study analyzed terrestrial water storage (TWS) in four large basins in the Tibetan Plateau (TP) to understand its spatial and temporal variation. Additionally, this study made an attempt to estimate areal precipitation in these regions by using a water balance equation according to the variation in TWS, evapotranspiration product (ET), and observed runoff, and furthermore compared the results with CGDPA. There are the following conclusions:
  • The TWS varies seasonally, with higher values in summer and autumn, lower values in spring and winter. From 2003 to 2017, the TWS exhibits an upward trend in the upper Yellow River (UYE), the upper Yangtze River (UYA), and the Qiangtang Plateau (QT), at rates of approximately 2.2 mm/year, while it shows a downward trend in the Yarlung Zangbo River (YZ), at rates of −13.2 mm/year. The sharp decline in the YZ indicates rapidly depleted water reserves.
  • Different basins have different reactions to the meltwater, leading to different TWS changes. The QT (an endorheic basin) along with the UYA and the UYE (outflow basins with cryolithozone) have fairly strong water-holding capacity to store meltwater. Oppositely, in the YZ (an outflow basin in the canyon area), the meltwater mainly generates runoff, which leads to a decrease of TWS.
  • The mean annual areal precipitation was estimated using the water balance equation as 260 ± 19 mm/year in the QT, 697 ± 26 mm/year in the UYA, 541 ± 36 mm/year in the UYE, and 1160 ± 39 mm/year in the YZ. CGDPA presumably has an underestimation of precipitation in YZ, especially in the summer (~430 mm/year). A potential explanation is that the low number of gauge stations could not consistently capture convective and orographic rainfall. From another perspective, this study provides an effective method to estimate precipitation in poorly gauged and ungauged basins according to runoff and remote sensing ET.

Author Contributions

Conceptualization, Y.J. and H.Y.; methodology, Y.J.; formal analysis, Y.J. and H.Y.; data curation, Y.J. and H.Y.; writing—original draft preparation, Y.J.; writing—review and editing, H.Y., Y.J., H.L., and Q.H.; supervision, H.Y. All authors have read and agreed to the published version of the manuscript.

Funding

This research was partially supported by funding from the National Natural Science Foundation of China (Grant No. 51979140 and 51622903), the National Program for Support of Top-notch Young Professionals, and the Program from the State Key Laboratory of Hydro-Science and Engineering of China (Grant No. 2017-KY-01).

Conflicts of Interest

The authors declare no conflict of interest.

Appendix A. The Extend Triple Collocation (ETC) Method

For three independent products, the triple collocation (TC) method first introduced by Stoffelen to estimate the error of each product while the true value was unknown, was widely applied in estimating uncertainties of various hydrological variables, such as precipitation [43,44,62], soil moisture [63,64], and total water storage [65]. Based on the same mathematical assumptions of TC, McColl et al. [45] came up with the extend triple collocation (ETC) method, to calculate RMSE and correlation coefficient (CC) without knowing the true value. In the ETC method, a product measurement to a hydrological variable could be shown as:
R i = α i + β i T + ε i
where Ri (i = 1, 2, 3) represents the measurement of the true value T with observation error εi (i = 1, 2, 3), respectively; αi and βi are the ordinary least squares (OLS) intercept and slope, respectively. The covariance between two different measurements, defined as Cij, (ij), could be shown as:
C i j = β i β j σ T 2 + β i E ( ε j T ) + α i E ( ε j ) + α j E ( ε i ) + E ( ε i ε j )
when using the ETC method, we are required to follow three mathematical assumptions: (1) the three products are totally independent of each other (ρ(Ri, Rj) = 0, ij), named zero cross-correlation assumption; (2) the errors of different products are independent, and unrelated to other products and the true value (ρ(εij) = ρ(εi, Rj) = ρ(εi, T) = 0, i ≠ j), named zero error cross-correlation assumption; (3) the expected value of the error is zero (E(εi) = 0), named zero error expectation assumption [66]. Based on the three assumptions, the Equation (A2) could be updated as:
C i j = C o v ( R i , R j ) = { β i β j σ ( T ) 2 ,   i j β i 2 σ ( T ) 2 + σ ( ε i ) 2 , i = j
Defining θi = βiσT, the covariance value of each two products could be shown as:
{ C 11 = θ 1 2 + σ ε 1 2 C 22 = θ 2 2 + σ ε 2 2 C 33 = θ 3 2 + σ ε 3 2 ,   { C 12 = θ 1 θ 2 C 13 = θ 1 θ 3 C 23 = θ 2 θ 3
then we could calculate RMSE (root mean square error) between each product and the true value:
σ R 1 = C 11 C 12 C 13 C 23
σ R 2 = C 22 C 12 C 23 C 13
σ R 3 = C 33 C 13 C 23 C 12

References

  1. Qiu, J. China: The third pole. Nature 2008, 454, 393–396. [Google Scholar] [CrossRef] [Green Version]
  2. You, Q.; Fraedrich, K.; Min, J.; Kang, S.; Zhu, X.; Pepin, N.; Zhang, L. Observed surface wind speed in the Tibetan Plateau since 1980 and its physical causes. Int. J. Clim. 2013, 34, 1873–1882. [Google Scholar] [CrossRef]
  3. Cui, X.; Graf, H.-F. Recent land cover changes on the Tibetan Plateau: A review. Clim. Chang. 2009, 94, 47–61. [Google Scholar] [CrossRef] [Green Version]
  4. Yao, T.; Thompson, L.; Yang, W.; Yu, W.; Gao, Y.; Guo, X.; Yang, X.; Duan, K.; Zhao, H.; Xu, B.; et al. Different glacier status with atmospheric circulations in Tibetan Plateau and surroundings. Nat. Clim. Chang. 2012, 2, 663–667. [Google Scholar] [CrossRef]
  5. Liu, W.; Wang, L.; Chen, D.; Tu, K.; Ruan, C.; Hu, Z. Large-scale circulation classification and its links to observed precipitation in the eastern and central Tibetan Plateau. Clim. Dyn. 2015, 46, 3481–3497. [Google Scholar] [CrossRef]
  6. Yang, K.; Wu, H.; Qin, J.; Lin, C.; Tang, W.; Chen, Y. Recent climate changes over the Tibetan Plateau and their impacts on energy and water cycle: A review. Glob. Planet. Chang. 2014, 112, 79–91. [Google Scholar] [CrossRef]
  7. Chen, J.; Jiang, Q. Research progress of groundwater deep circulation. Water Resour. Prot. 2015, 31, 8–17, (In Chinese with English abstract). [Google Scholar] [CrossRef]
  8. Jiang, J.; Huang, Q. The distribution characteristics of lakes in Tibetan Plateau and comparison with lakes over the whole China. Water Resourc. Prot. 2004, 20, 24–27. [Google Scholar]
  9. Ma, Y.; Zhang, Y.; Yang, D.; Farhan, S.B. Precipitation bias variability versus various gauges under different climatic conditions over the Third Pole Environment (TPE) region. Int. J. Climatol. 2015, 35, 1201–1211. [Google Scholar] [CrossRef]
  10. Ma, Y.; Yang, Y.; Han, Z.; Tang, G.; Maguire, L.; Chu, Z.; Hong, Y. Comprehensive evaluation of Ensemble Multi-Satellite Precipitation Dataset using the Dynamic Bayesian Model Averaging scheme over the Tibetan plateau. J. Hydrol. 2018, 556, 634–644. [Google Scholar] [CrossRef]
  11. Shen, Y.; Xiong, A. Validation and comparison of a new gauge-based precipitation analysis over mainland China. Int. J. Clim. 2015, 36, 252–265. [Google Scholar] [CrossRef]
  12. Qin, Y.; Yang, D.; Gao, B.; Wang, T.; Chen, J.; Chen, Y.; Wang, Y.; Zheng, G. Impacts of climate warming on the frozen ground and eco-hydrology in the Yellow River source region China. Sci. Total Environ. 2017, 605–606, 830–841. [Google Scholar] [CrossRef] [Green Version]
  13. Shen, Q.; Cong, Z.; Lei, H. Evaluating the impact of climate and underlying surface change on runoff within the Budyko framework: A study across 224 catchments in China. J. Hydrol. 2017, 554, 251–262. [Google Scholar] [CrossRef]
  14. Wang, A.; Zeng, X. Evaluation of multireanalysis products within site observations over the Tibetan Plateau. J. Geophys. Res. 2012, 117. [Google Scholar] [CrossRef]
  15. Liu, W.; Sun, F.; Li, Y.; Zhang, G.; Sang, Y.-F.; Lim, W.H.; Liu, J.; Wang, H.; Bai, P. Investigating water budget dynamics in 18 river basins across the Tibetan Plateau through multiple datasets. Hydrol. Earth Syst. Sci. 2018, 22, 351–371. [Google Scholar] [CrossRef] [Green Version]
  16. Liu, W.; Sun, F.; Li, Y.; Sang, Y.-F.; Wang, H.; Bai, P.; Zhang, G.; Liu, J. Seasonal cycles and trends of water budget components in 18 river basins across Tibetan Plateau: A multiple datasets perspective. Hydrol. Earth Syst. Sci. Discuss. 2016, 1–51. [Google Scholar] [CrossRef]
  17. Shi, Q.; Liang, S. Characterizing the surface radiation budget over the Tibetan Plateau with ground-measured, reanalysis, and remote sensing data sets: 1. Methodology. J. Geophys. Res. Atmos. 2013, 118, 9642–9657. [Google Scholar] [CrossRef]
  18. Li, Q.; Zhong, B.; Luo, Z.; Yao, C. GRACE-based estimates of water discharge over the Yellow River basin. Geodesy Geodyn. 2016, 7, 187–193. [Google Scholar] [CrossRef] [Green Version]
  19. Wahr, J.; Smeed, D.A.; Leuliette, E.; Swenson, S. Seasonal variability of the Red Sea, from satellite gravity, radar altimetry, and in situ observations. J. Geophys. Res. Oceans 2014, 119, 5091–5104. [Google Scholar] [CrossRef] [Green Version]
  20. Famiglietti, J.S.; Rodell, M. Water in the balance. Science 2013, 340, 1300–1301. [Google Scholar] [CrossRef]
  21. Rodell, M.; Velicogna, I.; Famiglietti, J.S. Satellite-based estimates of groundwater depletion in India. Nature 2009, 460, 999–1002. [Google Scholar] [CrossRef] [Green Version]
  22. Reager, J.T.; Famiglietti, J.S. Global terrestrial water storage capacity and flood potential using GRACE. Geophys. Res. Lett. 2009, 36, 23402. [Google Scholar] [CrossRef] [Green Version]
  23. Tapley, B.D.; Bettadpur, S.V.; Ries, J.; Thompson, P.F.; Watkins, M.M. GRACE Measurements of Mass Variability in the Earth System. Science 2004, 305, 503–505. [Google Scholar] [CrossRef] [Green Version]
  24. Hassan, A.A.; Jin, S. Water storage changes and balances in Africa observed by GRACE and hydrologic models. Geodesy Geodyn. 2016, 7, 39–49. [Google Scholar] [CrossRef] [Green Version]
  25. Reginald, M. Water mass loss of the Himalayas from GRACE, ICESat and SRTM. In Proceedings of the European Geosciences Union General Assembly 2010, Vienna, Austria, 2–7 May 2010. [Google Scholar]
  26. Sato, Y.; Ma, X.; Xu, J.; Matsuoka, M.; Zheng, H.; Liu, C.; Fukushima, Y. Analysis of long-term water balance in the source area of the Yellow River basin. Hydrol. Process. 2008, 22, 1618–1629. [Google Scholar] [CrossRef]
  27. Jiao, J.J.; Zhang, X.; Liu, Y.; Kuang, X. Increased Water Storage in the Qaidam Basin, the North Tibet Plateau from GRACE Gravity Data. PLoS ONE 2015, 10, e0141442. [Google Scholar] [CrossRef] [Green Version]
  28. Swenson, S.; Famiglietti, J.S.; Basara, J.; Wahr, J. Estimating profile soil moisture and groundwater variations using GRACE and Oklahoma Mesonet soil moisture data. Water Resour. Res. 2008, 44. [Google Scholar] [CrossRef] [Green Version]
  29. Soni, A.; Syed, T.H. Diagnosing Land Water Storage Variations in Major Indian River Basins using GRACE observations. Glob. Planet. Chang. 2015, 133, 263–271. [Google Scholar] [CrossRef]
  30. Famiglietti, J.S. The global groundwater crisis. Nat. Clim. Chang. 2014, 4, 945–948. [Google Scholar] [CrossRef]
  31. Frappart, F.; Ramillien, G. Monitoring Groundwater Storage Changes Using the Gravity Recovery and Climate Experiment (GRACE) Satellite Mission: A Review. Remote Sens. 2018, 10, 829. [Google Scholar] [CrossRef] [Green Version]
  32. Frappart, F.; Ramillien, G.; Famiglietti, J.S. Water balance of the Arctic drainage system using GRACE gravimetry products. Int. J. Remote Sens. 2011, 32, 431–453. [Google Scholar] [CrossRef] [Green Version]
  33. Syed, T.H.; Famiglietti, J.S.; Chambers, D. GRACE-Based Estimates of Terrestrial Freshwater Discharge from Basin to Continental Scales. J. Hydrometeorol. 2009, 10, 22–40. [Google Scholar] [CrossRef]
  34. Ramillien, G.; Frappart, F.; Güntner, A.; Cazenave, A.; Laval, K.; Ngo-Duc, T. Time variations of the regional evapotranspiration rate from Gravity Recovery and Climate Experiment (GRACE) satellite gravimetry. Water Resour. Res. 2006, 42. [Google Scholar] [CrossRef] [Green Version]
  35. Pascolini-Campbell, M.A.; Reager, J.T.; Fisher, J.B. GRACE-based mass conservation as a validation target for basin-scale evapotranspiration in the contiguous United States. Water Resour. Res. 2020, 56. [Google Scholar] [CrossRef]
  36. Behrangi, A.; Gardner, A.; Reager, J.T.; Fisher, J.B. Using GRACE to constrain precipitation amount over cold mountainous basins. Geophys. Res. Lett. 2017, 44, 219–227. [Google Scholar] [CrossRef]
  37. Available online: https://grace.jpl.nasa.gov/data/get-data/monthly-mass-grids-land/ (accessed on 15 February 2019).
  38. Sakumura, C.; Bettadpur, S.; Bruinsma, S. Ensemble prediction and intercomparison analysis of GRACE time-variable gravity field models. Geophys. Res. Lett. 2014, 41, 1389–1397. [Google Scholar] [CrossRef]
  39. Miralles, D.G.; Holmes, T.; De Jeu, R.; Gash, J.H.; Meesters, A.G.C.A.; Dolman, H. Global land-surface evaporation estimated from satellite-based observations. Hydrol. Earth Syst. Sci. Discuss. 2010, 7, 8479–8519. [Google Scholar] [CrossRef] [Green Version]
  40. Dee, D.P.; Uppala, S.M.; Simmons, A.J.; Berrisford, P.; Poli, P.; Kobayashi, S.; Bechtold, P. The ERA-Interim reanalysis: Configuration and performance of the data assimilation system. Q. J. R. Meteorol. Soc. 2011, 137, 553–597. [Google Scholar] [CrossRef]
  41. Rodell, M.; Houser, P.R.; Jambor, U.; Gottschalck, J.; Mitchell, K.; Meng, C.-J.; Arsenault, K.R.; Cosgrove, B.; Radakovich, J.; Bosilovich, M.; et al. The Global Land Data Assimilation System. Bull. Am. Meteorol. Soc. 2004, 85, 381–394. [Google Scholar] [CrossRef] [Green Version]
  42. Kling, H.; Fuchs, M.; Paulin, M. Runoff conditions in the upper Danube basin under an ensemble of climate change scenarios. J. Hydrol. 2012, 424, 264–277. [Google Scholar] [CrossRef]
  43. Stoffelen, A. Toward the true near-surface wind speed: Error modeling and calibration using triple collocation. J. Geophys. Res. Space Phys. 1998, 103, 7755–7766. [Google Scholar] [CrossRef]
  44. Alemohammad, S.H.; McColl, K.A.; Konings, A.G.; Entekhabi, D.; Stoffelen, A. Characterization of precipitation product errors across the United States using multiplicative triple collocation. Hydrol. Earth Syst. Sci. 2015, 19, 3489–3503. [Google Scholar] [CrossRef] [Green Version]
  45. McColl, K.A.; Vogelzang, J.; Konings, A.G.; Entekhabi, D.; Piles, M.; Stoffelen, A. Extended triple collocation: Estimating errors and correlation coefficients with respect to an unknown target. Geophys. Res. Lett. 2014, 41, 6229–6236. [Google Scholar] [CrossRef] [Green Version]
  46. Rodell, M.; Seneviratne, S.I.; Viterbo, P.; Höll, S.; Famiglietti, J.S.; Chen, J.; Wilson, W.S. Basin scale estimates of evapotranspiration using GRACE and other observations. Geophys. Res. Lett. 2004, 31, 20504. [Google Scholar] [CrossRef] [Green Version]
  47. Jing, W.; Zhang, P.; Zhao, X. A comparison of different GRACE solutions in terrestrial water storage trend estimation over Tibetan Plateau. Sci. Rep. 2019, 9, 1765. [Google Scholar] [CrossRef] [Green Version]
  48. Xiang, L.; Wang, H.; Steffen, H.; Wu, P.; Jia, L.; Jiang, L.; Shen, Q. Groundwater storage changes in the Tibetan Plateau and adjacent areas revealed from GRACE satellite gravity data. Earth Planet. Sci. Lett. 2016, 449, 228–239. [Google Scholar] [CrossRef] [Green Version]
  49. Huang, L.; Li, Z.; Tang, Q.; Zhang, X.; Liu, X.; Cui, H. Evaluation of satellite-based evapotranspiration estimates in China. J. Appl. Remote Sens. 2017, 11, 026019. [Google Scholar] [CrossRef]
  50. Liu, R.; Wen, J.; Wang, X.; Wang, Z. Validation of evapotranspiration and its long-term trends in the Yellow River source region. J. Water Clim. Chang. 2017, 8, 495–509. [Google Scholar] [CrossRef]
  51. Chen, Y.; Xia, J.; Liang, S.; Feng, J.; Fisher, J.B.; Li, X.; Li, X.; Liu, S.; Ma, Z.; Miyata, A.; et al. Comparison of satellite-based evapotranspiration models over terrestrial ecosystems in China. Remote Sens. Environ. 2014, 140, 279–293. [Google Scholar] [CrossRef]
  52. Cui, Z.-Y.; Li, Z.-W.; Li, J.; Wang, C.-C.; Zhou, W.-M. A preliminary study of the volume variation of the glaciers in the Qinghai-Tibetan Plateau Interior Area between 1970 and 2000. Chin. J. Geophys. 2014, 57, 1440–1450. [Google Scholar] [CrossRef]
  53. Wan, W.; Xiao, P.F.; Feng, X.Z.; Li, H.; Ma, R.H.; Duan, H.T. Remote sensing analysis for changes of lakes in the southeast of Qiangtang area, Qinghai-Tibetan Plateau in recent 30 years. J. Lake Sci. 2010, 22, 874–881. [Google Scholar] [CrossRef]
  54. Zhou, J.; Wang, L.; Zhang, Y.; Guo, Y.; Li, X.; Liu, W. Exploring the water storage changes in the largest lake (Selin Co) over the Tibetan Plateau during 2003–2012 from a basin-wide hydrological modeling. Water Resour. Res. 2015, 51, 8060–8086. [Google Scholar] [CrossRef] [Green Version]
  55. Song, C.; Huang, B.; Richards, K.; Ke, L.; Phan, V.H. Accelerated lake expansion on the Tibetan Plateau in the 2000s: Induced by glacial melting or other processes? Water Resour. Res. 2014, 50, 3170–3186. [Google Scholar] [CrossRef] [Green Version]
  56. Gao, B.; Yang, D.; Qin, Y.; Wang, Y.; Li, H.; Zhang, Y.; Zhang, T. Change in Frozen Soils and its Effect on Regional Hydrology in the Upper Heihe Basin, the Northeast Qinghai-Tibetan Plateau. Cryosphere 2018, 12, 657–673. [Google Scholar] [CrossRef] [Green Version]
  57. Li, C.; Tang, G.; Hong, Y. Cross-evaluation of ground-based, multi-satellite and reanalysis precipitation products: Applicability of the Triple Collocation method across Mainland China. J. Hydrol. 2018, 562, 71–83. [Google Scholar] [CrossRef]
  58. Li, X.; Long, D.; Han, Z.; Scanlon, B.R.; Sun, Z.; Han, P.; Hou, A. Evapotranspiration Estimation for Tibetan Plateau Headwaters Using Conjoint Terrestrial and Atmospheric Water Balances and Multisource Remote Sensing. Water Resour. Res. 2019, 55, 8608–8630. [Google Scholar] [CrossRef]
  59. Changjiang &Southwest Rivers Water Resources Bulletin, Changjiang Water Resources Commission of the Ministry of Water Resources. 2010. Available online: http://www.cjw.gov.cn/zwzc/bmgb (accessed on 3 June 2018).
  60. Chen, J.S.; Li, L.; Wang, J.Y.; Barry, D.A.; Sheng, X.F.; Zu Gu, W.; Zhao, X.; Chen, L. Groundwater maintains dune landscape. Nature 2004, 432, 459–460. [Google Scholar] [CrossRef]
  61. Xu, R.; Tian, F.; Yang, L.; Hu, H.; Lu, H.; Hou, A. Ground validation of GPM IMERG and TRMM 3B42V7 rainfall products over southern Tibetan Plateau based on a high-density rain gauge network. J. Geophys. Res. Atmos. 2017, 122, 910–924. [Google Scholar] [CrossRef]
  62. Roebeling, R.; Wolters, E.L.A.; Meirink, J.F.; Leijnse, H. Triple Collocation of Summer Precipitation Retrievals from SEVIRI over Europe with Gridded Rain Gauge and Weather Radar Data. J. Hydrometeorol. 2012, 13, 1552–1566. [Google Scholar] [CrossRef]
  63. Hain, C.R.; Crow, W.T.; Mecikalski, J.R.; Anderson, M.C.; Holmes, T. An intercomparison of available soil moisture estimates from thermal infrared and passive microwave remote sensing and land surface modeling. J. Geophys. Res. Space Phys. 2011, 116, 15. [Google Scholar] [CrossRef]
  64. Draper, C.; Reichle, R.; De Jeu, R.; Naeimi, V.; Parinussa, R.; Wagner, W. Estimating root mean square errors in remotely sensed soil moisture over continental scale domains. Remote Sens. Environ. 2013, 137, 288–298. [Google Scholar] [CrossRef] [Green Version]
  65. van Dijk, A.I.J.M.; Renzullo, L.J.; Wada, Y.; Tregoning, P. A global water cycle reanalysis (2003–2012) merging satellite gravimetry and altimetry observations with a hydrological multi-model ensemble. Hydrol. Earth Syst. Sci. 2014, 18, 2955. [Google Scholar] [CrossRef] [Green Version]
  66. Zwieback, S.; Scipal, K.; Dorigo, W.; Wagner, W. Structural and statistical properties of the collocation technique for error characterization. Nonlinear Process. Geophys. 2012, 19, 69–80. [Google Scholar] [CrossRef]
Figure 1. Map of the study area. QT denotes the Qiangtang Plateau (68.26 × 10⁴ km2). UYA denotes the upper Yangtze River (69.47 × 10⁴ km2). UYE denotes the upper Yellow River (12.20 × 10⁴ km2). YZ denotes the Yarlung Zangbo River (18.93 × 10⁴ km2). The data for the National Meteorological Stations were updated to 2012.
Remotesensing 12 03129 g001
Figure 2. Monthly variation in terrestrial water storage (TWS) in the four basins: (a) QT, (b) UYA, (c) UYE, and (d) YZ. The general trend of TWS change and the significance level is shown in the figure. TWS had slightly increased in the QT, the UYA, and the UYE, and sharply decreased in the YZ in general. Before 2006, the TWS in TP showed an increasing trend, and then different basins change in different patterns.
Remotesensing 12 03129 g002
Figure 3. Precipitation estimated from WBE and CGDPA: (a) QT, (b) UYA, (c) UYE, and (d) YZ. The shades indicate the monthly precipitation uncertainty range calculated from the WBE method. The time series begins in January 2003, and there are 174 months in total for QT, UYA, and UYE, 144 months for YZ.
Remotesensing 12 03129 g003
Figure 4. Analysis of monthly precipitation from WBE and CGDPA: (a) QT, (b) UYA, (c) UYE, and (d) YZ. The bar represents precipitation from WBE, and the curve represents precipitation from CGDPA. The contribution of each component in the water balance equation is shown in different colors.
Remotesensing 12 03129 g004
Table 1. General analyses of each component in WBE. “AVE”, “T”, and “U” represent the annual average value (unit: mm/year), the interannual trend (unit: mm/year2), and the uncertainty (unit: mm/year) calculated from different products for each component, respectively. U∆TWS and UET are calculated in the triple collocation method, presenting the uncertainty of each ΔTWS and ET product, respectively.
△TWSETRP
CSRJPLGFZGLEAMNOAHERACGDPAWBE
QTAVE* 1.91.91.7* 2592362200264261
T−0.23 ++−0.20 ++−0.25 ++3.2 ++3.8 ++3.7 ++-0.12 ++0.20 ++
U0.140.150.1719.430.222.60.0-19.4
UYAAVE* 7.26.56.4* 358311372333634697
T−0.07 +−0.07 +−0.08 +9.5 +++9.4 +++9.8 +++−1.9 +0.12 ++0.40 ++
U0.210.230.2620.528.041.716.7-26.4
UYEAVE* 4.34.53.9* 370374364167543541
T−0.32 ++−0.33 ++−0.31 ++6.0 +++5.1 +++5.5 +++−5.0 +0.48 ++0.44 ++
U0.120.150.1435.567.344.18.4-36.5
YZAVE* −8.8−8.2−8.6* 4874474446837301160
T−0.26 ++−0.25 ++−0.28 ++−1.6 ++−1.5 ++−1.6 ++33.0 ++1.68 ++2.64 ++
U0.180.200.2718.254.427.934.2-38.7
The significance level is marked after the value, where “+”, “++” and “+++” represents a significance level of 90%, 95%, and 99%, respectively. The product with the least uncertainty is chosen to estimate areal precipitation (marked with * in the front).
Table 2. Evaluation metrics for precipitation estimated by WBE relative to that from CGDPA. Namely, correlation coefficient (r), relative bias (Rbias), root-mean-square error (RMSE), Nash–Sutcliffe efficiency coefficient (NSE), and Kling–Gupta efficiency (KGE, a comprehensive indicator including correlation, means, and dispersion of two paired datasets).
MetricQTUYAUYEYZ
r0.820.960.950.98
Rbias (%)−1.149.94−0.3758.90
NSE0.510.860.730.22
KGE0.530.900.790.28
RMSE (mm/month)17.3622.6829.8551.04
Discrepancy (mm/year)−363−2430
Table 3. Spatial characteristics in meteorological station distribution.
RegionNumber of StationsDensity
(/104km2)
Station Elevation (m)
AverageMaximumMinimum
QT40.064646.748004414.9
UYA420.992921.24612.21009.7
UYE351.812927.74272.31813.9
YZ160.703668.54488.82736
TP1480.583062.148001009.7
China24162.52630.34800−48.7
Table 4. Station distribution along the elevation in the four basins. The Pct. shows the area within the elevation range as a percentage of the entire basin area, and the Num. column shows the number of the meteorological stations located within the elevation range.
RegionArea
(104km2)
Elevation (m)0–20002000–30003000–40004000–50005000–60006000–8000
AVGMaxMinPct.
(%)
Num.Pct.
(%)
Num.Pct.
(%)
Num.Pct.
(%)
Num.Pct.
(%)
Num.Pct.
(%)
Num.
QT68.264998673638400.0000.0000.56051.48447.5000.460
UYA42.394217690410710.5785.911423.131364.4065.9700.020
UYE19.383820600917940.1439.751747.831342.2020.0800.000
YZ22.83462871821353.5102.54310.071043.65339.6500.580

