Abstract
This paper presents a simple and efficient image processing method for estimating the number of coconut trees in the Tonga region using very high spatial resolution data (30 cm) in the blue, green, red and near infrared spectral bands acquired by the WorldView-3 sensor. The method is based on the detection of tree shadows and the further analysis to reject false detection using geometrical properties of the derived segments. The algorithm is evaluated by comparing coconut tree counts derived by an expert through photo-interpretation over 57 randomly distributed (4% sampling rate) segments of 200 m × 200 m over the Vaini region of the Tongatapu island. The number of detected trees agreed within 5% versus validation data. The proposed method was also evaluated over the whole Tonga archipelago by comparing satellite-derived estimates to the 2015 agricultural census data—the total tree counts for both Tonga and Tongatapu agreed within 3%.
1. Introduction
Coconut trees are an important part of the tropical islands agricultural systems, which are prone to natural disasters. It is, therefore, important to monitor these natural resources on a regular basis to assess potential or actual impacts of those catastrophic events.
Earth observation data from space offer capabilities to regularly and spatially monitor Earth’s resources explicitly. Very high spatial resolution (VHR) dataset from passive remote sensing such as QuickBird, IKONOS, Pleiades and WorldView-3 have been used to map individual trees using various methods (see [1] for a review). More related to the objectives of this study, a coconut tree counting method using IKONOS (~80 cm spatial resolution) has been developed and applied to the Tuamotu archipelago [2] with an error of 6.81%. They used a combination of segmentation methods and a machine learning classifier (support vector machine (SVM)) to identify and delineate tree crowns and count them. With advances in machine learning methods, such as deep learning, a lot of effort has been put on applying these methods for tree detection in satellite imagery [3,4,5,6,7]. However, proper training of deep learning models requires a lot of labeled training data, which is time-consuming [8] and might not be always feasible, when damages need to be assessed after the natural disasters. Also, interpretation of deep learning models to extract invariant (transferrable) features is usually not straightforward [8].
In this letter, we present an automatic approach for coconut tree counting using WorldView-3 data at 30 cm spatial resolution acquired in 2014 [9]. The proposed algorithm is tailored towards coconut plantations that have quite a regular and sparse structure—the ones chiefly produced for agricultural purposes. We applied this approach over the Tonga region and validated it using random samples manually analyzed over the Vaini region of Tongatapu and by comparing them to 2015 Tonga agricultural census data.
2. Method
2.1. Algorithm Description
The algorithm was designed for WorldView-3 data at 30 cm spatial resolution. The WorldView-3 data were acquired during the 2013–2016 period. The algorithm is based on a rather simple idea that the shadow cast by the coconut tree can be detected using remote sensing data, as it stands clearly against the background vegetation as illustrated in Figure 1. As shown in Figure 1b, the shadow detection from coconut trees is pretty accurate; however, shadows from other trees or terrain (not coconut) are also detected, which would lead to the overdetection of coconut trees. In order to reduce this effect, a subsequent step is introduced in the algorithm after the shadow mask creation. The size of each potential coconut shadow is analyzed to reject shadows that are either too small or too large. An additional test (B < NIR and NIR > 50) is performed to reject water bodies right away to speed up the process of coconut tree detection.
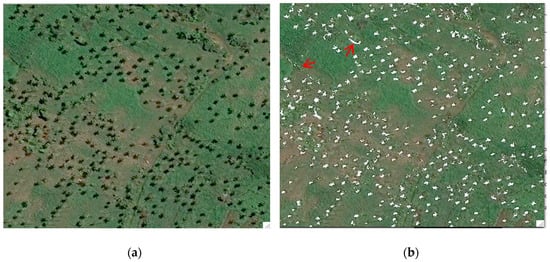
Figure 1.
(a) Details of the true color image acquired by WorldView-3 at 30 cm showing coconut trees and their shadows. (b) The shadows are automatically detected using a simple threshold algorithm and shown in white. The red arrows point to areas where shadows are detected, but are either too small or too large to be coconut trees.
Figure 2 shows the final algorithm flowchart. The first step is the detection of shadows in the image, which is done by a simple thresholding on a combination of the three visible and one NIR band available on WorldView-3. This shadow detection is immediately refined by one additional test on the minimum NIR signal allowed: it must be greater than the blue and greater than an absolute threshold (T2 = 50). This is to prevent water bodies from being classified as shadow.
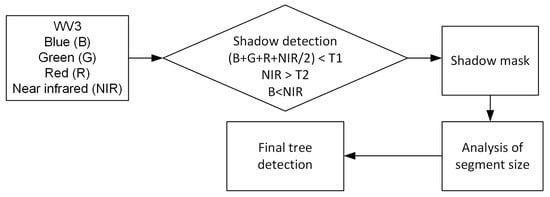
Figure 2.
Coconut tree counting algorithm flowchart. Both thresholds T1 and T2 are equal to 50 digital numbers (DN).
The second step is the filtering of shadows that are too big or too small to be cast by a coconut tree. In that step, shadow segments are generated from the shadow mask and their geometric size is analyzed. The segments where dimensions are either too small or too big to be a coconut tree shadow are rejected. The size needs to be between 3 × 3 and 10 × 10 pixels, with one pixel corresponding to 30 cm. Those thresholds are derived using a priori information on the size of coconut tree canopy projected on a 2D satellite image. Figure 3 illustrates the cluster size filtering step showing how shadows from the bigger trees or smaller bushes are eliminated from the selection.
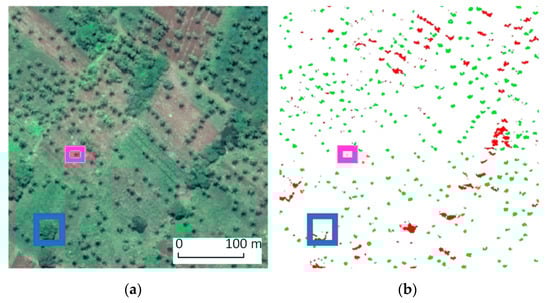
Figure 3.
Input WorldView-3 image in true-color composite is shown in (a). Coconut tree detection shows the cluster of selected sizes in green (b). You may notice the bigger trees are not selected (blue square) as well as the smaller shadows (magenta square).
It should be noted that the proposed algorithm does not directly incorporate textural information, which might improve the accuracy of tree detection, e.g., using machine learning algorithms, such as convolutional neural network (CNN). At the same time, this algorithm can be used as a tool to assist with labelling trees, since doing it manually is a time and resource challenging task [8].
2.2. Validation
The algorithm validation was performed, as it is customary by comparing the number of coconut trees derived from satellite images and the one obtained through photointerpretation as done in [2]. As an elementary sampling unit (ESU), a square segment of 200 m × 200 m was selected. The size of the segment should be big enough to have enough trees in it, and not very big, so collecting high quality references data would be feasible. There were a total of 1530 segments covering the Vaini region of the Tongatapu, of which 57 segments (4% sampling rate) were randomly selected for photointerpretation. The number of segments was selected based on the findings from previous studies, e.g., [10,11,12]. Since, we did not have a prior information on coconut tree locations, we employed a random sampling (without stratification [10,11,12]) to provide a statically viable validation. We used independent validation segments to validate and analyses if there are no substantial biases. Figure 4 shows the geographical distribution of segments for the Vaini region. For each segment, the analyst marked all the coconut trees using true color (red–green–blue) and false color (near infrared–red–green) compositions of WorldView-3 images. The main features used to detect coconut trees were the ‘star’-like shape of coconut trees and the shadow from the trees. The analyst also used several geo-tagged ground photos available from Google Earth (Figure 5). It should be noted that the analyst was not shown the results of the coconut tree detection with the satellite-based algorithm, as to ensure the independence of satellite-derived data and photo-interpreted data. The number of coconut trees in the segments ranged from 0 to 370. Figure 6 shows typical examples of segments: (a) no coconut trees, (b) coconut trees plantation and (c) a mixture of coconut trees with forest.
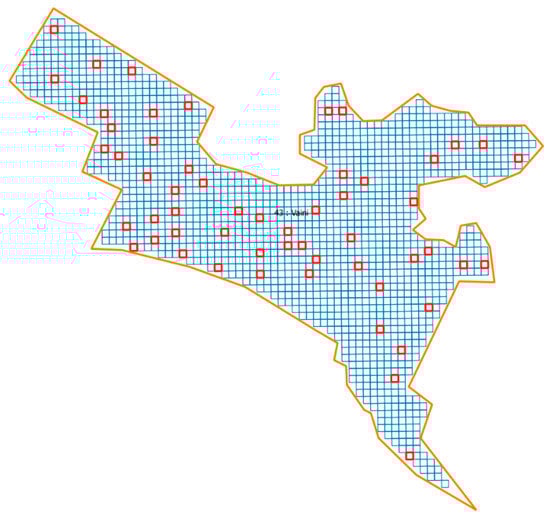
Figure 4.
Distribution of the randomly selected 200 m × 200 m segments (in red) used for photointerpretation of the coconut tree counts in the Vaini region. Total area of the Vaini region is 64.2 km2.
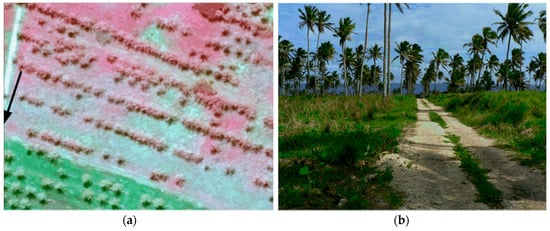
Figure 5.
Example of satellite data showing coconut trees (a) with the associated Google Earth geo-tagged ground photo and (b) (black arrow shows direction of view in the geotagged photo).
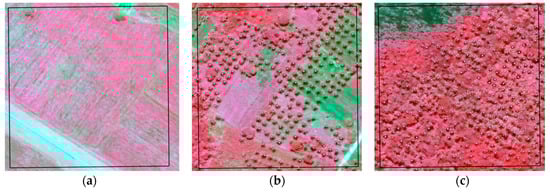
Figure 6.
An example of a validation segment without any coconut trees (a), with the coconut tree plantation (b), with a mixture of coconut trees with the forest (c).
3. Results
Figure 7 shows the performance of the algorithm, when comparing satellite-derived estimates to the photo-interpreted results. The overall performance is quite good, with photo-interpretation estimated at 8926 trees versus 8498 automatically detected (error of about ~5%), which is comparable to the results in [2].
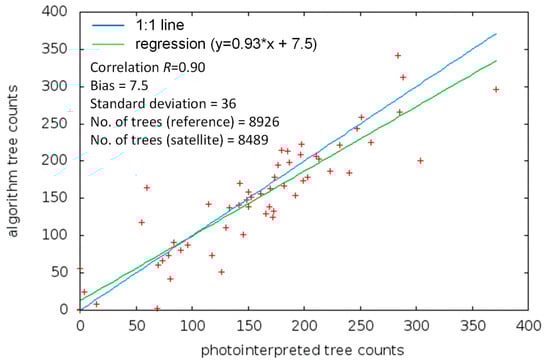
Figure 7.
Results of the coconut tree counting algorithm validation for the Vaini region.
The algorithm performance was further evaluated by comparing the estimated tree counts from satellite imagery to the number published in the 2015 agriculture census data. It should be noted that in the comparison the original algorithm tree counts (uncorrected tree counts) were adjusted to reflect that the census only reports results for the allotted land area, which varies between 50 to 90% of the total area of the administrative unit considered. The allotted land area is constituted by parcels owned by an agricultural holder of more than 1/8 of an acre. For example, Tongatapu island is the largest agricultural area with 42,497 acres (64%). The results are summarized in Table 1 (for Tonga), Table 2 (for the Tongatapu Island) and in Figure 8 and Figure 9. The correlation is high between the algorithm uncorrected counted trees and the census data (r = 0.98 for Tonga, r = 0.88 for Tongatapu), but the algorithm estimation is 60% higher on average than the census data due to the difference between the allotted and total areas. When accounting for the allotted area, the correlation stays about the same (r = 0.97 for Tonga, r = 0.90 for Tongatapu), but the bias is greatly reduced with the algorithm estimation being 3% lower on average than the census data. Overall, the algorithm total corrected tree count over Tonga was 673,475 versus 720,276 for the census, and over Tongatapu it was 509,354 versus 509,807.

Table 1.
Comparison of the algorithm coconut tree counts to the results published in the 2015 agricultural census over the different parts of the Tonga archipelago.
Table 2.
Comparison of the algorithm coconut tree counts to the results published in the 2015 agricultural census over the different administrative unit of the Tongatapu.
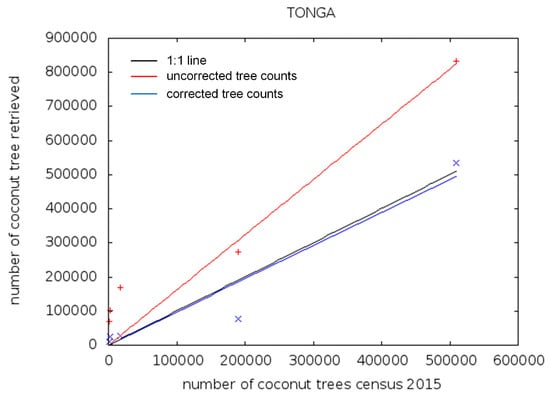
Figure 8.
Comparison of the algorithm tree counts over Tonga with the original 2015 agricultural census data (uncorrected tree counts) and accounting for the allotted land area (corrected tree counts). The black line is y = x.
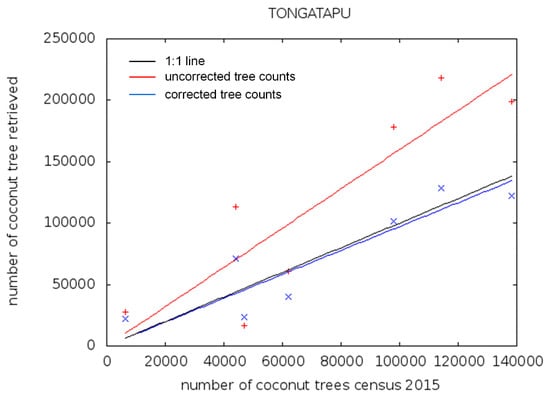
Figure 9.
Comparison of the algorithm tree counts over Tongatapu with the original 2015 agricultural census data (uncorrected tree counts) and accounting for the allotted land area (corrected tree counts).
It should be noted that the number of coconut trees reported for Tongatapu is different in Table 1 (Tongatapu: 534,313) and Table 2 (total: 509,354) because the granularity of the dataset for the allotted area is different. For Table 1, the Tongatatapu data are corrected using the % allotted land of the whole area; in Table 2 the Tongatapu area is broken down into smaller administrative units each corrected with their % of allotted land, potentially leading to a more accurate result.
4. Conclusions
We presented a simple coconut tree counting algorithm using very high spatial resolution (30 cm) multi-spectral satellite imagery and applied it over the Tonga region. The results were validated by comparing them to manually counted trees from photo-interpretation for 57 samples of 200 m × 200 m chosen randomly. The accuracy obtained over this validation dataset was 5%. Furthermore, the algorithm was evaluated over the whole Tonga archipelago by comparing to the 2015 agricultural census data—the total tree counts for both Tonga and Tongatapu agreed within 3%.
This work could easily be adapted to other islands in the region and is particularly useful to quickly determine the impact of more frequent cyclones on coconut plantations that constitute an important resource. For example, by running this algorithm just before and after Gita (February 2018), we determined an impact of 40–50% loss in the number of coconut trees.
Author Contributions
Conceptualization, E.F.V., I.B.-R. and K.S.; methodology, E.F.V.; validation, E.F.V. and S.S.; formal analysis, E.F.V.; data curation, E.F.V. and S.S.; writing—original draft preparation, E.F.V.; writing—review and editing, E.F.V., S.S., I.B.-R. and K.S. All authors have read and agreed to the published version of the manuscript.
Funding
This research was funded by the NASA Land-Cover/Land-Use Change (LCLUC) Program, grant number 80NSSC18K0336, and Cooperative Agreement NASA, grant number 80NNSC19M0222.
Conflicts of Interest
The authors declare no conflict of interest.
References
- Ke, Y.; Quackenbush, L.J. A review of methods for automatic individual tree-crown detection and delineation from passive remote sensing. Int. J. Remote Sens. 2011, 32, 4725–4747. [Google Scholar] [CrossRef]
- Teina, R.; Béréziat, D.; Stoll, B.; Chabrier, S. Toward a global Tuamotu archipelago coconut trees sensing using high resolution optical data. In Proceedings of the IEEE International Geoscience and Remote Sensing Symposium IGARSS 2008, Boston, MA, USA, 7–11 July 2009; pp. 797–800. [Google Scholar]
- Li, W.; Fu, H.; Yu, L.; Cracknell, A. Deep learning based oil palm tree detection and counting for high-resolution remote sensing images. Remote Sens. 2016, 9, 22. [Google Scholar] [CrossRef]
- Weinstein, B.G.; Marconi, S.; Bohlman, S.; Zare, A.; White, E. Individual tree-crown detection in RGB imagery using semi-supervised deep learning neural networks. Remote Sens. 2019, 11, 1309. [Google Scholar] [CrossRef]
- Mubin, N.A.; Nadarajoo, E.; Shafri, H.Z.M.; Hamedianfar, A. Young and mature oil palm tree detection and counting using convolutional neural network deep learning method. Int. J. Remote Sens. 2019, 40, 7500–7515. [Google Scholar] [CrossRef]
- Tianyang, D.; Jian, Z.; Sibin, G.; Ying, S.; Jing, F. Single-tree detection in high-resolution remote-sensing images based on a cascade neural network. ISPRS Int. J. Geo Inf. 2018, 7, 367. [Google Scholar] [CrossRef]
- Wu, W.; Zheng, J.; Fu, H.; Li, W.; Yu, L. Cross-Regional Oil Palm Tree Detection. In Proceedings of the IEEE/CVF Conference on Computer Vision and Pattern Recognition Workshops CVPR2020, Seattle, WA, USA, 13–19 June 2020; pp. 56–57. [Google Scholar]
- Vargas-Muñoz, J.E.; Zhou, P.; Falcão, A.X.; Tuia, D. Interactive Coconut Tree Annotation Using Feature Space Projections. In Proceedings of the IEEE International Geoscience and Remote Sensing Symposium IGARSS 2019, Yokohama, Japan, 28 July–2 August 2019; pp. 5718–5721. [Google Scholar]
- WorldView-3. Available online: http://worldview3.digitalglobe.com (accessed on 22 September 2020).
- Olofsson, P.; Foody, G.M.; Herold, M.; Stehman, S.V.; Woodcock, C.E.; Wulder, M.A. Good practices for estimating area and assessing accuracy of land change. Remote Sens. Environ. 2014, 148, 42–57. [Google Scholar] [CrossRef]
- Gallego, F.J.; Kussul, N.; Skakun, S.; Kravchenko, O.; Shelestov, A.; Kussul, O. Efficiency assessment of using satellite data for crop area estimation in Ukraine. Int. J. Appl. Earth Obs. Geoinf. 2014, 29, 22–30. [Google Scholar] [CrossRef]
- Song, X.P.; Potapov, P.V.; Krylov, A.; King, L.; Di Bella, C.M.; Hudson, A.; Khan, A.; Adusei, B.; Stehman, S.; Hansen, M.C. National-scale soybean mapping and area estimation in the United States using medium resolution satellite imagery and field survey. Remote Sens. Environ. 2017, 190, 383–395. [Google Scholar] [CrossRef]


© 2020 by the authors. Licensee MDPI, Basel, Switzerland. This article is an open access article distributed under the terms and conditions of the Creative Commons Attribution (CC BY) license (http://creativecommons.org/licenses/by/4.0/).