Article

Applicability Evaluation of Multisource Satellite Precipitation Data for Hydrological Research in Arid Mountainous Areas

1
School of Geography and Tourism, Qufu Normal University, Rizhao 276826, China
2
State Key Laboratory of Desert and Oasis Ecology, Xinjiang Institute of Ecology and Geography, Chinese Academy of Sciences, Urumqi 830011, China
*
Author to whom correspondence should be addressed.
Remote Sens. 2020, 12(18), 2886; https://doi.org/10.3390/rs12182886
Submission received: 24 July 2020 / Revised: 3 September 2020 / Accepted: 3 September 2020 / Published: 6 September 2020
(This article belongs to the Special Issue Remote Sensing of Drought Recovery)

Abstract

:
Global Satellite Mapping of Precipitation (GSMaP), Climate Hazards Group InfraRed Preconception with Station data (CHIRPS), Tropical Rain Measurement Mission Multisatellite Precipitation Analysis (TRMM 3B42 V7) and Rainfall Estimation from Soil Moisture Observations (SM2RAIN) are satellite precipitation products with high applicability, but their applicability in hydrological research in arid mountainous areas is not clear. Based on precipitation and runoff data, this study evaluated the applicability of each product to hydrological research in a typical mountainous basin (the Qaraqash River basin) in an arid region by using two methods: a statistical index and a hydrological model (Soil and Water Assessment Tool, SWAT). Simulation results were evaluated by Nash efficiency coefficient (NS), relative error (PBIAS) and determination coefficient (R2). The results show that: (1) The spatial distributions of precipitation estimated by these four products in the Qaraqash River basin are significantly different, and the multi-year average annual precipitation of GSMaP is 97.11 mm, which is the closest to the weather station interpolation results. (2) On the annual and monthly scales, GSMaP has the highest correlation (R ≥ 0.82) with the observed precipitation and the smallest relative error (BIAS < 6%). On the seasonal scale, the inversion accuracy of GSMaP in spring, summer and autumn is significantly higher than other products. In winter, all four sets of products perform poorly in estimating the actual precipitation. (3) Monthly runoff simulations based on SM2RAIN and GSMaP show good fitting (R2 > 0.6). In daily runoff simulation, GSMaP has the greatest ability to reproduce runoff changes. The study provides a reference for the optimization of precipitation image data and hydrological simulation in data-scarce areas.

1. Introduction

Precipitation is a major driving source of hydrological change and plays a vital role in the global hydrological cycle [1,2,3]. However, precipitation has significant variability in both time and space, and it often exhibits a non-normal distribution. Therefore, precipitation is currently one of the most difficult atmospheric parameters to measure [4]. In watershed hydrological research, precipitation is the most vital input data for basin hydrological simulation, and its spatial and temporal distributions have significant effects on factors influencing the hydrological cycle, such as surface runoff, soil water content and surface evapotranspiration [5,6,7]. Thus, the accurate acquisition of surface precipitation information is essential for regional hydrological process simulation and prediction.
The traditional method of obtaining precipitation data is to use rain gauges to observe and obtain regional precipitation information with the help of interpolation. Although the precipitation data obtained by this method are generally regarded as accurate precipitation, due to the lack of dense and continuously distributed observation sites, it is difficult to obtain a reliable full-space precipitation dataset in some areas [8,9,10,11]. Especially in alpine mountainous watersheds with complex terrain, precipitation observation sites are usually sparsely distributed, and most are in low-altitude areas such as river valleys. In this case, the representativeness of the observation data is poor, and rainfall input data have a greater influence on the hydrological simulation results of the basin [12]. In recent years, the rapid development of satellite remote sensing technology has produced many precipitation products, which provide an opportunity to study global and regional hydrological processes. Even in mountainous areas where the terrain is complex and observation sites are scarce, a large range of precipitation data can be obtained. However, due to the influence of regional factors such as atmospheric circulation and topography, the applicability of the precipitation data obtained by different satellite inversions in different regions has obvious differences [13]. Therefore, an applicability assessment of multi-satellite precipitation data in mountainous areas is crucial to clarify the characteristics of regional precipitation changes and their impact on hydrological processes.
Satellite-based precipitation products have been widely used worldwide and there have been many evaluation studies to judge their error characteristics [14,15,16,17,18,19,20,21,22,23,24,25,26,27,28,29,30,31,32,33,34]. Among multitudinous precipitation products, TRMM is the first quasi-global precipitation observation product, and the research on it has always been an important project of hydrology research [16]. Numerous studies have shown that TRMM’s derivative product 3B42V7 can well capture the temporal and spatial characteristics of precipitation [17,18,19,20,21,22,23,24]. GSMaP is one of the main satellite precipitation products in the GPM era. Its standard product GSMaP_Gauge, which has been calibrated by the site, performs particularly well in precipitation estimation and measurement [25,26,27,28]. In addition, Shawky et al. found that the quality of GSMaP in arid environments is generally better than another major product (IMERG) [28]. CHIRPS is a satellite precipitation product with high resolution and low latency [29,30]. As a long-term precipitation product, if CHIRPS can be effectively used, it will have important reference significance for hydrology research in areas with little or lack data. Through cross-validation and analysis of more than 100 countries and regions, Peterson et al. proved that CHIRPS is a satellite precipitation product with high correlation and low error [30]. Aksu et al. evaluated the applicability of CHIRPS in the relatively arid Turkish region and believed that the estimate of CHIRPS on the monthly scale is very close to the true value [31]. In addition, when Ayehu et al., evaluated precipitation products in the Blue Nile Basin, they found that elevation changes had little impact on CHIRPS [32]. As a “natural rain gauge”, changes in soil moisture are very sensitive to rainfall feedback in arid and semi-arid regions [35]. SM2RAIN is a product that estimates precipitation based on soil moisture. At present, studies have shown that SM2RAIN can well capture the precipitation characteristics under drought conditions [33,34]. Brocca et al. also pointed out that the performance of SM2RAIN in some areas lacking precipitation data is better than IMERG and GPCC [36]. In short, GSMaP, TRMM 3B42 V7, CHIRPS and SM2RAIN, four kinds of precipitation products, have shown good applicability in other high-altitude areas and arid areas. However, there are few studies on the reliability and accuracy evaluation of satellite precipitation products in the arid area of northwest China, especially in arid mountainous areas where precipitation observation stations are scarce. Therefore, this paper takes these four groups of precipitation data as the evaluation object to provide reference for the meteorology and hydrology research of the Qaraqash River basin.
Currently, most studies evaluate the applicability of precipitation products using statistical evaluation indicators [8,37]. For example, Xu et al. evaluated the applicability of IMERG and TRMM 3B42 V7 in the Huang-Huai-Hai Plain with the help of the correlation coefficient, relative deviation, root mean square deviation (RMSD), blank prediction rate and other statistical indicators [37]. Aslami et al. evaluated the applicability of IMERG and GSMaP in Ardabil Province, Iran, based on bias, multiplicative bias, relative bias, mean absolute error, RMSD and other statistical indicators, as well as the precipitation data from meteorological stations [8]. The advantage of this statistical evaluation method is that the calculation process is simple, but the results can explain the applicability of the product only from the perspective of site scale and precipitation changes. In recent years, some scholars have begun to evaluate the applicability of precipitation products in a given area with the help of hydrological models [38,39,40]. Although the calculation of the physical model is complex, the reliability of the precipitation products can be revealed at the watershed scale using hydrological simulation. As one of the important tributaries of the Hotan River, the hydrological characteristics of the Qaraqash River are vital to the production and life of the downstream residents. Considering that most of the weather stations are located outside the watershed, it may not be possible to obtain accurate judgments just by comparing it with the weather stations. Therefore, to fully clarify the applicability of precipitation products, this study used a combination of statistical indicators and hydrological models to evaluate the applicability of four satellite precipitation datasets, derived from CHIRPS, GSMaP, TRMM 3B42 V7 and SM2RAIN, in the arid mountainous area of northwestern China. The research objective of this study was to screen out the image data that are relatively suitable for the hydrology research of the region lacking data in mountainous areas.

2. Materials and Methods

2.1. Study Area

The Qaraqash River is located south of Xinjiang (77°25′–80°34′ E, 34°52′–38°04′ N), with a total area of approximately 1.99 × 10⁴ km2. It is one of the two major sources of the Hotan River. The main source of the river, which has a total length of 808 km and a perennial average runoff of 2.135 billion cubic meters, is the Karakoram Mountains. The Uluwati (36°52′ N, 79°26′ E) hydrological station is located in the mountain pass. After the Qaraqash River exits the mountain pass, it merges with the Yulongkashi River in Kuoshtash (38°05′ N, 80°33′ E) to form the Hotan River [41]. The altitude of the basin is between 1307 and 6731 m, the terrain is rough in the south and smooth in the north and the basin slopes from north to south. The basin is adjacent to the Pamirs Plateau in the west, the Tibetan Plateau in the south, and the Taklimakan Desert in the north. The Qaraqash River basin has a typical temperate continental desert climate. The average annual temperature in the basin ranges from 11 to 15 °C, and the highest and lowest annual temperatures are 27.7 and −12 °C, respectively. The annual precipitation is under 100 mm. Notably, the annual runoff distribution of the Qaraqash River is uneven, and summer runoff accounts for 72.9% of the runoff for the year [42].

2.2. Data Sources

2.2.1. Ground Reference Data

The surface precipitation data used in this study were from the daily dataset of the China Meteorological Data Network, covering the period from January 2008 to December 2016. Hydrological data were derived from the Uluwati hydrological station and China River Sediment Bulletin. The monthly runoff data were from January 2008 to December 2016, and daily runoff data were from January to December 2008. The basic features of the dataset are shown in Table 1.

2.2.2. Satellite Precipitation Data

CHIRPS is a satellite precipitation product with high spatial and temporal resolution (1 day/0.05° × 0.05°) jointly released by the United States Geological Survey (USGS) and the Climate Hazards Group at the University of California, Santa Barbara [43]. This product is a dataset based on near-infrared satellite remote sensing data and fused with a near-real-time long time series of precipitation (https://www.chc.ucsb.edu/data/chirps/) [44]. Its area coverage is 50° N–50° S and 180° W–180° E. The time scale of the data is from 1981 to the present.
GSMaP is made by the Japan Aerospace Exploration Agency (JAXA) Centre for Earth Observation Research; it is based on four satellite microwave radiometer and infrared radiometer fusions to generate high space-time resolution (1 day/0.1° × 0.1°) satellite precipitation products (https://sharaku.eorc.jaxa.jp/GSMaP_crest/html/data.html) [45]. GSMaP is one of the most important satellite precipitation products of the new generation of GPM programs. Currently, these products are the near-real-time product GSMaP_NRT (time scale from 10 October 2008 to present), the microwave infrared fusion product GSMaP_MVK (time scale from 1 March 2000, to present) and the research-grade product GSMaP_Gauge (time scale from 2 March 2000, to present) [46]. GSMaP_Gauge reanalysis data, called GSMaP_Gauge_RNL, are also available, and their time scale is from 1 March 2000 to 28 February 2014. GSMaP_Gauge_RNL (2008–2014) and GSMaP_Gauge (2014–2016) were used in this study.
TRMM 3B42 V7 is a satellite-based precipitation fusion dataset that is generated jointly by NASA and the National Space Development Agency of Japan (https://disc.gsfc.nasa.gov/) [47]. This product first corrects the TRMM microwave imager (TMI) data, and then combines Special Sensor Microwave/Image (SSM/I), Advanced Microwave Scanning Radiometer for Earth Observing Satellite (AMSR-E) and Advanced Microwave Sounding Unit B (AMSU-B) data to estimate precipitation. It uses the infrared radiation data obtained by the geosynchronous infrared observation system for calibration. Finally, the precipitation data observed by surface meteorological stations are used to correct the data [48]. The TRMM 3B42 V7 data cover the global low and middle latitudes of 50° N–50° S, with spatial and temporal resolutions of 3 h and 0.25° × 0.25°, respectively, from 1 January 1998 to the present.
SM2RAIN-Advanced Scatterometer (ASCAT) is a global-scale precipitation product released by the European Meteorological Satellite Development Organization (EUMETSAT). This product is obtained by applying the SM2RAIN algorithm to ASCAT satellite soil moisture data (https://zenodo.org/record/3405563#.Xcq5xtszapo) [36]. Its spatial and temporal resolutions are 1 day and 0.11° × 0.11°, and its time scale is from 2007 to August 2019. The basic features of the satellite precipitation products used in this research are shown in Table 2.

2.3. Statistical Evaluation Indicators of Precipitation

Evaluation indices can comprehensively evaluate the inversion accuracy of satellite precipitation products in the Qaraqash River basin, including correlation coefficient (R), RMSD, relative bias (BIAS) and standard deviation (SD). R measures the linear correlation between satellite precipitation and station precipitation; RMSD reflects the difference between satellite precipitation and observed precipitation and quantifies the dispersion of satellite precipitation and observed precipitation; BIAS measures the average error trend in satellite precipitation relative to observed precipitation, reflecting the phenomenon of high underestimation of precipitation by products; and SD reflects the dispersion degree for the satellite data itself [49]. The calculation formulas are as follows:
R   =   i = 1 n ( G i   G ¯ ) ( S i   S ¯ ) i = 1 n ( G i   G ¯ ) 2 × i = 1 n ( S i   S ¯ ) 2   ,
RMSD   =   σ s 2 + σ g 2 2 σ s σ g R   ,
BIAS   =   i = 1 n ( S i G i ) i = 1 n G i × 100 %   ,
SD   = 1 n i = 1 n ( S i S ¯ ) 2   ,
where G i is the precipitation at the observation station; G ¯ is the average of the observed precipitation values; S i is the satellite precipitation; S ¯ is the average of the satellite precipitation values; n is the number of observation samples; σ s 2 is the variance of the satellite precipitation; and σ g 2 is the variance of the observed precipitation.
Classified statistical indicators can evaluate the ability of satellite precipitation data to detect actual precipitation events, including probability of detection (POD), false alarm ratio (FAR), and critical success index (CSI) [50]. POD represents the proportion of correctly detected precipitation events, and the optimal value is 1. FAR represents the proportion of misdetected precipitation events, and the optimal value is 0. CSI comprehensively reflects the ability of satellite precipitation data to detect actual precipitation, and the optimal value is 1. The specific calculation formulas are as follows:
POD   =   A A + C   ,
FAR   =   B A + B ,
CSI   =   A A + B + C ,
where A is the number of times that both the satellite and station have detected precipitation; B is the number of times that the satellite detects precipitation but no station precipitation; and C is the number of times that satellite has no precipitation but station measured precipitation.

2.4. Hydrological Simulation Evaluation Index

2.4.1. Soil and Water Assessment Tool

Currently, the Soil and Water Assessment Tool (SWAT) has been successfully applied to runoff simulation of many rivers in Northwest China [51,52,53]. Therefore, this study used the SWAT model to carry out runoff simulation in the Qaraqash River basin and then evaluated the applicability of the four satellite precipitation data in typical basins in arid mountainous areas in northwest China.
The model inputs are atmospheric forcing data, including daily precipitation, daily maximum temperature, daily minimum temperature and wind speed (data from China Meteorological Assimilation Datasets for the SWAT model). Considering that the time step of the model is 1 day, this study resampled the four satellite precipitation datasets to yield a format with a time resolution of 1 day and a spatial resolution of 0.25° × 0.25° and extracted the satellite precipitation pixel value to points (Figure 1). In the runoff simulation process, except for the different precipitation data used, the input parameters were kept consistent.

2.4.2. Model Evaluation Indicators

Three indexes, the Nash efficiency coefficient (NS), relative error (PBIAS) and determination coefficient (R2), were used to comprehensively evaluate the simulation results. The specific calculation formulas are as follows:
NS   =   1 i = 1 n ( Q i o b s Q i s i m ) 2 i = 1 n ( Q i o b s Q a v g o b s ) 2   ,
PBIAS   = i = 1 n ( Q i o b s Q i s i m ) i = 1 n Q i o b s   ,
R 2   =   ( i = 1 n ( Q i obs Q a v g o b s ) ( Q i s i m Q a v g s i m ) ) 2 i = 1 n ( Q i obs Q a v g o b s ) 2 i = 1 n ( Q i s i m Q a v g s i m ) 2   ,
where Q i o b s is the observed runoff; Q i sim sim is the simulated runoff; Q a v g o b s is the average of the observed runoff; and Q a v g s i m is the average of the simulated runoff.
NS reflects the fitting degree between the simulated values and observed values. The value range is −∞ ~ 1. The closer NS is to 1, the better the simulation effect is. PBIAS reflects the average tendency of the simulated values, which may be larger or small than its observed values. PBIAS < 0 indicates the simulated result is high in the entire simulation interval and PBIAS > 0 indicates that the simulated result is low [50]. R2 represents the degree of correlation between the observed values and simulated values. The closer R2 is to 1, the more consistent is the change trend between the simulated values and observed values [49].

3. Results

3.1. Comparison of the Spatial Distribution of Precipitation

3.1.1. Annual Precipitation

The region with the lowest annual precipitation is located in the northeastern part of the Qaraqash River basin according to all four of the satellite products (Figure 2). However, the spatial distributions of annual precipitation according to the various satellite products are obviously different. The spatial distribution shown by CHIRPS indicates that the greatest amount of precipitation is mainly distributed in the northwestern part of the basin; it presents a spatial pattern with more precipitation in the central region and less precipitation in the north and south. The annual according to the GSMaP products is relatively evenly distributed throughout the basin, the average annual precipitation in most regions is within the range of 80–100 mm, and the central part of the basin has slightly higher precipitation. The spatial distribution shown by TRMM 3B42 V7 is mainly characterized by more precipitation in the south and less precipitation in the north, and the areas of maximum precipitation are in the northwestern part and the southern edge. The spatial distribution according to SM2RAIN is also different from those of the other precipitation products. The maximum precipitation area according to SM2RAIN occurs in the piedmont plain at low elevation, while the minimum precipitation area is the northeastern region and the southern edge of the basin. Furthermore, the annual average precipitation of each product is significantly different (Table 3). The average annual precipitation estimated by CHIRPS is the highest (210.76 mm), while that of GSMaP is the lowest (97.11 mm), and TRMM 3B42 V7 (153.31 mm) and SM2RAIN (154.83 mm) have similar annual average precipitation.
In mountainous areas with complex terrains, elevation is an important factor affecting the distribution of precipitation [54]. In the Karakorum Mountain area, where the Qaraqash River basin is located, the change in altitude can be represented by a quadratic curve. Precipitation in mountainous areas first shows an increasing trend with increasing altitude, but, when the altitude exceeds a critical height, precipitation will decrease with increasing altitude [55]. As shown in Figure 2, the spatial distributions of the four satellite precipitation products in the Qaraqash River basin all conform to the pattern that precipitation first increases and then decreases with increasing elevation. In addition, among the four products, the average annual precipitation according to GSMaP is less than 100 mm, which is consistent with the results obtained by site interpolation (Table 3).

3.1.2. Seasonal Precipitation

Table 3 shows the seasonal distribution of station interpolation and satellite precipitation in the Qaraqash River basin. It was pointed out in the Comprehensive Survey report on hydrology and Water Resources that, in Hotan region [56], the precipitation in the Qaraqash River basin is mainly concentrated in spring and summer, and the precipitation from March to August accounts for up to 80% of the annual precipitation. This is consistent with the interpolation results, which shows that the interpolation results can reflect the actual precipitation in the basin to a certain extent. All four products show the distribution of seasonal precipitation in the Qaraqash River basin is very uneven. According to the precipitation ratio of different products in each season, Among the four products, SM2RAIN shows the highest proportion of precipitation in the spring and summer at 89.7%; the proportions of spring and summer precipitation estimated by GSMaP, CHIRPS and TRMM 3B42 V7 were 67.3%, 67.36% and 62.29%, respectively. In addition, GSMaP and SM2RAIN show that precipitation mainly occurs in summer, which is consistent with the actual situation. However, the spring precipitation proportions of CHIRPS and TRMM 3B42 V7 are relatively high, quite different from interpolation results.
The spatial precipitation distributions according to CHIRPS, GSMaP and TRMM 3B42 V7 are similar in spring, and all show that the minimum precipitation area is in the northeastern part of the basin. In contrast, the northeastern part of the basin contains the maximum precipitation area according to SM2RAIN. Besides, the spring precipitation estimated by CHIRPS is significantly higher than those of the other products (Figure 3). In summer, the maximum precipitation distribution areas of CHIRPS, TRMM 3B42 V7 and SM2RAIN are located in the southwestern, central and northern parts of the basin, respectively. The region of maximum precipitation distribution is not obvious for GSMaP. Thus, the spatial distributions of the four products are quite different in summer. In addition, SM2RAIN shows higher precipitation than the other products in summer. In autumn, the spatial distributions of each product have little in common. In winter, CHIRPS and TRMM 3B42 V7 show similar spatial distributions of precipitation, and their maximum precipitation areas are distributed in the northwestern and southern parts of the basin. The maximum precipitation area of GSMaP in winter is located in the middle of the basin, while SM2RAIN has no obvious maximum precipitation area in winter.
The above results indicate that these four precipitation products have significant differences in spatial distribution on the seasonal scale in the Qaraqash River basin. CHIRPS overestimate precipitation in the basin to a certain extent, especially in spring and winter. The precipitation distribution of GSMaP in the basin is relatively uniform, and the distribution of the maximum precipitation in each season is not obvious. In each season, the precipitation spatial distribution of TRMM 3B42 V7 is similar to that of CHIRPS, and the areas of highest precipitation are all distributed in the northwestern part of the basin. Furthermore, the spatial distribution of precipitation according to SM2RAIN in each season is quite different from those of the other three products, and the inversion value of precipitation in winter is obviously lower than those of the other three precipitation products.

3.2. Temporal Comparison of Precipitation

The meteorological stations near the river basin are located in the valley of the middle and lower reaches of the river and the measured precipitation data cannot fully reflect the precipitation situation in mountain areas. Since the Karakoram Mountains region where the Qaraqash River basin is located is controlled by the same climate system, the change in precipitation at nearby observation stations can also provide a reference for the time-varying pattern of precipitation in the Qaraqash River basin; thus, we could judge the accuracy of the distribution of each precipitation product at various times. This study compared and analyzed the average precipitation of the five weather stations (Hotan, Pishan, Tashkurgan, Shache and Yutian) near the Qaraqash River basin (2008–2016) and the pixel values of satellite precipitation relative to the stations.

3.2.1. Annual-Scale Precipitation Accuracy Assessment

GSMaP has the best correlation with the observed data (R = 0.85), followed by SM2RAIN (R = 0.81), while TRMM 3B42 V7 (R = 0.74) and CHIRPS (R = 0.72) have poor correlation with the observed data (Figure 4). As measured by the RMSD, the dispersion degree between the GSMaP values and the observed data is the smallest (RMSD = 16.68 mm), followed by those of SM2RAIN (RMSD = 20.78 mm) and TRMM 3B42 V7 (RMSE = 20.95), while the difference between the CHIRPS values and the observed precipitation is the largest (RMSE = 22.39 mm). According to the standard deviation, the discreteness of two products, CHIRPS (SD = 16.43 mm) and TRMM 3B42 V7 (SD = 21.83 mm), is lower than that of GSMaP (SD = 30.31 mm) and SM2RAIN (SD = 34.87 mm). From the perspective of relative error, all four products show some degree of overestimation (BIAS > 0), but GSMaP (BIAS = 2%) and CHIRPS (BIAS = 5%) have a relatively low degree of overestimation, while TRMM 3B42 V7 (BIAS = 19%) and SM2RAIN (BIAS = 39%) have a relatively high error. Overall, the consistency between GSMaP and the observed precipitation on an annual scale is relatively high.

3.2.2. Seasonal Precipitation Accuracy Assessment

According to Figure 5, in spring, GSMaP (R = 0.92) has the best correlation with the observed precipitation data, followed by SM2RAIN (R = 0.87); CHIRPS and TRMM 3B42 V7 perform poorly (R < 0.7). In summer, all four precipitation products show a good correlation with the observed precipitation (R > 0.7). In autumn, the correlation between GSMaP (R = 0.93) and the observed precipitation is significantly higher than those of the other three precipitation products (R < 0.7). In winter, the correlations between the four products and the observed precipitation data are not obvious (R < 0.7).
Based on the RMSD, in spring, the discreteness between GSMaP and the observed precipitation is the slowest (RMSD = 4.61 mm). In summer, the discreteness between TRMM 3B42 V7 and the observed precipitation is relatively low (RMSD = 9.08 mm), followed by that of GSMaP (RMSD = 10.21), and the discreteness between the other two precipitation products and the observed precipitation data is obvious. In autumn, the discreteness between GSMaP and the observed precipitation data is relatively low (RMSD = 3.21 mm), while the discreteness between the remaining three precipitation products and the observed precipitation is relatively high (RMSD > 6 mm). In winter, the discreteness between GSMaP and the observed data is high (RMSD = 12.05 mm), indicating an obvious difference between the two, while the differences between the other three precipitation products and the observed data are relatively low (RMSD < 7 mm).
In spring, SM2RAIN has the lowest SD (6.87 mm), followed by TRMM 3B42 V7 (SD = 8.10 mm) and CHIRPS (SD = 8.77 mm), while GSMaP has the highest SD (11.51 mm). Notably, the SD of precipitation observed at the station is 10.61 mm in spring, and, thus, the SD of GSMaP is the most similar to that of the observed precipitation in spring. In summer, except for the low SD of CHIRPS (6.78 mm), the SD of the precipitation products are relatively high (>10 mm). The SD of GSMaP in summer is 19.53, which is close to that of the observed precipitation (17.96). In autumn, the SD of all four sets of precipitation products is low (<10 mm). Although the SD of GSMaP in autumn is relatively high (7.63 mm), it is also the closest to the measured rainfall SD (8.47 mm). In winter, SM2RAIN has the lowest SD (1.28 mm), followed by CHIRPS (SD = 4.02 mm) and TRMM 3B42 V7 (SD = 7.42 mm); GSMaP has the highest SD (14.25 mm).
According to the BIAS (Table 4), in spring, the errors of SM2RAIN (BIAS = 1.01%) and GSMaP (BIAS = −3.92%) compared to the observed precipitation are relatively small, while the errors of CHIRPS and TRMM 3B42 V7 compared to the observed precipitation are relatively large (BIAS > 50%). In summer, the relative error between GSMaP and the observed precipitation is the smallest (BIAS = −8.06%), followed by those of TRMM 3B42 V7 (BIAS = −31.21%), and CHIRPS (BIAS = −54.00%), and the relative error between SM2RAIN and the observed precipitation is the largest (BIAS = 88.02%). In autumn, the relative errors between the four satellite precipitation products and the observed precipitation are all small. Among them, the relative error between GSMaP and the observed data is the smallest (BIAS = 1.25%), followed by those of SM2RAIN (BIAS = 16.56%) and TRMM 3B42 V7 (BIAS = 22.82%); the error between CHIRPS and the observed data is the largest (BIAS = −29.30%). In winter, the errors between the four products and the observed precipitation are large (BIAS > 50%). From the above analysis, it can be seen that the inversion ability of the four products is poor in winter, which may be the reflectivity of satellite radar is significantly affected by solid precipitation. In general, GSMaP performed better in all seasons, which means its estimates of actual precipitation are more accurate.

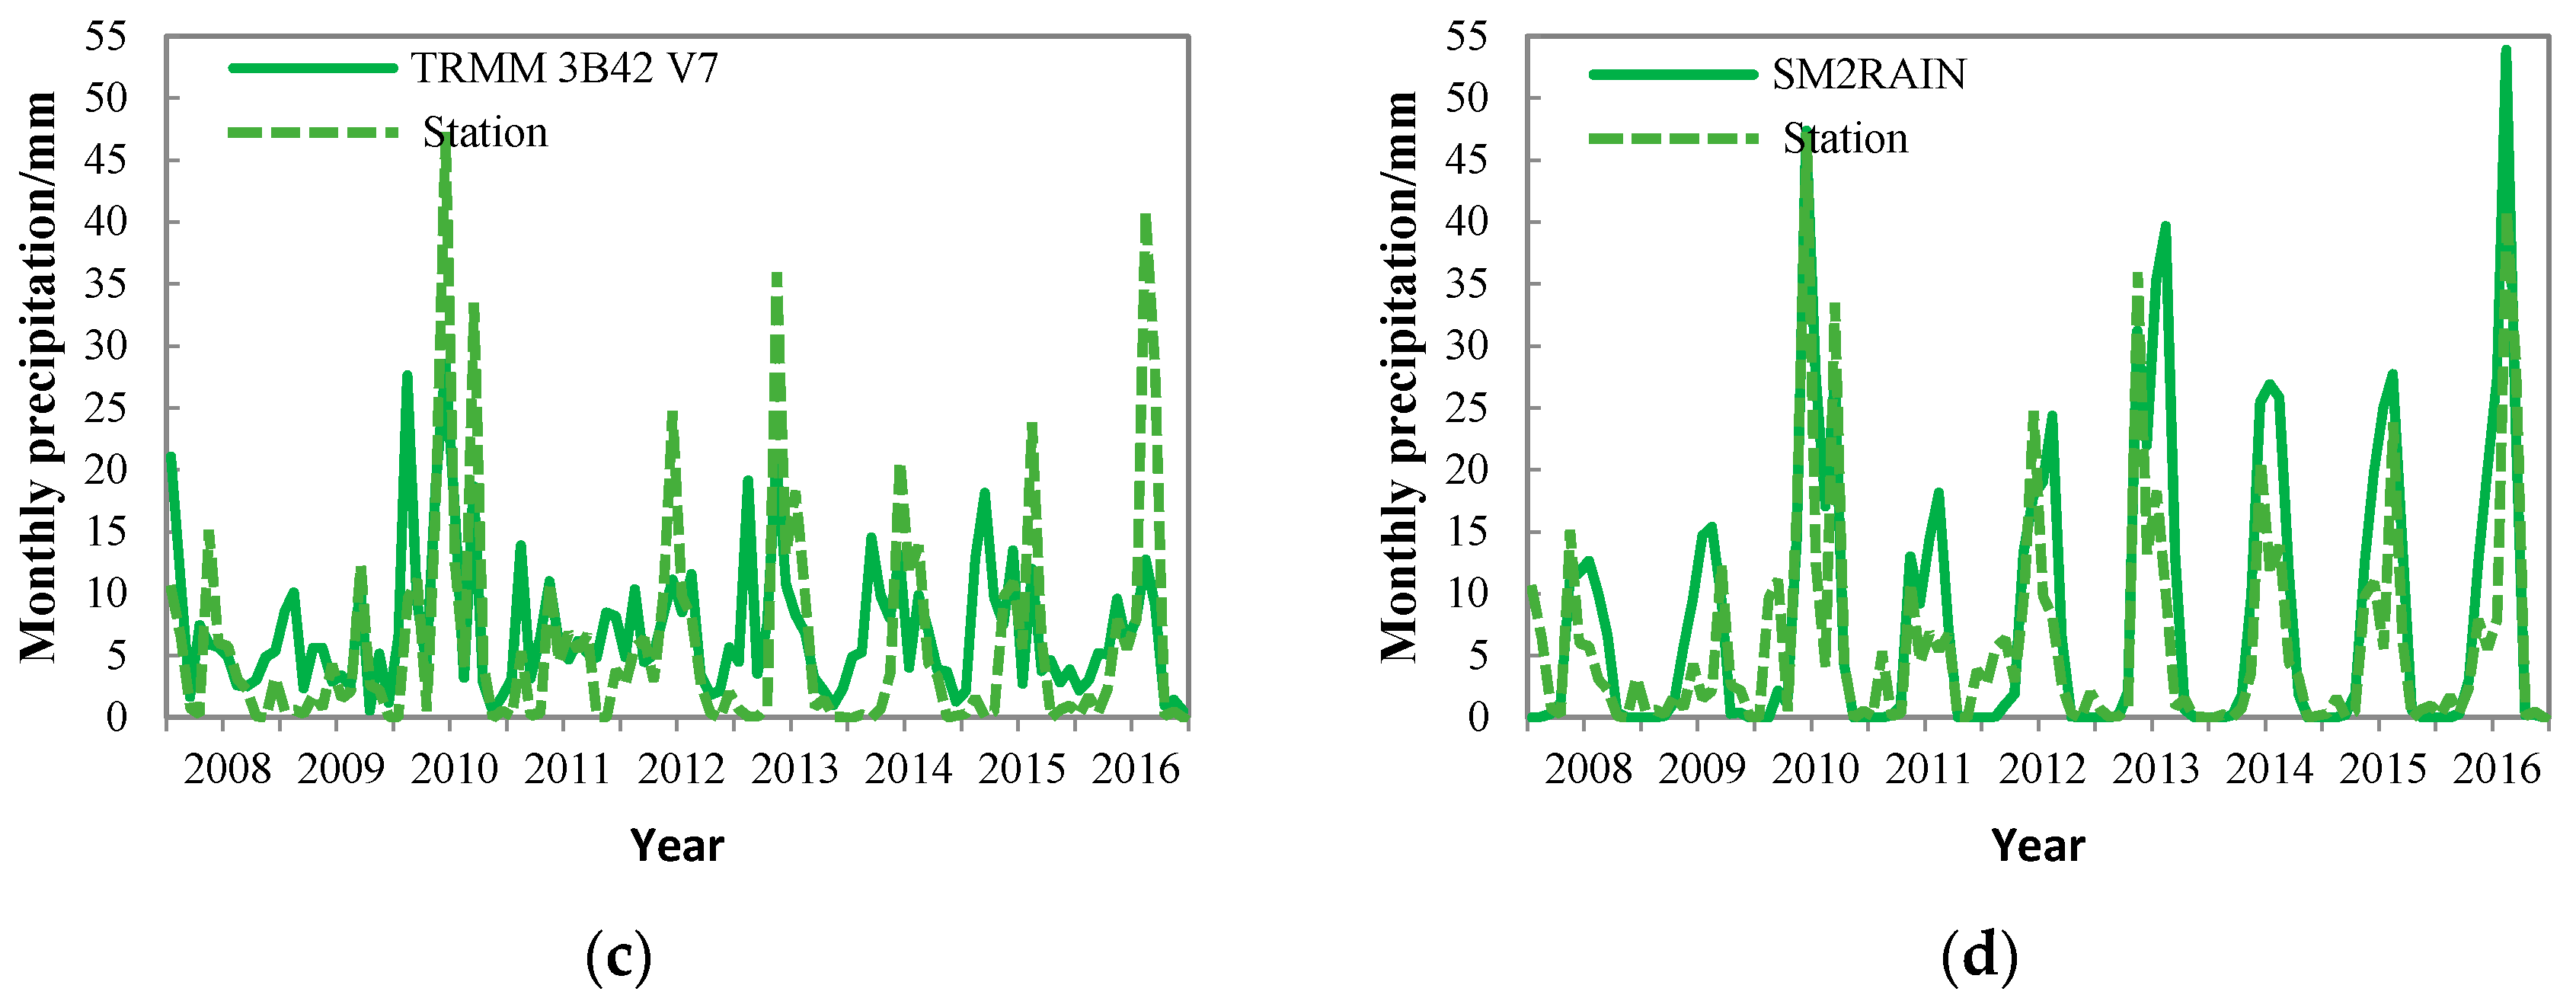
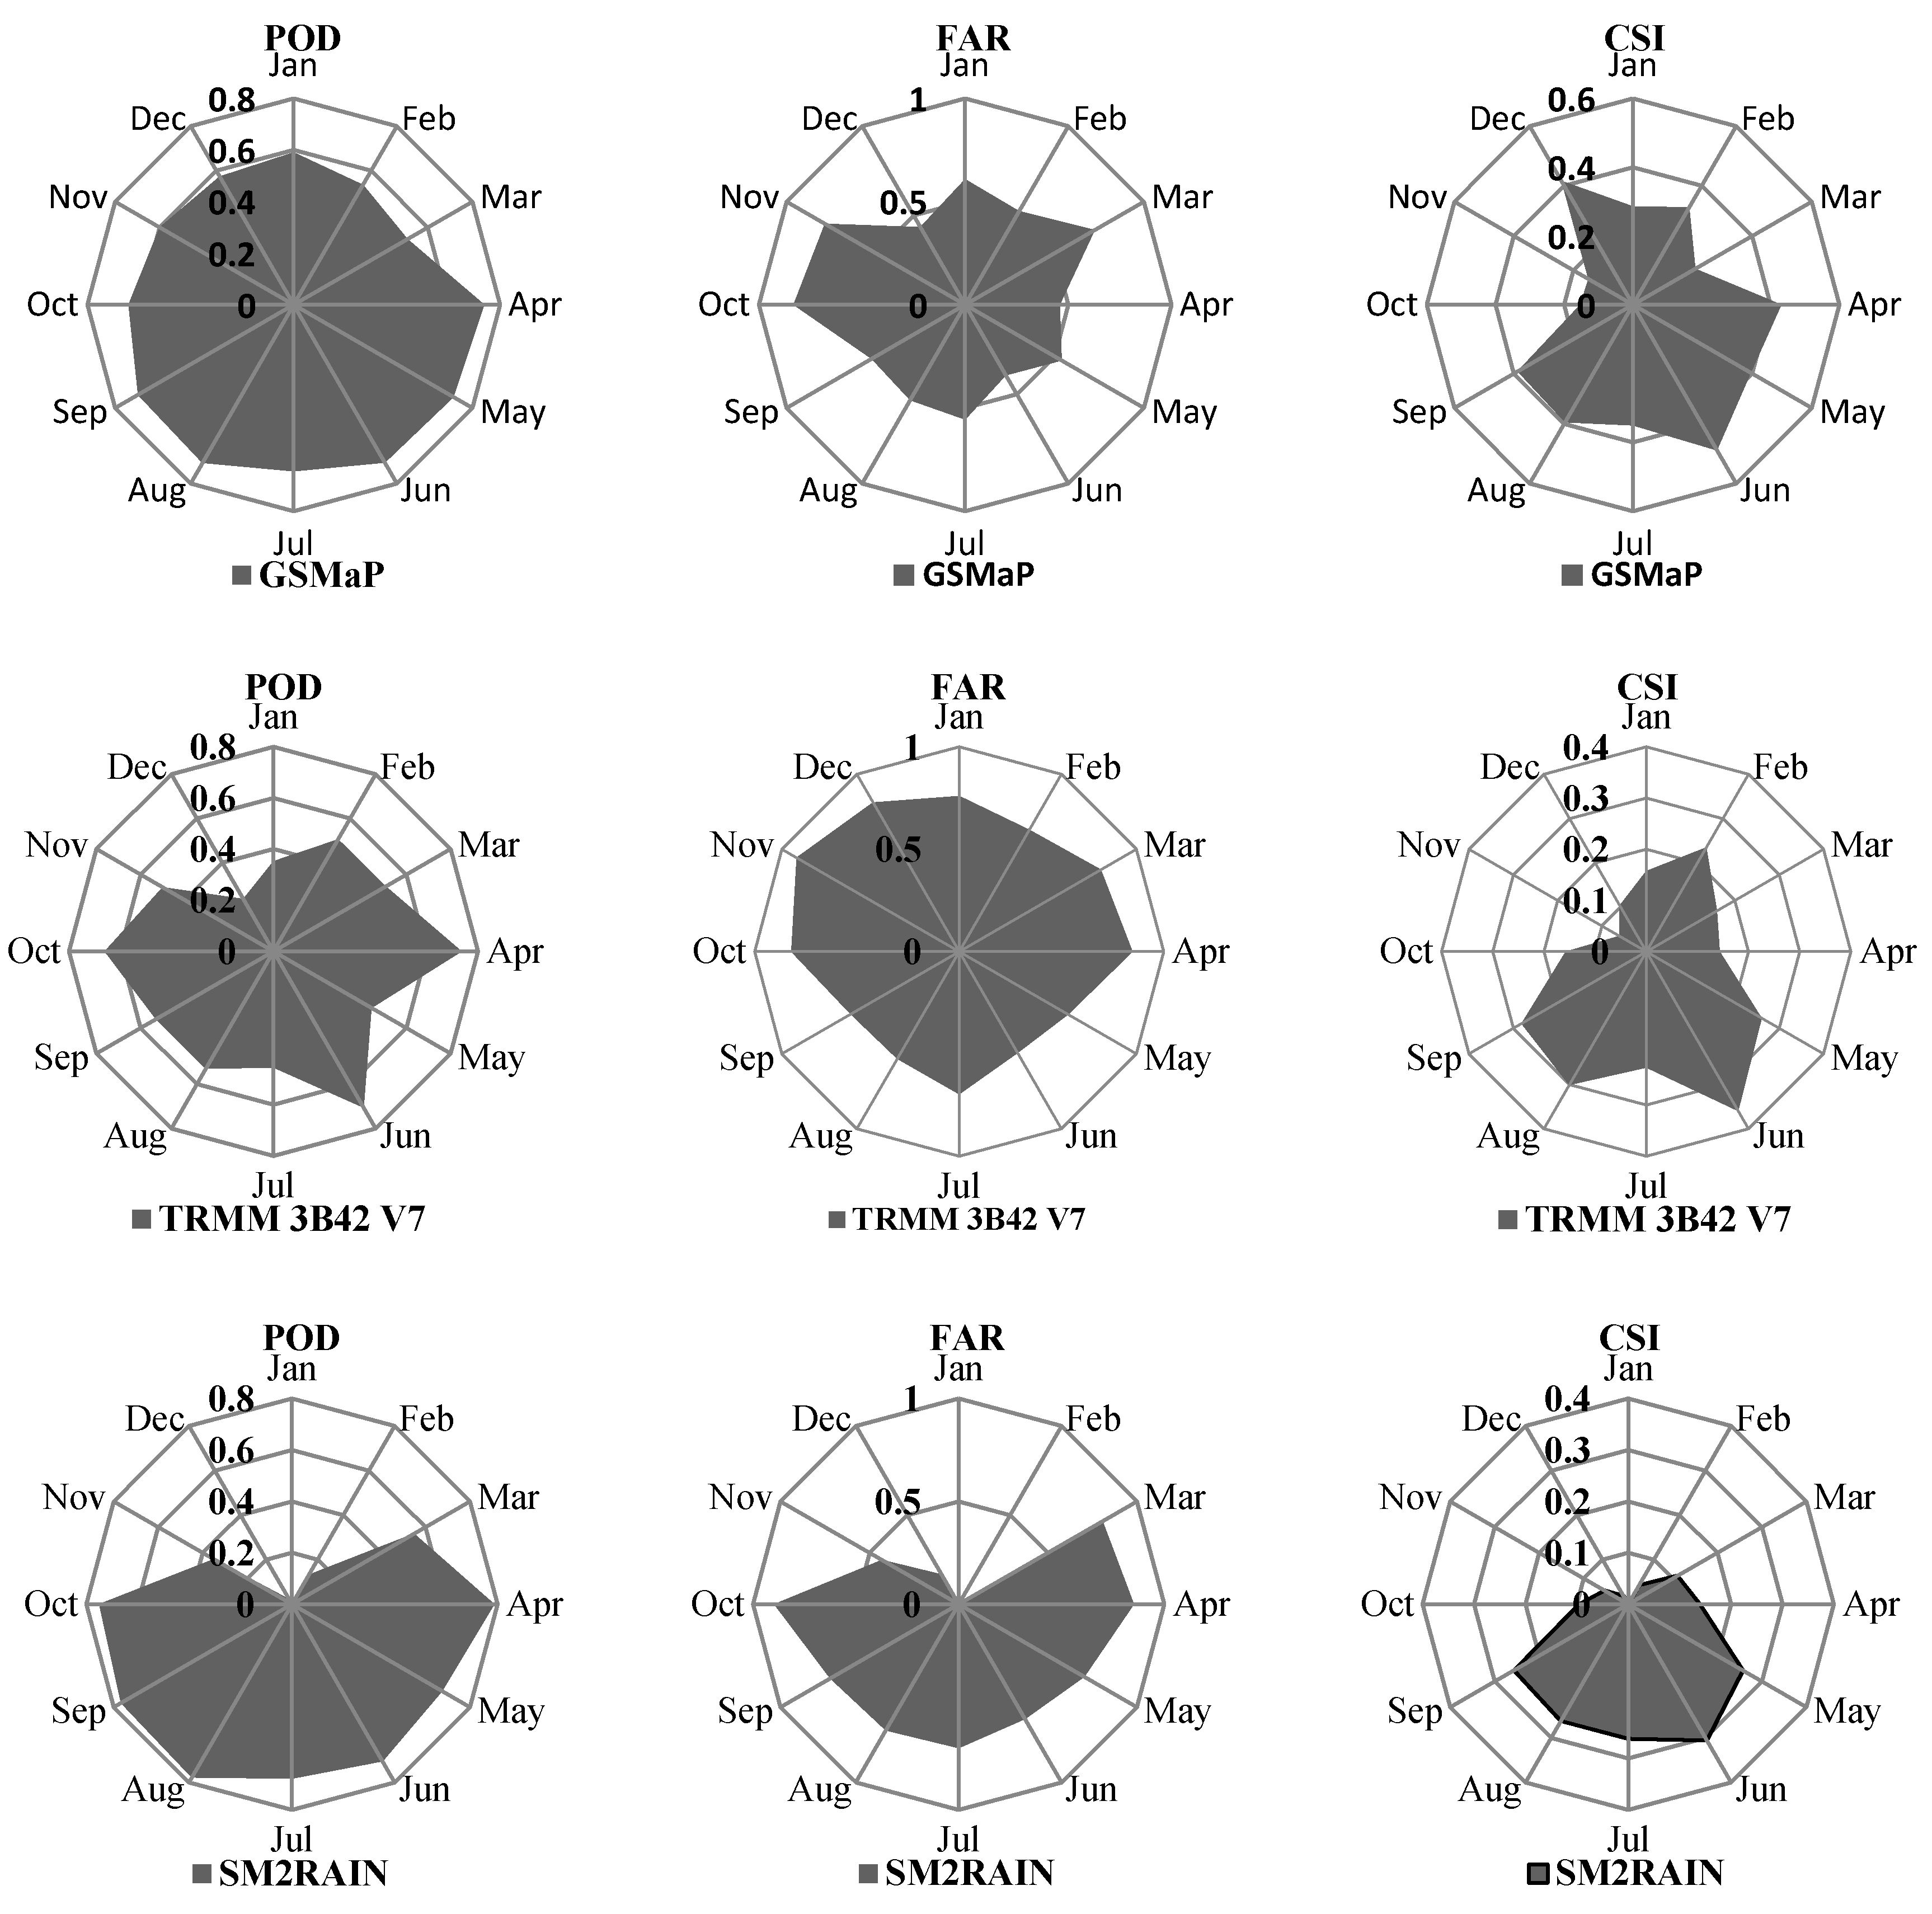
3.2.3. Monthly Scale Evaluation of Precipitation Accuracy

Annual and seasonal precipitation information can comprehensively reflect the temporal and spatial variability of precipitation in the study area. However, it is of little significance to provide reference for hydrological forecast. Therefore, this article further explores the errors of each precipitation product on the monthly scale characteristic.
On the monthly scale, the precipitation estimated by GSMaP best matches the observed precipitation, followed by those of SM2RAIN, TRMM 3B42 V7, and finally CHIRPS, which has the worst coincidence with the observed precipitation (Figure 6). According to the evaluation indicators (Table 5), GSMaP has the best correlation with the observed data (R = 0.82), and the difference between its estimated rainfall and the observed rainfall is relatively small (RMSD = 5.45 mm). The correlation between the monthly precipitation according to SM2RAIN and the site-observed precipitation also reaches more than 0.8. However, SM2RAIN significantly overestimates the actual precipitation (BIAS = 39.01%). The correlation between TRMM 3B42 V7 and the observed precipitation data is relatively poor (R = 0.63), and this product also shows a degree of overestimation (BIAS = 19.48%). Among the four satellite precipitation products, CHIRPS has the worst correlation with actual precipitation measurements, and its R is only 0.43. Overall, similar to the seasonal scale, GSMaP also performs better on the monthly scale. Besides, SM2RAIN has a good correlation with the observation data, but the deviation is relatively large. This may be due to the high sensitivity of soil moisture to precipitation in arid regions. Moreover, the soil variability near the river is large, and the precipitation data obtained by inversion is relatively high.
To accurately assess the characteristics of each precipitation data on a monthly scale, we compiled the monthly POD, FAR and CSI indices of different precipitation products (Figure 7). Considering the impact of snow cover on the inversion accuracy, the summer half-year (April to October) and winter half-year (November to March) were split for the convenience of analysis. The POD value of CHIRPS is between 0.28 and 0.78. POD values are higher in the winter half-year than that in the summer half-year. GSMaP’s POD in each month is relatively high (0.51–0.74). TRMM 3B42 V7′s POD is between 0.24 and 0.74, and its POD in the summer half-year is higher than the winter half-year. SM2RAIN’s POD is between 0 and 0.79, and in the winter half-year, it is significantly lower than the summer half-year.
CHIRPS’s FAR is between 0.45 and 0.87. Similar to POD, the FAR of CHIRPS in the winter half-year is higher than the summer half-year. GSMaP’s FAR is between 0.39 and 0.83. It is significantly lower than the other three precipitation products. TRMM 3B42 V7′s FAR is between 0.57 and 0.92, and its POD in each month is relatively large. The FAR of SM2RAIN is between 0 and 0.9, and in the summer half-year it is less than the winter half-year. CSI comprehensively reflects the capability of satellite precipitation products to detect actual precipitation events, CHIRPS’s CSI is between 0.1 and 0.32, and the detection capabilities of each month vary significantly. The CSI of GSMaP is between 0.15 and 0.49; its detection capability is significantly better than the other three precipitation products. The CSI values of TRMM 3B42 V7 and SM2RAIN are 0.06–0.36 and 0–0.31, respectively. Overall, the detection capabilities of the four sets of products in the summer half-year are significantly better winter half the year. GSMaP has the best detection ability. SM2RAIN shows certain advantages in detecting semiannual summer precipitation, CHIRPS is more efficient in detecting the winter half of the year, while the detection ability of TRMM 3B42 V7 is relatively unstable.

3.3. Evaluation of Runoff Simulation Accuracy

3.3.1. Monthly Runoff Simulation

The above research shows that each dataset has certain differences in the spatial and seasonal precipitation of the study area. Although GSMaP has shown high applicability in various analyses, considering that the observation stations selected in this paper are all located outside the basin, there is still a lot of uncertainty in the comparison of the observation station precipitation data and the Satellite precipitation. Therefore, a hydrological model was used to simulate the runoff of the Qaraqash River and compare it with the measured runoff value to further verify the rationality of the precipitation data in the basin.
The simulation results of Qaraqash River runoff based on the four satellite precipitation products can reproduce the monthly runoff changes in the basin to a certain extent (Figure 8). However, the runoff values simulated by the four precipitation products all show different degrees of underestimation (Table 6). Among them, the SWAT model driven by the GSMaP, SM2RAIN and TRMM 3B42 V7 products yields significant underestimates (PBIAS = 58–64%). Relatively speaking, the runoff value from the CHIRPS (PBIAS = 10.18%) simulation is less underestimated. Judging from the degree of fit between the simulated values and the observed values, the simulated runoff values driven by SM2RAIN (NS = 0.42) are best fitted to the actual monthly runoff values, followed by those of CHIRPS (NS = 0.29) and GSMaP (NS = 0.25), while TRMM 3B42 V7 (NS = 0.23) has the lowest degree of fit. Examining from the correlation between the simulated and observed runoff values, the correlation between the runoff simulated by SM2RAIN and the observed runoff is the highest (R2 = 0.89), followed by that of GSMaP (R2 = 0.67), while the correlations between the simulated and observed values based on CHIRPS and TRMM 3B42 are poor (R2 ≤ 0.50).

3.3.2. Daily Runoff Simulation

In the daily runoff simulation, the results of the four precipitation products show large differences (Figure 9). The runoff values simulated by GSMaP and SM2RAIN are in good agreement with the actual runoff values. However, the daily runoff values simulated by CHIRPS and TRMM 3B42 V7 are significantly different from the actual runoff, which indicates that there is a large difference between the input satellite precipitation data (CHIRPS and TRMM) and the actual precipitation. Comparing the determination coefficient, the daily runoff simulated by GSMaP has a relatively good correlation with the observed runoff (R2 = 0.47), followed by that of SM2RAIN (R2 = 0.46), while the CHIRPS (R2 = 0.25) and TRMM 3B42 V7 (R2 = 0.20) simulation results are relatively poor. Furthermore, GSMaP has the largest Nash efficiency coefficient (NS = 0.25).
The simulated runoff values of CHIRPS, GSMaP, TRMM 3B42 V7 and SM2RAIN are underestimated to different degrees on the daily and monthly scales (PBIAS > 0), which is closely related to the characteristics of the study area and the application of the model. The SWAT model used in this study does not have a glacier module, the simulated runoff is only runoff generated by precipitation. Therefore, there is a certain gap between the simulated runoff and the observed runoff data. The Qaraqash River is a typical alpine snowmelt recharge river, and the annual glacier melt water of the Qaraqash River accounts for 46.6% of the total runoff of the river; the remaining runoff mainly comes from the formation of seasonal snow and rainfall in low mountain areas [57]. Based on this ratio, we infer that the data input by CHIRPS into the model may be overestimated, while the remaining three precipitation products are closer to the actual values. Overall, GSMaP has the most feasibility for model input, and SM2RAIN is suitable for summer hydrological simulation research.

4. Discussion

Under the influence of internal factors such as sensors and algorithms, the accuracy of different satellite precipitation products is significantly different. Under the influence of external factors such as terrain, climate and rainfall intensity, the applicability of the same product in different regions is also different [58]. According to the research results of this study, the four precipitation products differ significantly in the study area. Among them, GSMaP performed best in the study area. Generally, remote sensing precipitation products have poor accuracy in mountainous areas with complex terrain. However, GSMaP-Gauge and its reanalysis products have been corrected by ground station data, which can effectively enhance their convergence in complex terrain and reduce error fluctuation [19]. Besides, GPM satellites not only have the advantage of detecting precipitation in tropical regions but also are equipped with dual-frequency precipitation radar (DPR) and GPM microwave imagery (GMI), which greatly improve the detection of solid-state and trace precipitation [59]. The Qaraqash River basin is located in the arid area of northwest China, where precipitation is scarce and mainly occurs as microprecipitation. Therefore, compared with the other precipitation products, GSMaP has obvious application advantages in the study area.
SM2RAIN is a satellite precipitation product based on soil moisture [60]. Influenced by ice and snow, the satellite sensor signal is unstable, and the accuracy of precipitation estimation is seriously reduced [61]. Therefore, SM2RAIN has a poor ability to reproduce the winter precipitation. However, in summer, the influence of snow cover on satellite sensors decreases, thus SM2RAIN has a better detection in summer. Based on the SM2RAIN algorithm, soil moisture is highly sensitive to precipitation, especially in arid areas. The soil variability near the river is larger. Under the influence of multiple factors, the inversion data of SM2RAIN precipitation is relatively high in summer. [34]. Besides, through time comparison and analysis of runoff simulation results, it can be seen that SM2RAIN still has a certain application potential in the Qaraqash River basin.
TRMM 3B42 V7 and CHIRPS performed poorly in the study area. Huffman pointed out that there is an error of ±8 to ±12% between the TRMM precipitation data and the measured monthly precipitation data, and the phenomenon of underestimation of high value and overestimation of low value is serious [47,48]. In this study, TRMM 3B42 V7 shows underestimation in summer and overestimation in winter. The difference in rainfall intensity between winter and summer may be one of the reasons for this phenomenon [62]. By various comparisons, CHIRPS performed poorly, especially in summer, but by analyzing the precipitation detection rate, CHIRPS showed a high detection rate in the winter half-year. Considering the low performance of SM2RAIN in the winter half-year and the high performance in the summer half-year, perhaps we can integrate the two products (CHIRPS and SM2RAIN) and absorb the advantages of different products to obtain a complete and reliable precipitation product with high space-time continuity and high resolution.
Before inputting satellite data into hydrological model, this study simulated runoff through meteorological station data and calibrated the parameters. Considering that the main purpose of this paper is to discuss the applicability of each precipitation dataset in the study area and select a precipitation product that is most suitable for the study area, to avoid the influence of parameters on the simulation results, the parameters used in the runoff simulation were those after calibrated.
Due to the short time scale of the evaluation in this study, and especially because the daily runoff data are available only for 2008, the evaluation of the hydrological effects of these four products is still not comprehensive, and the applicability of the four products in other periods needs further research. In addition, terrain and climate factors affect the precision of satellite precipitation products to some extent, so the introduction of climate, terrain and other factors can be considered to reduce product error.

5. Conclusions

(1) In the Qaraqash River basin, the spatial distribution of four groups of precipitation products is significantly different, and the distribution areas of high precipitation value and low precipitation value have no obvious common characteristics. In the estimation of the total precipitation, the average annual precipitation of GSMaP in the basin is less than the other three sets of data products, but it is close to the average annual precipitation obtained through the interpolation of meteorological stations.
(2) The performance of precipitation products is different on each time period. The consistency between GSMaP and the observed precipitation is generally well. The estimation accuracy of SM2RAIN in summer is significantly better than winter. CHIRPS shows a higher detection rate and high false detection rate in the winter half-year. TRMM 3B42 V7 performs better in summer than in winter. Overall, the estimation accuracy of the four precipitation products in winter is inferior to that in summer.
(3) The runoff simulation results based on the SWAT model show that the four products reflect the monthly runoff changes of the Qaraqash River to varying degrees. SM2RAIN and GSMaP have a higher consistency with the actual runoff value in the monthly runoff simulation (R2 > 0.6). At the daily-scale simulation, GSMaP has better application potential than other products (R2 = 0.47, NS > 0). Although SM2RAIN also shows a consistency with the measured runoff, the total simulation error is large.
(4) The scientific findings of this study are as follows: First, the applicability of different remote sensing image data in mountainous areas is different. Second, the image data with certain application potential in mountainous areas were determined. The contribution of this paper is to provide a scientific reference for constructing the optimal combination of multisource image data suitable for mountainous areas.

Author Contributions

B.L., designed the framework of this study, X.W., B.L., and H.G. carried out the calculation and result analysis. X.W., B.L., Y.C., H.G., Y.W., and L.L. contributed together to the writing of this manuscript. All authors have read and agreed to the published version of the manuscript.

Funding

The research was supported by the National Natural Science Foundation of China (Nos. U1903208 and 41501211).

Conflicts of Interest

The authors declare no conflict of interest.

References

  1. Blacutt, L.A.; Herdies, D.L.; de Gonçalves, L.G.G.; Vila, D.A.; Andrade, M. Precipitation comparison for the CFSR, MERRA, TRMM 3B42 and combined scheme datasets in Bolivia. Atmos. Res. 2015, 163, 117–131. [Google Scholar] [CrossRef] [Green Version]
  2. Kusangaya, S.; Toucher, M.L.W.; Van Garderen, E.A.; Jewitt, G.P.W. An evaluation of how downscaled climate data represents historical precipitation characteristics beyond the means and variances. Glob. Planet Chang. 2016, 144, 129–141. [Google Scholar] [CrossRef]
  3. Chen, H.; Yong, B.; Shen, Y.; Liu, J.; Hong, Y.; Zhang, J. Comparison analysis of six purely satellite-derived global precipitation estimates. J. Hydrol. 2020, 581, 124376. [Google Scholar] [CrossRef]
  4. Liao, R.; Zhang, D.; Shen, Y. Evaluation of the accuracy characteristics of 6 satellite precipitation products in China. Meteorology 2015, 41, 970–979. [Google Scholar]
  5. McDonnell, J.J.; Beven, K. Debates—The future of hydrological sciences: A (Common) path forward? A call to action aimed at understanding velocities, celerities and residence time distributions of the headwater hydrograph. Water Resour. Res. 2014, 50, 5342–5350. [Google Scholar] [CrossRef]
  6. Seibert, J.; Mcdonnell, J.J. On the dialog between experimentalist and modeler in catchment hydrology: Use of soft data for multicriteria model calibration. Water Resour. Res. 2002, 38, 1241–1252. [Google Scholar] [CrossRef]
  7. Tong, K.; Su, F.; Yang, D.; Hao, Z. Evaluation of satellite precipitation retrievals and their potential utilities in Hydrologic Modeling over the Tibetan Plateau. J. Hydrol. 2014, 519, 423–437. [Google Scholar] [CrossRef]
  8. Aslami, F.; Ghorbani, A.; Sobhani, B.; Esmali Ouri, A. Comprehensive comparison of daily IMERG and GSMaP satellite precipitation products in Ardabil Province, Iran. Int. J. Remote Sens. 2018, 40, 3139–3153. [Google Scholar] [CrossRef]
  9. Skaugen, T.; Andersen, J. Simulated precipitation fields with variance-consistent interpolation. Hydrol. Sci. J. 2010, 55, 676–686. [Google Scholar] [CrossRef] [Green Version]
  10. Wu, Z.; Zhang, Y.; Sun, Z.; Lin, Q.; He, H. Improvement of a combination of TMPA (or IMERG) and ground-based precipitation and application to a typical region of the East China Plain. Sci. Total Environ. 2018, 640–641, 1165–1175. [Google Scholar] [CrossRef]
  11. Katiraie-Boroujerdy, P.S.; Akbari Asanjan, A.; Hsu, K.L.; Sorooshian, S. Intercomparison of PERSIANN-CDR and TRMM-3B42V7 precipitation estimates at monthly and daily time scales. Atmos. Res. 2017, 193, 36–49. [Google Scholar] [CrossRef] [Green Version]
  12. Wu, Y.; Guo, L.; Zheng, H.; Zhang, B.; Li, M. Hydroclimate assessment of gridded precipitation products for the Tibetan Plateau. Sci. Total Environ. 2019, 660, 1555–1564. [Google Scholar] [CrossRef] [PubMed]
  13. Wu, L.; Zhai, P. Availability assessment of CMORPH and TRMM 3B42 in the analysis of warm-season hourly precipitation in the Sichuan basin and its east Sichuan basin. In Proceedings of the 28th Chinese Meteorological Society Annual Meeting, Xiamen, China, 2–4 November 2011. [Google Scholar]
  14. Tang, G.; Clark, M.P.; Papalexiou, S.M.; Ma, Z.; Hong, Y. Have satellite precipitation products improved over last two decades? A comprehensive comparison of GPM IMERG with nine satellite and reanalysis datasets. Remote Sens Environ. 2020, 240, 111697. [Google Scholar] [CrossRef]
  15. Zhang, L.; Li, X.; Cao, Y.; Nan, Z.; Wang, W.; Yingchun, G.; Penglong, W.; Yu, W. Evaluation and integration of the top-down and bottom-up satellite precipitation products over mainland China. J. Hydrol. 2019, 581, 124456. [Google Scholar] [CrossRef]
  16. Wu, L.; Xu, Y.; Wang, S. Comparison of TMPA-3B42RT legacy product and the equivalent IMERG products over mainland China. Remote Sens. 2018, 10, 1778. [Google Scholar] [CrossRef] [Green Version]
  17. Mohd Zad, S.; Zulkafli, Z.; Muharram, F. Satellite rainfall (TRMM 3B42 V7) performance assessment and adjustment over Pahang River basin, Malaysia. Remote Sens. 2018, 10, 388. [Google Scholar] [CrossRef] [Green Version]
  18. Jiang, Q.; Li, W.; Wen, J.; Qiu, C.; Sun, W.; Fang, Q.; Xu, M.; Tan, J. Accuracy evaluation of two high-resolution satellite-based rainfall products: TRMM 3B42 V7 and CMORPH in Shanghai. Water 2018, 10, 40. [Google Scholar] [CrossRef] [Green Version]
  19. Xu, R.; Tian, F.; Yang, L.; Hu, H.; Lu, H.; Hou, A. Ground validation of GPM IMERG and TRMM 3B42 V7 rainfall products over southern Tibetan Plateau based on a high-density rain gauge network. J. Geophys. Res. Atmos. 2017, 122, 910–924. [Google Scholar] [CrossRef]
  20. Jiang, S.; Ren, L.; Yong, B.; Hong, Y.; Yang, X.; Yuan, F. Evaluation of latest TMPA and CMORPH precipitation products with independent rain gauge observation networks over high-latitude and low-latitude basins in China. Chin. Geogr. Sci. 2016, 26, 439–455. [Google Scholar] [CrossRef] [Green Version]
  21. Cai, Y.; Jin, C.; Wang, A.; Guan, D.; Wu, J.; Yuan, F.; Xu, L. Comprehensive precipitation evaluation of TRMM 3B42 with dense rain gauge networks in a Mid-latitude basin, northeast, China. Theor. Appl. Climatol. 2016, 126, 659–671. [Google Scholar] [CrossRef]
  22. Gebere, S.; Alamirew, T.; Merkel, B.; Melesse, A. Performance of high resolution satellite rainfall products over data scarce parts of Eastern Ethiopia. Remote Sens. 2015, 7, 11639–11663. [Google Scholar] [CrossRef] [Green Version]
  23. Belete, M.; Deng, J.; Wang, K.; Zhou, M.; Zhu, E.; Shifaw, E.; Bayissa, Y. Evaluation of satellite rainfall products for modeling water yield over the source region of Blue Nile basin. Sci. Total Environ. 2020, 708, 134834. [Google Scholar] [CrossRef]
  24. Xue, X.; Hong, Y.; Limaye, A.S.; Gourley, J.J.; Huffman, G.J.; Khan, S.I.; Dorji, C.; Chen, S. Statistical and hydrological evaluation of TRMM-based Multi-satellite Precipitation Analysis over the Wangchu Basin of Bhutan: Are the latest satellite precipitation products 3B42V7 ready for use in ungauged basins? J. Hydrol. 2013, 499, 91–99. [Google Scholar] [CrossRef]
  25. Lu, D.; Yong, B. A preliminary assessment of the gauge-adjusted near-real-time GSMaP precipitation estimate over mainland China. Remote Sens. 2020, 12, 141. [Google Scholar] [CrossRef] [Green Version]
  26. Deng, P.; Zhang, M.; Guo, H.; Xu, C.; Bing, J.; Jia, J. Error analysis and correction of the daily GSMaP products over Hanjiang River basin of China. Atmos. Res. 2018, 214, 121–134. [Google Scholar] [CrossRef]
  27. Gao, F.; Zhang, Y.; Chen, Q.; Wang, P.; Yang, H.; Yao, Y.; Cai, W. Comparison of two long-term and high-resolution satellite precipitation datasets in Xinjiang, China. Atmos. Res. 2018, 212, 150–157. [Google Scholar] [CrossRef]
  28. Shawky, M.; Moussa, A.; Hassan, Q.; El-Sheimy, N. Performance assessment of sub-daily and daily precipitation estimates derived from GPM and GSMaP products over an arid environment. Remote Sens. 2019, 11, 2840. [Google Scholar] [CrossRef] [Green Version]
  29. Shukla, S.; Funk, C.; Peterson, P.; Mcnally, A.; Dinku, T.; Barbosa, H.; Paredestrejo, F.; Pedreros, D.; Husak, G. The Climate Hazards Group InfraRed Precipitation with Stations (CHIRPS) Dataset and Its Applications in Drought Risk Management. In Proceedings of the EGU General Assembly 2017, Vienna, Austria, 23–28 April 2017. [Google Scholar]
  30. Peterson, P.; Funk, C.; Landsfeld, M.; Husak, G.; Pedreros, D.; Verdin, J.; Rowland, J.; Shukla, S.; McNally, A.; Michaelsen, J.; et al. The Climate Hazards Group InfraRed Precipitation with Stations (CHIRPS) v2.0 Dataset: 35 Year Quasi-Global Precipitation Estimates for Drought Monitoring. In Proceedings of the American Geophysical Union’s 48th annual Fall Meeting, San Francisco, CA, USA, 14–18 December 2015. [Google Scholar]
  31. Aksu, H.; Akgül, M.A. Performance evaluation of CHIRPS satellite precipitation estimates over Turkey. Theor. Appl. Climatol. 2020, 17, 1–4. [Google Scholar]
  32. Ayehu, G.; Tadesse, T.; Awoke, B.; Dinku, T. Validation of new satellite rainfall products over the upper Blue Nile basin, Ethiopia. Atmos Meas Tech. 2018, 11, 1921–1936. [Google Scholar] [CrossRef] [Green Version]
  33. Ehtsham, M.; Waseem, M.; Ahmad, I.; Khan, N.; Chen, S. Satellite precipitation product: Applicability and accuracy evaluation in diverse region (SM2RAIN). Sci. China Technol. Sci. 2019, 63, 819–828. [Google Scholar]
  34. Satge, F.; Hussain, Y.; Molina-Carpio, J.; Pillco, R.; Laugner, C.; Akhter, G.; Bonnet, M.P. Reliability of SM2RAIN precipitation datasets in comparison to gauge observations and hydrological modelling over arid regions. Int. J. Climatol. 2020. [Google Scholar] [CrossRef]
  35. Wu, J.; Lin, B.; Shao, Y. Application of regional linear moment method to rainstorm frequency analysis in Taihu Lake basin. Hydrology 2015, 35, 15–22. [Google Scholar]
  36. Brocca, L.; Filippucci, P.; Hahn, S.; Ciabatta, L.; Massari, C.; Camici, S.; Schüller, L.; Bojkov, B.; Wagner, W. SM2RAIN–ASCAT (2007–2018): Global daily satellite rainfall data from Ascat soil moisture observations. Earth Syst. Sci. Data 2019, 11, 1583–1601. [Google Scholar] [CrossRef] [Green Version]
  37. Xu, F.; Guo, B.; Ye, B.; Ye, Q.; Chen, H.; Ju, X.; Guo, J.; Wang, Z. Systematical evaluation of GPM IMERG and TRMM 3B42 V7 precipitation products in the Huang-Huai-Hai Plain, China. Remote Sens. 2019, 11, 697. [Google Scholar] [CrossRef] [Green Version]
  38. Chiaravalloti, F.; Brocca, L.; Procopio, A.; Massari, C.; Gabriele, S. Assessment of GPM and SM2RAIN-Ascat rainfall products over complex terrain in Southern Italy. Atmos. Res. 2018, 206, 64–74. [Google Scholar] [CrossRef]
  39. Kan, B.; Su, F.; Tong, K.; Zhang, L. Applicability analysis of four precipitation data in the upper reaches of the Yeerqiang River in the Karakorum Mountains. Glacier Permafrost. 2013, 3, 710–722. [Google Scholar]
  40. Ye, T.; Duan, Z.; Disse, M.; Chiogna, G. Evaluation of Precipitation Input for SWAT Modeling in Alpine Catchment: A Case Study in the Adige River Basin (Italy). Sci. Total Environ. 2016, 573, 66–82. [Google Scholar]
  41. Liu, X. Imulation of Hydrological Effects of Climate and Land Use Change in the Upper Hotan River Based on SWAT Model. Master’s Thesis, Qufu Normal University, Rizhao, China, 11 June 2019. [Google Scholar]
  42. Zhou, X.; AbdulRahman, H. Research on the impact of climate change on the runoff of Hotan River. China Rural Water Hydropower 2017, 3, 21–25. [Google Scholar]
  43. Funk, C.; Peterson, P.; Landsfeld, M.; Pedreros, D.; Verdin, J.; Shukla, S.; Husak, G.; Rowland, J.; Harrison, L.; Hoell, A. The Climate Hazards Infrared Precipitation with Stations—A new environmental record for monitoring extremes. Sci. Data 2015, 2, 150066. [Google Scholar] [CrossRef] [Green Version]
  44. Funk, C.C.; Peterson, P.J.; Landsfeld, M.F.; Pedreros, D.H.; Verdin, A.P. A quasi-global precipitation time series for drought monitoring data series 832. US Geol. Surv. Data Ser. 2014, 832, 1–2. [Google Scholar]
  45. Setiawati, M.D.; Miura, F. Evaluation of Gsmap daily rainfall satellite data for flood monitoring: Case study—Kyushu Japan. Hydrol. Earth Syst. Sci. 2016, 4, 101. [Google Scholar] [CrossRef] [Green Version]
  46. Deng, P.; Zhang, M.; Bing, J.; Jia, J.; Zhang, D. Evaluation of the GSMaP_Gauge products using rain gauge observations and SWAT model in the upper Hanjiang River basin. Atmos. Res. 2019, 219, 153–165. [Google Scholar] [CrossRef]
  47. Huffman, G.J.; Bolvin, D.T.; Nelkin, E.J.; Wolff, D.B.; Adler, R.F.; Gu, G.; Hong, Y.; Bowman, K.P.; Stocker, E.F. The TRMM Multisatellite Precipitation Analysis (TMPA): Quasi-global, multiyear, combined-sensor precipitation estimates at fine scales. J. Hydrometeorol. 2007, 8, 38–55. [Google Scholar] [CrossRef]
  48. Huffman, G.J.; Bolvin, D.T. TRMM and Other Data Precipitation Data Set Documentation; NASA: Washington, DC, USA, 2015. [Google Scholar]
  49. Guo, H.; Chen, S.; Bao, A.; Behrangi, A.; Hong, Y.; Ndayisaba, F.; Hu, J.; Stepanian, P.M. Early assessment of integrated multi-satellite retrievals for global precipitation measurement over China. Atmos. Res. 2016, 176–177, 121–133. [Google Scholar] [CrossRef]
  50. Trejo, F.J.P.; Barbosa, H.A.; Peñaloza-Murillo, M.A.; Moreno, M.A.; Farías, A. Intercomparison of improved satellite rainfall estimation with CHIRPS gridded product and rain gauge data over Venezuela. Atmósfera 2016, 29, 323–342. [Google Scholar] [CrossRef] [Green Version]
  51. Jin, X.; Jin, Y.; Yuan, D.; Mao, X. Effects of land-use data resolution on hydrologic modelling, a case study in the upper reach of the Heihe River, Northwest China. Ecol. Model. 2019, 404, 61–68. [Google Scholar] [CrossRef]
  52. Li, Z.; Shao, Q.; Xu, Z.; Cai, X. Analysis of parameter uncertainty in semi-distributed hydrological models using bootstrap method: A case study of SWAT model applied to Yingluoxia Watershed in Northwest China. J. Hydrol. 2010, 385, 76–83. [Google Scholar] [CrossRef]
  53. Luo, Y.; Arnold, J.; Liu, S.; Wang, X.; Chen, X. Inclusion of glacier processes for distributed hydrological modeling at basin scale with application to a watershed in Tianshan Mountains, Northwest China. J. Hydrol. 2013, 477, 72–85. [Google Scholar] [CrossRef]
  54. Geng, H.; Pan, B.; Huang, B.; Cao, B.; Gao, H. The spatial distribution of precipitation and topography in the Qilian Shan Mountains, northeastern Tibetan Plateau. Geomorphology 2017, 297, 43–54. [Google Scholar] [CrossRef]
  55. Zhang, D.; Zhou, S. Quantitative analysis of the impact of the No. 1 glacier in the headwaters of the Urumqi River in the Tianshan Mountains on precipitation. Glacial Frozen Soil. 2000, 3, 243–249. [Google Scholar]
  56. Hu, S. Hotan River basin hydrological characteristics and regional water resources evaluation. Arid Area Res. 1991, 2, 59–74. [Google Scholar]
  57. Yang, Z. Glacier water resources of China. Nat. Resour. 1991, 1, 46–55. [Google Scholar]
  58. Collischonn, B.; Collischonn, W.; Tucci, C.E.M. Daily hydrological modeling in the Amazon basin using TRMM rainfall estimates. J. Hydrol. 2008, 360, 207–216. [Google Scholar] [CrossRef]
  59. Draper, D.; Newell, D.; Wentz, F.; Krimchansky, S.; Jackson, G. The Global Precipitation Measurement (GPM) Microwave Imager (GMI): Instrument overview and early on-orbit performance. IEEE J. Sel. Top. Appl. Earth Obs. Remote Sens. 2015, 8, 3452–3462. [Google Scholar] [CrossRef]
  60. Paredes-Trejo, F.; Barbosa, H.A.; Rossato Spatafora, L. Assessment of SM2RAIN-derived and state-of-the-Art satellite rainfall products over Northeastern Brazil. Remote Sens. 2018, 10, 1093. [Google Scholar] [CrossRef] [Green Version]
  61. Rahman, K.U.; Shang, S.; Shahid, M.; Wen, Y. Performance Assessment of SM2RAIN-CCI and SM2RAIN-ASCAT precipitation products over Pakistan. Remote Sens. 2019, 11, 2040. [Google Scholar] [CrossRef] [Green Version]
  62. Wolff, D.; Marks, D.; Amitai, E.; Silberstein, D.; Fisher, B.; Tokay, A.; Wang, J.; Pippitt, J. Ground validation for the Tropical Rainfall Measuring Mission (TRMM). J. Atmos. Ocean Technol. 2005, 22, 365–380. [Google Scholar] [CrossRef]
Figure 1. Schematic diagram of the Qaraqash River basin.
Remotesensing 12 02886 g001
Figure 2. Distribution of multiyear average precipitation in the Qaraqash River basin based on: (a) CHIRPS; (b) GSMaP; (c) TRMM 3B42 V7; and (d) SM2RAIN (2008–2016, unit: mm).
Remotesensing 12 02886 g002
Figure 3. Distribution of multiyear average seasonal precipitation in the Qaraqash River basin based on CHIRPS, GSMaP, TRMM 3B42 V7 and SM2RAIN (2008–2016, unit: mm).
Remotesensing 12 02886 g003
Figure 4. Taylor chart of annual precipitation data of the four products relative to precipitation measured by observation stations in the Qaraqash River basin (2008–2016).
Remotesensing 12 02886 g004
Figure 5. Taylor chart of seasonal precipitation data of the four products in the Qaraqash River basin relative to the precipitation measured at observation stations: (a) Spring; (b) Summer; (c) Autumn; and (d) Winter.
Remotesensing 12 02886 g005
Figure 6. Four sets of precipitation data compared to the monthly variations in precipitation observed by stations: (a) CHIRPS; (b) GSMaP; (c) TRMM 3B42 V7; and (d) SM2RAIN.
Remotesensing 12 02886 g006aRemotesensing 12 02886 g006b
Figure 7. POD, FAR and CSI of four precipitation products in the Qaraqash River basin.
Remotesensing 12 02886 g007aRemotesensing 12 02886 g007b
Figure 8. Comparison of simulated and observed monthly runoff at the Uluwati hydrological station (2008–2016).
Remotesensing 12 02886 g008
Figure 9. Daily variation plots of simulated and observed runoff at the Uluwati hydrological station: (a) CHIRPS; (b) GSMaP; (c) TRMM 3B42 V7; and (d) SM2RAIN (January–December 2008).
Remotesensing 12 02886 g009
Table 1. Basic features of hydrometeorological stations in the Qaraqash River basin.
Serial NumberStation NameEast Longitude/ENorth Latitude/NAltitude/mObservation Station AttributesTemperature, Precipitation/Runoff Data Period
1Hotan (HT)79.9337.131375weather station2008–2016
2Pishan (PS)78.2837.621375.4weather station2008–2016
3Tashkurgan (TS)75.2337.773090weather station2008–2016
4Shache (SC)77.2738.431231weather station2008–2016
5Yutian (YT)81.6536.851422weather station2008–2016
6Uluwati 79.4336.87 hydrological stationmonthly runoff 2008–2016
daily runoff 2008
Table 2. Basic features of satellite precipitation data.
Precipitation DataTime ResolutionSpatial ResolutionCoverage AreaTime Series Data AvailableThe Time Series Data Used
CHIRPS1 day0.05°50° N–50° S1981–now2008–2016
GSMaP1 h0.1°60° N–60° S2000–now2008–2016
TRMM 3B42 V73 h0.25°50° N–50° S1998–now2008–2016
SM2RAIN-ASCAT1 day0.11°Global (land only)2007–2019.82008–2016
Table 3. Seasonal and annual precipitation statistics of the four sets of satellite precipitation products in the Qaraqash River basin.
Precipitation ProductSpringSummerAutumnWinterAnnual Average Precipitation/mm
Precipitation/mmPercentage/%Precipitation/mmPercentage/%Precipitation/mmPercentage/%Precipitation/mmPercentage/%
Station15.7422.1236.5151.3212.5117.586.398.9871.15
CHIRPS82.0238.9259.9428.4423.0510.9445.7521.71210.76
GSMaP24.1324.8541.2242.4511.5811.9320.1720.7897.11
TRMM 3B42 V750.6633.0444.8529.2523.5415.3534.2622.35153.31
SM2RAIN12.668.18126.2281.5215.459.980.500.32154.83
Table 4. Relative error between estimated seasonal precipitation by satellite products and precipitation measured at by observation stations.
DataSpring (BIAS%)Summer (BIAS%)Autumn (BIAS%)Winter (BIAS%)
CHIRPS94.34% 54.00% 29.30%162.98%
GSMaP 3.92% 8.06%1.25%97.05%
TRMM 3B42 V754.50% 31.21%22.82%211.58%
SM2RAIN1.01%88.02%16.56% 78.61%
Table 5. Statistics on the monthly precipitation accuracy index of the four precipitation products in the Qaraqash River basin.
DataRRMSD/mmBIAS%
CHIRPS0.438.061.75%
GSMaP0.825.455.50%
TRMM 3B42 V70.636.8919.48%
SM2RAIN0.816.6739.01%
Table 6. Precision evaluation of the simulation results for the four precipitation products.
Precipitation ProductNSPBIASR2
CHIRPS0.2910.18%0.47
GSMaP0.2563.39%0.67
TRMM0.2358.76%0.50
SM2RAIN0.4263.00%0.89

