Article

Changes in Snow Cover Dynamics over the Indus Basin: Evidences from 2008 to 2018 MODIS NDSI Trends Analysis

by
Sikandar Ali
1,
Muhammad Jehanzeb Masud Cheema
2,
Muhammad Mohsin Waqas
3,
Muhammad Waseem
4,*,
Usman Khalid Awan
5 and
Tasneem Khaliq
6
1
Department of Irrigation and Drainage, Faculty of Agricultural Engineering and Technology, University of Agriculture, Faisalabad 38000, Pakistan
2
Department of Land and Water Conservation Engineering, Faculty of Agricultural Engineering and Technology, PMAS Arid Agriculture University, Rawalpindi 46000, Pakistan
3
Department of Agricultural Engineering, Khwaja Fareed University of Engineering and Information Technology, Rahim Yar Khan 64200, Pakistan
4
Faculty of Agriculture and Environmental Sciences, University of Rostock, 18059 Rostock, Germany
5
International Water Management Institute (IWMI), Lahore 53700, Pakistan
6
Department of Agronomy, Faculty of Agriculture, University of Agriculture, Faisalabad 38000, Pakistan
*
Author to whom correspondence should be addressed.
Remote Sens. 2020, 12(17), 2782; https://doi.org/10.3390/rs12172782
Submission received: 17 July 2020 / Revised: 20 August 2020 / Accepted: 24 August 2020 / Published: 27 August 2020
(This article belongs to the Section Remote Sensing Image Processing)

Abstract

:
The frozen water reserves on the Earth are not only very dynamic in their nature, but also have significant effects on hydrological response of complex and dynamic river basins. The Indus basin is one of the most complex river basins in the world and receives most of its share from the Asian Water Tower (Himalayas). In such a huge river basin with high-altitude mountains, the regular quantification of snow cover is a great challenge to researchers for the management of downstream ecosystems. In this study, Moderate Resolution Imaging Spectroradiometer (MODIS) daily (MOD09GA) and 8-day (MOD09A1) products were used for the spatiotemporal quantification of snow cover over the Indus basin and the western rivers’ catchments from 2008 to 2018. The high-resolution Landsat Enhanced Thematic Mapper Plus (ETM+) was used as a standard product with a minimum Normalized Difference Snow Index (NDSI) threshold (0.4) to delineate the snow cover for 120 scenes over the Indus basin on different days. All types of errors of commission/omission were masked out using water, sand, cloud, and forest masks at different spatiotemporal resolutions. The snow cover comparison of MODIS products with Landsat ETM+, in situ snow data and Google Earth imagery indicated that the minimum NDSI threshold of 0.34 fits well compared to the globally accepted threshold of 0.4 due to the coarser resolution of MODIS products. The intercomparison of the time series snow cover area of MODIS products indicated R2 values of 0.96, 0.95, 0.97, 0.96 and 0.98, for the Chenab, Jhelum, Indus and eastern rivers’ catchments and Indus basin, respectively. A linear least squares regression analysis of the snow cover area of the Indus basin indicated a declining trend of about 3358 and 2459 km2 per year for MOD09A1 and MOD09GA products, respectively. The results also revealed a decrease in snow cover area over all the parts of the Indus basin and its sub-catchments. Our results suggest that MODIS time series NDSI analysis is a useful technique to estimate snow cover over the mountainous areas of complex river basins.

Graphical Abstract

1. Introduction

Snow is a crucial component of the available freshwater resources in the world. It does not only hold significant hydrological importance in mid- to high-latitude mountainous areas [1], but also dominates the climate over mountainous ranges across the globe [2]. Mountains are the source of freshwater and about one sixth of the world’s population receives freshwater from mountains that hold snow as temporal water storage and may have dynamic effects on hydrology [3,4,5]. Snow plays a key role in the hydrological response of complex river basins [6] and snow cover and its contribution to runoff has been focused on by several researchers worldwide [7,8]. The Indus basin is also a complex river basin fed by the Asian Water Tower, which holds several mid- to high-latitude mountainous glaciers and has significant effects on downstream hydrometeorological conditions [9]. The agriculture-based economy of Pakistan is dependent on the waters of the Indus basin and 90% of its flow originates from mountainous ranges of the Karakoram, Hindu Kush and western Himalayas [10].
The Indus basin receives runoff from rainfall as well as snowmelt [11] from low- to high-latitude mountainous ranges which are highly susceptible to high rates of snow melting due to recent global warming [12,13]. The snowmelt in the western Himalayas (the Indus and Sutlej rivers) accounts for almost 50% of the total runoff budget, while this percentage is less than 20% in the eastern and central Himalayan catchments [14]. The report of the International Panel on Climate Change (IPCC 4AR) revealed the adverse impacts of global warming in the form of increase in ocean and air temperature, the global melting of ice and snow and a subsequent rise in the sea level [15]. Snow cover is sensitive to climate change [16,17] and influenced by different climatic parameters like temperature and precipitation [16,18]. The monitoring of frozen water reserves is very essential for the proper regulation of water distribution [19], the appraisal of climate change impacts [16,20], the management of freshwater resources and predicting subsequent runoff [21,22]. For all these reasons, the study of snow cover dynamics is of great importance and a basin-scale study will not only help researchers to estimate the snowpack reserves, but also summarize the runoff seasonality.
The remoteness of areas and extreme hydrometeorological conditions pose serious challenges in ground-based measurements of snow cover. Alternately, remote sensing could be an appropriate way to acquire spatiotemporal snow cover information [23]. The technological advancements and multiplicity of remote sensors have increased the reliability of remotely sensed data. However, a higher frequency of snow cover estimations is also needed in hydrological and regional water balance studies [24,25]. Different daily Moderate Resolution Imaging Spectroradiometer (MODIS) satellite levels are being utilized by researchers to delineate fractional and binary snow cover. The Normalized Difference Snow Index (NDSI) can be helpful to estimate snow cover [26] over large mountainous basins on daily basis. The MODIS and Landsat Enhanced Thematic Mapper Plus (ETM+)-based NDSI threshold (≥0.4) has been applied by several researchers to estimate the snow cover area worldwide [27,28,29,30,31], while global threshold of NDSI greater than 0.4 can eliminate a significant amount of snow from estimations [32], especially in coarse-resolution datasets.
Snow cover estimation from remote sensing is subjected to different types of errors due to water, dark forests, snow in forests, barren land and clouds. Water pixels may be misclassified as snow in NDSI-based snow cover mapping [33], thereby increasing the uncertainties in the estimations. Water is an absorber for Near Infrared (NIR) radiation and pixels with a reflection greater than 11% in NIR are not mapped as snow [34,35] even if they have an NDSI greater than 0.4 [34,36]. Normalized Difference Water Index (NDWI) is also a good indicator used globally to delineate water bodies [37,38,39]. Dark forest areas may also introduce errors by indicating higher NDSI values [40,41] and the error of commission, in this case, can be minimized by fixing a threshold for visible reflectance [42]. Dark forest pixels with less than 10% reflectance in the green band cannot be mapped as snow [35]. Another limitation is the differentiation of snow pixels from snow–forest areas where both the NDSI and Normalized Difference Vegetation Index (NDVI) are higher. This problem can be resolved by incorporating NDSI and NDVI at the same time to detect snow in forest areas [34,43,44]. If the NDSI is less than the threshold (0.4) and NDVI is about 0.1, then the pixel is classified as snow [36,45]. Errors due to clouds can reduce the overall accuracy of the final product [46,47] and different cloud algorithms for high, low and mid-latitude regions have been developed for cloud masking [26,48,49,50]. The cloud pixels misclassified as snow, aerosol effects and snow/sand mixing can also be rectified by introducing thermal masks [51]. The reflection in different MODIS bands can also be used to differentiate clouds from other Earth features [52] and the MODIS product (MOD021km) can also be used to detect clouds using thermal bands [53].
Several researchers have applied MODIS and Advanced Spaceborne Thermal Emission and Reflection Radiometer (ASTER)-based NDSI to estimate the snow cover changes over different parts and sub-catchments of the Indus basin [8,54,55,56]. The Quantitative spatiotemporal knowledge on snow cover dynamics is lacking for the entire Indus basin, which influences the freshwater availability downstream. Keeping in view the mentioned reasons and all the possible uncertainties in the snow cover estimations, an innovative and comprehensive approach is discussed in this study to quantify the decadal snow cover changes over the entire transboundary Indus basin. The objective of this study is to establish a new NDSI threshold for snow cover estimations using coarser resolution MODIS products. Moreover, the study also aims to ascertain the MODIS-based decadal snow cover changes over the Indus basin and its sub-catchments from 2008 to 2018. The uncertainties due to dark forests, water pixels, barren land (sand), clouds and snow–forest confusion were minimized in the MODIS products-based snow cover estimations. The Landsat ETM+, in situ snow data and Google Earth imagery were used to fine tune the MODIS NDSI value for snow cover estimations. The MODIS daily (MOD09GA) and 8-day (MOD09A1) products were further used to observe the snow cover trends using regression analysis over the Indus basin and its sub-catchments. The MODIS-based snow cover estimations, especially the daily MOD09GA product, can help researchers and water managers to estimate the glacial reserves and hydrological response of snow-dominant rivers’ basins across the globe more efficiently.

2. Material and Methods

2.1. Study Area

The current study is focused on the Indus basin and its western rivers’ catchments, covering the spatial domain of 23.6° to 37.4°N and 64.8° to 83.6°E, including Pakistan, India, China and Afghanistan, as shown in Figure 1. The study area is monsoon dominated and precipitation varies greatly over space and time for the Indus basin. All six major rivers of the Indus basin originate from snow dominant mountainous areas and flow in southwest directions. The flow of the three western rivers of the basin (the Indus, Jhelum and Chenab) are under the control of Pakistan, while the three eastern rivers (the Ravi, Sutlej and Bias) are under Indian administrative control. The ASTER Global Digital Elevation Model (GDEM) was used for the elevation mapping of the Indus basin, which ranges from sea level to 8611 m and comprises several major peaks of the world. The 13 meteorological stations of the Pakistan Meteorological Department (PMD), are also indicated for reference in situ snow data. The Indus basin receives water from both rainfall and snowmelt and flows downstream to the Arabian Sea. The Indus basin experiences higher temperatures in its lower and middle parts and very low temperatures in the upper rivers’ catchments.

2.2. Methodology

2.2.1. Processing of Landsat ETM+, MOD09GA and MOD09A1

MODIS Aqua and Terra satellites are designed to observe the Earth’s biosphere as a component of NASA’s long-term Earth Observing System. The major land features being observed by these two sensors are vegetation, water, ice and snow cover, surface albedo, temperature, emissivity, etc., almost on daily basis. MODIS has the capability to observe the whole Earth within 1–2 days with 36 spectral bands ranging from 0.4 to 14.4 µm. MODIS has spatial resolutions of 250, 500 and 1000 m in 1–2, 3–7 and 8–36 bands, respectively, with 12-bit radiometric sensitivity. The MODIS MOD09GA daily Level 2G Global data (Table 1) are used in the current study to estimate snow cover area, as they provide daily surface reflectance at a 500-m spatial resolution in the visible, NIR and Shortwave Infrared (SWIR) regions of the electromagnetic spectrum [57]. MOD09A1 is an advanced level 3G 8-day composite product, which is also used at 500 m, with the same characteristics of reflectance bands as MOD09GA. The Landsat ETM+ is a multispectral scanning radiometer which offers datasets of the Earth’s surface in visible, near, shortwave and longwave infrared with a 30-m spatial resolution (Table 1).
NDSI (Equation (1)) [58], which is the normalization ratio between green and SWIR1 bands, was applied on both MODIS products on coinciding and mostly cloud-free days to estimate snow cover. As the spectral signature of snow reveals a greater response to visible wavelengths (green band) and a very small response to SWIR1 [36], the normalization can be applied for snow cover delineation.
NDSI = Green SWIR Green + SWIR
For NDSI values ranging from −1 to +1, higher values represent snow and the MODIS algorithm fixes the NDSI values higher than 0.4 as snow [36], but this threshold can reduce the snow cover significantly [59]. The 120 scenes of finer resolution Landsat ETM+ were used to estimate the snow cover area using the globally recommended threshold (NDSI ≥ 0.4). The MODIS products were tested with different NDSI thresholds ranging from 0.3 to 0.4 to map the snow cover over low-altitude glaciers due to its coarser resolution.

2.2.2. Water and Forest Detection

Uncertainties may be involved in the analysis due to the presence of dense forests and water response relatively similar to that of snow. Therefore, it is necessary to check the other Earth features and atmospheric particles in several wavelengths to minimize the chances of errors in the analysis. In the current study, the water pixels were identified by two different approaches. In the first approach, the absorption of NIR1 radiation in water was used as an algorithm. In NIR1, the threshold value of reflection was selected as 11% and higher reflectance regions could not be considered as water. The NDWI, initially proposed by McFeeters et al. [60], was also applied for water body separation from snow cover and other Earth features using green and NIR1 bands [61].
NDWI = Green NIR Green + NIR
The NDWI ranges from −1 to +1, where values greater than 0.0 represent water bodies [62]. The blended water mask was prepared using NIR1 and NDWI threshold and a comparison was performed with Google Earth imagery.
In the case of black dense/spruce forests, the denominator in NDSI remains quite low due to the very low reflectance in SWIR1 and any small increase in the visible (green) band may increase the NDSI value to misclassify that pixel as snow. If the green band shows a reflection of <10% then the pixel is not classified as snow even if all the other criteria are justified [36]. To account for the snow cover in forests, Klein et al. [45] integrated the canopy and snow reflectance models to map pixels as snow in forests.
NDVI = NIR RED NIR + RED
For this purpose, NDVI and NDSI were used at the same time to delineate snow cover, even in dark forests. Dense green forests show a higher reflectance in the NIR1 band and lower reflectance in the red band, which ultimately assigns higher NDVI values to dense green areas, while, if there is snow, then the reflectance in NIR1 decreases and thereby causes a decrease in NDVI values. Thus, a pixel can be considered as snow even if its NDVI value ≈ 0.1 and its NDSI is <0.4 [63].

2.2.3. Clouds Detection and Snow/Sand Confusion in MODIS Products

The MOD021km was used along with MOD09GA and MOD09A1 to detect clouds in reflectance and thermal bands due to its advantage of a wide range of 36 spectral bands (visible, infrared and thermal bands). MOD021km contains reflectance and radiance at a spatial resolution of 1000 m for both reflective and emissive bands in Wm−2 µm−1 sr−1. The spectral signature/contrast analysis of clouds and other Earth features in different bands can be helpful to differentiate clouds from all other Earth features [64]. For cloud detection, a combination of two reflectance bands (blue and SWIR1) for MODIS products were used in this study. A reflectance value greater than 0.2 in the SWIR1 band is suitable to detect clouds [65] and a range of 0.2–0.3 can also be suitable for this purpose [66]. A minimum threshold value of 0.07 was tested for reflectance in the SWIR2 band to detect clouds and soil, but an error was involved due to the slightly higher reflection of sandy soil. The maximum and minimum reflectance used in the blue band were 0.3 and 0.37 to detect barren (sandy) soil and clouds, respectively, for MOD09GA and MOD09A1 products.
The MOD021km was geo-registered in the ENVI for ArcGIS software package for the conversion of data into reflectance, and atmospheric corrections were applied using the Fast Line-of-Sight Atmospheric Analysis of Spectral Hypercube (FLASH) method [67]. Cloud detection using MOD021km has been applied by different researchers over mountainous regions across the world [68,69]. MOD021km provides reflectance bands from 1 to 19 and 26 (NIR2) and thermal bands range from 20 to 36, excluding band 26. The MOD021km reflectance in SWIR2 and NIR2 bands at a 1000-m resolution were used as another algorithm to resolve snow/sand confusion and cloud detection, respectively. The minimum reflectance thresholds of 0.07 and 0.1 were used for SWIR2 and NIR2 bands to detect sandy soil and clouds, respectively.
Another approach used to detect clouds is based on the thermal bands of MOD021km, as cloud detection has been performed by different researchers using thermal bands [70,71]. The radiance of all 16 emissive bands was converted to brightness temperature using the following equation:
L = 2 h c 2 λ 5 ( e h c / K λ T 1 )
where L is the radiance in Wm−2 µm−1 sr−1, h is Plank’s constant (6.626 × 10⁻³⁴ Js), c is the speed of light (3 × 10⁸ m/s), k is the Boltzmann gas constant (1.381 × 10⁻²³ J/K), λ is the central wavelength of the band (µm) and T is the brightness temperature in Kelvin (K). As the temperature of the cloud is less than the other Earth’s features (the base of the algorithm), each thermal band was assigned a maximum brightness temperature threshold to detect clouds. Finally, a blended cloud mask was prepared using the MODIS blue, NIR2, SWIR1, SWIR2 and thermal bands.

2.2.4. Snow Cover Mapping

The snow cover area of Landsat ETM+, in situ snow data and Google Earth imagery were used as reference data for MODIS products. Initially, Google Earth was based on Landsat data with the Shuttle Radar Topographic Mission digital elevation model [72]. Google Earth uses Landsat data, Orthophotos by the State Government, high-resolution datasets available from DigitalGlobeThematic Mapper (TM), GeoEyeTM, WorldviewTM (1 and 2), SPOTTM, FORMOSAT-2, KOMPSAT-2, Pleiades and IKONOS [73]. Google Earth high-resolution reference data were used for water and snow indices by Yan et al. [74] in the Tibetan Plateau. The rock glaciers were mapped using Google Earth imagery by Schmid et al. [75] over the Hindu Kush Himalayan region. The weekly snow data of 13 stations of PMD were taken as training sites which lie in the snow-covered regions of Pakistan. The Landsat ETM+ data were used as standard data to delineate the snow cover area of 120 cloud-free scenes for different time periods and different regions over the Indus basin from 2008 to 2018. The Landsat ETM+-based water and forest areas were delineated and removed from the snow cover area estimated by the Landsat ETM+-based NDSI (≥0.4). In situ snow data and Google Earth images were used to cross check the snow cover delineation by Landsat ETM+.
All of the possible uncertainties, like water, forests and clouds, were removed and snow–sand confusion was also resolved in the snow cover estimated by MODIS MOD09GA and MOD09A1 products. The NDSI threshold fixation of a coarser resolution product like MODIS is of significant importance for the snow cover lying over low- to mid-altitude glaciers. For this purpose, the NDSI values (0.3 to 0.4) below the globally accepted threshold (0.4) were tested to estimate the snow cover area using MODIS MOD09GA and MOD09A1 products for 120 scenes (coinciding with 120 Landsat ETM+ snow cover scenes). The output of MOD09GA and MOD09A1 was compared with the Landsat ETM+, in situ snow data and Google Earth imagery for accuracy assessments. These comparisons were also made to establish a new NDSI threshold for snow cover estimations using coarser resolution MODIS products. The Google Earth imagery along with the in situ data of 13 PMD stations were also used to ascertain the snow cover, estimated by MODIS MOD09GA and MOD09A1 products, over the low- to mid-altitude mountains of the Indus basin.
The MODIS-based snow cover analysis from 2008 to 2018 was performed mostly for cloud-free days. However, snow cover analysis for a few cloudy days was necessary due to the continuous cloud cover during the whole month. The MODIS cloud masks were developed using multiple algorithms and a blended cloud mask was prepared by combining all the cloud masks for an individual day over the Indus basin. The blended cloud mask was then removed from the NDSI-based snow cover area in order to minimize the overestimation of the snow cover area due to the mixing of clouds in the snow, but this removal also removed some of the snow cover areas. During the processing of MODIS cloud-free days, snow cover was monitored, using Google Earth imagery and in situ snow data, and minimum ASTER GDEM-based elevations were recorded against the presence or absence of snow in all parts of the Indus basin. Afterwards, the snow cover was declared above those minimum elevation thresholds under cloudy regions for the respective month of the same year.
The time series intercomparison of snow cover area of MODIS daily (MOD09GA and 8-day (MOD09A1) products was carried out using R2 and Nash and Sutcliffe Efficiency (NSE) for the Indus basin and its sub-catchments from 2008 to 2018. The NSE indicates how well the plot of observed versus simulated data fits the 1:1 line. In this study, NSE was used to compare the snow cover area of both the MODIS products with the Landsat ETM+ based snow cover estimations for 120 selected scenes over the Indus basin. NSE was also used for the intercomparison of snow cover areas of both MOD09GA and MOD09A1 products in order to check the closeness of their estimations. A least squares regression analysis was performed with a 95% confidence interval using both the MODIS products for a time series snow cover trend analysis for the Indus basin and its sub-catchments.

3. Results

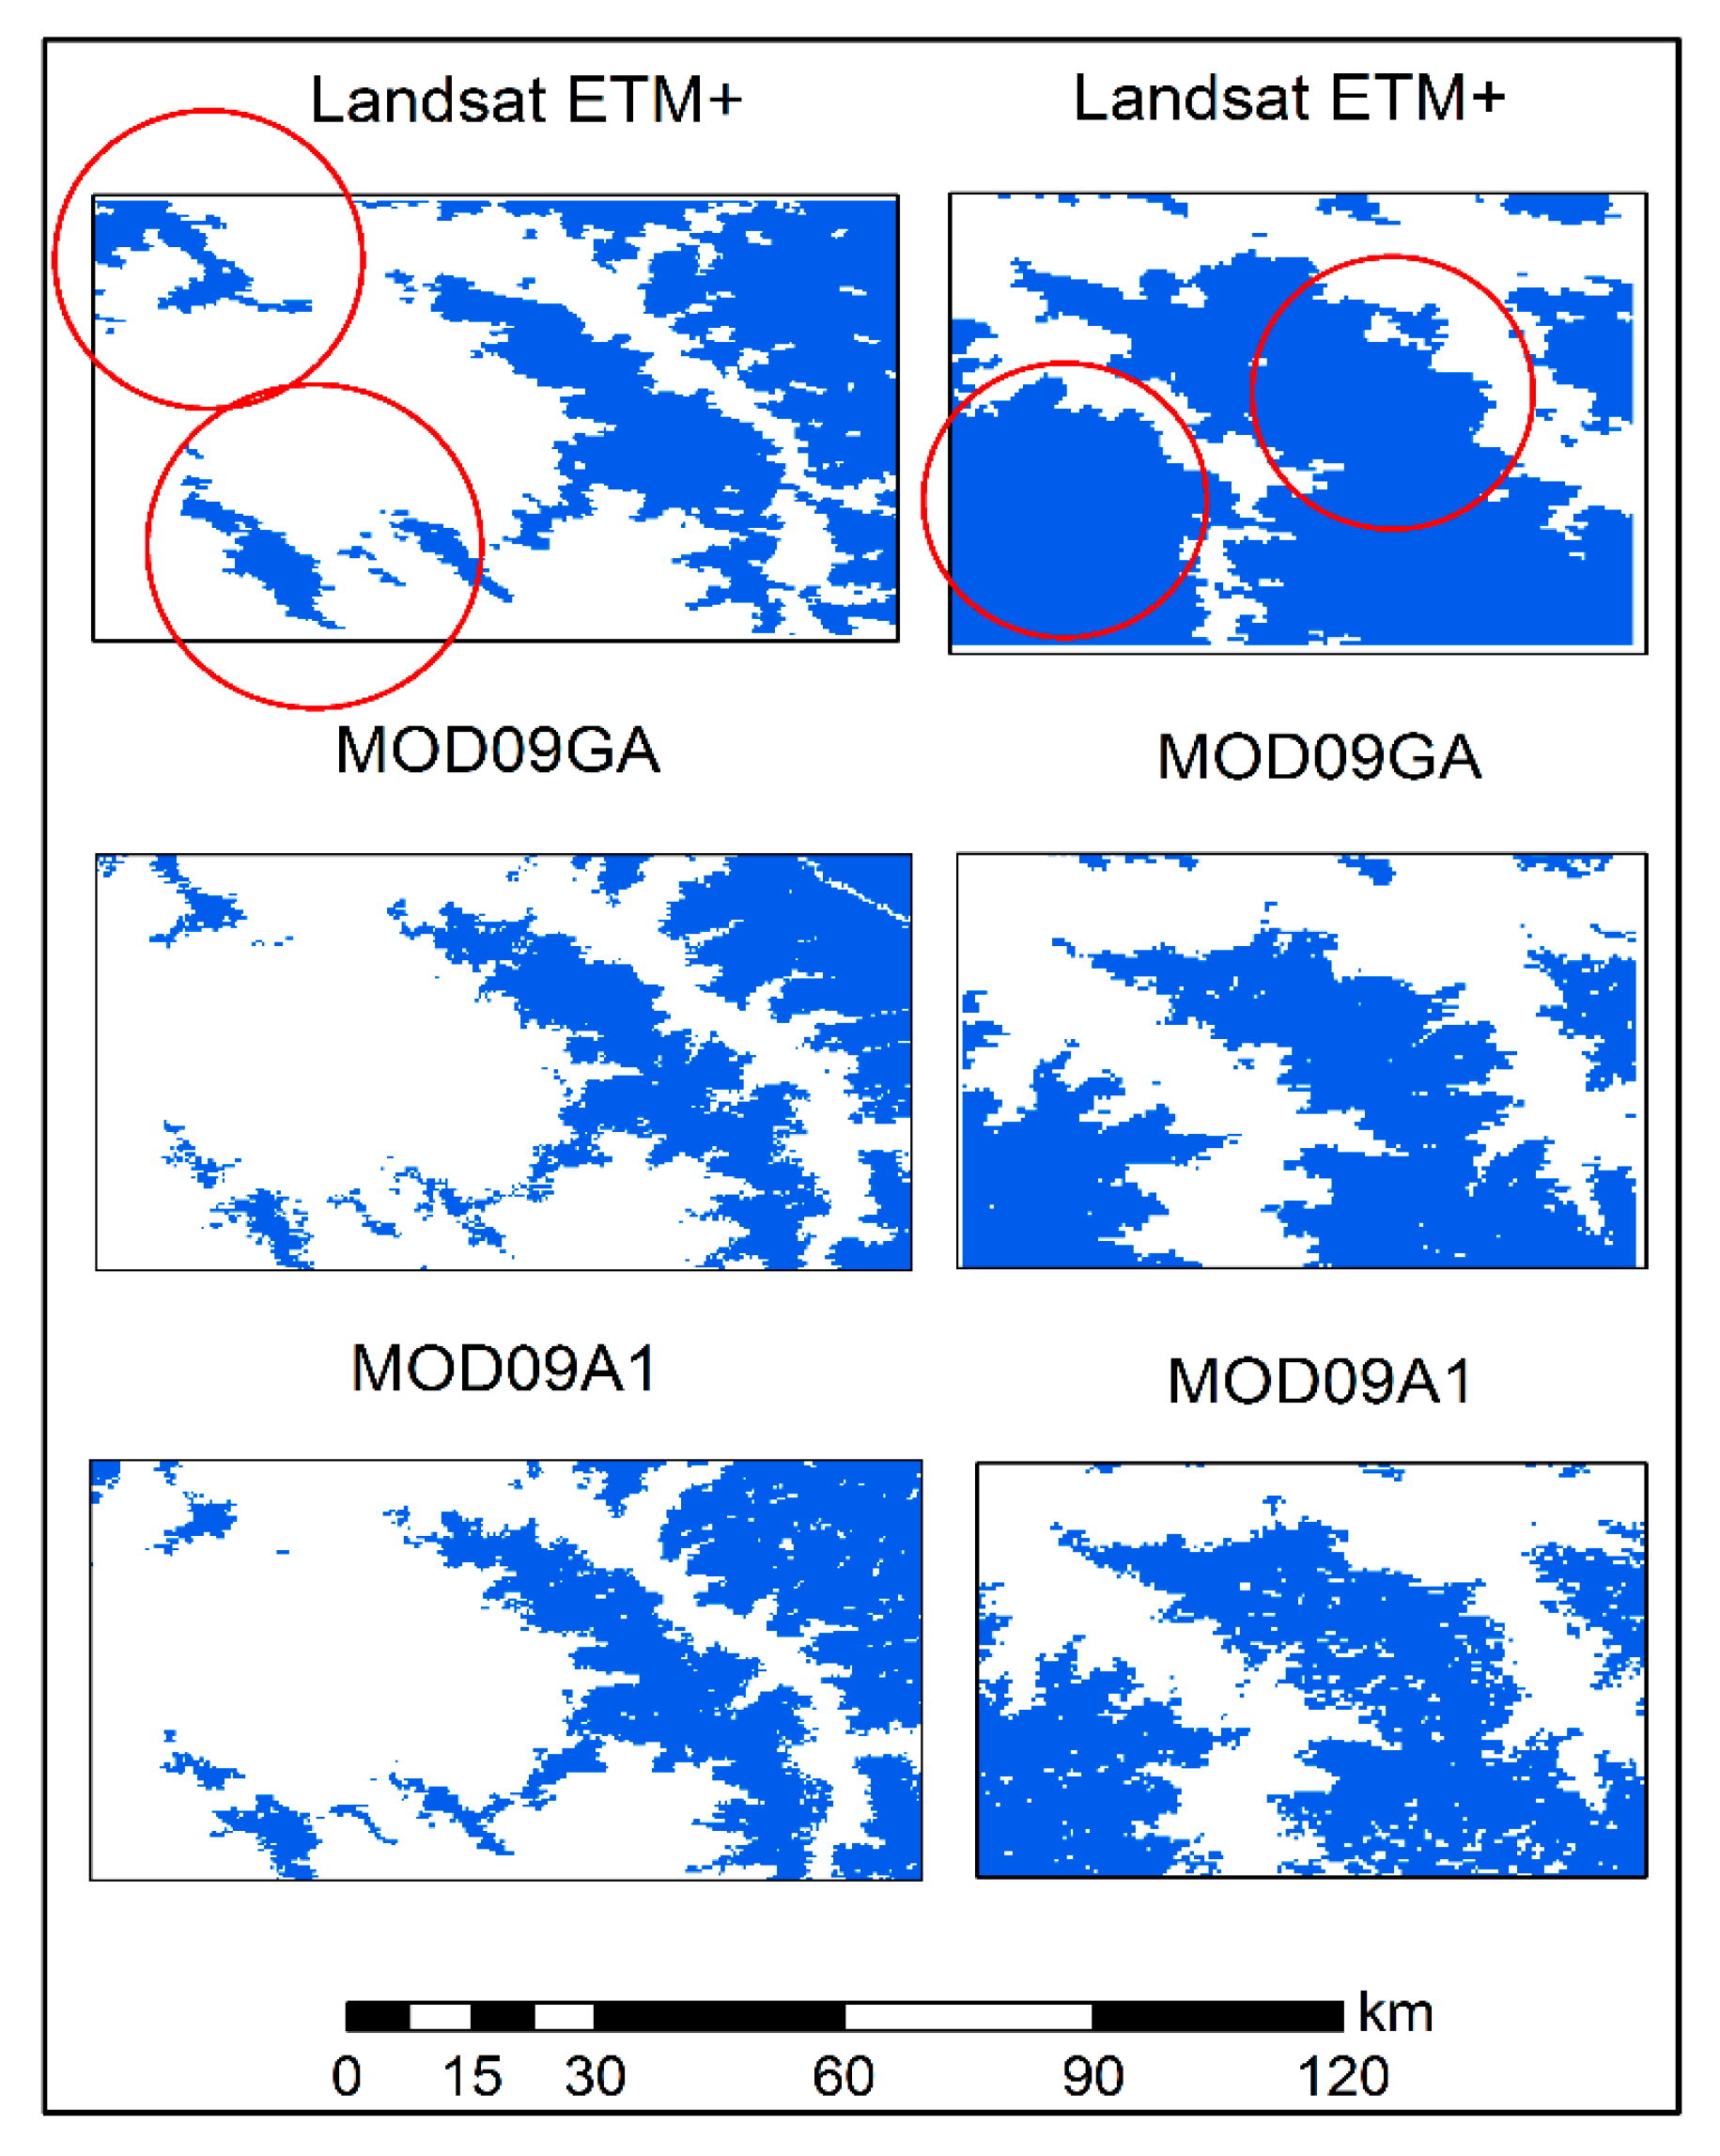
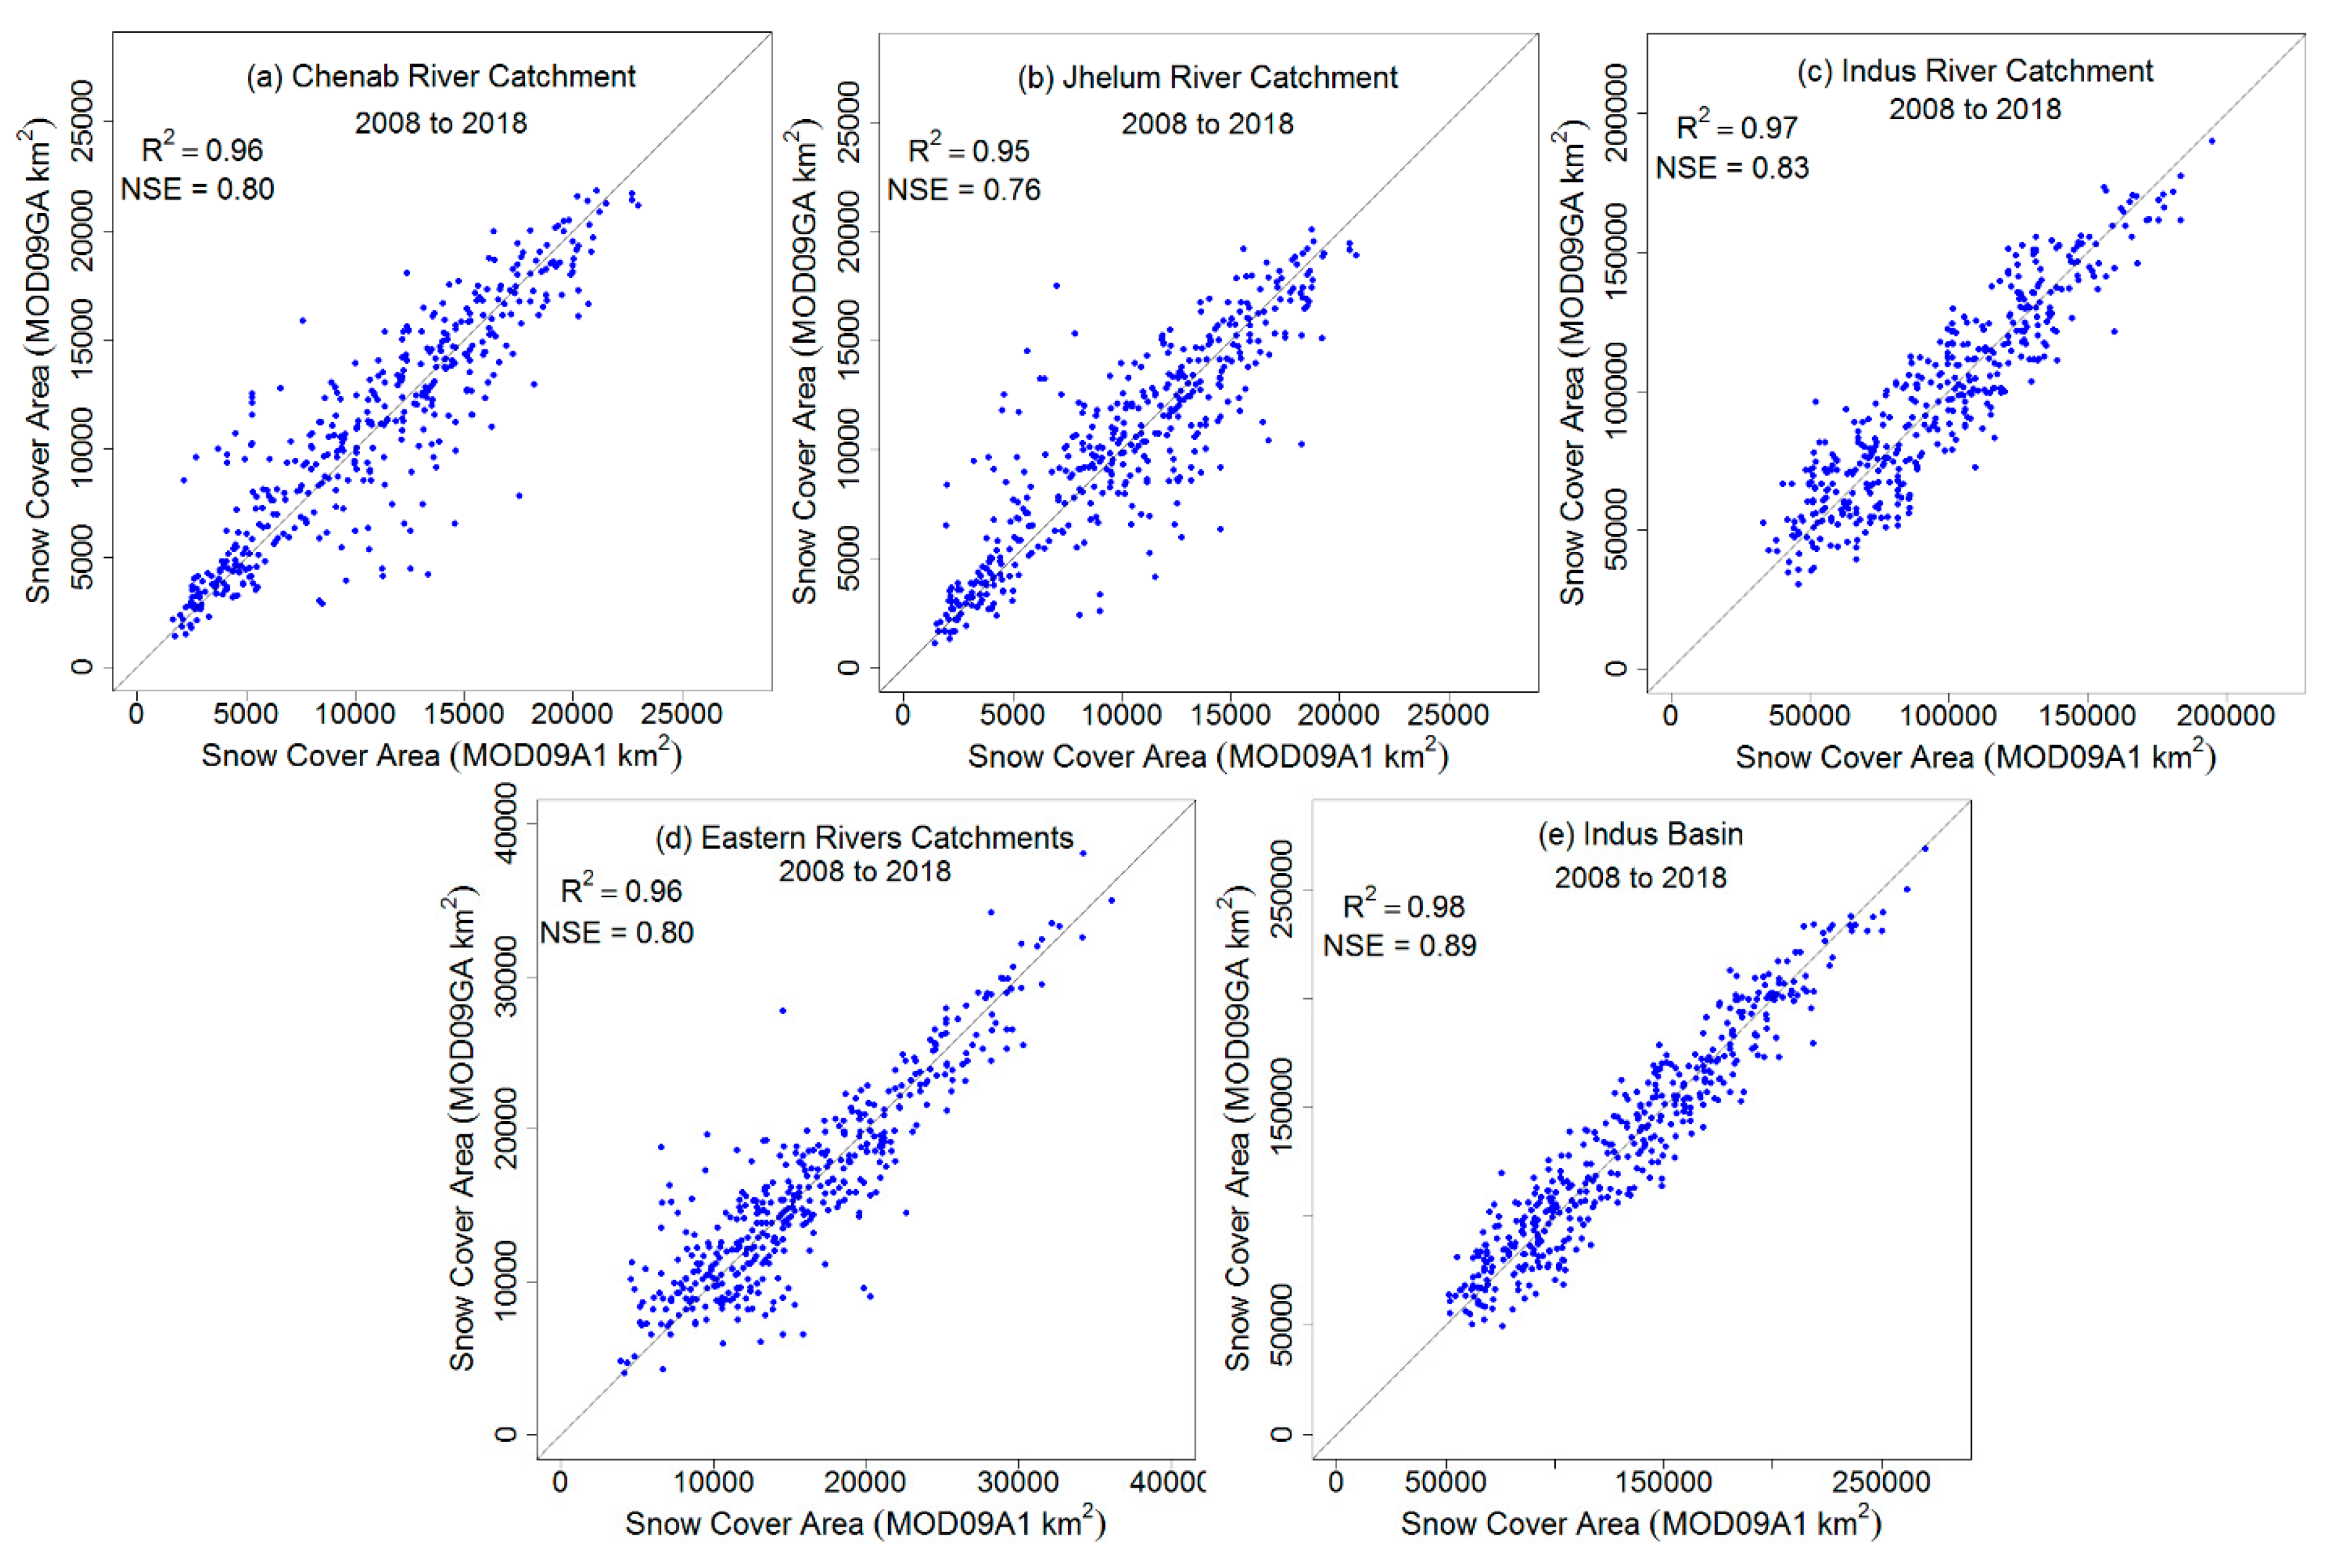
3.1. Uncertainty Analysis in Snow Cover Estimates

The water, forest and cloud masks are presented in Figure 2a–d. A comparison of the blended water mask with Google Earth imagery is presented in Figure 2a,b. The MODIS and Google Earth-based Tarbela and Mangla dams of Pakistan are presented for comparison. The comparison indicates that the overall pattern of both the lakes is good, while there are some disturbances on the borders of lakes, owing to the coarser resolution of the MODIS products. The forest and vegetation mask is presented in Figure 2c, indicating forests mainly in the mid to high altitudes, and wheat crop mainly in the plain areas of India and Pakistan. One of the main challenges was to differentiate the snow from snow–forest area. The NDVI (≈0.1) and NDSI (<0.4) were used in this study to represent snow which was added to the NDSI analysis, and the remaining forest pixels were added to the forest and vegetation mask. The cloud mask is presented in Figure 2d for a specific day, indicating most of the clouds over the Indus river catchment.
The details of snow–sand confusion and the cloud detection algorithm, using reflection and thermal bands, are presented in Table 2. Clouds and barren soil (sand) were effectively detected over the Indus basin using the reflection bands of MOD09GA, MOD09A1 and MOD021km. The clouds’ brightness temperature helps us to differentiate the clouds from other features of the Earth. The thermal bands of MOD021km, from 20 to 36 (except 26), were used in the analysis to detect clouds over different wavelengths of the electromagnetic spectrum. The mean brightness temperature of clouds indicates that the brightness temperature increases from lower wavelengths to higher wavelengths. The new thermal thresholds of clouds’ brightness temperatures were established, as provided in Table 2, indicating a non-linear trend, with maximum (258 K) and minimum (225 K) values for thermal bands 20 and 36, respectively. The clouds’ brightness temperature was tested for different time periods over the Indus basin to fix one value for each thermal band. All the thermal masks were applied, especially the higher wavelength bands, due to the very low clouds’ brightness temperatures, to make a final blended cloud mask using thermal and reflection bands. The removal of the cloud mask from the NDSI-based snow cover estimation introduced a significant amount of uncertainty into the analysis due to the underestimation by removing the snow, while the snow cover analysis without cloud removal caused an overestimation of snow due to the misclassification of clouds as snow pixels. Most of the rivers’ catchments of the Indus basin are snow dominant and observe both precipitation and anvil clouds. This was the main reason why we used ASTER GDEM-based elevation information, the clouds were considered as snow above the minimum elevation for the presence of snow, fixed for the respective area during the analysis of cloud-free days of the same month. The elevation data of 13 in situ PMD stations were also used in combination with ASTER GDEM-based snow elevation thresholds to decide the snow or snow-free zone below the clouds.

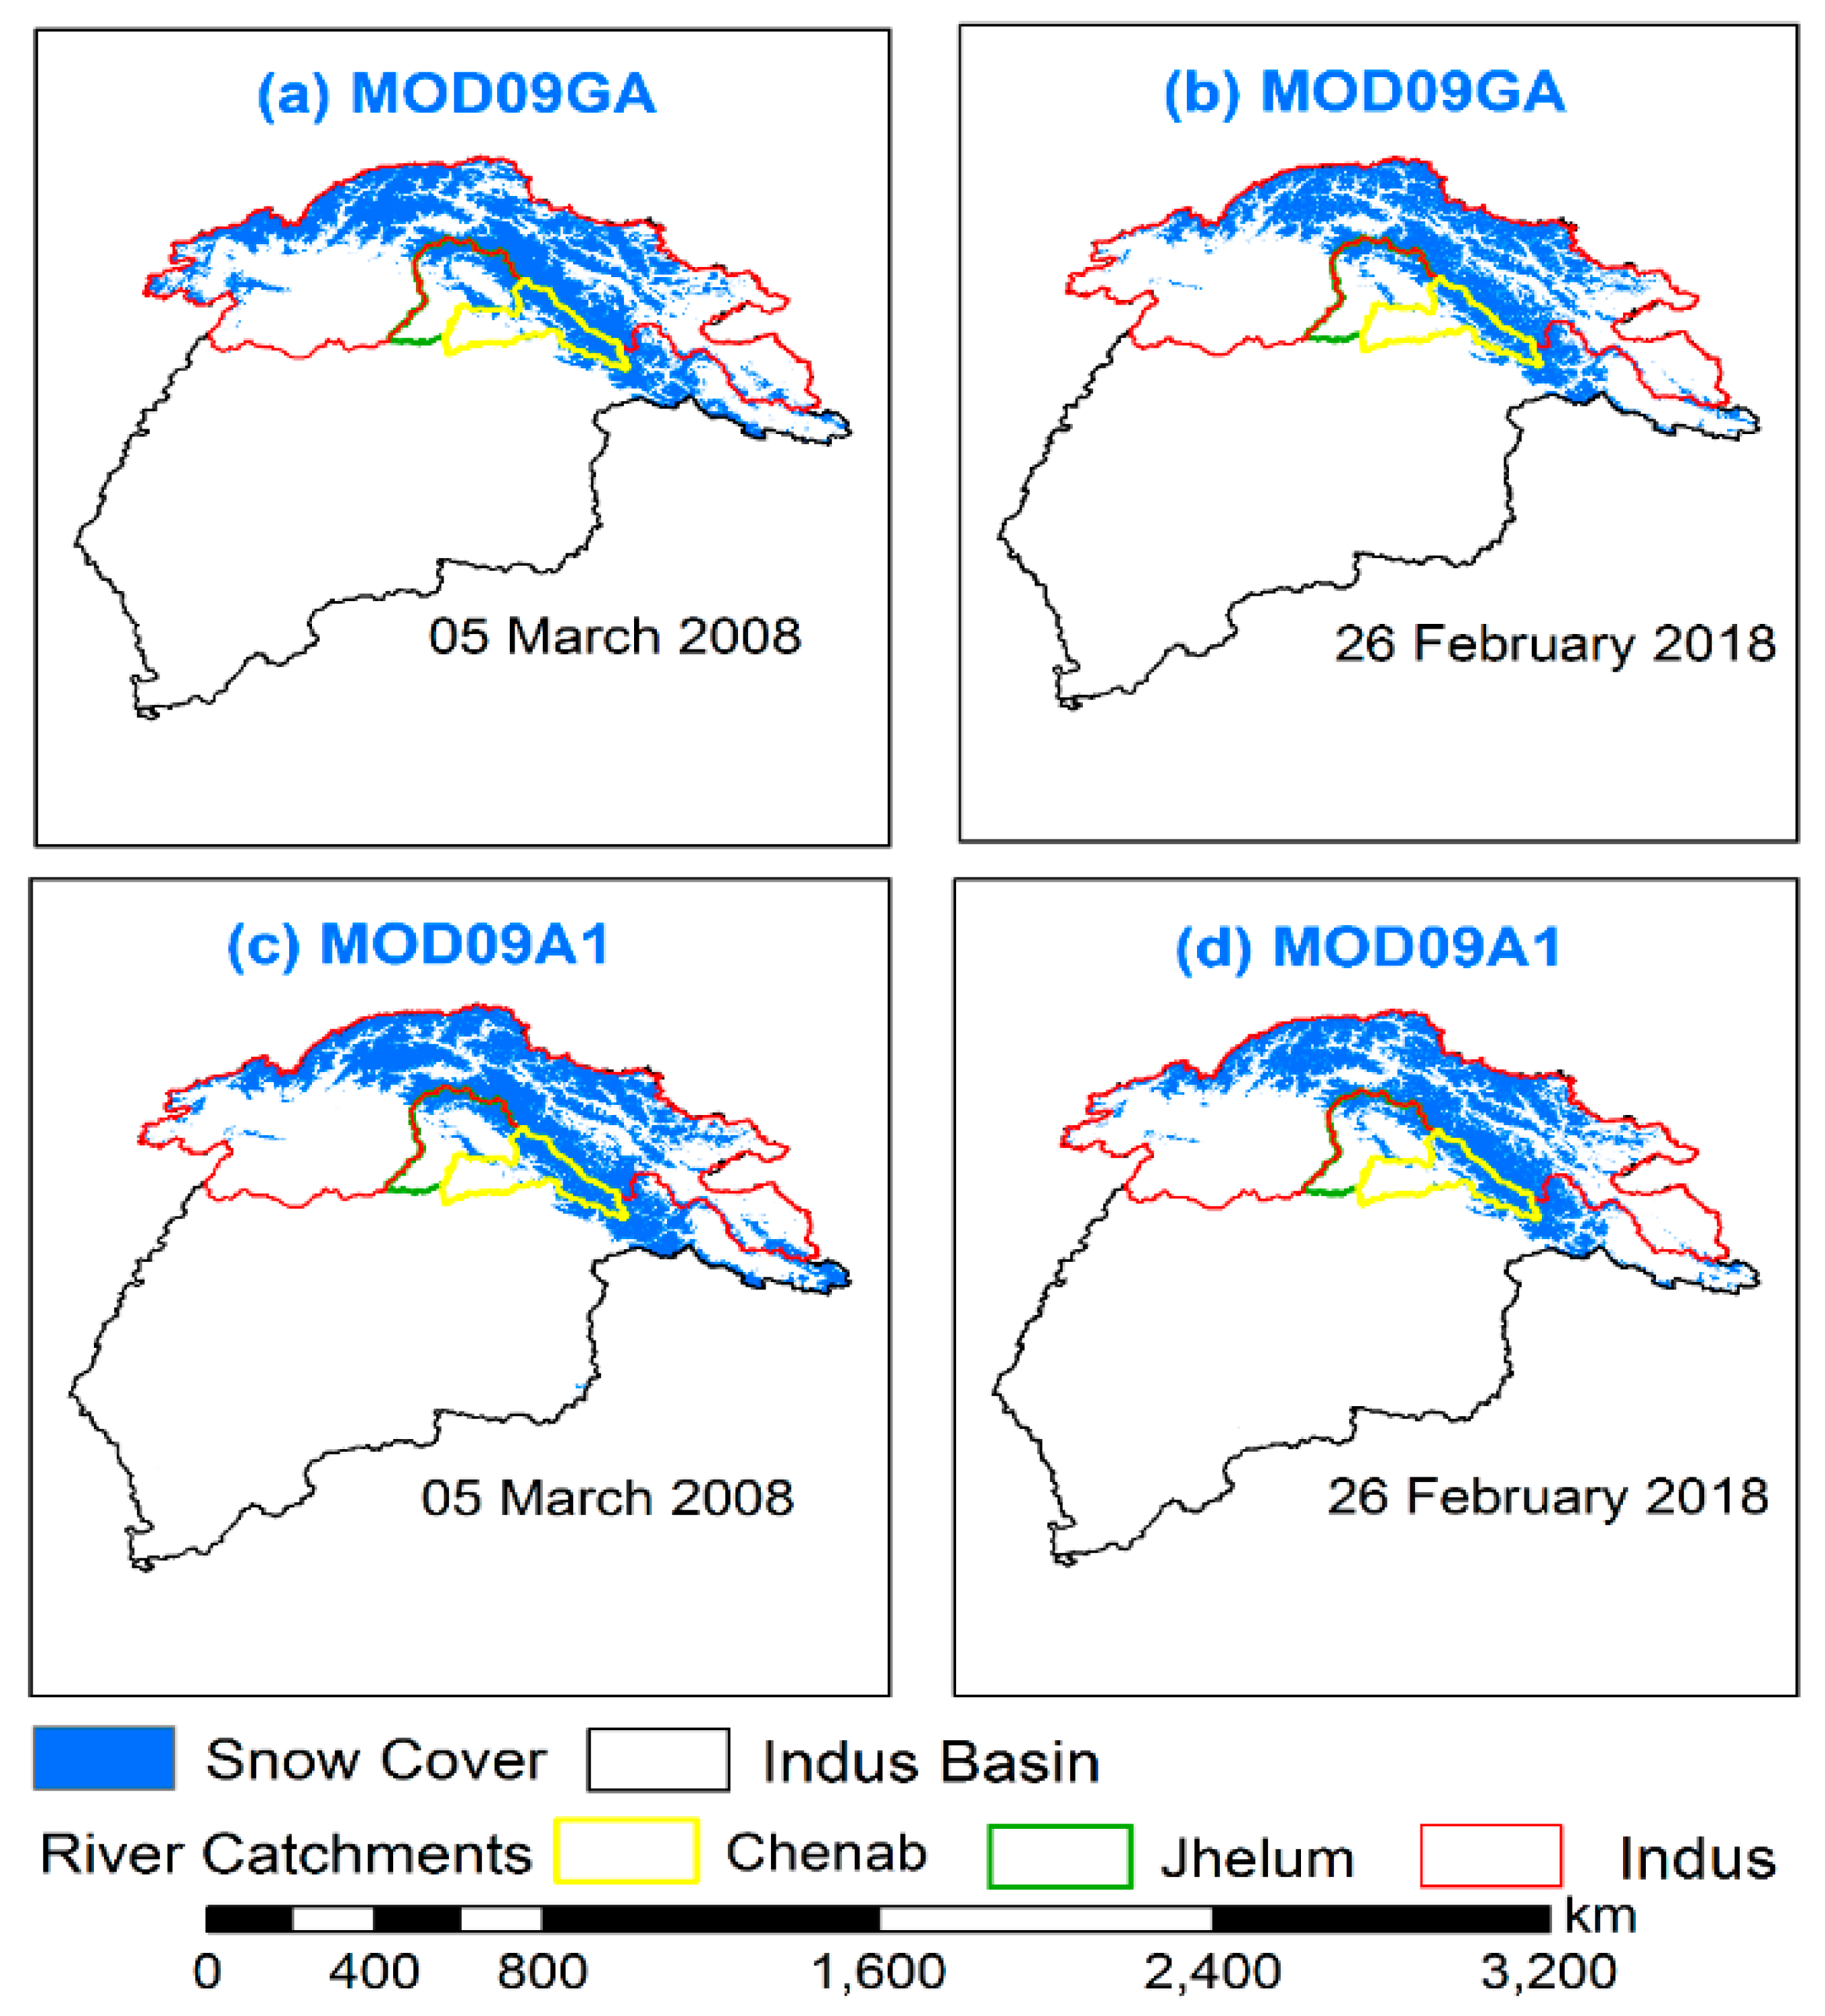
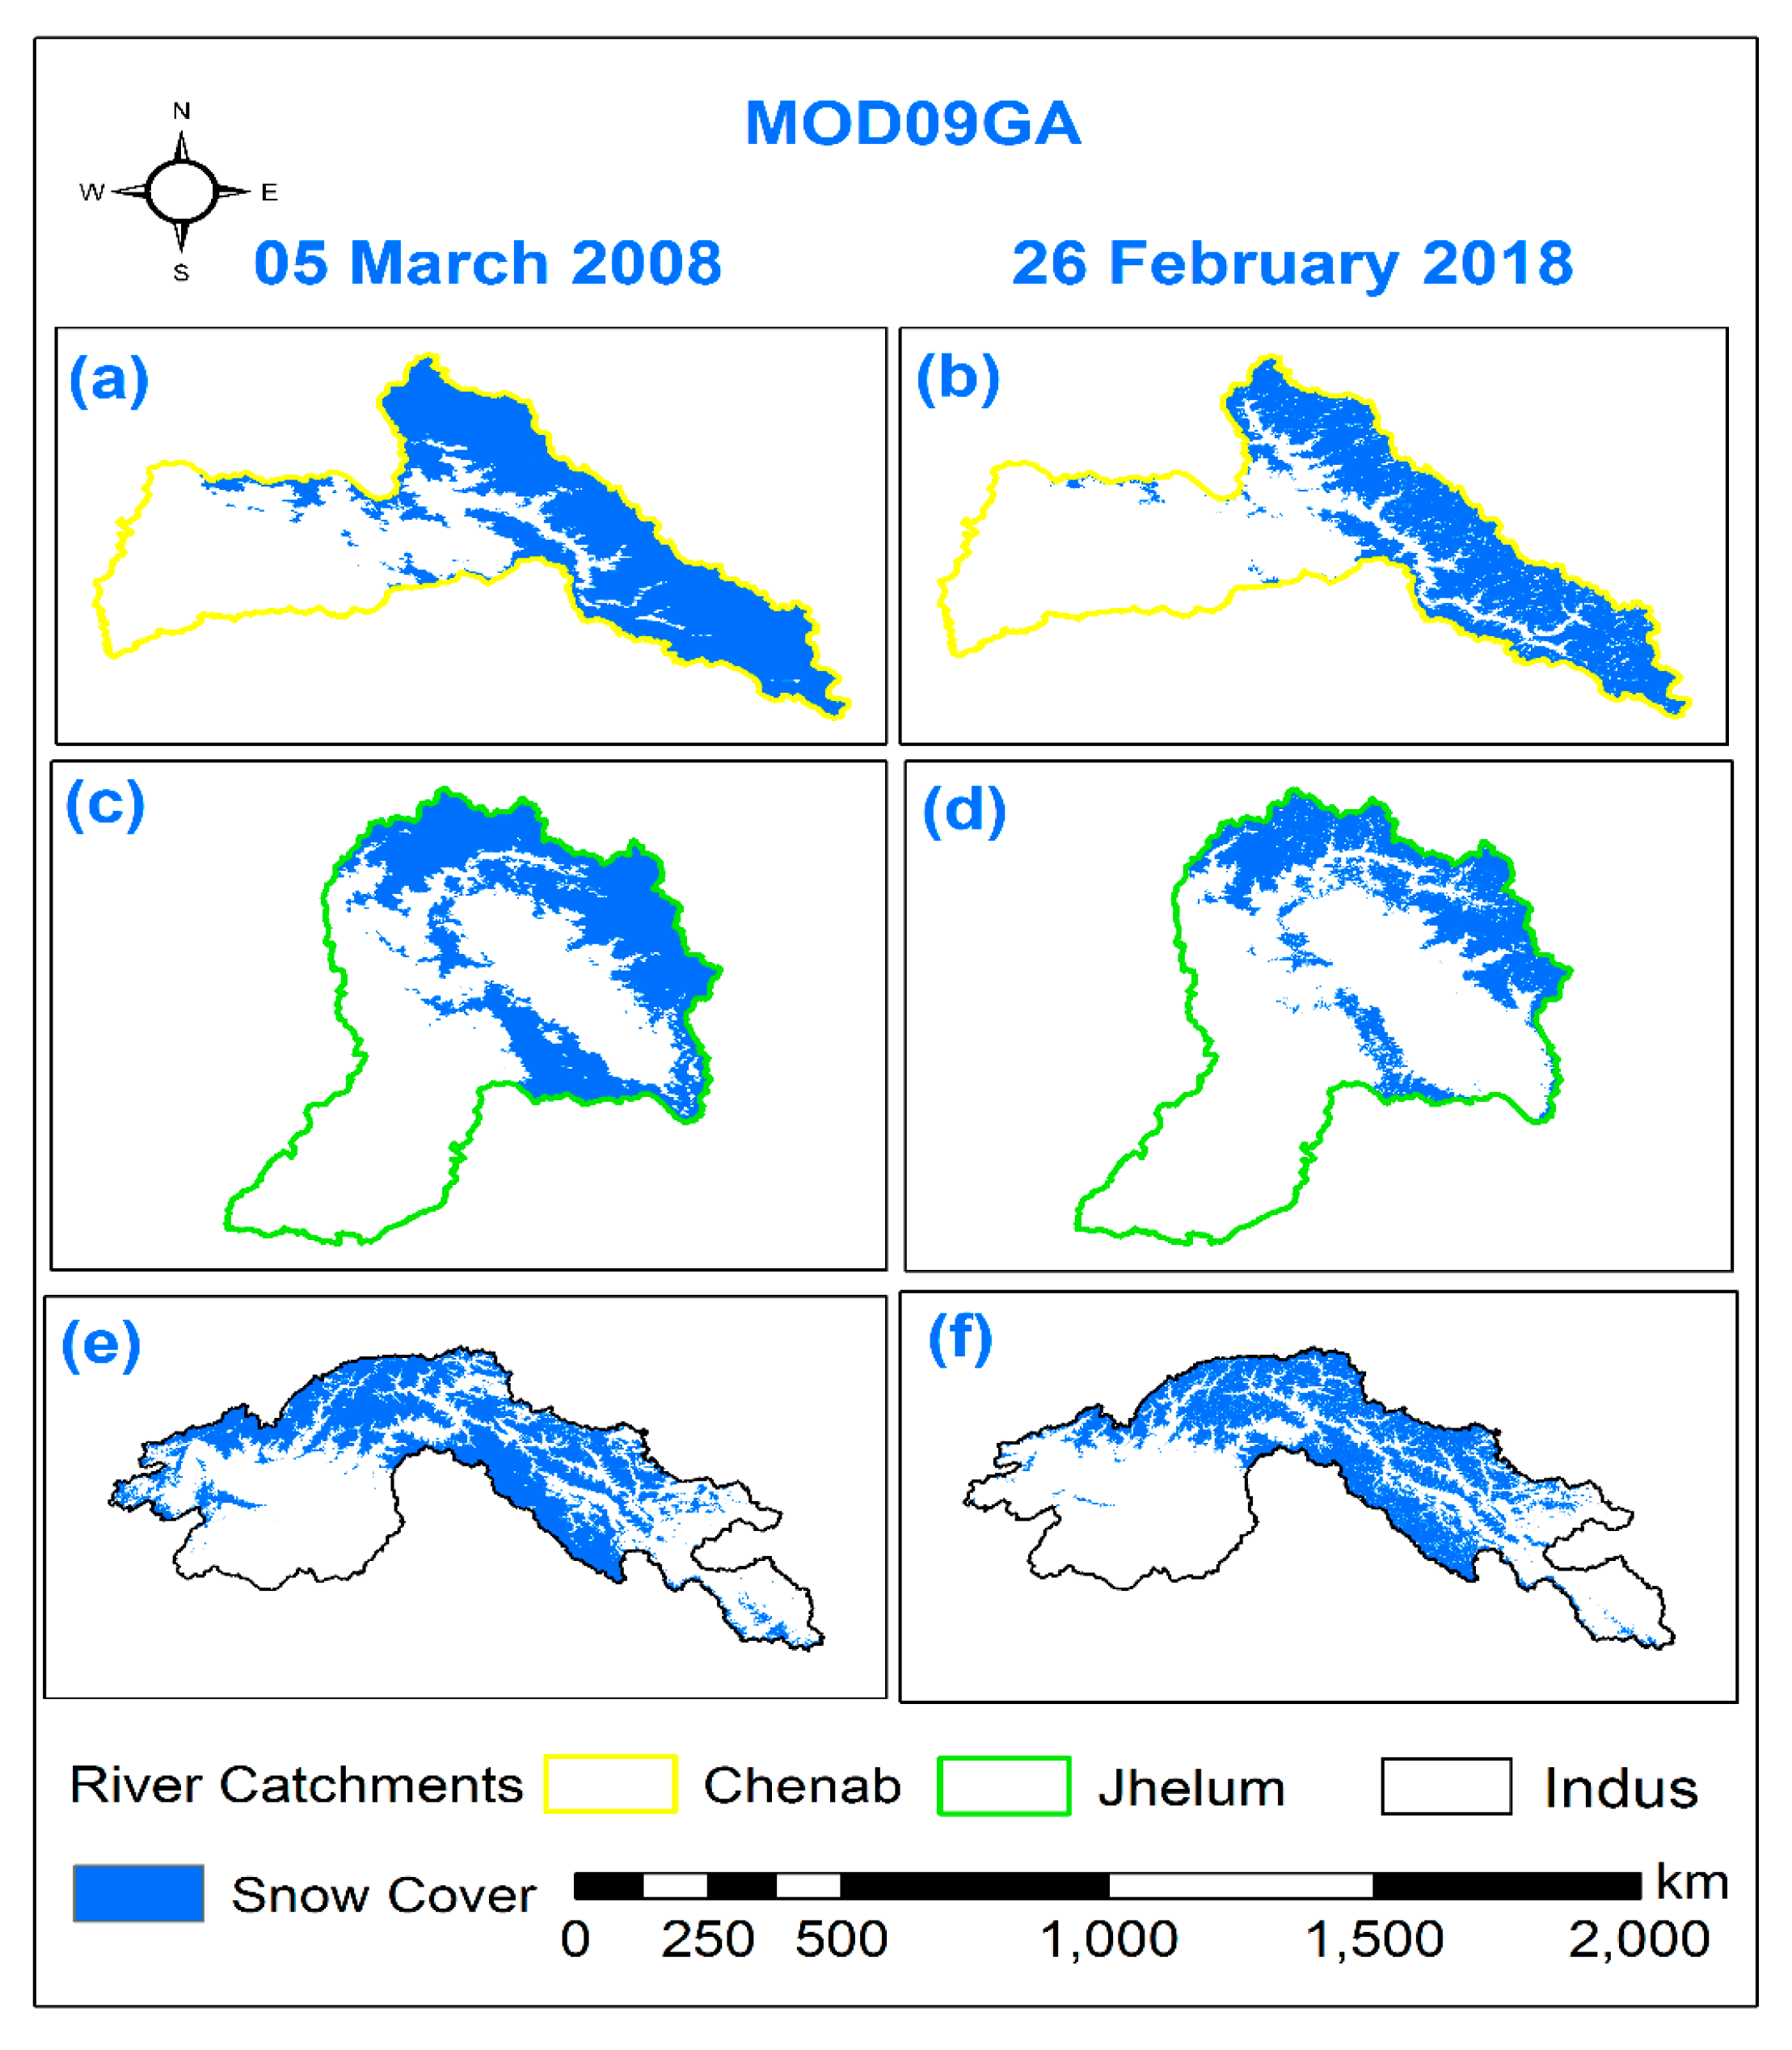
3.2. NDSI Threshold and Snow Cover Estimations

A comparison of the snow cover area of MOD09GA and MOD09A1 with two scenes of Landsat ETM+ coarsened to a 500-m resolution is presented in Figure 3. Scenes 1 and 2 on the left and right side, respectively, in Figure 3 represent the snow cover of Landsat ETM+ and both the MODIS (NDSI ≥ 0.34) products. In the first scene, the comparison is good and an underestimation in snow cover is observed by both the MODIS products, as highlighted by the red circles on the Landsat ETM+ scene. In the second scene, the underestimation is also clear in both the MODIS products compared to the Landsat ETM+ scene, as indicated by the red circles.
A statistical comparison of the snow cover area of both the MODIS products with the Landsat ETM+, in situ snow data and Google Earth imagery for 120 scenes at different times is presented in Table 3. The comparison indicates that a minimum NDSI threshold of 0.34 has a good R2 and a higher value of NSE. The comparison in Figure 3 also reveals that snow is removed in the MODIS MOD09GA and MOD09A1 products over some of the low-altitude glaciers at NDSI ≥ 0.34. Moreover, at NDSI > 0.4, some of the mid-altitude glaciers were misclassified as non-snow pixels, so the threshold of 0.34 was preferred in this study for both the MODIS products, as a lower threshold value (NDSI > 0) has also been tested by Dong et al. [76]. The NDSI thresholds below 0.34 revealed that snow was also observed in plain and desert areas, which was leading to an overestimation of snow cover. The possible reasons for the underestimation of snow cover, at the newly established threshold (NDSI ≥ 0.34), are the coarser resolution of MODIS products and changes in the wavelengths of bands compared to Landsat ETM+.
The snow cover delineation patterns derived from both MOD09GA and MOD09A1 products are presented in Figure 4a–d for 5 March 2008 and 26 February 2018.
On 5 March 2008, both the MODIS products show a difference in their snow cover patterns, mainly on the western side (the Kabul river basin), northern side and the eastern rivers’ catchments of the basin. On 26 February 2018, both the MODIS products indicate almost similar snow cover patterns over the Indus basin. The snow cover patterns of both the MODIS products over the Indus basin indicate that the snow cover on the western side of the Indus basin and the eastern rivers’ catchments is decreased. The snow cover on the low-altitude mountains is also significantly decreased over the Indus basin. The low- to mid-altitude snow cover of the western rivers’ catchments also revealed a significant decrease from 2008 to 2018.
The snow cover of daily MOD09GA product is presented in Figure 5a–f to account for the differences in delineated snow cover patterns over the western rivers’ catchments of the Indus basin. The snow cover pattern of the Chenab river catchment indicates that the snow cover on the upper part of the catchment is preserved, while in the lower reaches the snow cover is reduced. The snow cover decline in the upper reaches is observed on the low-altitude mountains and on both the sides of the main Chenab river and its tributaries. The Jhelum river catchment showed a serious change in the snow cover pattern, the snow cover on low- to mid-altitude mountains and on the eastern side of the Jhelum river catchment revealed a significant decline. The western and northern parts of the Indus river catchment are affected badly and a change in snow cover pattern has been observed in the low-altitude parts of the catchment. Our MODIS products-based snow cover pattern analysis revealed that changes in snow cover patterns have been observed on the low- to mid-altitude mountains of the Indus basin and its sub-catchments.

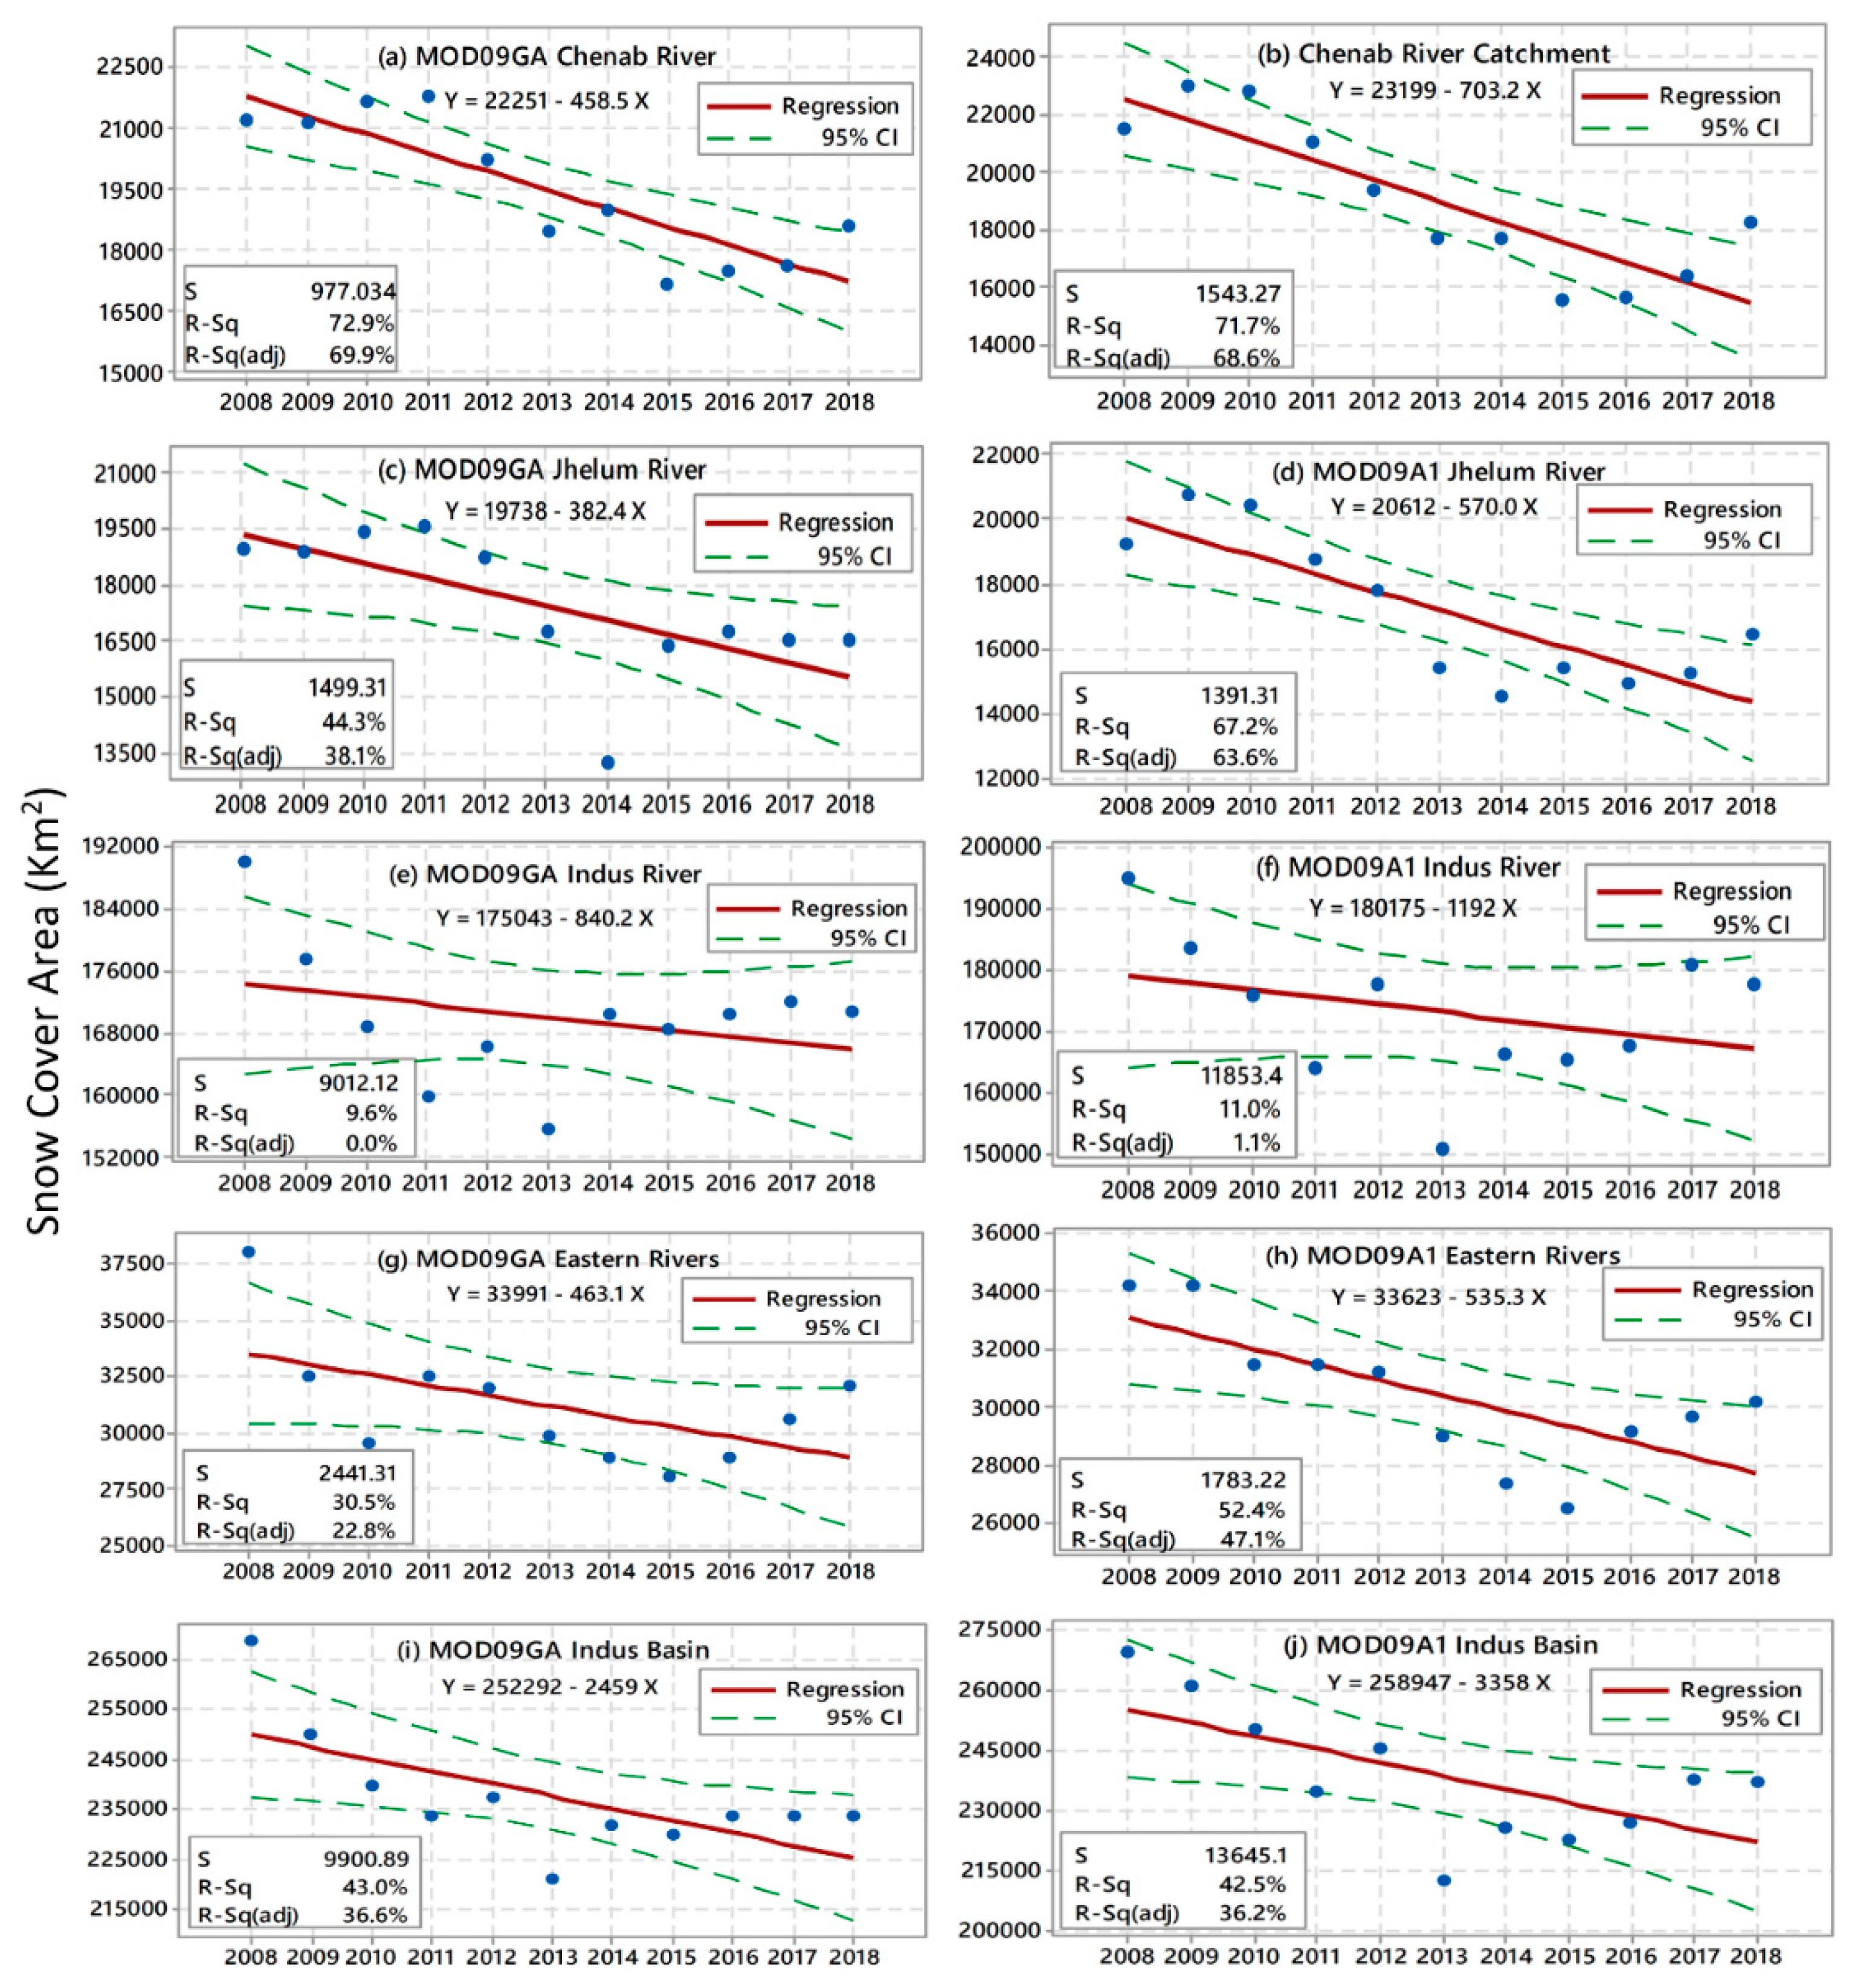
3.3. Annual Snow Cover Trends

The annual snow cover trends of the Indus basin and its sub-catchments, on an annual basis, are presented in Figure 6 for both the MODIS MOD09GA and MOD09A1 products. It is observed that the snow cover area for both the products follows an almost similar trend throughout the individual year for the Indus basin and all of its rivers’ catchments. It is obvious that the major contribution to the snow cover area of the Indus basin is from the Indus river catchment compared to the other rivers’ catchments. Decreasing trends of snow cover are observed from the middle of March to the middle of June, followed by constant trends up to the middle of August, and then rising trends are observed for all the rivers’ catchments and the Indus basin. Over and underestimations in the snow cover area of both the MODIS products are observed for all the rivers’ catchments and the Indus basin in every year.

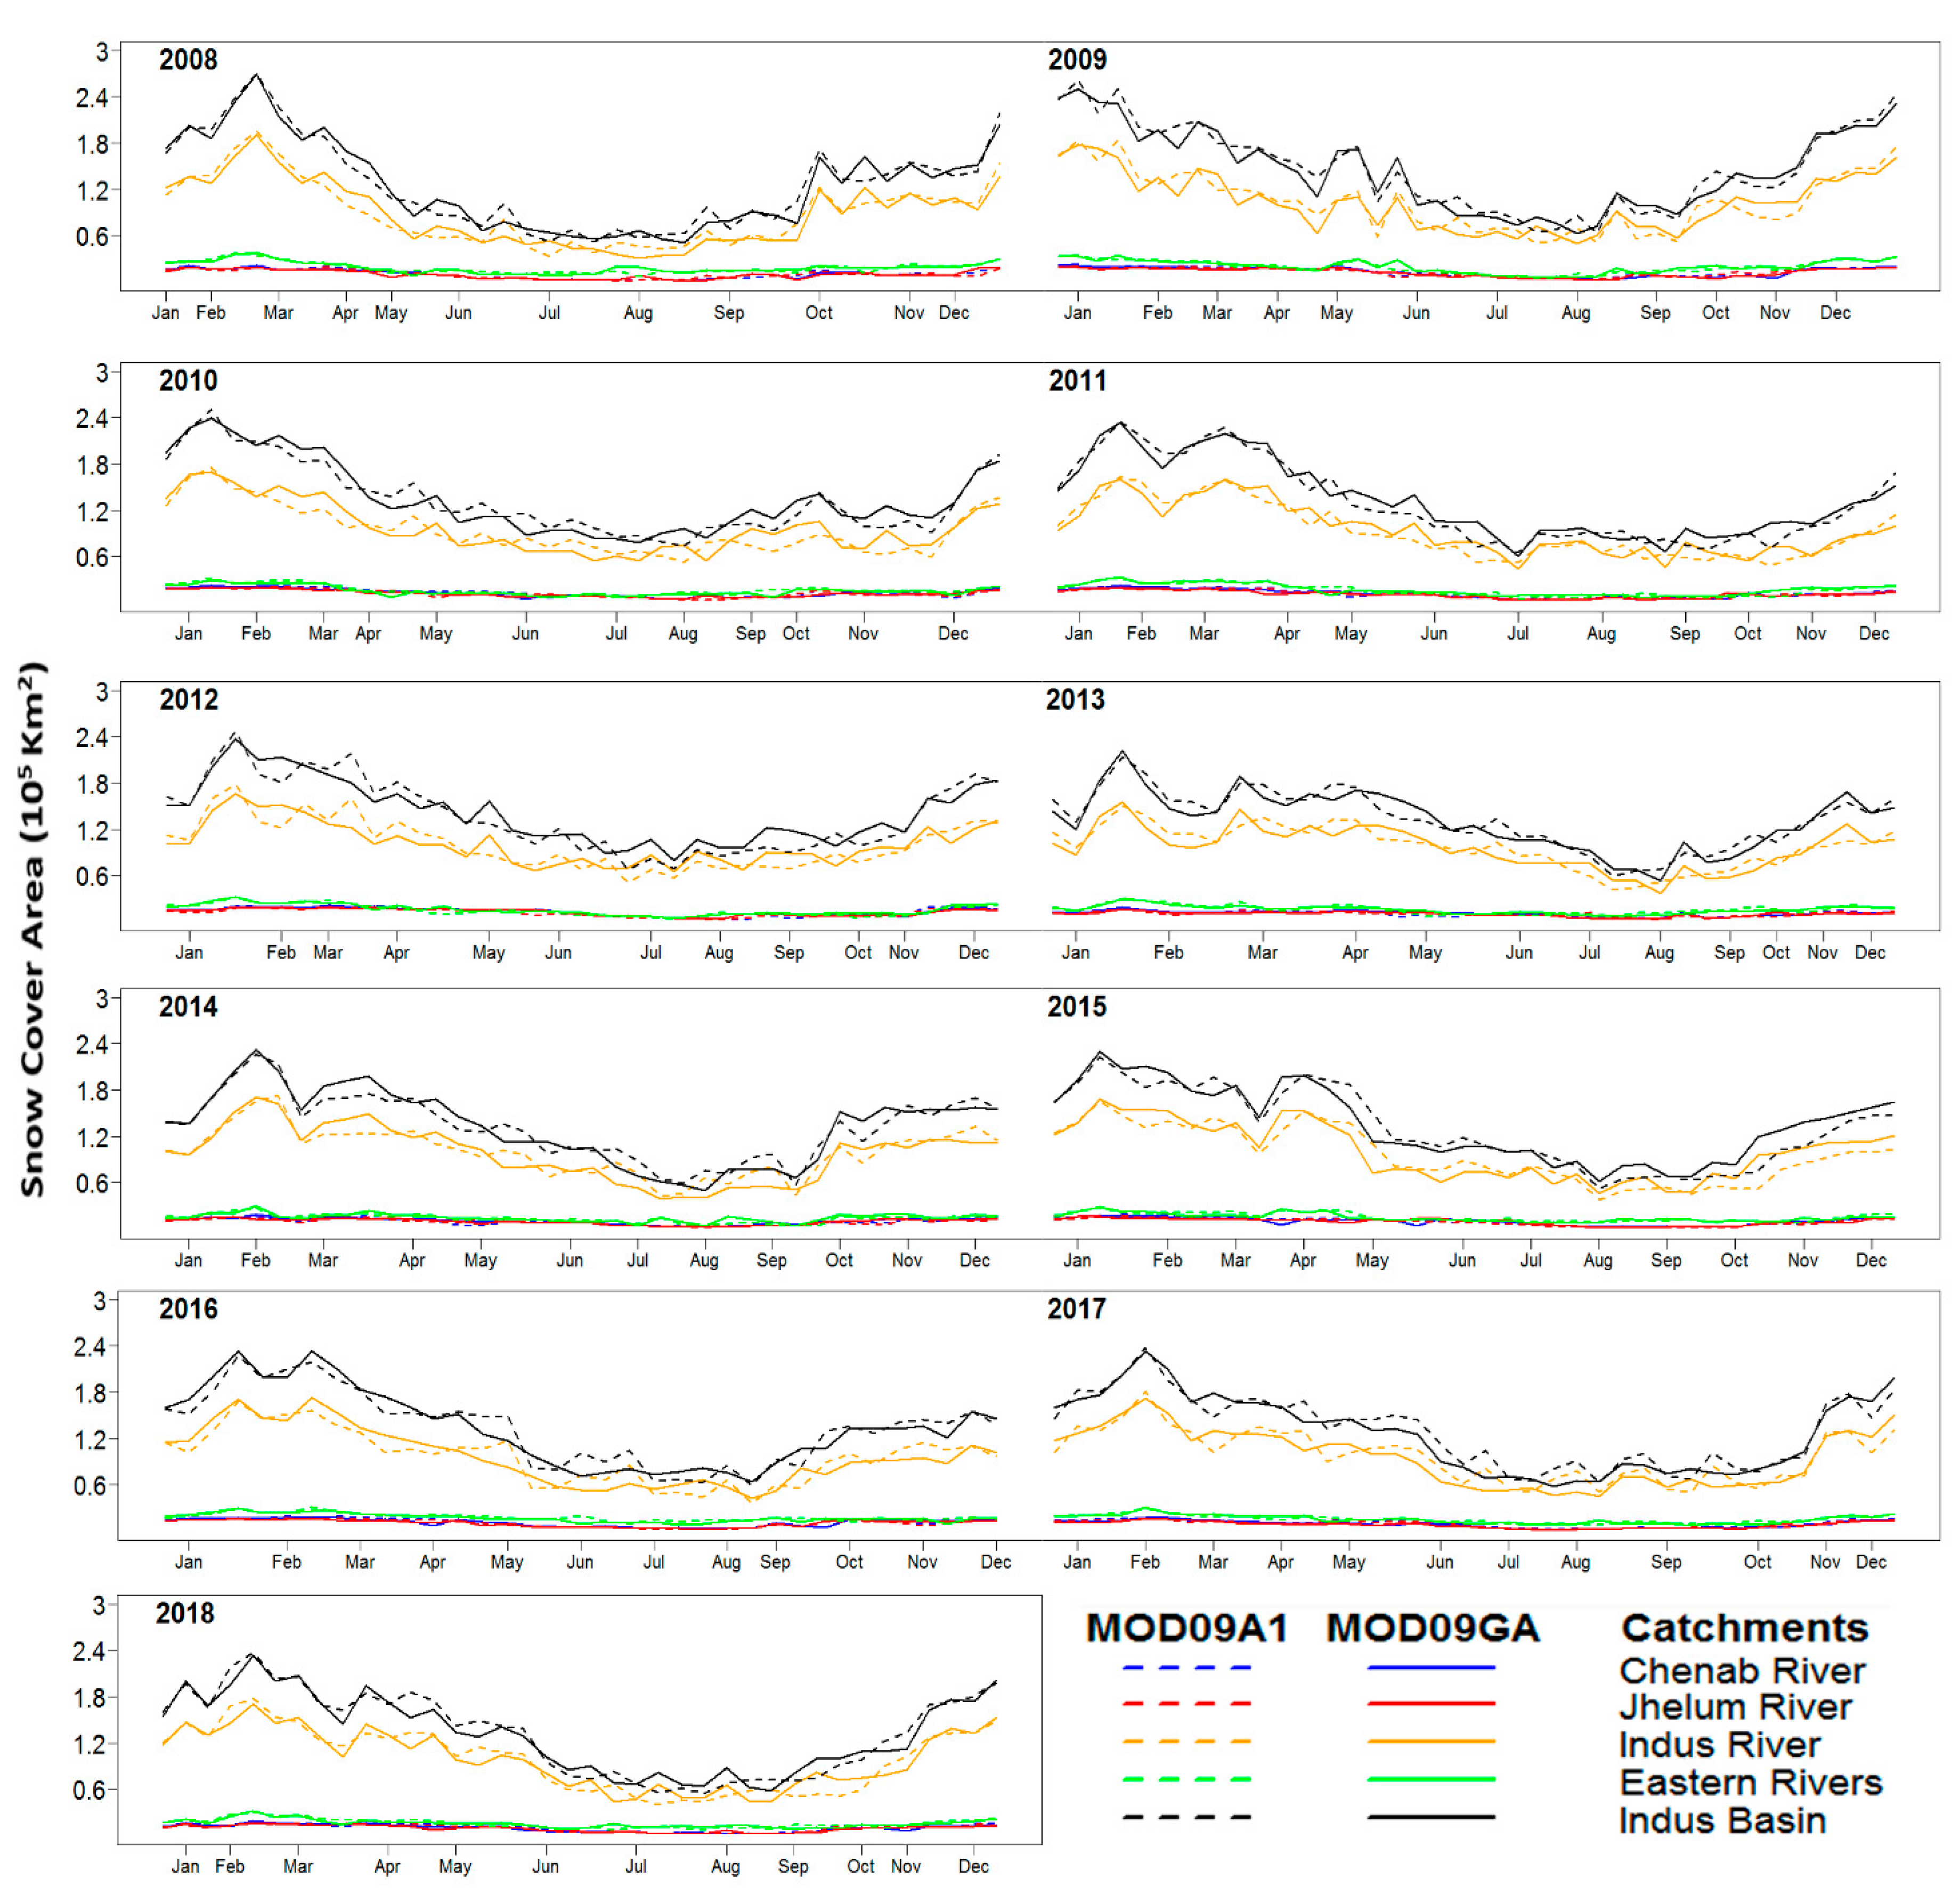
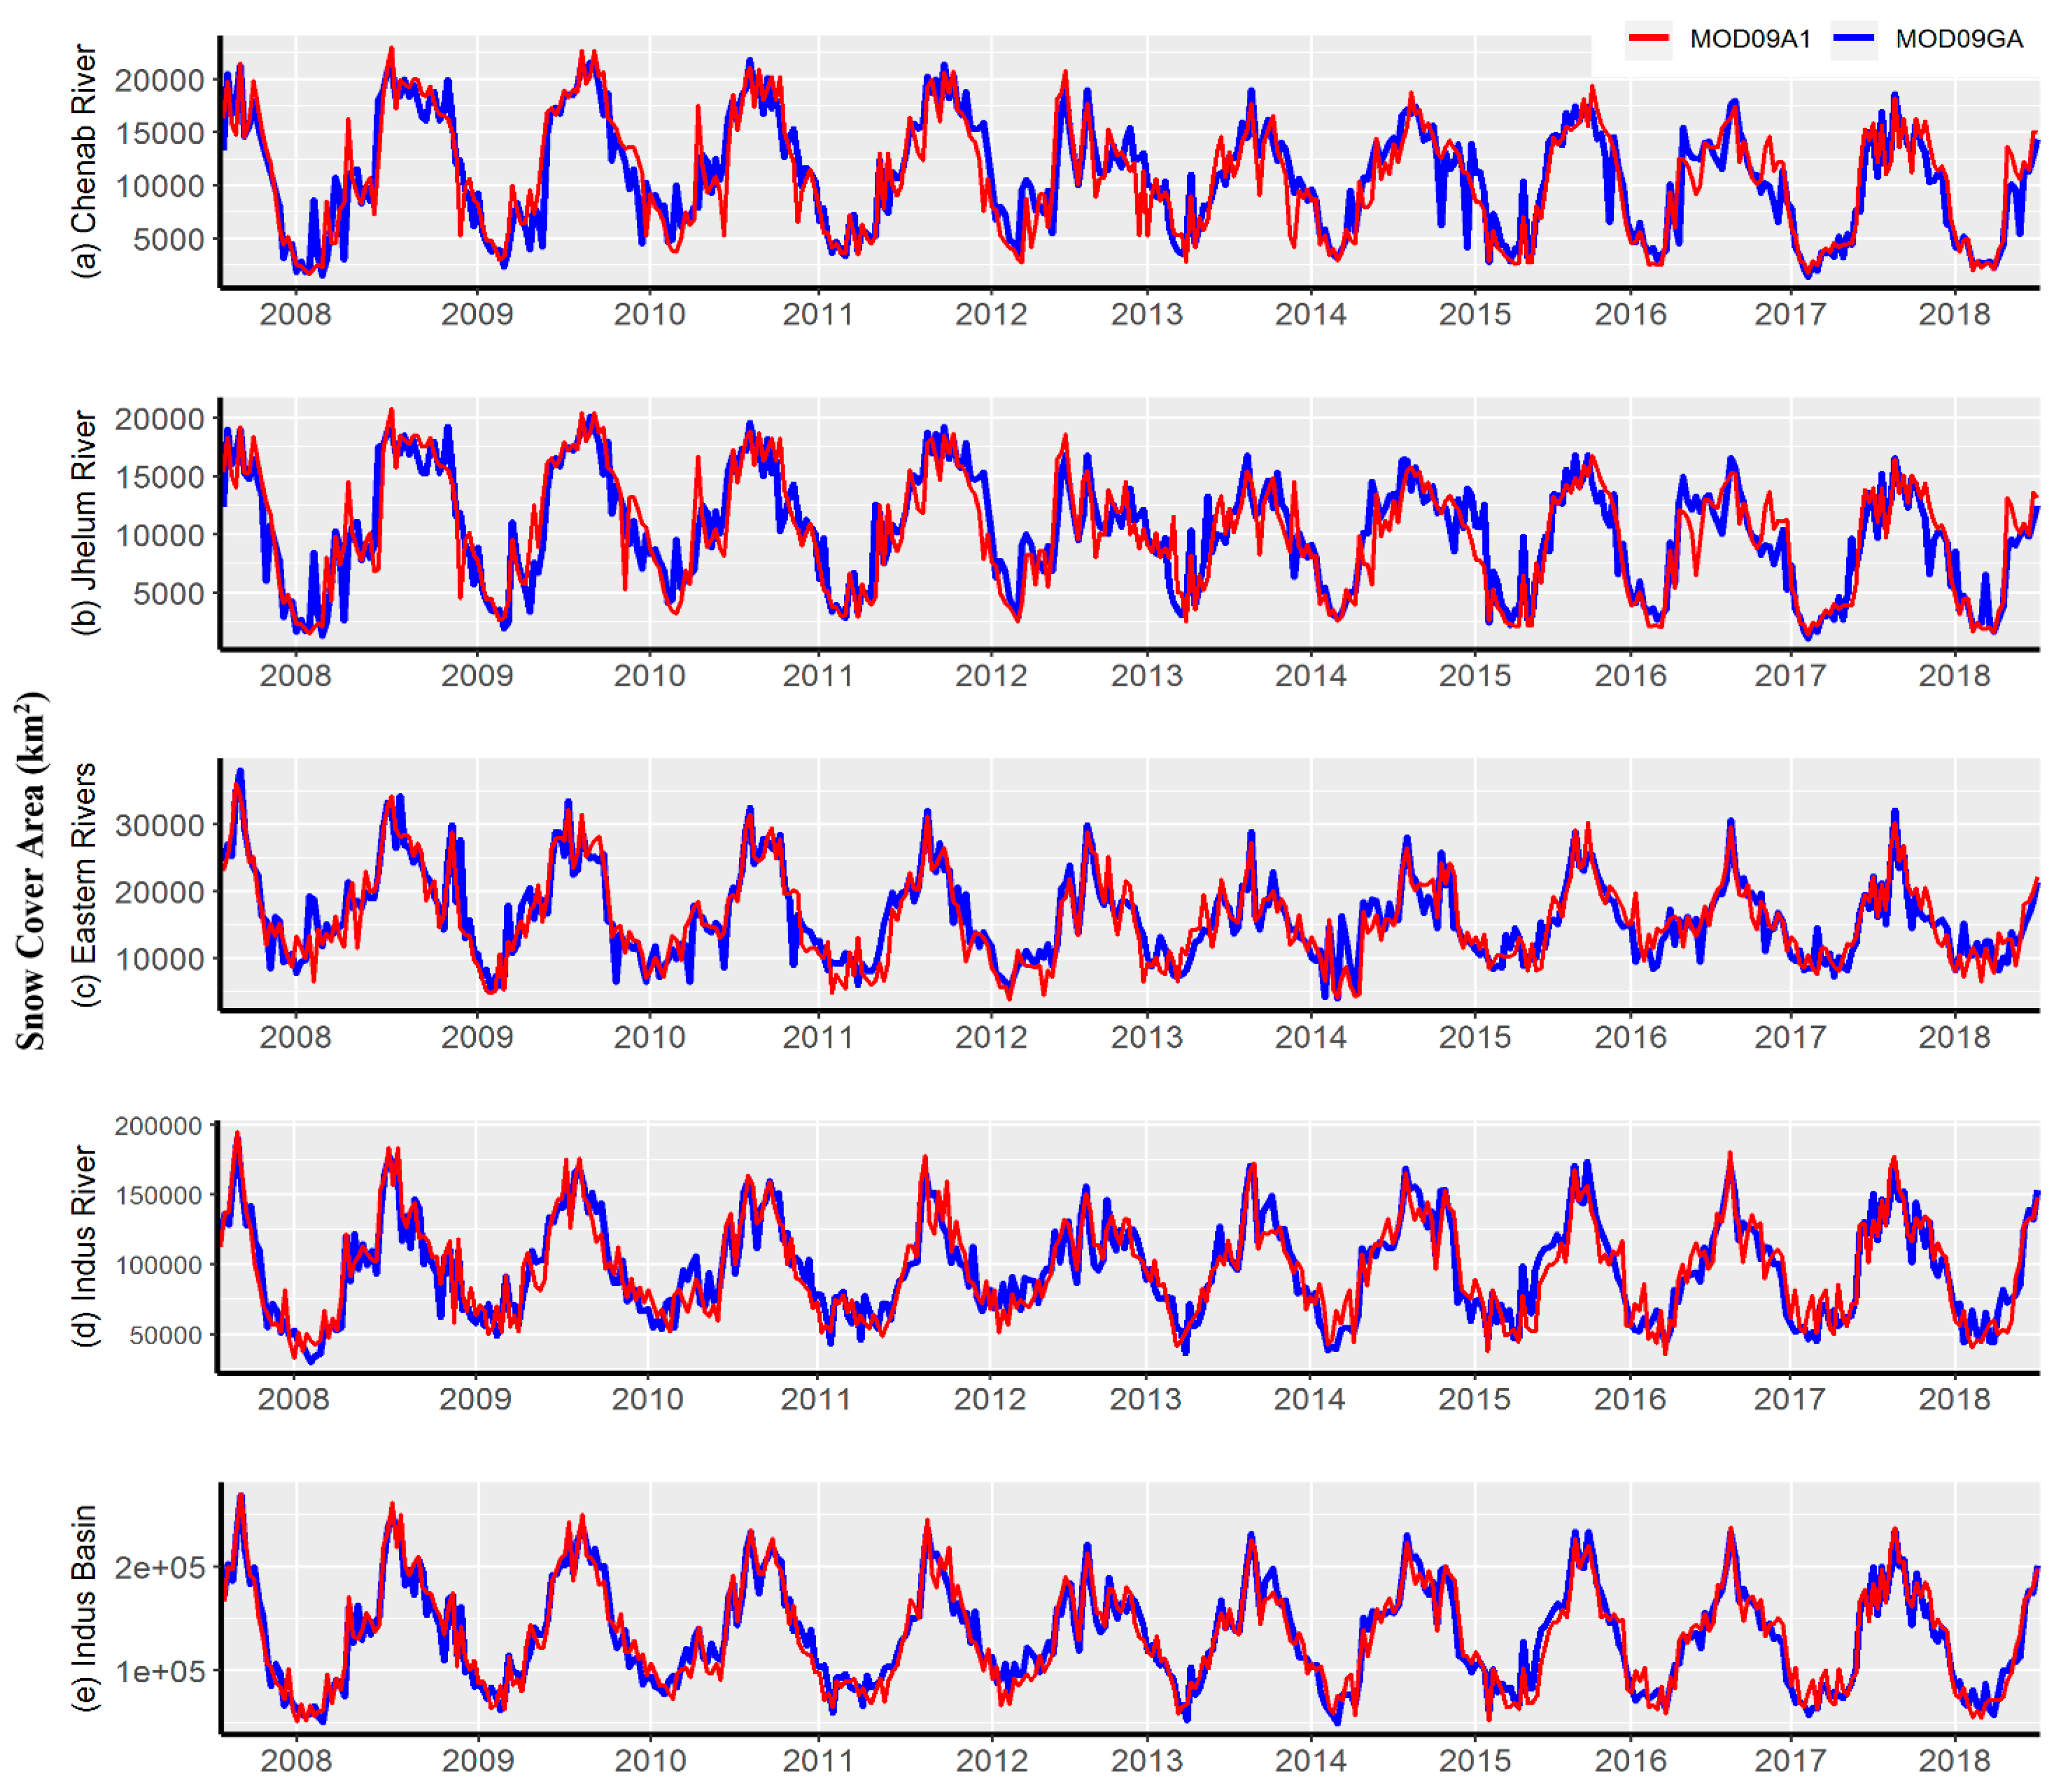
3.4. Time Series Snow Cover Dynamics from 2008 to 2018

The long-term snow cover trends are presented in Figure 7a–e from 2008 to 2018 for the Indus basin and its rivers’ catchments. In the case of the Chenab river catchment, the maximum snow cover is observed for MOD09GA and MOD09A1 in 2011 and 2009, respectively, with very small differences in peaks. As most of the snow-dominant area of the Chenab river catchment lies higher than 4000 m Above Mean Sea Level (AMSL), the decrease in snow cover is not too much due to the presence of snow mostly at higher altitudes. A drastic decrease in the maximum snow cover over the Chenab river catchment is observed in 2015 and a slightly decreasing trend is observed up to 2018. A small and insignificant increase is also observed in the years 2015 and 2017, while again decline is observed in 2018. A difference in the snow cover estimation in both the MODIS products is observed in 2008, 2010, 2013, 2014 and 2015.
Over the Jhelum river catchment, the maximum snow cover is recorded by MOD09GA and MOD09A1 in 2011 and 2010, respectively and a severe decrease is observed in 2014, which further decreases up to 2018. A sudden decrease in the maximum snow cover area is recorded from 2012 to 2014, which may be due to a high snowmelt rate for the mentioned period. The MOD09GA overestimates MOD09A1 for several summer seasons, as depicted by the trend lines of the years 2008, 2009, 2010, 2012 and 2015, and underestimation is also observed in summer 2010.
A decreasing trend of snow cover area is observed from 2008 to 2018 over the eastern parts of the Indus basin, consisting of the catchments of all three major eastern rivers. The maximum snow cover area is recorded at the start of 2008 for both the MODIS products and a severe decline in the maximum snow cover area is observed at the start of 2015.
Most of the snow cover area of the eastern rivers’ catchments lies below 4500 m AMSL and some of it even lies below 4000 m, hence faced degradation of snow cover due to global warming and climate change. A drastic decrease in the maximum snow cover area is observed after 2012 and the decreasing trend continued, while a small increase in yearly maximum snow cover is observed in 2018.
The monitoring of snow cover dynamics is of great importance over the Indus river catchment as Indus river flow is mainly dependent on snowmelt compared to runoff produced by rainfall. Most of the snow-dominated area of the Indus river catchment has an elevation below 4500 m AMSL that experiences snowfall and snowmelt in each individual year. Due to the dynamic elevation range of the Indus river catchment, snow cover monitoring poses serious challenges to the researchers. The maximum snow cover area is observed in 2008 for Indus river catchment and a variable trend is observed up to 2018. A severe decrease in the maximum snow cover area is observed in the first quarters of 2011 and 2013. Over and underestimations of both the MODIS products are also observed from 2008 to 2018 for Indus river catchment. For the Indus basin, the maximum and minimum snow cover area is observed at the start of 2008 and 2013, respectively, and over and underestimations of snow cover for both the MODIS products are observed from 2008 to 2018. All the rivers’ catchments and the Indus basin showed a decline in the snow cover area from 2008 to 2018 causing a loss of reserved frozen water resources, which were present in form of snowpack.

3.5. MODIS Time Series Snow Cover Trends

A least squares regression analysis was performed with a 95% confidence interval to discuss the maximum snow cover trends of both the MODIS products over the Indus basin and its sub-catchments from 2008 to 2018, as shown in Figure 8a–j.
The linear regression for the Chenab river catchment reveals that MOD09A1 indicates a higher decreasing trend of snow cover of about 703 km2 per year compared to about 458 km2 per year by MOD09GA. The higher value of R2, adjusted R2 and the lower value of standard distance data values (S) falling from the regression line indicate the reliability of this regression. The linear regression analysis of snow cover for the Jhelum river catchment reveals that the MOD09A1 product indicates a greater declining trend of about 570 km2 per year compared to about 382 km2 per year by MOD09GA. The regression analysis of the Jhelum river catchment further shows that there is a severe decrease in the maximum snow cover area in 2014 for MOD09GA product, thereby indicating a lower value of R2 and a higher value of S. A very poor linear regression is obtained for the snow cover trend of both the MODIS products for the Indus river catchment, with lower values of R2 and higher values of S, due to severe decrease in the maximum snow cover in 2013. The snow cover trends indicate a greater decrease of about 1192 km2 per year in the snow cover estimated by MOD09A1 compared to 840 km2 per year by MOD09GA for Indus river catchment. The snow cover trends of the eastern rivers’ catchments indicate a greater decline of about 535 km2 per year by MOD09A1 compared to 463 km2 per year estimated by MOD09GA, with a reasonable value of R2 and a slightly higher value of S due to the greater deviation from the trend line. A decline in the maximum snow cover is observed in 2015 for both the MODIS products and a greater decline is observed by MOD09A1. The Indus basin observed highly dynamic trends of snow cover from 2008 to 2018 by both MODIS products. A severe decline in the snow cover is observed in 2013 for both the MODIS products, mainly due to a greater decline in the snow cover of the Indus river catchment. The regression analysis indicates a declining trend of about 3358 and 2459 km2 per year by the MOD09A1 and MOD09GA products, respectively with reliable values of R2 and higher values of S due to the greater deviation of values from the regression line.
The percentage difference between the maximum snow cover area of MOD09GA with respect to MOD09A1 is presented in Table 4. In most of the observations, the percentage difference is less than 5%, representing a reliable agreement, while greater differences are observed for the year 2009 and from 2013 to 2017 for the Chenab and Jhelum rivers’ catchments. Low percentage differences are observed for the Indus river catchment, except for the year 2012, with a difference of −6.37%. The eastern rivers’ catchments record a less than five percent difference, except for the years 2008, 2010, 2011, 2012 and 2018. The differences in yearly maximum snow cover are mostly recorded as less than 5% for the Indus basin, represent reliable agreements between MODIS products
Snow cover data from 2008 to 2018 are plotted for all the rivers’ catchments and the Indus basin for intercomparison of MOD09A1 and MOD09GA products, as shown in Figure 9a–e.
The higher R2 and NSE values of 0.96 and 0.8, 0.95 and 0.76, 0.97 and 0.83, 0.96 and 0.8, 0.98 and 0.89 were estimated for the Chenab, Jhelum, Indus and eastern rivers’ catchments and Indus basin, respectively. The higher R2 and NSE values indicate that the variations in the estimations are not too much greater and, hence, that the reliability of the estimations is good.

4. Discussions

Snow cover estimation is very important for the planning, management and mitigation of bio-physical processes. The MODIS products used in this study are preferred for snow cover mapping compared to other products like the National Operational Hydrologic Remote Sensing Center, as MODIS detects more snow over higher altitudes and its algorithm is not static but evolving [77]. The National Environmental Satellite Data and Information Service snow product of the National Oceanic and Atmospheric Administration overestimates the snow cover over higher latitudes [78]. MODIS also offers regular quantifications of snow cover with respect to data availability and spatiotemporal resolution. [79,80]. The accuracies of MODIS and the National Operational Hydrologic Remote Sensing Center snow products have been observed as 94 and 76%, respectively, over the Upper Rio Grande Basin [81]. The MODIS 8-day snow cover product (MOD10A2/MYD10A2) is the combination of 2 to 8 days of MODIS Aqua/Terra daily snow product (MOD10A1/MYD10A1). The MODIS MOD10A1 and MYD10A1 products are being used to produce multi-day snow cover products with fixed temporal windows [82,83,84,85]. Such approaches can reduce the cloud coverage, but products lack the ability to observe snowfall events to some extent due to the fixation of temporal windows [86]. The daily and 8-day composite products used in this study offer a reliable temporal resolution, but in poor weather conditions the composite products produce images of reliable quality after a gap of 8 days to several weeks. The MOD10_L2 can be analyzed for land or inland water pixels only, which are unobstructed by clouds in the daylight, for the presence or absence of snow, and coarser resolution MODIS products like MOD10C1 and MOD10C1C highly overestimate the snow systematically [87].
The MODIS binary snow products map the snow along with other major Earth features with some sets of rules and the codes do not contain valid land cover state information like clouds, missing data, etc. The MODIS NDSI-based fractional snow cover products represent snow pixels within a MODIS pixel using some empirical equations and in situ snow information, and these products also lack valid land cover state information. Fractional snow cover is no longer provided in version 6 products, and previous binary snow cover has been replaced by NDSI snow cover (equation 1) [88]. The most widely used indicator for snow cover estimations is NDSI, which requires deeper investigations for greater accuracy. The fixation of the NDSI threshold is very important for coarser resolution products, as a significant amount of snow can be misclassified as non-snow pixels at a minimum globally accepted NDSI threshold of 0.4 [32,89]. The results of our snow cover comparison (Table 3) indicate that higher values of NSE and R2 are obtained at a minimum NDSI threshold of 0.34 for MODIS MOD09GA and MOD09A1 products when compared with finer resolution Landsat ETM+ snow cover, in situ snow data and Google Earth imagery. We also tested the NDSI values less than 0.34 in this study, as suggested by Huang et al. [88] and Shimamura et al. [90], which resulted in misclassification of many forests, water and barren lands (sand) as snow pixels.
The atmospheric disturbance, spatial resolution and the subsequent mixing of reflectance of other Earth features with that of snow, within the pixel, increase the probability of uncertainty. The water, forest, barren lands (sand) and clouds cause uncertainties in snow cover estimations and were rectified by a separate analysis in this study. The resemblance between water and snow poses a serious challenge for differentiation due to their similar properties and one threshold is not sufficient for the detection of water [91]. The blended water body mask can be developed using combined NIR1 [92] and NDWI-based [60] thresholds. We prepared a blended water mask and the results are satisfactory over the Indus basin when compared with Google Earth imagery of Tarbela and Mangla dams of Pakistan. The dark forest areas can be misclassified as snow pixels [45,93], which may lead to poor snow cover estimations, and the visible (green) band threshold [36] played a key role in this study to differentiate the dark forests from the snow. The snow–forest differentiation is also a serious concern in snow cover estimations [27,94] as it can lead to underestimations of snow cover if snow–forest pixels are classified as forest. The snow–forest confusion was resolved using NDSI and NDVI thresholds [63,95] at the same time in this study, which proved to be very helpful for improving the accuracy of snow cover estimations. The clouds over snow-covered mountains also lead to the overestimation of snow cover [96] and cloud detection using reflection and thermal bands has been applied by several researchers worldwide [97,98,99,100]. We used both the thresholds of reflection and thermal bands for development of a blended cloud product for each individual cloudy day and ASTER GDEM-based month-wise snow elevation thresholds proved to be very helpful to classify snow and non-snow pixels for cloudy days. The analysis of thermal bands indicated that the mean clouds’ brightness temperature showed an increasing trend towards longer wavelengths, which is also observed by Ahmad et al. [53]. The intercomparison of MODIS products in Figure 8a–e also indicates reliable agreements, as various researchers have also validated the overall accuracy, ranging from 85 to 90 percent for MODIS snow cover around the globe [46,81,87].
The study reveals a declining trend of about 458, 382, 840, 463 and 2459 km2 per year for the Chenab, Jhelum, Indus and eastern rivers’ catchments and Indus basin, respectively. Such high declining rates of snow cover may cause the smaller rivers of the Indus basin to become dry in the near future, which may be a serious threat to the freshwater supplies of the Indus basin. A decline in the snow cover has been observed by researchers over the Himalayas [8,101] and the upper Indus basin [102,103], mainly due to an increase in temperature [104,105]. The Global Land Ice Measurements from Space (GLIMS) project also revealed a consistent decline in the snow cover extent in the upper Indus basin [106]. Decreasing snow cover trends in the catchments of western rivers of the Indus basin during winter and autumn periods have been observed by Hasson et al. [56]. Snow cover decline due to climate change has been observed by researchers in the Sutlej river basin [107] and Kashmir Himalayas [108,109]. The IPCC report concluded that the warming of land is expected to be the highest in higher northern latitudes, resulting in a severe decline in the snow cover [110]. The results of this study draw attention to an astonishing fact: that the glaciers are melting at a very high rate under the prevailing climatic conditions and, if this rate continues, the Indus basin may face serious snow cover decline within a century. The IPCC report also unveiled that the snow cover on the Himalayas is receding at faster rates than the other parts of the world and the thinning of the Himalayan glaciers due to climate change may cause the Indus, Ganges and Brahmaputra rivers to become seasonal rivers in the near future [15]. The need of time is to take serious measures to preserve the frozen water reserves by involving all the stakeholders in joint watershed management and climate change mitigation programs in all the parts of the Indus basin and the Himalayas.

5. Conclusions

The main goal of this study was to estimate the high temporal MODIS-based snow cover dynamics over the Indus basin and its sub-catchments from 2008 to 2018 by fixation of new NDSI threshold. We compared the snow cover area of MODIS MOD09GA and MOD09A1 products with snow cover of 120 scenes of Landsat ETM+, in situ snow information and Google Earth imagery to establish a new NDSI threshold for snow cover estimations for coarser resolution MODIS products. The comparison indicated that the minimum NDSI threshold of 0.34 is more appropriate with minimum R2 and NSE values of 0.97 and 0.85, respectively. These NDSI tests were conducted by focusing on the snow cover over the low- to mid-altitude mountains of the study area. The minimization of uncertainties, using water, forest and cloud masks, provided a better understanding of the spatiotemporal behavior of the snow cover over complex and data-scarce mountainous rivers’ catchments of the Indus basin. The intercomparison of MOD09GA and MOD09A1-based maximum snow cover areas indicated that the percentage difference for most of the estimations was less than 5%, which indicates the reliability of the snow cover estimations. A linear least squares regression analysis of both the MODIS products indicated a minimum snow cover declining trend of about 458, 382, 840, 463 and 2459 km2 per year for the Chenab, Jhelum, Indus and eastern rivers’ catchments and Indus basin, respectively. The MODIS 8-day MOD09A1 product indicated greater declining snow cover trends compared to the daily MOD09GA product for the Indus basin and its sub-catchments. The Indus basin experienced greater variations in snow cover trends for both the MODIS products, mainly due to variations in the snow cover of the Indus river catchment. The low- to mid-altitude mountainous regions of the Indus basin and its sub-catchments have been affected badly, and snow cover decline has been observed over all the parts of the Indus basin. It is believed that localized NDSI threshold fixation for coarser resolution products will provide new opportunities to the researchers to estimate the frozen water reserves over complex mountainous regions across the world.

Author Contributions

Conceptualization, S.A., and M.J.M.C.; methodology, S.A., M.J.M.C., and M.M.W.; software, S.A., and M.W.; validation, S.A., and M.M.W.; formal analysis, M.M.W., and U.K.A.; investigation, S.A., M.W., and T.K.; resources, S.A., M.J.M.C., and U.K.A.; data curation, S.A., M.W., and T.K.; writing—original draft preparation, S.A.; writing—review and editing, M.J.M.C., M.M.W., and M.W.; visualization, U.K.A., and T.K; supervision, M.J.M.C. All authors have read and agreed to the published version of the manuscript.

Funding

This research has not received any external funding.

Acknowledgments

We acknowledge the financial support of the Deutsche Forschungsgemeinschaft and Universität Rostock within the funding program Open Access Publishing. We are thankful to the Pakistan Meteorological Department and the Water and Power Development Authority of Pakistan for providing the in situ monthly snow information.

Conflicts of Interest

The authors declare no conflict of interest.

References

  1. Dobreva, I.D.; Klein, A.G. Fractional snow cover mapping through artificial neural network analysis of MODIS surface reflectance. Remote Sens. Environ. 2011, 115, 3355–3366. [Google Scholar] [CrossRef] [Green Version]
  2. Painter, T.H.; Rittger, K.; McKenzie, C.; Slaughter, P.; Davis, R.E.; Dozier, J. Retrieval of subpixel snow covered area, grain size, and albedo from MODIS. Remote Sens. Environ. 2009, 113, 868–879. [Google Scholar] [CrossRef] [Green Version]
  3. Barnett, T.P.; Adam, J.C.; Lettenmaier, D.P. Potential impacts of a warming climate on water availability in snow-dominated regions. Nature 2005, 438, 303. [Google Scholar] [CrossRef]
  4. Viviroli, D.; Dürr, H.H.; Messerli, B.; Meybeck, M.; Weingartner, R. Mountains of the world, water towers for humanity: Typology, mapping, and global significance. Water Resour. Res. 2007, 43. [Google Scholar] [CrossRef] [Green Version]
  5. Zhou, Y.; Newman, C.; Chen, J.; Xie, Z.; Macdonald, D.W. Anomalous, extreme weather disrupts obligate seed dispersal mutualism: Snow in a subtropical forest ecosystem. Glob. Chang. Biol. 2013, 19, 2867–2877. [Google Scholar] [CrossRef]
  6. Thirel, G.; Salamon, P.; Burek, P.; Kalas, M. Assimilation of MODIS snow cover area data in a distributed hydrological model using the particle filter. Remote Sens. 2013, 5, 5825–5850. [Google Scholar] [CrossRef] [Green Version]
  7. Tekeli, A.E.; Akyürek, Z.; Şorman, A.A.; Şensoy, A.; Şorman, A.Ü. Using MODIS snow cover maps in modeling snowmelt runoff process in the eastern part of Turkey. Remote Sens. Environ. 2005, 97, 216–230. [Google Scholar] [CrossRef]
  8. Immerzeel, W.W.; Droogers, P.; De Jong, S.; Bierkens, M. Large-scale monitoring of snow cover and runoff simulation in Himalayan river basins using remote sensing. Remote Sens. Environ. 2009, 113, 40–49. [Google Scholar] [CrossRef]
  9. Bolch, T.; Kulkarni, A.; Kääb, A.; Huggel, C.; Paul, F.; Cogley, J.G.; Frey, H.; Kargel, J.S.; Fujita, K.; Scheel, M. The state and fate of Himalayan glaciers. Science 2012, 336, 310–314. [Google Scholar] [CrossRef] [Green Version]
  10. Liniger, H.; Weingartner, R.; Grosjean, M. Mountains of the World: Water Towers for the 21st Century; Mountain Agenda c/o Institute of geography University of Berne: Berne, Switzerland, 1998. [Google Scholar]
  11. Sharma, V.; Mishra, V.D.; Joshi, P.K. Implications of climate change on streamflow of a snow-fed river system of the Northwest Himalaya. J. Mountain Sci. 2013, 10, 574–587. [Google Scholar] [CrossRef] [Green Version]
  12. Pachauri, R.K.; Reisinger, A. Climate Change 2007: Synthesis report. In Contribution of Working Groups I, II and III to the Fourth Assessment Report of the Intergovernmental Panel on Climate Change; IPCC: Geneva, Switzerland, 2008; p. 104. [Google Scholar]
  13. Adam, J.C.; Hamlet, A.F.; Lettenmaier, D.P. Implications of global climate change for snowmelt hydrology in the twenty-first century. Hydrol. Process. Int. J. 2009, 23, 962–972. [Google Scholar] [CrossRef]
  14. Bookhagen, B.; Burbank, D.W. Toward a complete Himalayan hydrological budget: Spatiotemporal distribution of snowmelt and rainfall and their impact on river discharge. J. Geophys. Res. Earth Surf. 2010, 115. [Google Scholar] [CrossRef] [Green Version]
  15. IPCC. Climate Change 2007: Impacts, Adaptation and Vulnerability; Cambridge University Press: Cambridge, UK, 2007. [Google Scholar]
  16. Xu, A.; Jiang, Z.; Li, C.; Guo, J.; Da, S.; Cui, Q.; Yu, S.; Wu, G. Status and conservation of the snow leopard Panthera uncia in the Gouli Region, Kunlun Mountains, China. Oryx 2008, 42, 460–463. [Google Scholar] [CrossRef] [Green Version]
  17. Gleick, P.H. The development and testing of a water balance model for climate impact assessment: Modeling the Sacramento basin. Water Resour. Res. 1987, 23, 1049–1061. [Google Scholar] [CrossRef]
  18. Kour, R.; Patel, N.; Krishna, A.P. Estimation of snowmelt runoff in Chenab basin, western Himalayas. In Climate Change & Himalayan Ecosystem-Indicator, Bio & Water Resources; Scientific Publishers: Jodhpur, India, 2013; pp. 21–34. ISBN 9386237644. [Google Scholar]
  19. Singh, P.; Spitzbart, G.; Hübl, H.; Weinmeister, H. Hydrological response of snowpack under rain-on-snow events: A field study. J. Hydrol. 1997, 202, 1–20. [Google Scholar] [CrossRef]
  20. Shen, S.S.; Yao, R.; Ngo, J.; Basist, A.M.; Thomas, N.; Yao, T. Characteristics of the Tibetan Plateau snow cover variations based on daily data during 1997–2011. Theor. Appl. Climatol. 2015, 120, 445–453. [Google Scholar] [CrossRef]
  21. Kour, R.; Patel, N.; Krishna, A.P. Assessment of relationship between snow cover characteristics (SGI and SCI) and snow cover indices (NDSI and S3). Earth Sci. Inform. 2015, 8, 317–326. [Google Scholar] [CrossRef]
  22. Jonas, T.; Marty, C.; Magnusson, J. Estimating the snow water equivalent from snow depth measurements in the Swiss Alps. J. Hydrol. 2009, 378, 161–167. [Google Scholar] [CrossRef]
  23. Derksen, C.; LeDrew, E. Variability and change in terrestrial snow cover: Data acquisition and links to the atmosphere. Prog. Phys. Geogr. 2000, 24, 469–498. [Google Scholar] [CrossRef]
  24. Dozier, J.; Painter, T.H. Multispectral and hyperspectral remote sensing of alpine snow properties. Annu. Rev. Earth Planet. Sci. 2004, 32, 465–494. [Google Scholar] [CrossRef] [Green Version]
  25. König, M.; Winther, J.G.; Isaksson, E. Measuring snow and glacier ice properties from satellite. Rev. Geophys. 2001, 39, 1–27. [Google Scholar] [CrossRef]
  26. Rakwatin, P.; Takeuchi, W.; Yasuoka, Y. Restoration of Aqua MODIS band 6 using histogram matching and local least squares fitting. IEEE Trans. Geosci. Remote Sens. 2008, 47, 613–627. [Google Scholar] [CrossRef]
  27. Tang, B.-H.; Shrestha, B.; Li, Z.-L.; Liu, G.; Ouyang, H.; Gurung, D.R.; Giriraj, A.; San Aung, K. Determination of snow cover from MODIS data for the Tibetan Plateau region. Int. J. Appl. Earth Obs. Geoinf. 2013, 21, 356–365. [Google Scholar] [CrossRef]
  28. Salomonson, V.V.; Appel, I. Estimating fractional snow cover from MODIS using the normalized difference snow index. Remote Sens. Environ. 2004, 89, 351–360. [Google Scholar] [CrossRef]
  29. Zhang, H.; Zhang, F.; Zhang, G.; Che, T.; Yan, W.; Ye, M.; Ma, N. Ground-based evaluation of MODIS snow cover product V6 across China: Implications for the selection of NDSI threshold. Sci. Total Environ. 2019, 651, 2712–2726. [Google Scholar] [CrossRef]
  30. Mishra, V.; Negi, H.; Rawat, A.; Chaturvedi, A.; Singh, R. Retrieval of sub-pixel snow cover information in the Himalayan region using medium and coarse resolution remote sensing data. Int. J. Remote Sens. 2009, 30, 4707–4731. [Google Scholar] [CrossRef]
  31. Molotch, N.P.; Margulis, S.A. Estimating the distribution of snow water equivalent using remotely sensed snow cover data and a spatially distributed snowmelt model: A multi-resolution, multi-sensor comparison. Adv. Water Resour. 2008, 31, 1503–1514. [Google Scholar] [CrossRef]
  32. Hassan, Q.K.; Sekhon, N.S.; Magai, R.; McEachern, P. Reconstruction of snow water equivalent and snow depth using remote sensing data. J. Environ. Inform. 2012, 20, 67–74. [Google Scholar] [CrossRef]
  33. Kulkarni, A.; Singh, S.; Mathur, P.; Mishra, V. Algorithm to monitor snow cover using AWiFS data of RESOURCESAT-1 for the Himalayan region. Int. J. Remote Sens. 2006, 27, 2449–2457. [Google Scholar] [CrossRef]
  34. Hall, D.; Foster, J.; Verbyla, D.; Klein, A.; Benson, C. Assessment of snow-cover mapping accuracy in a variety of vegetation-cover densities in central Alaska. Remote Sens. Environ. 1998, 66, 129–137. [Google Scholar] [CrossRef]
  35. Hall, D.K.; Riggs, G.A.; Salomonson, V.V.; Barton, J.; Casey, K.; Chien, J.; DiGirolamo, N.; Klein, A.; Powell, H.; Tait, A. Algorithm Theoretical Basis Document (ATBD) for the MODIS Snow and Sea Ice-Mapping Algorithms. National Aeronautics and Space Administration, Goddard Space Flight Center, 2001. Available online: https://eospso.gsfc.nasa.gov/sites/default/files/atbd/atbd_mod10.pdf (accessed on 17 July 2020).
  36. Hall, D.K.; Riggs, G.A.; Salomonson, V.V.; DiGirolamo, N.E.; Bayr, K.J. MODIS snow-cover products. Remote Sens. Environ. 2002, 83, 181–194. [Google Scholar] [CrossRef] [Green Version]
  37. Ji, L.; Zhang, L.; Wylie, B. Analysis of dynamic thresholds for the normalized difference water index. Photogramm. Eng. Remote Sens. Environ. 2009, 75, 1307–1317. [Google Scholar] [CrossRef]
  38. Adam, E.; Mutanga, O.; Rugege, D. Multispectral and hyperspectral remote sensing for identification and mapping of wetland vegetation: A review. Wetl. Ecol. Manag. 2010, 18, 281–296. [Google Scholar] [CrossRef]
  39. Singh, K.V.; Setia, R.; Sahoo, S.; Prasad, A.; Pateriya, B. Evaluation of NDWI and MNDWI for assessment of waterlogging by integrating digital elevation model and groundwater level. Geocarto Int. 2015, 30, 650–661. [Google Scholar] [CrossRef]
  40. Butt, M.J.; Bilal, M. Application of snowmelt runoff model for water resource management. Hydrol. Process. 2011, 25, 3735–3747. [Google Scholar] [CrossRef]
  41. Czyzowska-Wisniewski, E.H.; van Leeuwen, W.J.; Hirschboeck, K.K.; Marsh, S.E.; Wisniewski, W.T. Fractional snow cover estimation in complex alpine-forested environments using an artificial neural network. Remote Sens. Environ. 2015, 156, 403–417. [Google Scholar] [CrossRef]
  42. Dozier, J. Spectral signature of alpine snow cover from the Landsat Thematic Mapper. Remote Sens. Environ. 1989, 28, 9–22. [Google Scholar] [CrossRef]
  43. Foster, J.L.; Hall, D.K.; Eylander, J.B.; Riggs, G.A.; Nghiem, S.V.; Tedesco, M.; Kim, E.; Montesano, P.M.; Kelly, R.E.; Casey, K.A. A blended global snow product using visible, passive microwave and scatterometer satellite data. Int. J. Remote Sens. 2011, 32, 1371–1395. [Google Scholar] [CrossRef]
  44. Sauter, T.; Weitzenkamp, B.; Schneider, C. Spatio-temporal prediction of snow cover in the Black Forest mountain range using remote sensing and a recurrent neural network. Int. J. Climatol. 2010, 30, 2330–2341. [Google Scholar] [CrossRef]
  45. Klein, A.G.; Hall, D.K.; Riggs, G.A. Improving snow cover mapping in forests through the use of a canopy reflectance model. Hydrol. Process. 1998, 12, 1723–1744. [Google Scholar] [CrossRef]
  46. Ault, T.W.; Czajkowski, K.P.; Benko, T.; Coss, J.; Struble, J.; Spongberg, A.; Templin, M.; Gross, C. Validation of the MODIS snow product and cloud mask using student and NWS cooperative station observations in the Lower Great Lakes Region. Remote Sens. Environ. 2006, 105, 341–353. [Google Scholar] [CrossRef]
  47. Xin, Q.; Woodcock, C.E.; Liu, J.; Tan, B.; Melloh, R.A.; Davis, R.E. View angle effects on MODIS snow mapping in forests. Remote Sens. Environ. 2012, 118, 50–59. [Google Scholar] [CrossRef] [Green Version]
  48. Logar, A.M.; Lloyd, D.E.; Corwin, E.M.; Penaloza, M.L.; Feind, R.E.; Berendes, T.A.; Kuo, K.-S.; Welch, R.M. The ASTER polar cloud mask. IEEE Trans. Geosci. Remote Sens. 1998, 36, 1302–1312. [Google Scholar] [CrossRef]
  49. Franya, G.; Cracknell, A. A simple cloud masking approach using NOAA AVHRR daytime data for tropical areas. Int. J. Remote Sens. 1995, 16, 1697–1705. [Google Scholar] [CrossRef]
  50. Riggs, G.A.; Hall, D.K. Snow mapping with the MODIS Aqua instrument. In Proceedings of the 61st Eastern Snow Conference, Portland, ME, USA, 9 June 2004; pp. 9–11. [Google Scholar]
  51. Romanov, P.; Gutman, G.; Csiszar, I. Automated monitoring of snow cover over North America with multispectral satellite data. J. Appl. Meteorol. 2000, 39, 1866–1880. [Google Scholar] [CrossRef]
  52. Swain, P.H.; Davis, S.M. Remote sensing: The quantitative approach. IEEE Trans. Pattern Anal. Mach. Intell. 1981, 3, 713–714. [Google Scholar] [CrossRef]
  53. Ahmad, A.; Burhanuddin, M.A.; Khanapi, M.A.G.; Sazalinsyah, R.; Saari, M.I.; Hashim, M.N. A Localised cloud detection and masking method using spectral analysis. Aust. J. Basic Appl. Sci. 2013, 7, 3–10. [Google Scholar]
  54. Atif, I.; Iqbal, J.; Mahboob, M.A. Investigating Snow Cover and Hydrometeorological Trends in Contrasting Hydrological Regimes of the Upper Indus Basin. Atmosphere 2018, 9, 162. [Google Scholar] [CrossRef] [Green Version]
  55. Tahir, A.A.; Chevallier, P.; Arnaud, Y.; Ahmad, B. Snow cover dynamics and hydrological regime of the Hunza River basin, Karakoram Range, Northern Pakistan. Hydrol. Earth Syst. Sci. 2011, 15, 2275–2290. [Google Scholar] [CrossRef] [Green Version]
  56. Hasson, S.; Lucarini, V.; Khan, M.R.; Petitta, M.; Bolch, T.; Gioli, G. Early 21st century snow cover state over the western river basins of the Indus River system. Hydrol. Earth Syst. Sci. 2014, 18, 4077–4100. [Google Scholar] [CrossRef] [Green Version]
  57. Vermote, E.; Kotchenova, S.; Ray, J. MODIS surface reflectance user’s guide. In MODIS Land Surface Reflectance Science Computing Facility; National Aeronautics and Space Administration: Washington, DC, USA, 2011. [Google Scholar]
  58. Riggs, G.A.; Hall, D.K.; Salomonson, V.V. MODIS snow products user guide to collection 5. Digit. Media 2006, 80, 1–80. [Google Scholar]
  59. Lin, J.; Feng, X.; Xiao, P.; Li, H.; Wang, J.; Li, Y. Comparison of snow indexes in estimating snow cover fraction in a mountainous area in northwestern China. IEEE Geosci. Remote Sens. Lett. 2012, 9, 725–729. [Google Scholar]
  60. McFeeters, S.K. The use of the Normalized Difference Water Index (NDWI) in the delineation of open water features. Int. J. Remote Sens. 1996, 17, 1425–1432. [Google Scholar] [CrossRef]
  61. Yao, T.; Thompson, L.; Yang, W.; Yu, W.; Gao, Y.; Guo, X.; Yang, X.; Duan, K.; Zhao, H.; Xu, B. Different glacier status with atmospheric circulations in Tibetan Plateau and surroundings. Nat. Clim. Chang. 2012, 2, 663. [Google Scholar] [CrossRef]
  62. Chen, Y.; Huang, C.; Ticehurst, C.; Merrin, L.; Thew, P. An evaluation of MODIS daily and 8-day composite products for floodplain and wetland inundation mapping. Wetlands 2013, 33, 823–835. [Google Scholar] [CrossRef]
  63. Rittger, K.; Painter, T.H.; Dozier, J. Assessment of methods for mapping snow cover from MODIS. Adv. Water Resour. 2013, 51, 367–380. [Google Scholar] [CrossRef]
  64. Ackerman, S.A.; Strabala, K.I.; Menzel, W.P.; Frey, R.A.; Moeller, C.C.; Gumley, L.E. Discriminating clear sky from clouds with MODIS. J. Geophys. Res. Atmos. 1998, 103, 32141–32157. [Google Scholar] [CrossRef]
  65. Notarnicola, C.; Duguay, M.; Moelg, N.; Schellenberger, T.; Tetzlaff, A.; Monsorno, R.; Costa, A.; Steurer, C.; Zebisch, M. Snow cover maps from MODIS images at 250 m resolution, Part 1: Algorithm description. Remote Sens. 2013, 5, 110–126. [Google Scholar] [CrossRef] [Green Version]
  66. Malcher, P.; Floricioiu, D.; Rott, H. Snow mapping in Alpine areas using medium resolution spectrometric sensors. In Proceedings of the IGARSS 2003 IEEE International Geoscience and Remote Sensing Symposium, Toulouse, France, 21–25 July 2003; pp. 2835–2837. [Google Scholar]
  67. Kaufman, Y.; Tanré, D.; Gordon, H.; Nakajima, T.; Lenoble, J.; Frouin, R.; Grassl, H.; Herman, B.; King, M.; Teillet, P. Passive remote sensing of tropospheric aerosol and atmospheric correction for the aerosol effect. J. Geophys. Res. Atmos. 1997, 102, 16815–16830. [Google Scholar] [CrossRef] [Green Version]
  68. Liu, Y.; Key, J.R.; Frey, R.A.; Ackerman, S.A.; Menzel, W.P. Nighttime polar cloud detection with MODIS. Remote Sens. Environ. 2004, 92, 181–194. [Google Scholar] [CrossRef]
  69. Ahmad, A.; Quegan, S. Cloud masking for remotely sensed data using spectral and principal components analysis. Eng. Technol. Appl. Sci. Res. 2012, 2, 221–225. [Google Scholar]
  70. Saunders, R. An automated scheme for the removal of cloud contamination from AVHRR radiances over western Europe. Int. J. Remote Sens. 1986, 7, 867–886. [Google Scholar] [CrossRef]
  71. Saunders, R.W.; Kriebel, K.T. An improved method for detecting clear sky and cloudy radiances from AVHRR data. Int. J. Remote Sens. 1988, 9, 123–150. [Google Scholar] [CrossRef]
  72. Farr, T.G.; Rosen, P.A.; Caro, E.; Crippen, R.; Duren, R.; Hensley, S.; Kobrick, M.; Paller, M.; Rodriguez, E.; Roth, L. The shuttle radar topography mission. Rev. Geophys. 2007, 45. [Google Scholar] [CrossRef] [Green Version]
  73. Fisher, G.B.; Amos, C.B.; Bookhagen, B.; Burbank, D.W.; Godard, V. Channel widths, landslides, faults, and beyond: The new world order of high-spatial resolution Google Earth imagery in the study of earth surface processes. Geol. Soc. Am. Spec. Pap. 2012, 492, 1–22. [Google Scholar]
  74. Yan, D.; Huang, C.; Ma, N.; Zhang, Y. Improved Landsat-BasedWater and Snow Indices for Extracting Lake and Snow Cover/Glacier in the Tibetan Plateau. Water 2020, 12, 1339. [Google Scholar] [CrossRef]
  75. Schmid, M.-O.; Baral, P.; Gruber, S.; Shahi, S.; Shrestha, T.; Stumm, D.; Wester, P. Assessment of permafrost distribution maps in the Hindu Kush Himalayan region using rock glaciers mapped in Google Earth. Cryosphere 2015, 9. [Google Scholar] [CrossRef] [Green Version]
  76. Dong, Z.; Qin, D.; Kang, S.; Ren, J.; Chen, J.; Cui, X.; Du, Z.; Qin, X. Physicochemical characteristics and sources of atmospheric dust deposition in snow packs on the glaciers of western Qilian Mountains, China. Tellus B Chem. Phys. Meteorol. 2014, 66, 20956. [Google Scholar] [CrossRef] [Green Version]
  77. Lee, S.; Klein, A.G.; Over, T.M. A comparison of MODIS and NOHRSC snow-cover products for simulating streamflow using the Snowmelt Runoff Model. Hydrol. Process. Int. J. 2005, 19, 2951–2972. [Google Scholar] [CrossRef]
  78. Wang, L.; Sharp, M.; Brown, R.; Derksen, C.; Rivard, B. Evaluation of spring snow covered area depletion in the Canadian Arctic from NOAA snow charts. Remote Sens. Environ. 2005, 95, 453–463. [Google Scholar] [CrossRef]
  79. Rango, A.; Landesa, E.; Bleiweiss, M. Comparative satellite capabilities for remote sensing of snow cover in the Rio Grande basin. In Proceedings of the 70th Western Snow Conference, Sol Vista, CO, USA, 20–23 May 2002; pp. 21–26. [Google Scholar]
  80. Marchane, A.; Jarlan, L.; Hanich, L.; Boudhar, A.; Gascoin, S.; Tavernier, A.; Filali, N.; Le Page, M.; Hagolle, O.; Berjamy, B. Assessment of daily MODIS snow cover products to monitor snow cover dynamics over the Moroccan Atlas mountain range. Remote Sens. Environ. 2015, 160, 72–86. [Google Scholar] [CrossRef]
  81. Klein, A.G.; Barnett, A.C. Validation of daily MODIS snow cover maps of the Upper Rio Grande River Basin for the 2000–2001 snow year. Remote Sens. Environ. 2003, 86, 162–176. [Google Scholar] [CrossRef]
  82. Houborg, R.; Soegaard, H.; Boegh, E. Combining vegetation index and model inversion methods for the extraction of key vegetation biophysical parameters using Terra and Aqua MODIS reflectance data. Remote Sens. Environ. 2007, 106, 39–58. [Google Scholar] [CrossRef]
  83. Liang, T.G.; Huang, X.D.; Wu, C.X.; Liu, X.Y.; Li, W.L.; Guo, Z.G.; Ren, J.Z. An application of MODIS data to snow cover monitoring in a pastoral area: A case study in Northern Xinjiang, China. Remote Sens. Environ. 2008, 112, 1514–1526. [Google Scholar] [CrossRef]
  84. Şorman, A.; Akyürek, Z.; Şensoy, A.; Şorman, A.; Tekeli, A. Commentary on comparison of MODIS snow cover and albedo products with ground observations over the mountainous terrain of Turkey. Hydrol. Earth Syst. Sci. 2007, 11, 1353–1360. [Google Scholar] [CrossRef] [Green Version]
  85. Yang, W.; Shabanov, N.; Huang, D.; Wang, W.; Dickinson, R.; Nemani, R.; Knyazikhin, Y.; Myneni, R. Analysis of leaf area index products from combination of MODIS Terra and Aqua data. Remote Sens. Environ. 2006, 104, 297–312. [Google Scholar] [CrossRef]
  86. Gao, Y.; Xie, H.; Yao, T.; Xue, C. Integrated assessment on multi-temporal and multi-sensor combinations for reducing cloud obscuration of MODIS snow cover products of the Pacific Northwest USA. Remote Sens. Environ. 2010, 114, 1662–1675. [Google Scholar] [CrossRef]
  87. Hall, D.K.; Riggs, G.A. Accuracy assessment of the MODIS snow products. Hydrol. Process. Int. J. 2007, 21, 1534–1547. [Google Scholar] [CrossRef]
  88. Huang, Y.; Liu, H.; Yu, B.; Wu, J.; Kang, E.L.; Xu, M.; Wang, S.; Klein, A.; Chen, Y. Improving MODIS snow products with a HMRF-based spatio-temporal modeling technique in the Upper Rio Grande Basin. Remote Sens. Environ. 2018, 204, 568–582. [Google Scholar] [CrossRef]
  89. Jain, S.K.; Goswami, A.; Saraf, A. Accuracy assessment of MODIS, NOAA and IRS data in snow cover mapping under Himalayan conditions. Int. J. Remote Sens. 2008, 29, 5863–5878. [Google Scholar] [CrossRef]
  90. Shimamura, Y.; Izumi, T.; Matsuyama, H. Evaluation of a useful method to identify snow-covered areas under vegetation–comparisons among a newly proposed snow index, normalized difference snow index, and visible reflectance. Int. J. Remote Sens. 2006, 27, 4867–4884. [Google Scholar] [CrossRef]
  91. Li, W.; Du, Z.; Ling, F.; Zhou, D.; Wang, H.; Gui, Y.; Sun, B.; Zhang, X. A comparison of land surface water mapping using the normalized difference water index from TM, ETM+ and ALI. Remote Sens. 2013, 5, 5530–5549. [Google Scholar] [CrossRef] [Green Version]
  92. Lu, S.; Wu, B.; Yan, N.; Wang, H. Water body mapping method with HJ-1A/B satellite imagery. Int. J. Appl. Earth Obs. Geoinf. 2011, 13, 428–434. [Google Scholar] [CrossRef]
  93. Vikhamar, D.; Solberg, R. Subpixel mapping of snow cover in forests by optical remote sensing. Remote Sens. Environ. 2003, 84, 69–82. [Google Scholar] [CrossRef]
  94. Cao, Y.-G.; Liu, C. Normalized difference snow index simulation for snow-cover mapping in forest by geosail model. Chin. Geogr. Sci. 2006, 16, 171–175. [Google Scholar] [CrossRef]
  95. Poon, S.K.; Valeo, C. Investigation of the MODIS snow mapping algorithm during snowmelt in the northern boreal forest of Canada. Can. J. Remote Sens. 2006, 32, 254–267. [Google Scholar] [CrossRef]
  96. Parajka, J.; Blöschl, G. Spatio-temporal combination of MODIS images–potential for snow cover mapping. Water Resour. Res. 2008, 44. [Google Scholar] [CrossRef]
  97. Song, X.; Liu, Z.; Zhao, Y. Cloud detection and analysis of MODIS image. In Proceedings of the IGARSS 2004 IEEE International Geoscience and Remote Sensing Symposium, Anchorage, AK, USA, 20–24 September 2004; pp. 2764–2767. [Google Scholar]
  98. Zhu, Z.; Woodcock, C.E. Automated cloud, cloud shadow, and snow detection in multitemporal Landsat data: An algorithm designed specifically for monitoring land cover change. Remote Sens. Environ. 2014, 152, 217–234. [Google Scholar] [CrossRef]
  99. Liu, R.; Liu, Y. Generation of new cloud masks from MODIS land surface reflectance products. Remote Sens. Environ. 2013, 133, 21–37. [Google Scholar] [CrossRef]
  100. Parmes, E.; Rauste, Y.; Molinier, M.; Andersson, K.; Seitsonen, L. Automatic cloud and shadow detection in optical satellite imagery without using thermal bands—Application to Suomi NPP VIIRS images over Fennoscandia. Remote Sens. 2017, 9, 806. [Google Scholar] [CrossRef] [Green Version]
  101. Immerzeel, W.W.; Van Beek, L.P.; Bierkens, M.F. Climate change will affect the Asian water towers. Science 2010, 328, 1382–1385. [Google Scholar] [CrossRef] [PubMed]
  102. Romshoo, S.A.; Dar, R.A.; Rashid, I.; Marazi, A.; Ali, N.; Zaz, S.N. Implications of shrinking cryosphere under changing climate on the streamflows in the Lidder catchment in the Upper Indus Basin, India. Arct. Antarct. Alp. Res. 2015, 47, 627–644. [Google Scholar] [CrossRef]
  103. Immerzeel, W.; Droogers, P.; de Jong, S.; Bierkens, M. Satellite derived snow and runoff dynamics in the Upper Indus River basin. Grazer Schr. Geogr. Und Raumforsch. 2010, 45, 303–312. [Google Scholar]
  104. Fowler, H.; Archer, D. Conflicting signals of climatic change in the Upper Indus Basin. J. Clim. 2006, 19, 4276–4293. [Google Scholar] [CrossRef] [Green Version]
  105. Rajbhandari, R.; Shrestha, A.; Kulkarni, A.; Patwardhan, S.; Bajracharya, S. Projected changes in climate over the Indus river basin using a high resolution regional climate model (PRECIS). Clim. Dyn. 2015, 44, 339–357. [Google Scholar] [CrossRef] [Green Version]
  106. Kargel, J.S.; Abrams, M.J.; Bishop, M.P.; Bush, A.; Hamilton, G.; Jiskoot, H.; Kääb, A.; Kieffer, H.H.; Lee, E.M.; Paul, F. Multispectral imaging contributions to global land ice measurements from space. Remote Sens. Environ. 2005, 99, 187–219. [Google Scholar] [CrossRef]
  107. Singh, P.; Bengtsson, L. Effect of warmer climate on the depletion of snow-covered area in the Satluj basin in the western Himalayan region. Hydrol. Sci. J. 2003, 48, 413–425. [Google Scholar] [CrossRef]
  108. Negi, H.; Thakur, N.; Kumar, R.; Kumar, M. Monitoring and evaluation of seasonal snow cover in Kashmir valley using remote sensing, GIS and ancillary data. J. Earth Syst. Sci. 2009, 118, 711–720. [Google Scholar] [CrossRef]
  109. Romshoo, S.A.; Rashid, I. Potential and constraints of geospatial data for precise assessment of the impacts of climate change at landscape level. Int. J. Geomat. Geosci. 2010, 1, 386–405. [Google Scholar]
  110. IPCC. Climate Change 2007: The Scientifi Basis; Cambridge University Press: Cambridge, UK, 2007. [Google Scholar]
Figure 1. Topography of the transboundary Indus basin and its sub-catchments. Black lines, labeled from one to seven, are the rivers of the Indus basin. Red sites, labeled from one to 13, are the meteorological stations of Pakistan Meteorological Department for in situ snow data.
Remotesensing 12 02782 g001
Figure 2. (a,b) Water bodies delineation using MODIS daily (MOD09GA) product and comparison with Google Earth imagery. (c) Forest and vegetation mask developed using MODIS MOD09GA. (d) Blended cloud mask prepared using MODIS (MOD09GA and MOD021km) reflection and thermal bands.
Remotesensing 12 02782 g002
Figure 3. Comparison of two scenes of MOD09GA and MOD09A1 with Landsat ETM+ coarsened to 500-m resolution for 1 January 2009.
Remotesensing 12 02782 g003
Figure 4. (ad): Comparison of snow cover area delineated by MODIS MOD09GA and MOD09A1 products over the Indus basin and its rivers’ catchments.
Remotesensing 12 02782 g004
Figure 5. (af): Comparison of snow cover area delineated using MOD09GA product for 2008 and 2018 for the Chenab, Jhelum and Indus river catchment.
Remotesensing 12 02782 g005
Figure 6. Annual time series trends of snow cover area estimated using MODIS MOD09GA and MOD09A1 products for the Indus basin and its rivers’ catchments.
Remotesensing 12 02782 g006
Figure 7. Time series snow cover trends from 2008 to 2018 for both the MODIS MOD09GA and MOD09A1 products. River catchment: (a) Chenab, (b) Jhelum, (c) eastern, (d) Indus and (e) Indus basin.
Remotesensing 12 02782 g007
Figure 8. Maximum snow cover trends of MODIS MOD09GA and MOD09A1 products from 2008 to 2018. The catchments represent: (a,b) Chenab river, (c,d) Jhelum river, (e,f) Indus river, (g,h) eastern rivers and (i,j) Indus basin.
Remotesensing 12 02782 g008
Figure 9. (ae). Intercomparison of MOD09GA and MOD09A1 time series snow cover area from 2008 to 2018 for Indus basin and its sub-catchments.
Remotesensing 12 02782 g009
Table 1. Spectral band information of Moderate Resolution Imaging Spectroradiometer (MODIS) and Landsat Enhanced Thematic Mapper Plus (ETM+) used in this study.
Serial No.MOD09GA and MOD09A1Landsat ETM+
BandColorWavelength µmBandColorWavelength µm
1SR B01Red0.620–0.670SR B01Blue0.45–0.515
2SR B02NIR10.841–0.876SR B02Green0.525–0.605
3SR B03Blue0.459–0.479SR B03Red0.63–0.69
4SR B04Green0.545–0.565SR B04NIR0.775–0.90
5SR B05NIR1.230–1.250SR B05MIR1.55–1.75
6SR B06SWIR11.628–1.652SR B06Thermal10.4–12.5
7SR B07SWIR22.105–2.155SR B07MIR2.08–2.35
Table 2. Thresholds of MODIS-based reflectance and thermal bands for cloud and barren soil (sand) detection.
ProductBandThresholdBandThreshold
MOD09GA, MOD09A1Reflectance SWIR1>0.20 cloud
MOD09GA, MOD09A1Reflectance SWIR2>0.13 cloud
MOD09GA, MOD09A1Reflectance Blue>0.37 cloud
MOD09GA, MOD09A1Reflectance Blue<0.30 barren soil
MOD021 kmReflectance SWIR2
(2.105–2.155 µm)
>0.07 sandBT28 (7.175–7.475 µm)247 K
MOD021 kmReflectance NIR2
(1.360–1.390 µm)
>0.10 cloudBT29 (8.400–8.700 µm)251 K
MOD021 kmBT20 (3.660–3.840 µm)258 KBT30 (9.580–9.880 µm)241 K
MOD021 kmBT21 (3.929–3.989 µm)251 KBT31 (10.780–11.280 µm)248 K
MOD021 kmBT22 (3.929–3.989 µm)255 KBT32 (11.770–12.270 µm)250 K
MOD021 kmBT23 (4.020–4.080 µm)248 KBT33 (13.185–13.485 µm)246 K
MOD021 kmBT24 (4.433–4.498 µm)234 KBT34 (13.485–13.785 µm)239 K
MOD021 kmBT25 (4.482–4.549 µm)243 KBT35 (13.785–14.085 µm)236 K
MOD021 kmBT27 (6.535–6.895 µm)238 KBT36 (14.085–14.385 µm)225 K
Table 3. Statistical comparison of snow cover area of 120 scenes of MODIS MOD09GA and MOD09A1 products with Landsat ETM+, in situ snow data and Google Earth imagery for fixation of new Normalized Difference Snow Index (NDSI) threshold.
NDSI ThresholdMOD09GAMOD09A1
R2NSER2NSE
>0.30.870.780.850.74
>0.320.930.830.910.80
>0.340.980.890.970.85
>0.360.940.820.970.84
>0.380.970.840.950.83
>0.40.940.810.960.80
Table 4. Annual percent difference in maximum snow cover area of MOD09GA with respect to MOD09A1.
YearChenab River CatchmentJhelum River CatchmentIndus River CatchmentEastern Rivers’ CatchmentsIndus Basin
2008−1.25−1.21−2.3611.41−0.45
2009−8.00−8.87−3.32−4.68−4.35
2010−4.29−4.76−3.89−6.36−4.31
20113.614.04−2.563.10−0.72
20124.745.14−6.372.52−3.54
20137.338.403.323.174.00
20147.33−8.742.545.982.61
201510.656.011.815.903.20
201612.0911.911.71−0.772.82
20177.538.63−4.863.33−1.85
20182.320.54−3.676.46−1.57

