Article

Forest Cover Change Pattern after the Intervention of Community Forestry Management System in the Mid-Hill of Nepal: A Case Study

1
Faculty of Forestry, Agriculture and Forestry University, Hetauda, P.O. Box 13712, Nepal
2
Institute of Forestry, Tribhuvan University, Pokhara, P.O. Box 43, Nepal
3
Earth Change Observation Laboratory, Department of Geosciences and Geography, University of Helsinki, P.O. Box 68, FI-00014 Helsinki, Finland
4
Institute for Atmospheric and Earth System Research, Faculty of Science, University of Helsinki, P.O. Box 68, FI-00014 Helsinki, Finland
*
Author to whom correspondence should be addressed.
Remote Sens. 2020, 12(17), 2756; https://doi.org/10.3390/rs12172756
Submission received: 15 July 2020 / Revised: 14 August 2020 / Accepted: 24 August 2020 / Published: 25 August 2020
(This article belongs to the Special Issue Feature Paper Special Issue on Forest Remote Sensing)

Abstract

:
An account of widespread degradation and deforestation in Nepal has been noticed in various literature sources. Although the contribution of community forests (CF) on the improvement of forest cover and condition in the Mid-hill of Nepal is positive, detailed study to understand the current situation seems important. The study area (Tanahun District) lies in the Gandaki Province of western Nepal. The objective of this study was to estimate the forest cover change over the specified period and to identify factors influencing the change. We used Landsat images from the years 1976, 1991, and 2015 to classify land use and land cover. We considered community perception in addition to the forest cover map to understand the different causes of forest cover change. Forest cover decreased from 1976 to 1991 annually at a rate of 0.96%. After 1991, the forest increased annually at a rate of 0.63%. The overall forest cover in the district regained its original status. Factors related to increasing forest cover were emigration, occupation shift, agroforestry practices, as well as particularly by plantation on barren lands, awareness among forest users, and conservation activities conducted by local inhabitants after the government forest was handed over to community members as a community forest management system.

1. Introduction

Forest cover change processes include deforestation, afforestation, reforestation, forest degradation, and forest improvement (increase in canopy cover within forest) [1]. Land-use change by human activities has become a proximate factor that catalyzes forest cover change [2]. Hence, identifying the forest cover change at different spatial and temporal scales could provide useful information for planning and sustainable management of forests. The knowledge of the relationship between changes in human land use and the degree of forest degradation and deforestation is important for land use planning and management [3].
Nepal is a mountainous country where 86% of land area is occupied by hills and mountains. Rapid conversion of the land is a serious problem in both the Mid-hill and Terai regions. Forest resource assessment performed in different time periods revealed that forest area decreased until 1994, after which forest area increased. Forest cover in Nepal changed significantly in from 1965 until 2015. Forest resource assessment conducted in 1965 by United States Agency for International Development (USAID) reported 45.5% forest, which decreased to 42.7% in 1978/1979 as reported by Land Resource Mapping Project; this further decreased at 1.7% annually to 39.6% as reported by the National Forest Inventory [4]. Forest was converted into shrub and agricultural lands at 2.3% annually, especially in the hills. In the year 2015, forest area remained at 44.74%, as reported by forest resource assessment [5].
Forest loss in the Mid-hill of Nepal is governed by different factors, such as the conversion of forest land to agricultural or urban land, unplanned development activities, poor economic status of the people, and population growth. However, the trend of deforestation and forest degradation and socioeconomic development varies in the different spatial gradients of the area due to the differentiation of resource availability, their use and management, availability, and the condition of infrastructure, access to market, and the institutional ability to manage public resources [6].
Despite these problems, Nepal was an early leader among developing countries in initiating forest management programs aimed at involving people in local communities [7]. After 1993 with the Forest Act and Bufferzone Regulation, the Nepalese government has experimented with a variety of programs aimed at decentralizing forest management by involving local communities through community forest (CF) management. Furthermore, leasehold forestry, the park and people program [8], and buffer zone CFs were implemented. The park and people program and buffer zone CFs have focused its activities around the protected area, thus these programs are not able to address the problems that exist in Mid-hill. CF was the major implemented program in Mid-hill as leasehold forest only focuses on the poor community, which was not able to involve a diverse community. CF is the forest handed over to the community in the interest of community for the development, protection, and utilization of forest. With the introduction of the CF program, the area of forest cover has increased through an increase in tree plantation, improved forest management, and subsequent natural regeneration in CFs [8,9]. The rate of conversion of non-forest areas into forests and the rate of conversion of sparse forests into dense forests were found to be significantly higher in community-managed forests than other forest areas. Improvements in forest cover in terms of forest area and forest density are more prevalent in community-managed forests than in forests managed by other types of regimes [10].
Nepal’s CF program is acknowledged to be one of the most successful forest conservation initiatives in the world [10]. However, despite the success of this program and the importance of forests in supporting the livelihoods of the people of Nepal and providing ecosystem services to those downstream, there has been little research on land use and land cover (LULC) change. A comprehensive understanding of the changing patterns of land cover over the last few decades and its drivers at the national and sub-national levels is lacking. This lack of data and information has been one of the major limitations on policy and decision-making in addressing regional environmental issues, including development of greenhouse gas inventories, evolution of reducing emissions from deforestation and forest degradation (REDD+) mechanisms, assessment of land degradation, and optimal land use planning [11,12]. A case study from one CF in the Tanahun district by [13] shows that the forest stock of Tanahun district has more than the national average growing stock and forest condition is in an improving stage. As this was only a case study, there is a need to conduct a detailed study about the forest condition.
Satellite remote sensing has been widely used to detect forest change, assess rates of reforestation or deforestation, and update existing forest maps [14]. The Landsat satellite image archive provides access to images from the year 1972 [15], thus providing a unique opportunity to map land use and land cover. Repeated satellite images, aerial photographs, or both are useful for both visual assessments of natural resource dynamics occurring at a time and space as well as quantitative evaluation of land cover changes [16]. Analysis and presentation of such data can be greatly facilitated using Geographic Information Systems (GIS) technology [17,18,19]. Therefore, combined use of remote sensing and GIS technologies can be invaluable to address a wide variety of resource management problems, including the assessment of forest cover change and its causes.
Information on forest status and trends in the study area are limited. Understanding the land cover change, especially forest change, is urgently needed to both understand past development and as a basis for landscape-level planning to guide future conservation and development management interventions. The present study was designed to fill this gap and provide the first detailed information about forest change in the landscape in the study area.
This study aimed to utilize different remote sensing and GIS data to quantify spatial and temporal patterns of forest cover change in the Tanahun district of Nepal and to map and compare different LULC. Furthermore, this study aimed to understand people’s perceptions about these changes.

2. Materials and Methods
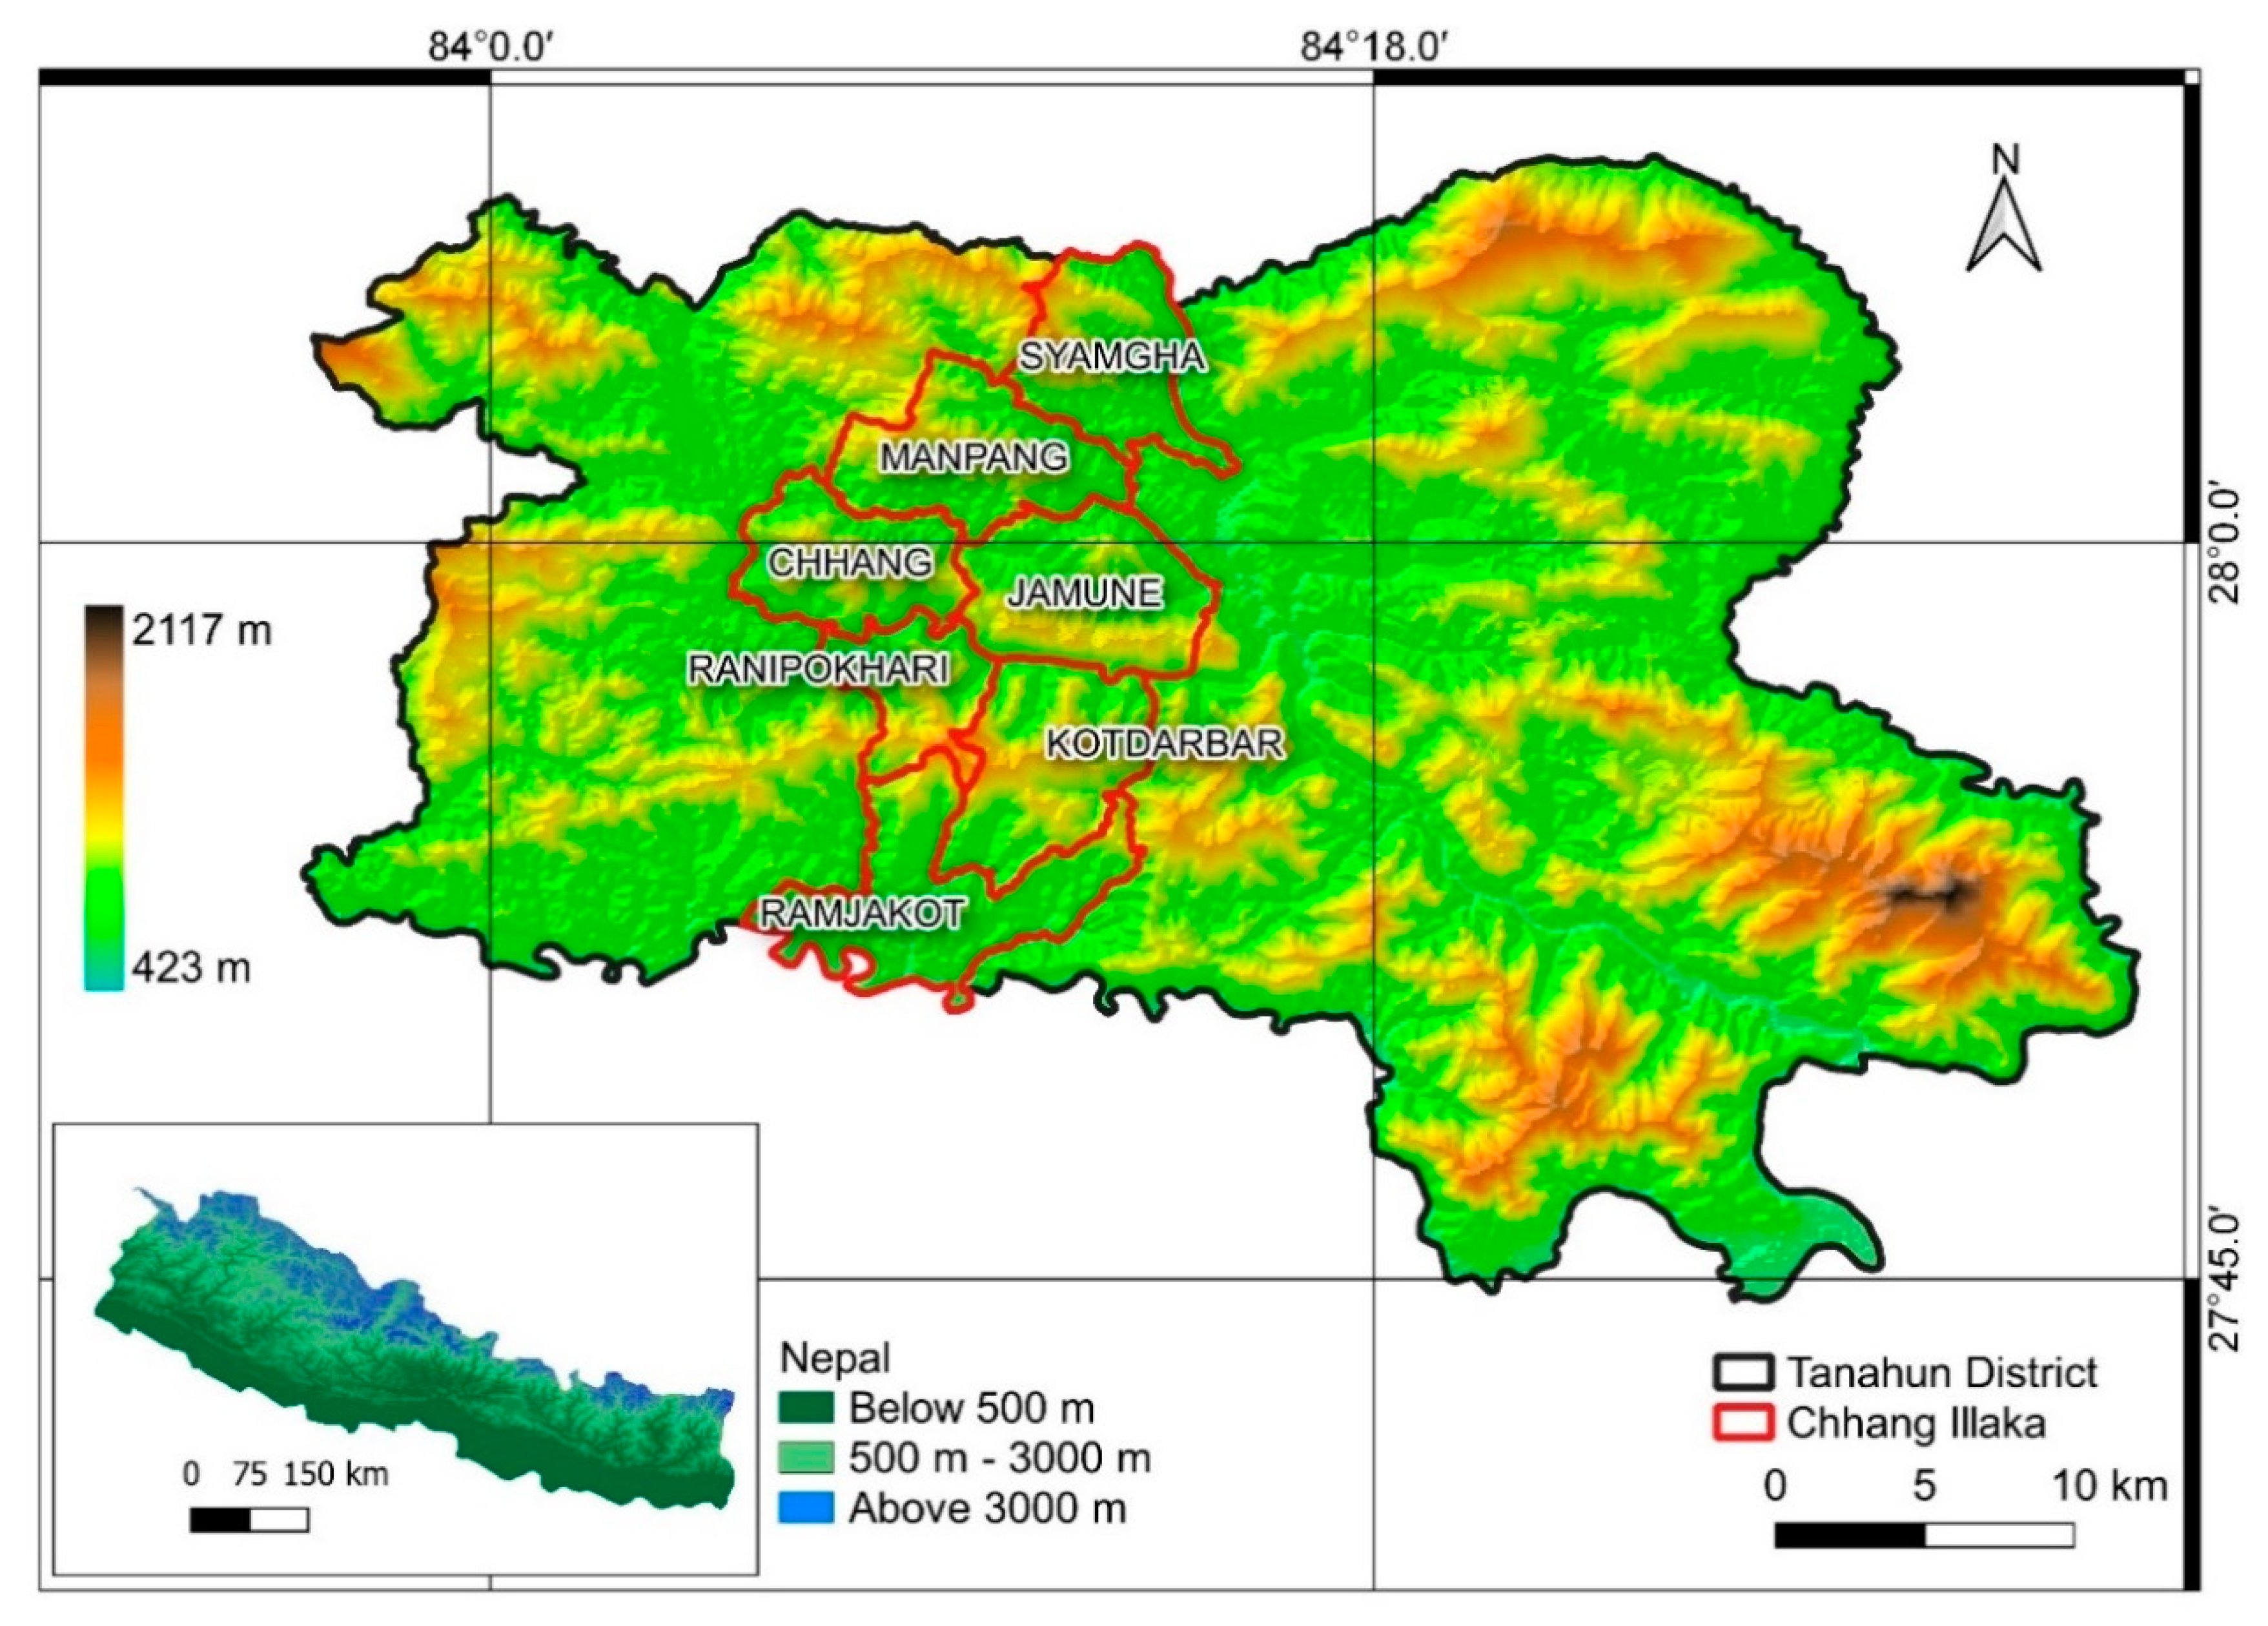
2.1. Study Area

The study area is located in the Tanahun District in Gandaki Province of western Nepal. The area covers 1546 km2. The Tanahun District lies at 423–2117 m above sea level (Figure 1). The climate is typically subtropical, temperate, and subalpine with a temperature range between 3 to 41 °C. The average annual rainfall is 1761 mm. The Tanahun District is one of the representative districts of the Mid-hill of Nepal, where CF has been successfully implemented to restore the degraded forest. The handover of national forest as a CF to the user group started in 1992. The handover process continued and in 2015 there were 587 CFs in existence (Figure 2). The Tanahun District has vegetation from tropical to subalpine. The forest vegetation in the district is dominated by Shorea robusta, Dalbergia sisso, Castonopsis indica, and Schima wallichi. Figure 2 shows that the annual CF handover started from 1992 and handover was maximum during 1994–1998 due to CF promotion-related government policy and projects during the initial phase.

2.2. Field Data

To obtain a general understanding of the land use and land cover status of the study area, a reconnaissance survey was conducted in September 2015. The field data were collected from 200 random locations and 600 Global Positioning System (GPS) points were obtained covering all LULC classes during fieldwork in the months of December and January 2015–2016. CF-related data were collected from the district forest office of Tanahun and during a focus group discussion (FGD) on a different CF group of Chhang village development committees (VDC).

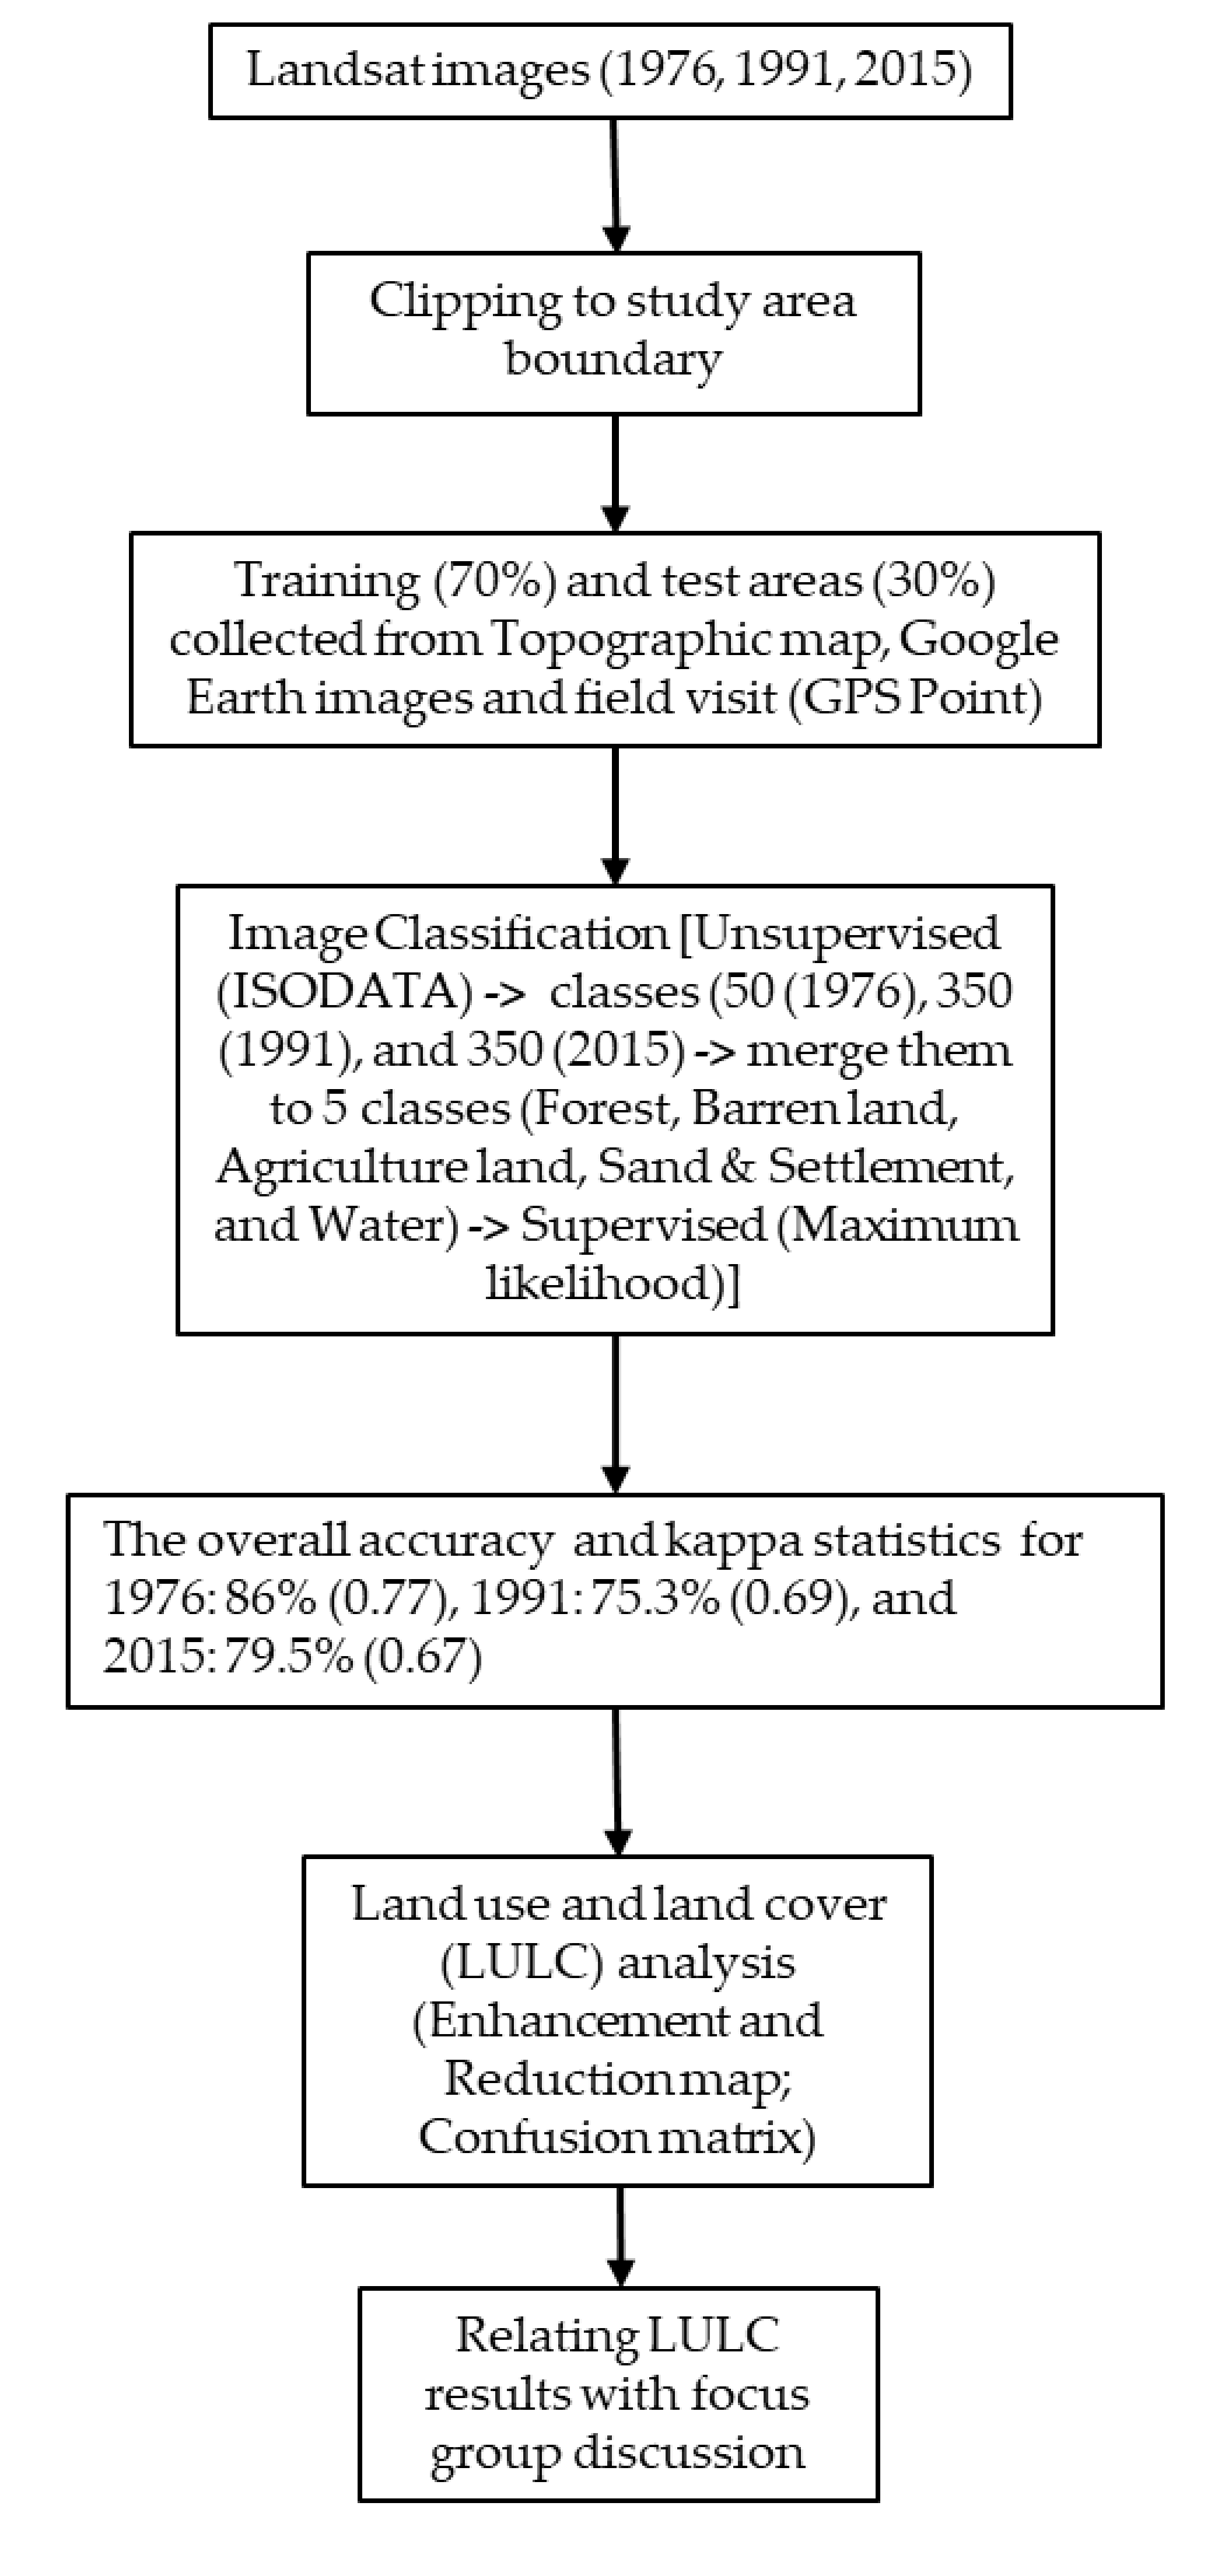
2.3. Satellite Imagery

The Landsat images were downloaded from the United States Geological Survey (USGS) Earth Explorer platform (www.earthexplorer.com). The data included surface reflectance bands in Landsat 2 Multispectral Scanner (MSS), Landsat 5 Thematic Mapper (TM), and Landsat 8 Operational Land Imager (OLI) images (Table 1). Topographic normalization did not improve LULC classification accuracy and additional voids were created due to voids available in Shuttle Radar Topography Mission (SRTM) and Advanced Spaceborne Thermal Emission and Reflection (ASTER) digital elevation model, thus no topographic normalization was performed on the Landsat images [20,21].

2.4. Image Classification and Accuracy Assessment

The year 1976 represents the initial condition of the forest cover. The year 1991 image was taken because this was the time of transition on the management regime of a forest. The forests managed by the Government of Nepal were legally handed over to the community by implementing the Forest Act in 1993. The year 2015 was selected to observe the present condition of the forest cover after the implementation of the community forest. A hybrid method of classification was used and combined unsupervised and supervised classification techniques [22]. Initially, an unsupervised Iterative Self-Organizing Data Analysis Technique (ISODATA) routine was run. About 50, 350, and 350 classes were assigned to MSS, TM, and OLI/TIRS, respectively, as MSS has low resolution (60 m) and TM and OLI have medium resolution (30 m) [23]. The pixel-based image classification was conducted using Earth Resource Data Analysis System (ERDAS) Imagine and the results were processed in ArcGIS 10.3 (manufactured by Environmental Systems Research Institute (ESRI), 380 New York Street, Redlands, CA 92373, USA) for change detection (Figure 3).
These classes were visually analyzed using swipe to visualize and assign specific class names. Spectral profile curves were used to examine the object’s reflection by electromagnetic radiation. Signatures of the classes were merged and leveled to represent specific land-cover classes. These were used as the basis for a supervised maximum likelihood classification of the individual images. The same processes were applied for all three images. Table 2 presents five LULC classes in the study area. The reflectance value of the urban area and sand on the riverbank were similar, so both classes were merged. All LULC maps were resampled to 30-m resolution for a wall-to-wall comparison.
User’s accuracy and Kappa coefficient were used for accuracy assessment. An accuracy assessment tool available on ERDAS Imagine software (manufactured by Hexagon’s Geospatial Division, 305 Intergraph Way, Madison, AL 35758, USA) was used to conduct statistical assessments of the accuracy of the classified image and calculate the confusion matrix. Seventy percent of the points was used for training process and 30% was used for the verification process of each LULC map. Historical data for training and validation of LULC maps from 1976 and 1991 were obtained from the topographic map (prepared from 1992 to 2001 by the Government of Nepal) and Google Earth images from 1998–2000 using show historical image features. Six-hundred points were collected from each source. However, field data were used for training and validation of the LULC map of 2015 (see Section 2.2).

2.5. Forest Cover Change Analysis (Annual Rate and Trend)

Land cover maps were analyzed to quantify forest cover change. The change matrix table was created using ERDAS Imagine. Annual forest cover change rates were calculated using Equation (1) [24].
P = (100/t2 − t1) × ln A2/A1
where A1 and A2 are the forest cover at time t1 and t2, respectively, and P is the percentage of forest loss per year.
Forest cover change rates were estimated among the land management units within the study area, as decisions on land use and land cover changes depend dually on the characteristics of these land management units and external pressures affecting conservation planning. For the change detection, the Matrix Union tool of ERDAS Imagine Software was used and prepared the change matrix and map from 1976–1991, 1991–2015, and 1976–2015. An enhancement and reduction map for this period was also prepared. Forest cover change and the trend were analyzed in the Tanahun District overall. The role of CF in change was focused on Chhang Illaka, as this Illaka represents the whole district from north to south and almost all the elevation and temperature variance (Figure 1).

2.6. Focus Group Discussions (FGD)

Out of 93 CF user groups (CFUG) of Chhang Illaka, 37 (around 40% sampling intensity) CFUGs were selected purposively as follows: Shyamgha (number of CFs 9; number of samples 4), Manpang (19; 6); Chhang (19; 8), Jamune (13; 6), Kotdarbar (8; 4), Rising Ranipokhari (14; 5), and Ramjakot (11; 4) for FGD to understand the community perception towards the forest cover change and their role in improvement of forest cover. Major factors responsible for improvement and reduction of forest cover were listed in a group and then individual participants in FGD were requested to prioritize different causes based on their knowledge. At the same time, community forestry activities related to forest cover improvements were listed based on the review of CF operational plans and community consultations. We conducted a judgement-ranking exercise to understand the perceived effectiveness of different CF activities. Prioritized responses of community representatives were analyzed through mean rank and non-parametric Friedman’s chi-squared test [25] using the following formula, which was used in [26] to analyze people’s perception based on rank.
F T =   12 b k k + 1 j = 1 K T j 2 3 b k + 1
where k = number of column (treatments)
b = Number of row (blocks)
Tj2 = the square sums of rank for sample treatment.

3. Results

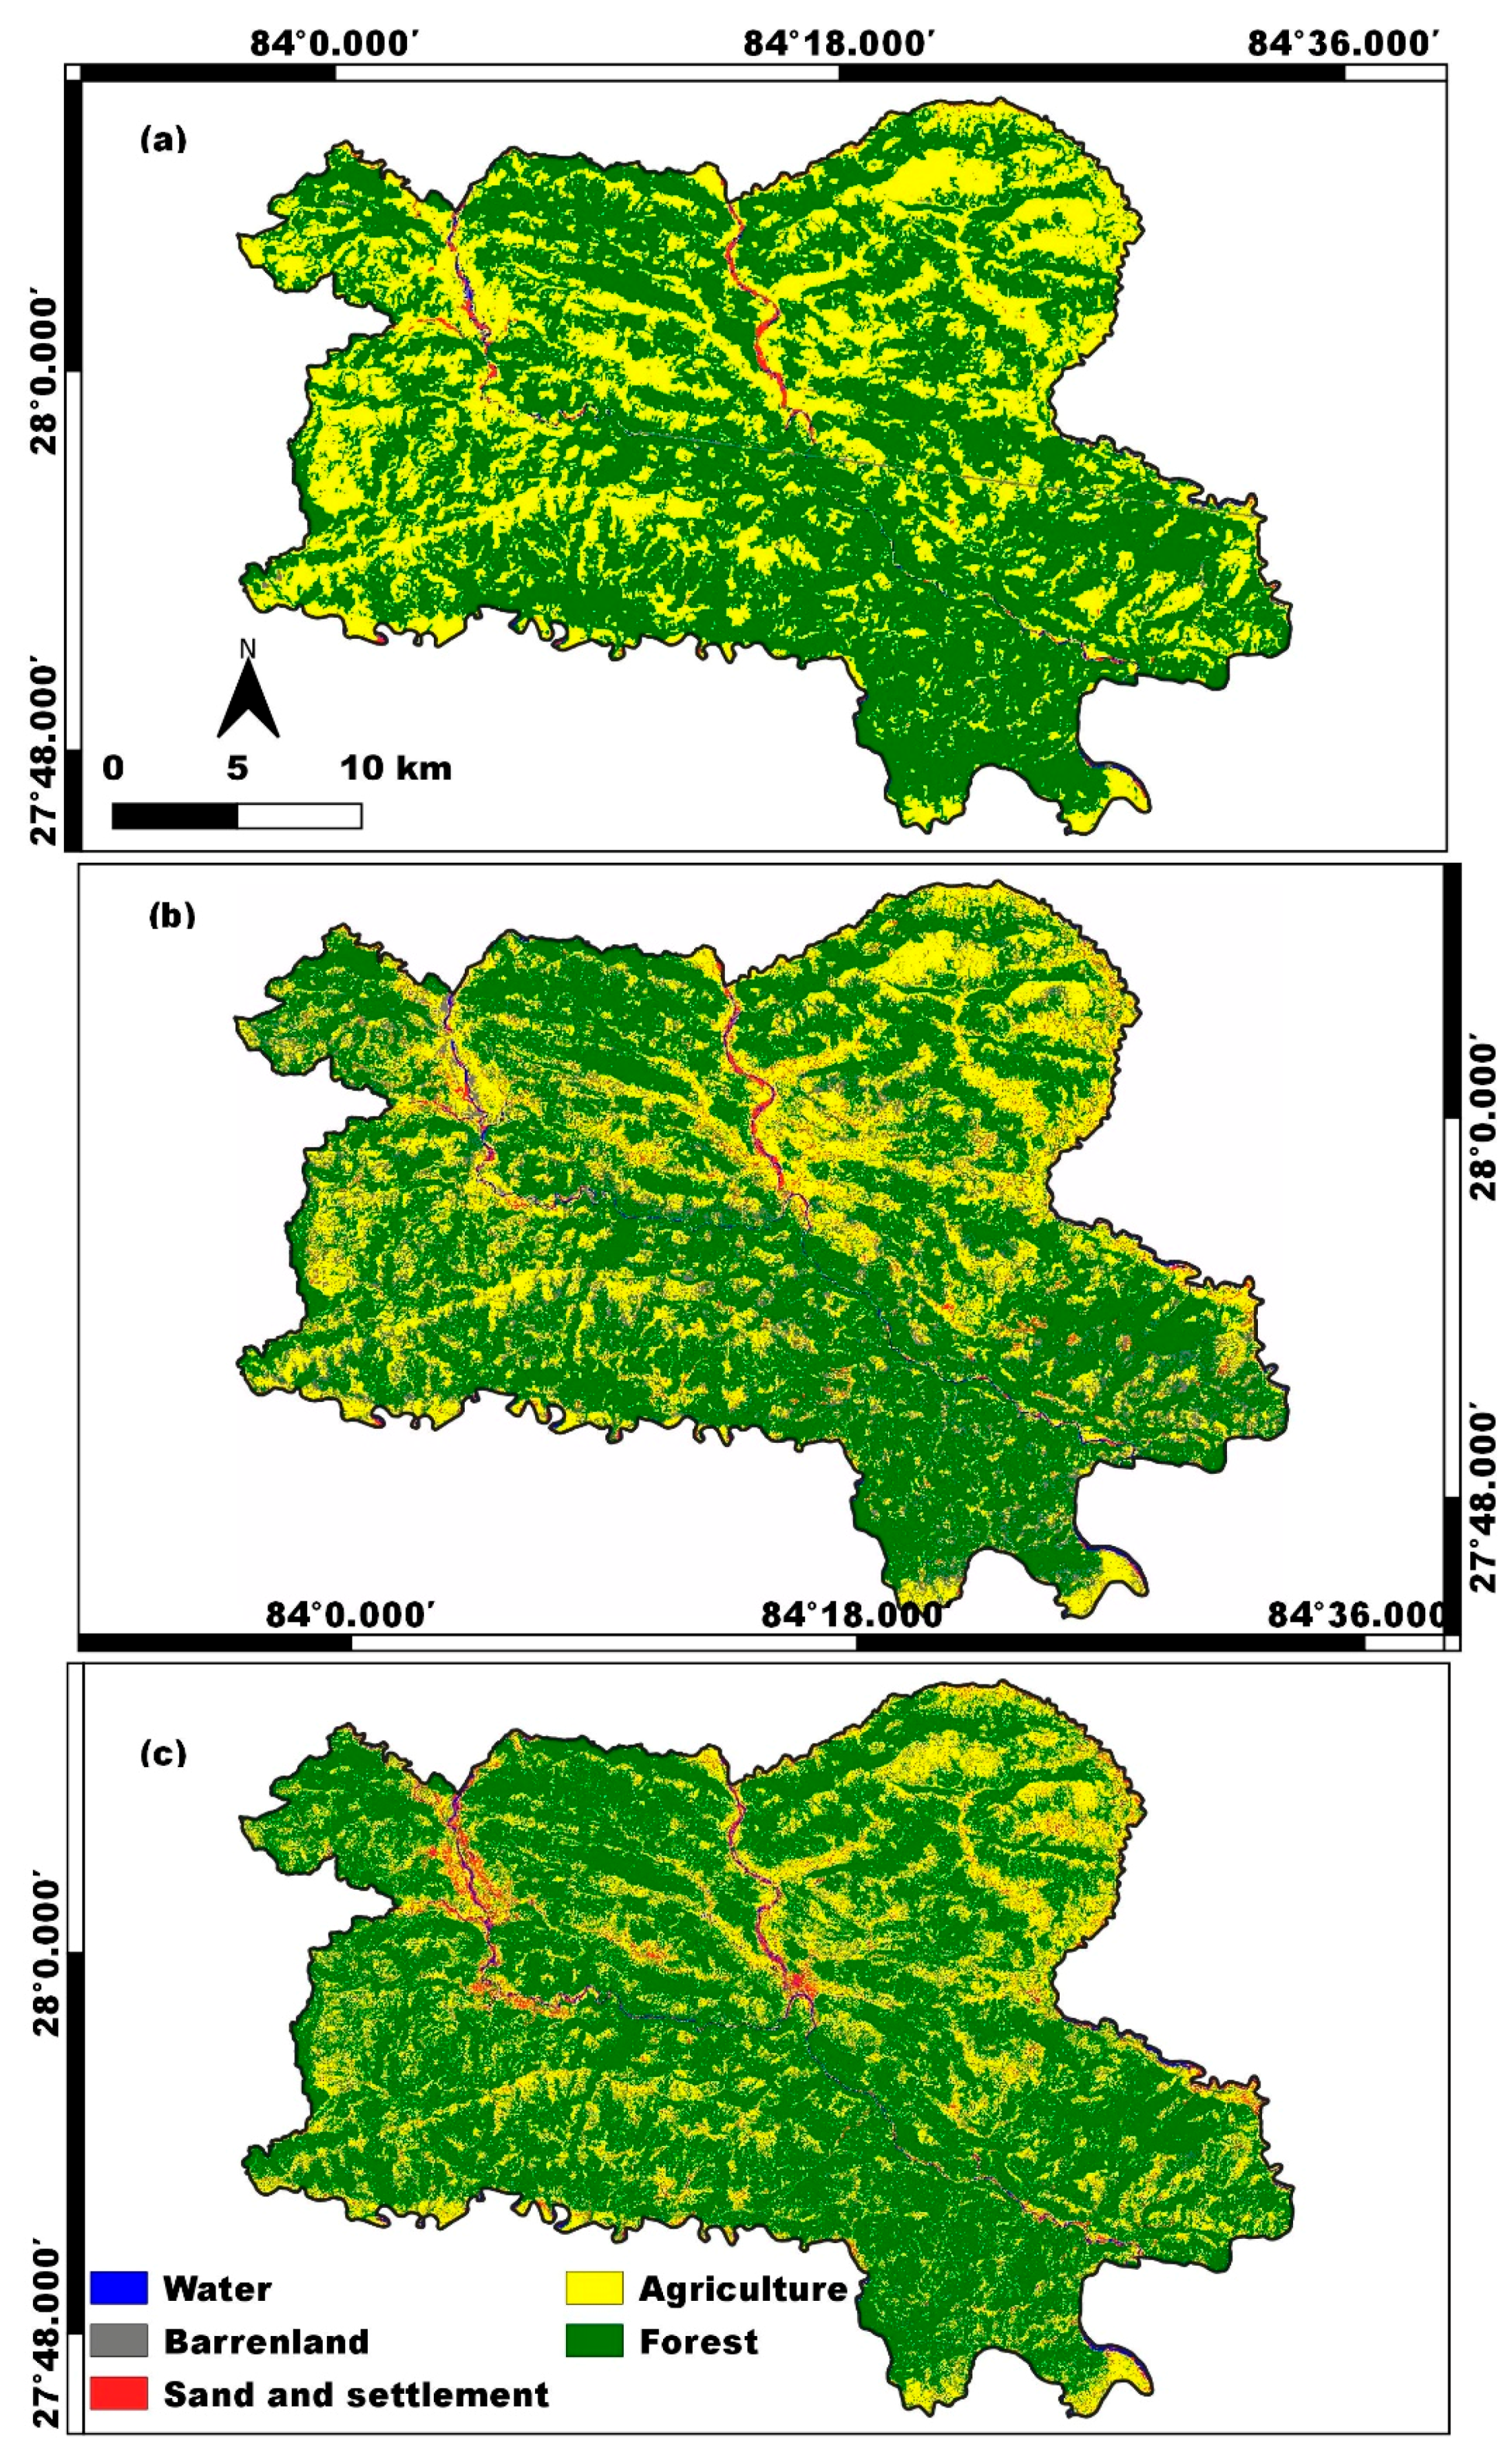
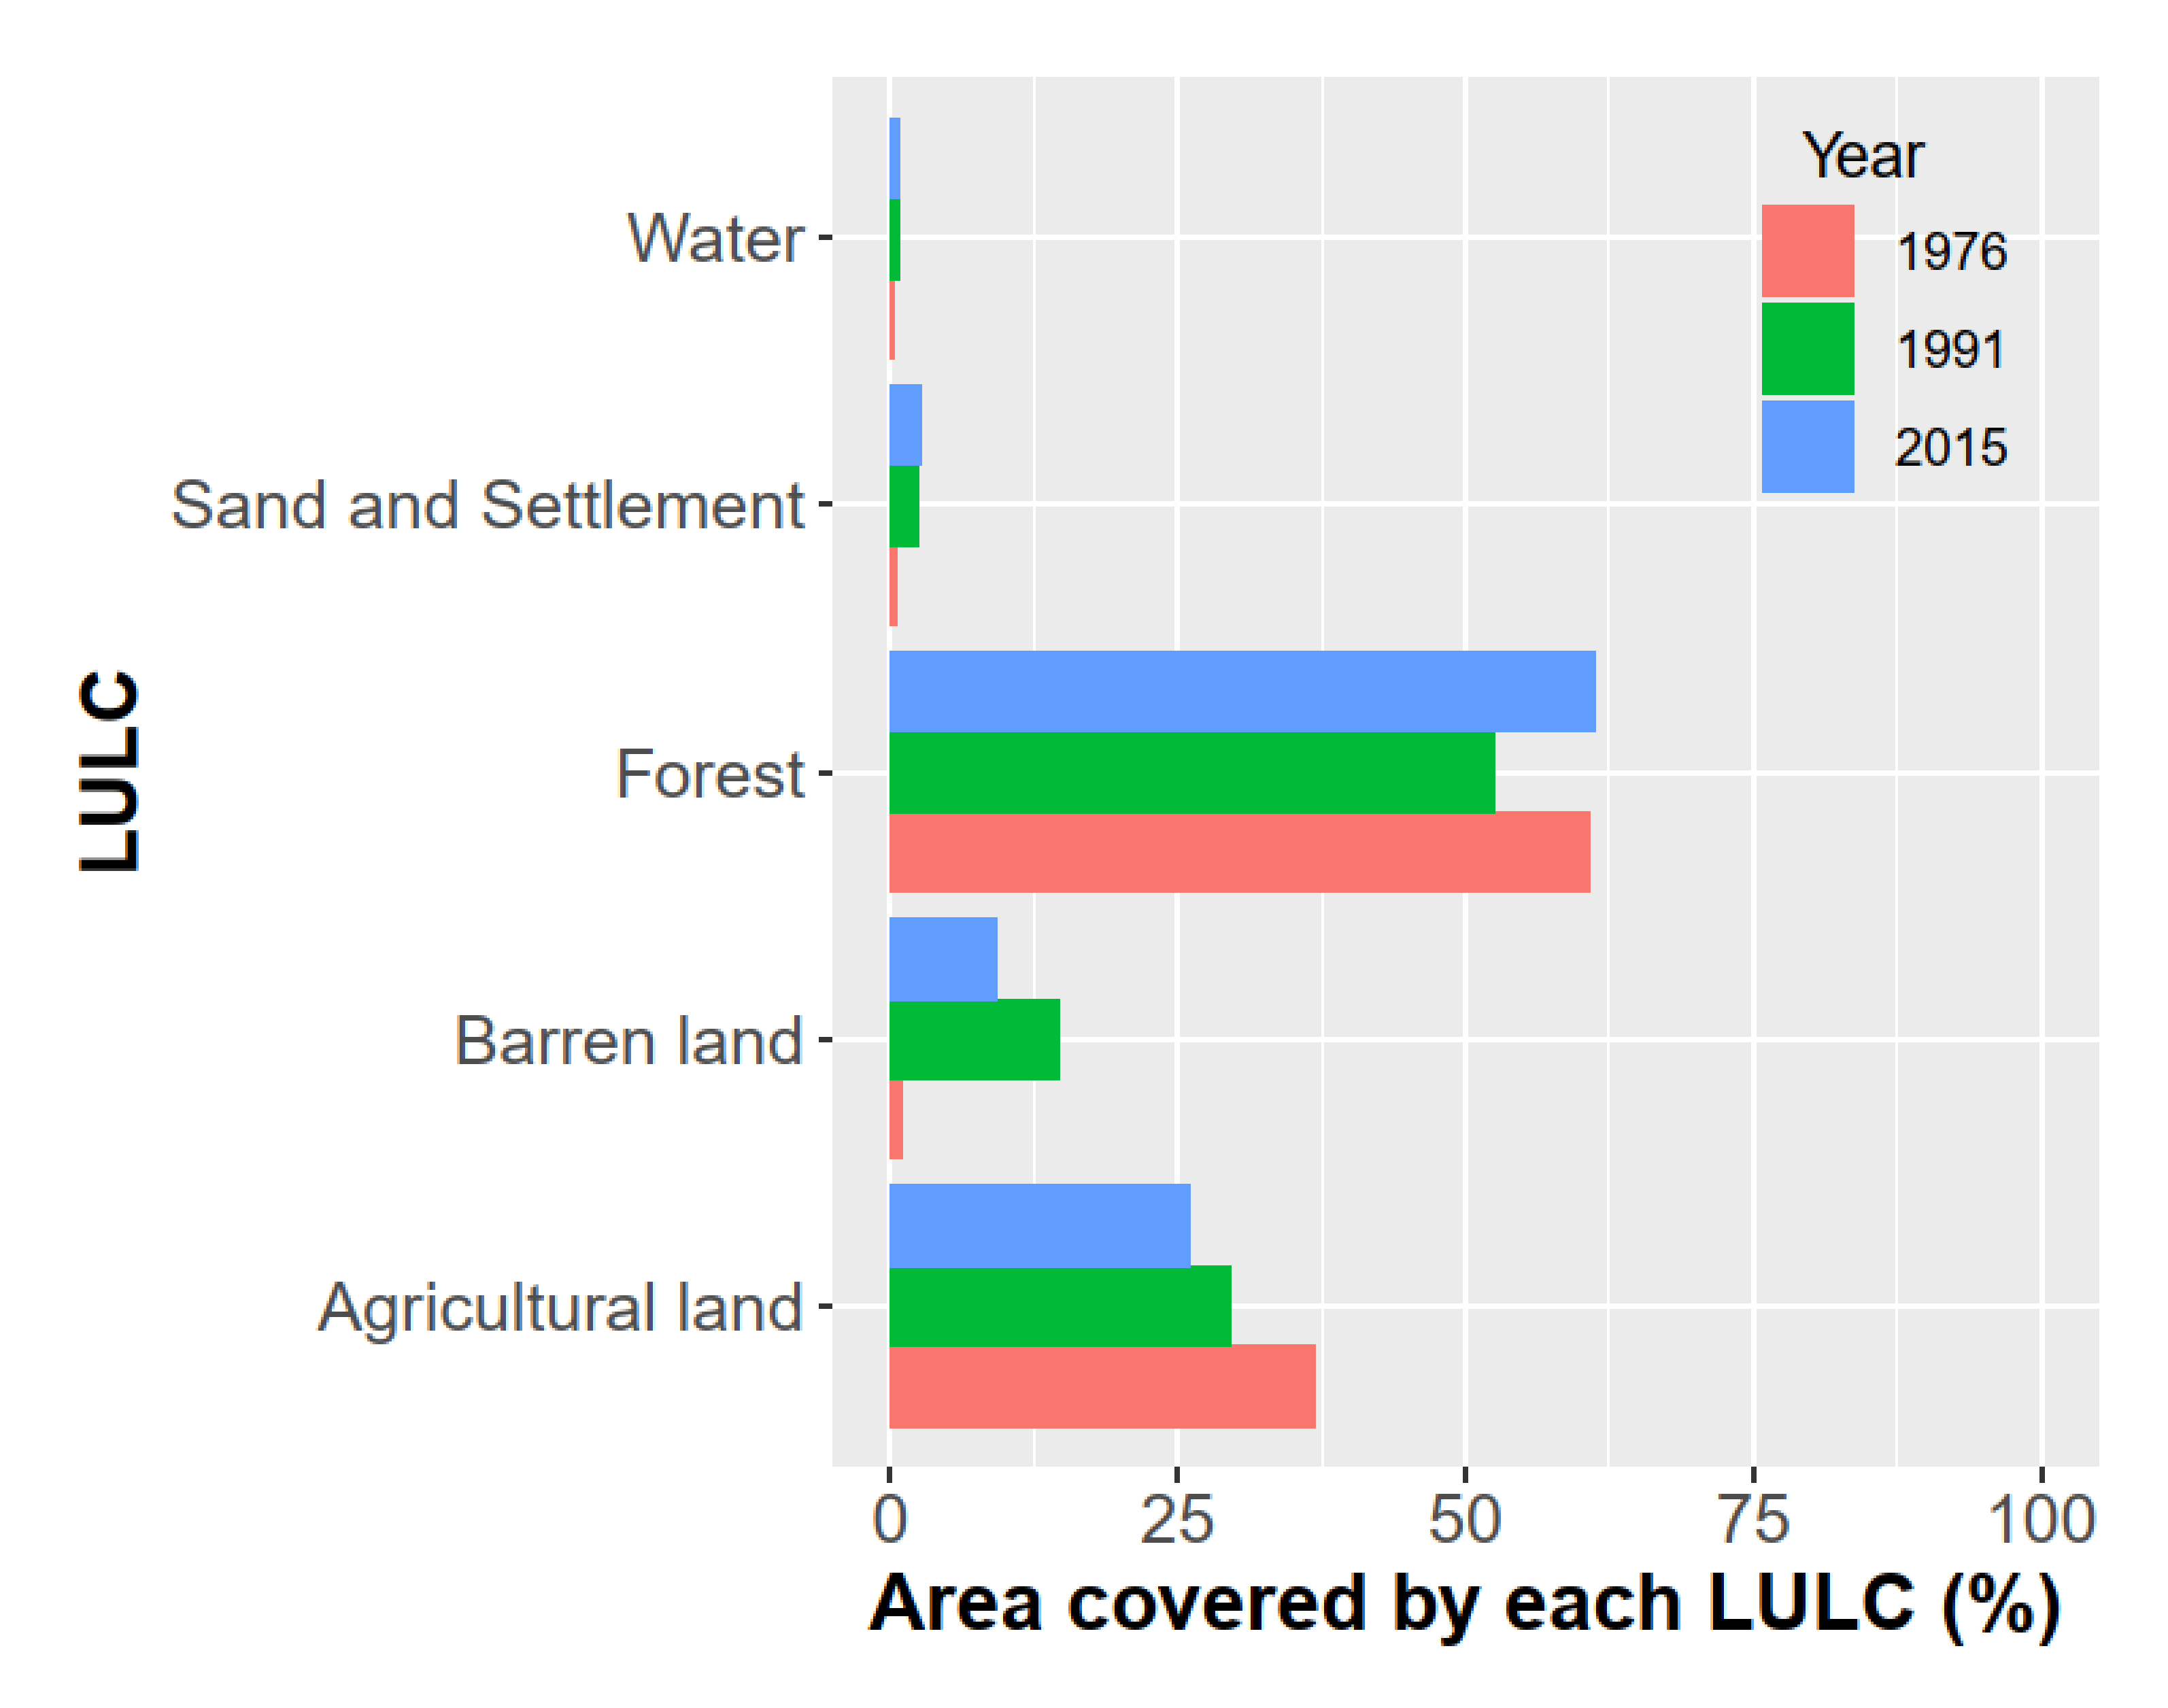
3.1. Land Use and Land Cover (LULC) Pattern of the District

Figure 4 presents a LULC map of different time periods and analysis of land cover change. The map of 1976 (Figure 4a) shows that forest was the major land use (95,297.76 ha, or 60.76% of the district), followed by agricultural land (37.00%), barren land (1.09%), water (0.51%), and sand/settlement (0.64%). Similarly, the LULC map of 1991 (Figure 4b) shows that forest was the major land use (82,481.31 ha, 52.59% of the district), followed by agricultural land (29.53%), barren land (14.74%), sand/settlement (2.39%), and water (0.75%). The LULC map of 2015 (Figure 4c) shows that forest was the major land use (96,113.16 ha, 61.28% of the district), followed by agricultural land (26.06%), barren land (9.18%), sand/settlement (2.62%), and water (0.86%). The overall accuracy of the classification was 86%, 75.3%, and 79.5%, respectively, and the Kappa statistics were 0.77, 0.69, and 0.67 for the year 1976, 1991, and 2015, respectively.

3.1.1. LULC Change Pattern for the Period 1976–1991

Barren land increased whereas forest and agricultural land decreased. Sand and settlement and water bodies were relatively stable with slight increment during this time period (Figure 5). The row total of Table 3 represents the percentage of total area covered by each class in 1976 (e.g., the total value of the second row is 1.09%, which was the land percentage covered by barren land in 1976). The column total of Table 3 represents the percentage of total area covered by each class in 1991 (e.g., the total value of the second column is 14.74, which was the land percentage covered by barren land in 1991). The differences between the row total and column total represent the land cover changed between 1976–1991 (e.g., the difference between the total of the second row and the second column is 13.65, which was land percentage converted from barren land to other land). As shown in Table 3, the change was highest on barren land (increase of 13.65%, from 1.09% to 14.74%). Forest decreased by 8.17% (from 60.76% to 52.59%). At the same time, agricultural land was decreased by 7.47% (from 37.00% to 29.53%) (Table 2).

3.1.2. LULC Change Pattern for the Period of 1991–2015

From the change calculation, we observed that forest increased while sand and settlement and water was relatively stable and slightly increased during this time period. Barren land and agricultural land decreased. The change was highest in forest (increase of 8.69%, from 52.59% to 61.28%). Barren land decreased by 5.56% (from 14.74% to 9.18%); at the same time, agricultural land also decreased by 3.47% (from 29.53% to 26.06%). Sand and settlement increased by 0.22% (from 2.40% to 2.62%) (Table 4). Forest cover increased within the study area between 1991–2015 at the expense of barren land and agricultural land.

3.1.3. LULC Change Pattern for the Period 1976–2015

Barren land increased during this time period, whereas agricultural land decreased. Forest, sand and settlement, and water increased slightly (Table 5). The change was highest on agricultural land, which decreased by 10.94% from 37.00% to 26.06%. Barren land increased by 8.09% from 1.09% to 9.18%; at the same time, forest also slightly increased by 0.52% (from 60.76% to 61.28%). Forest cover within the study area decreased during the first 15 years (during 1976–1991) and later (during 1991–2015) forest cover regained its area.

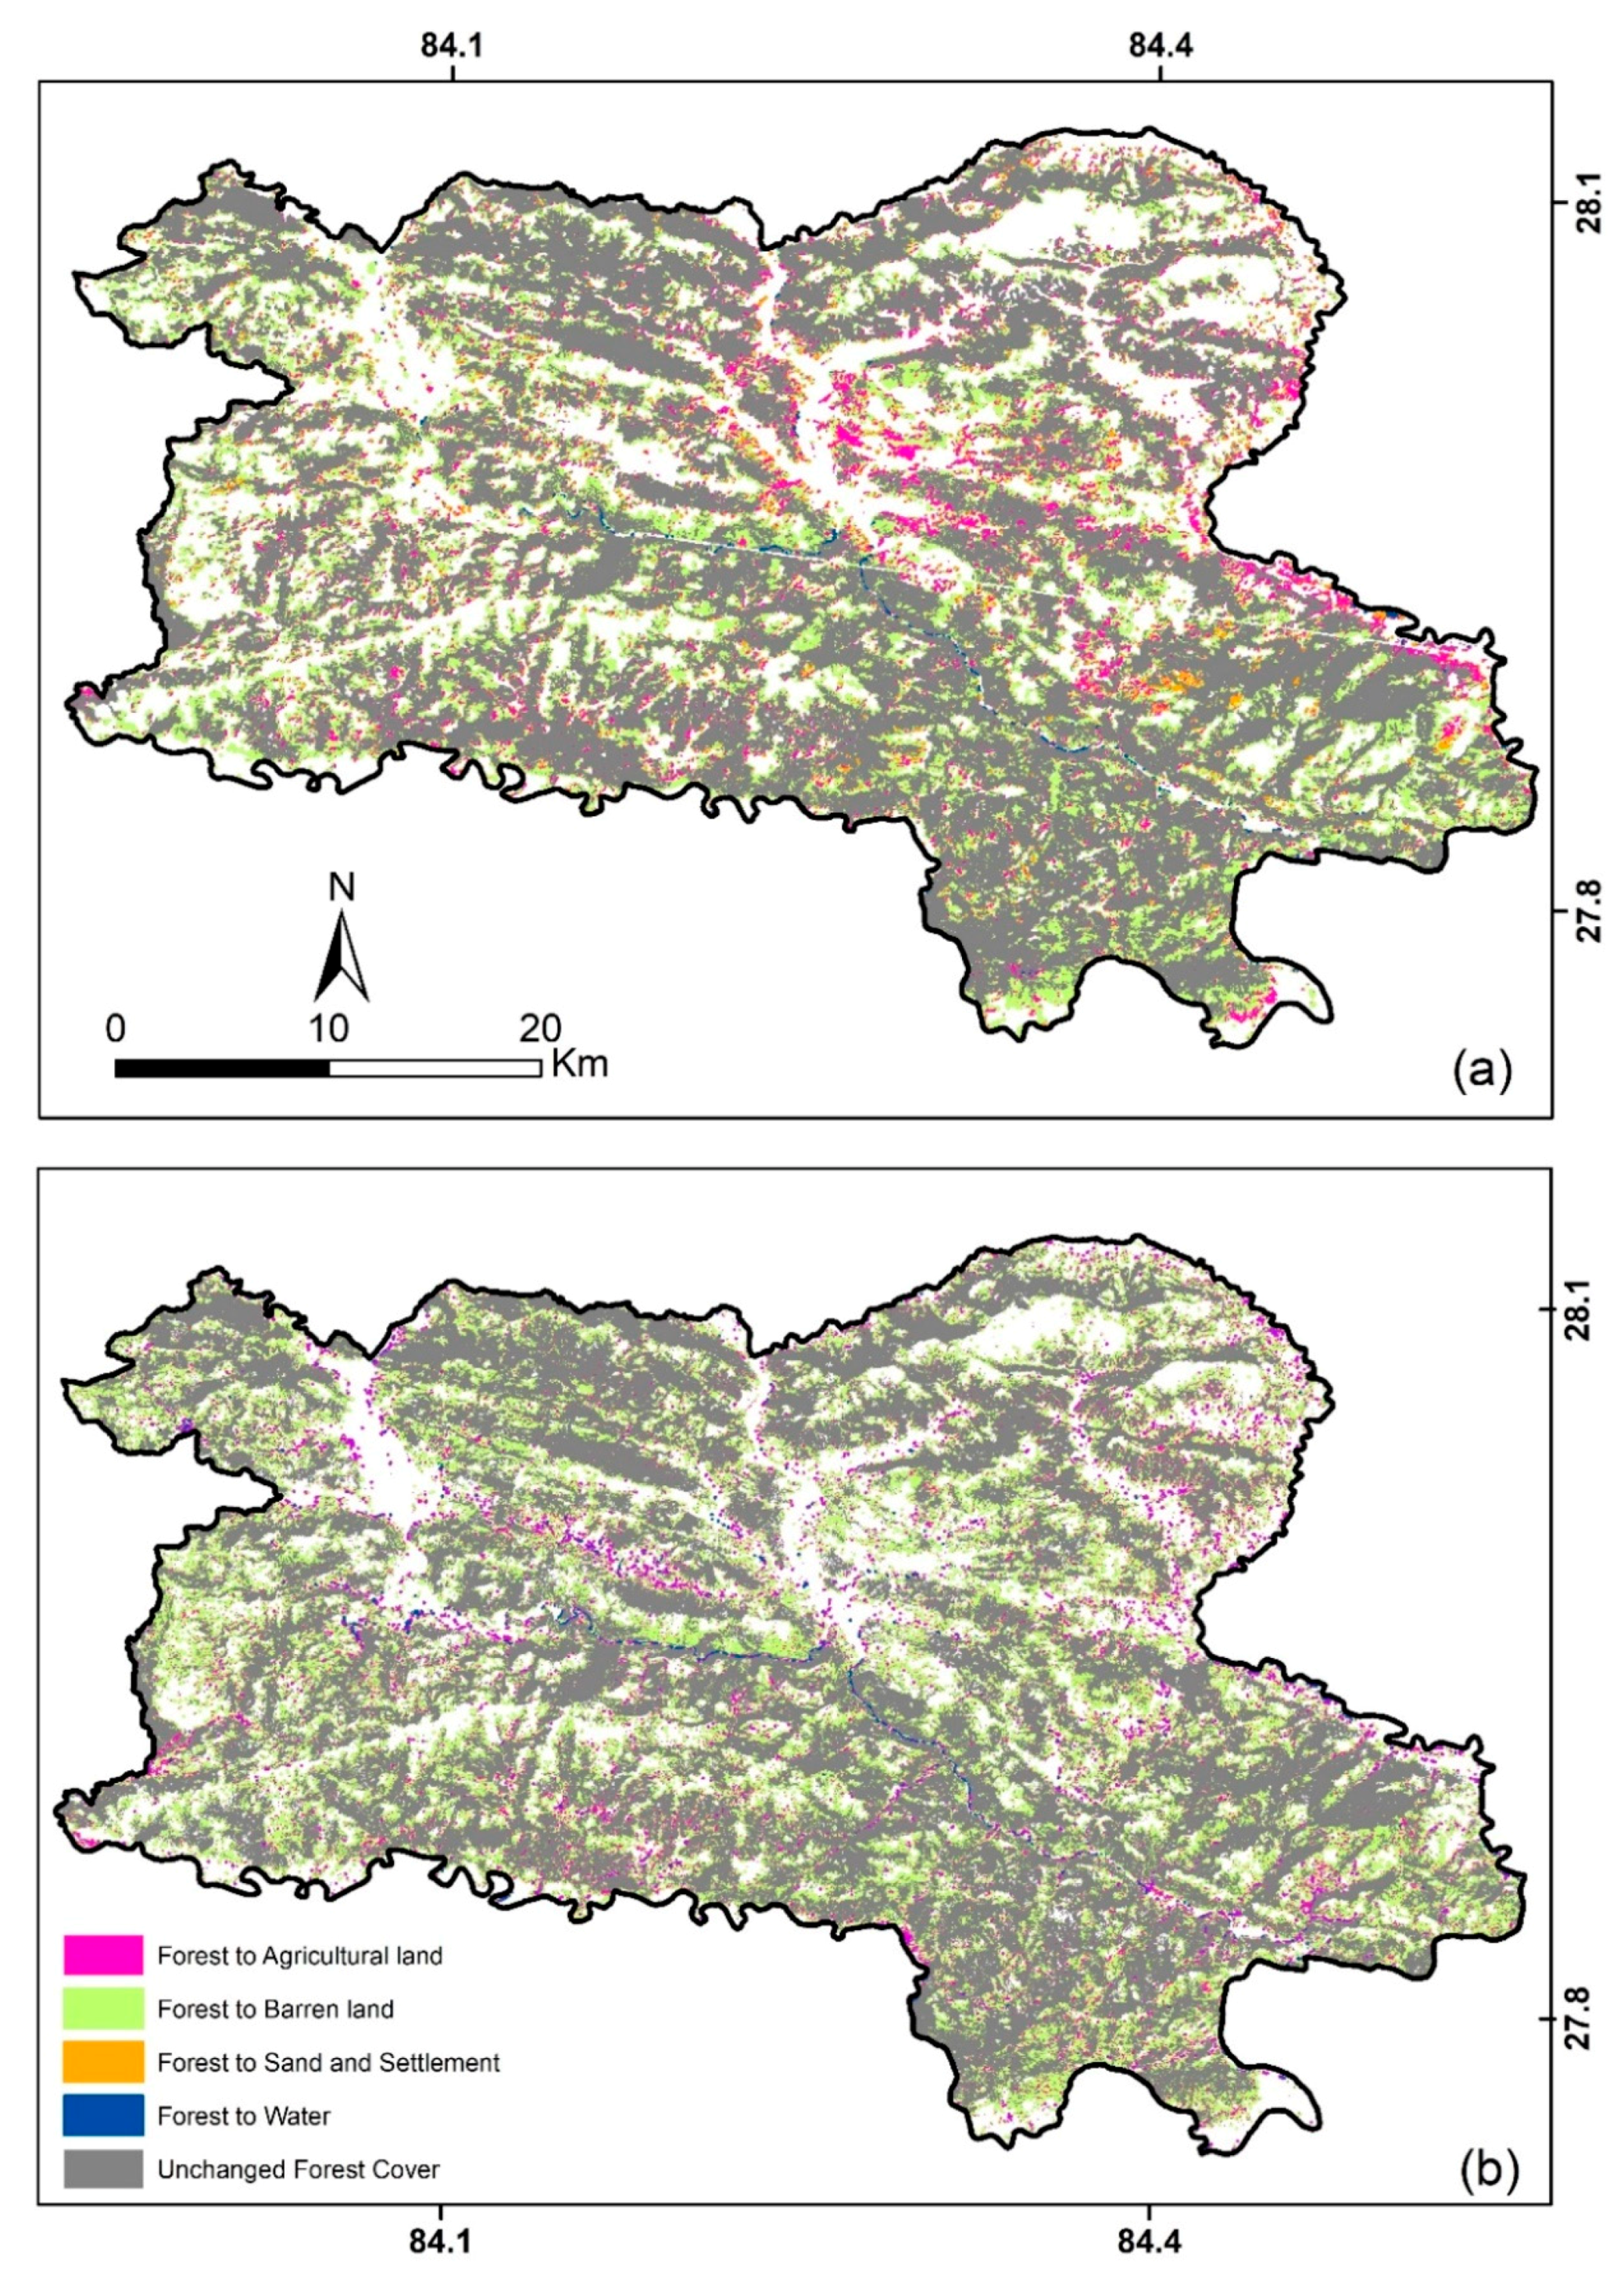
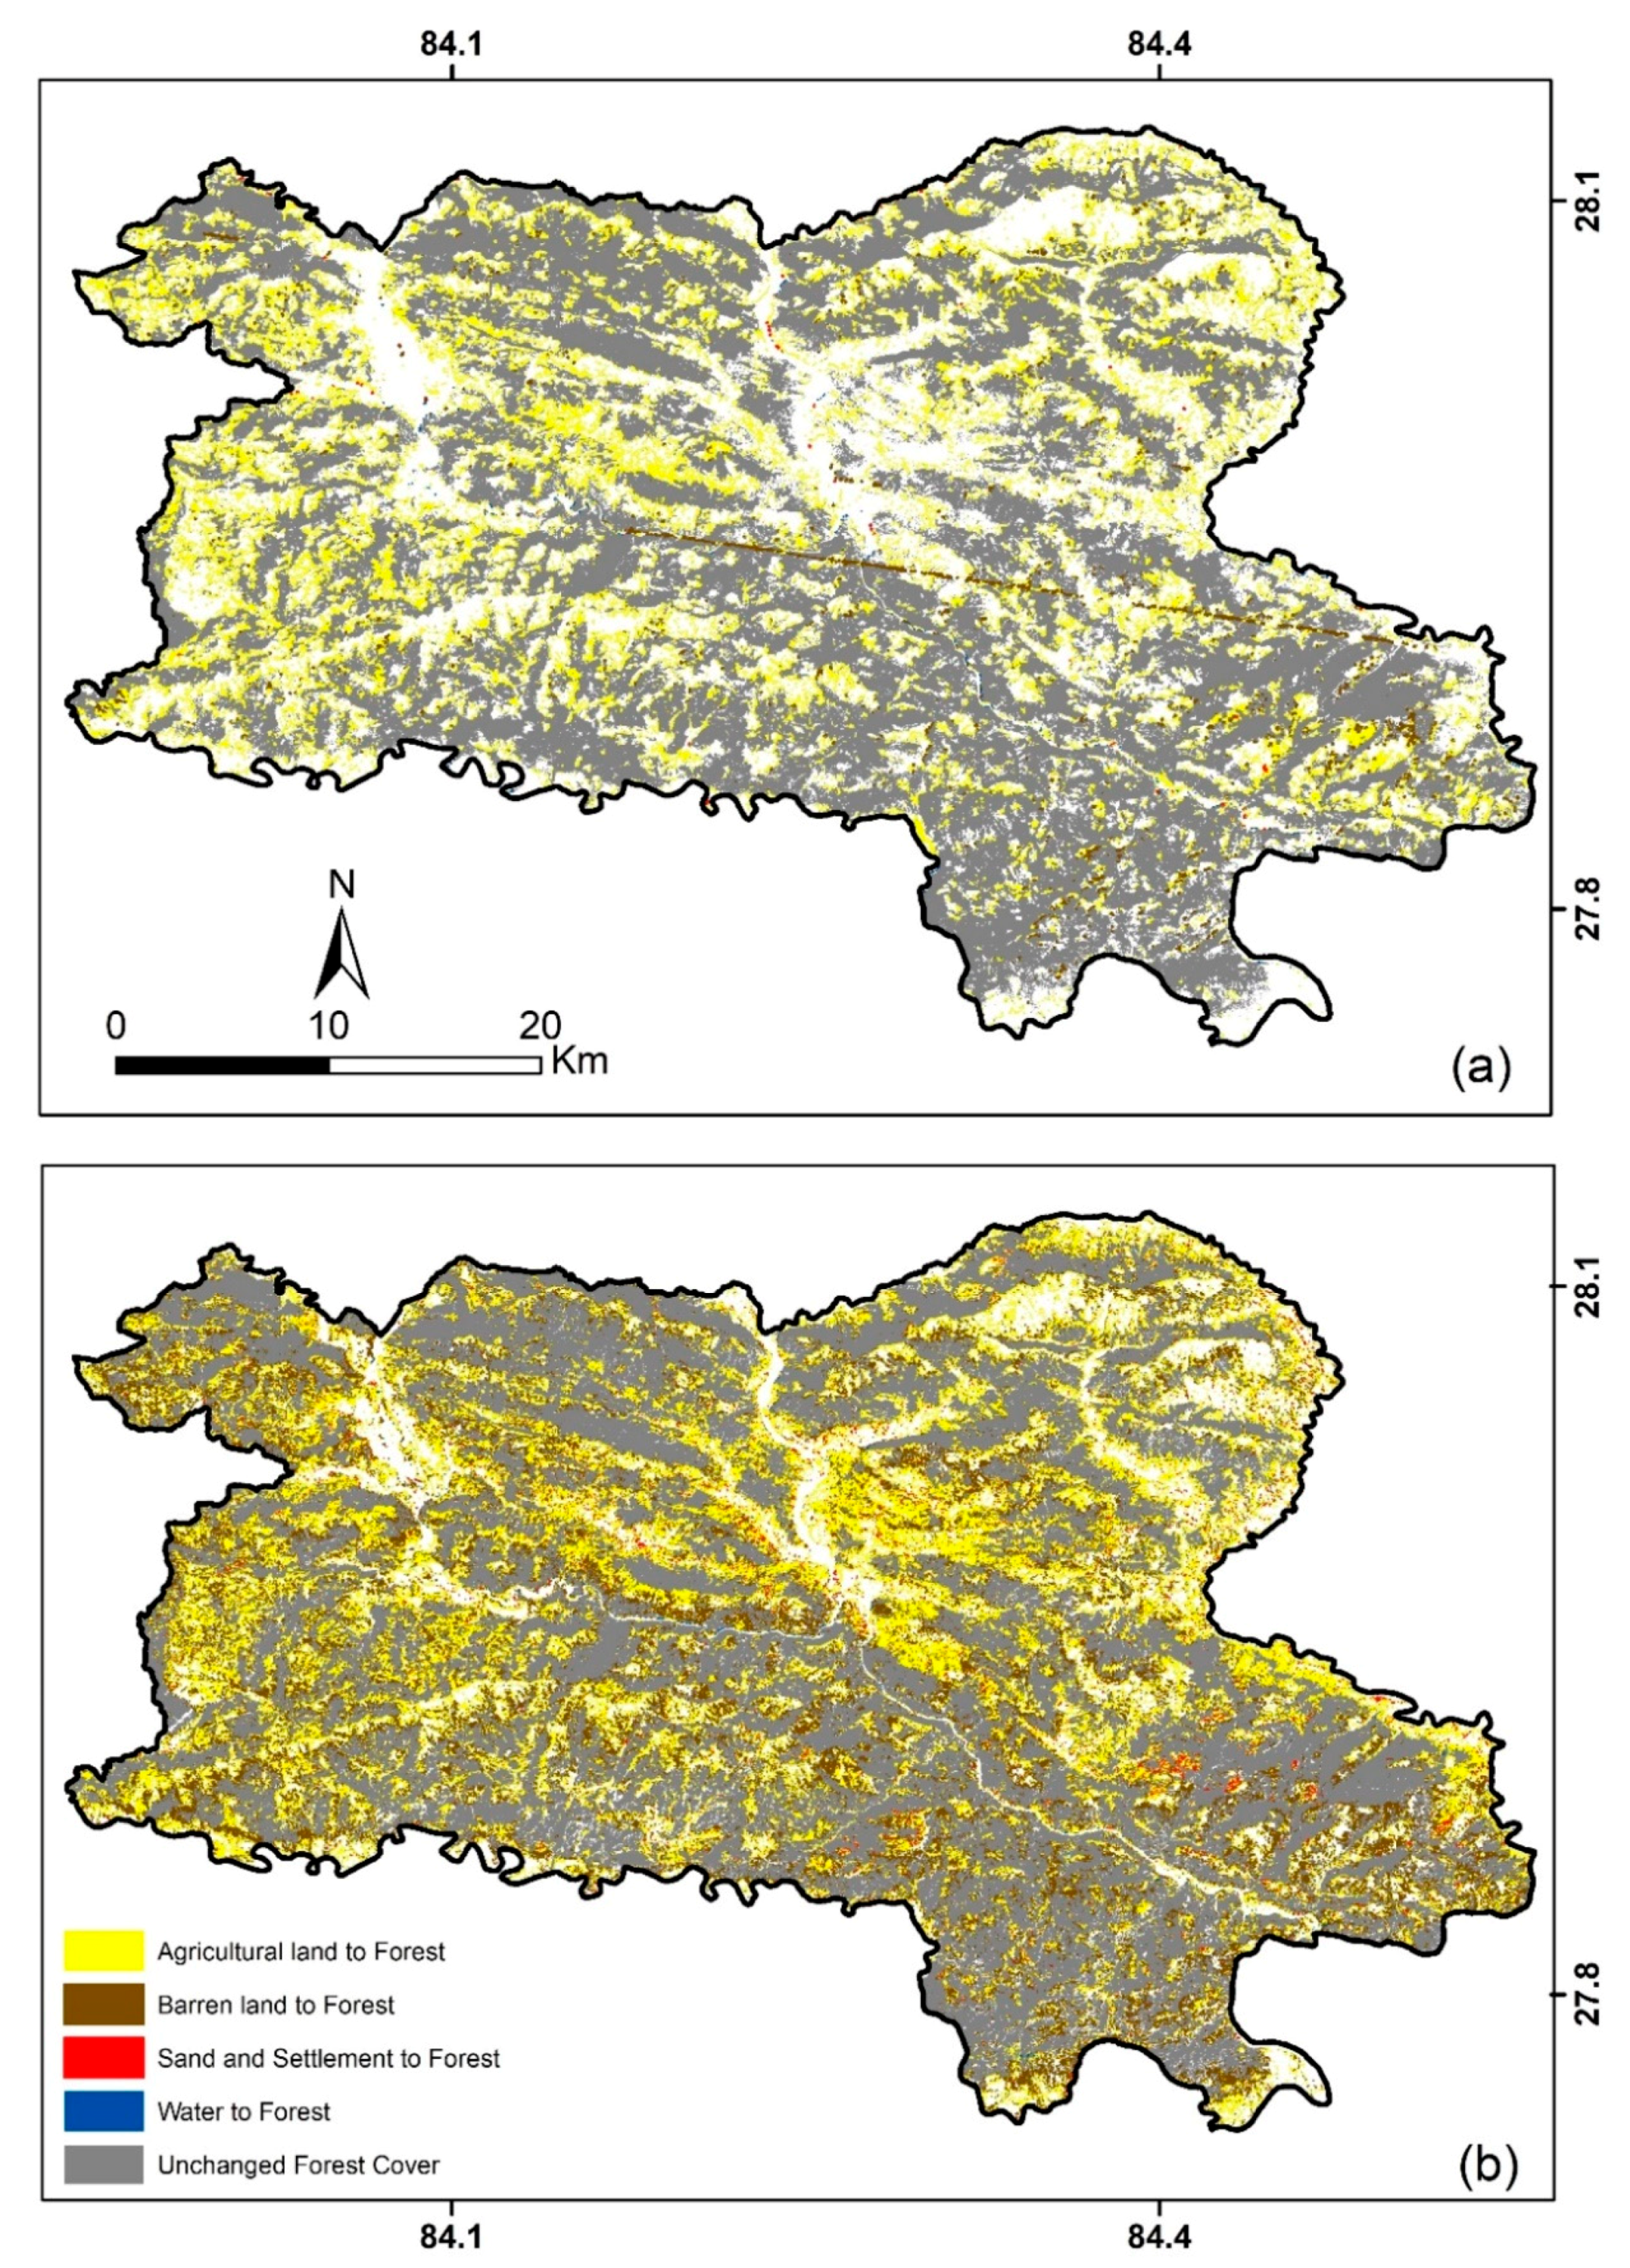
3.2. Forest Cover Trend

From the analysis of the LULC, we found that forest cover change was observed in terms of both loss and gain in the study area. Trend and annual rate were analyzed.

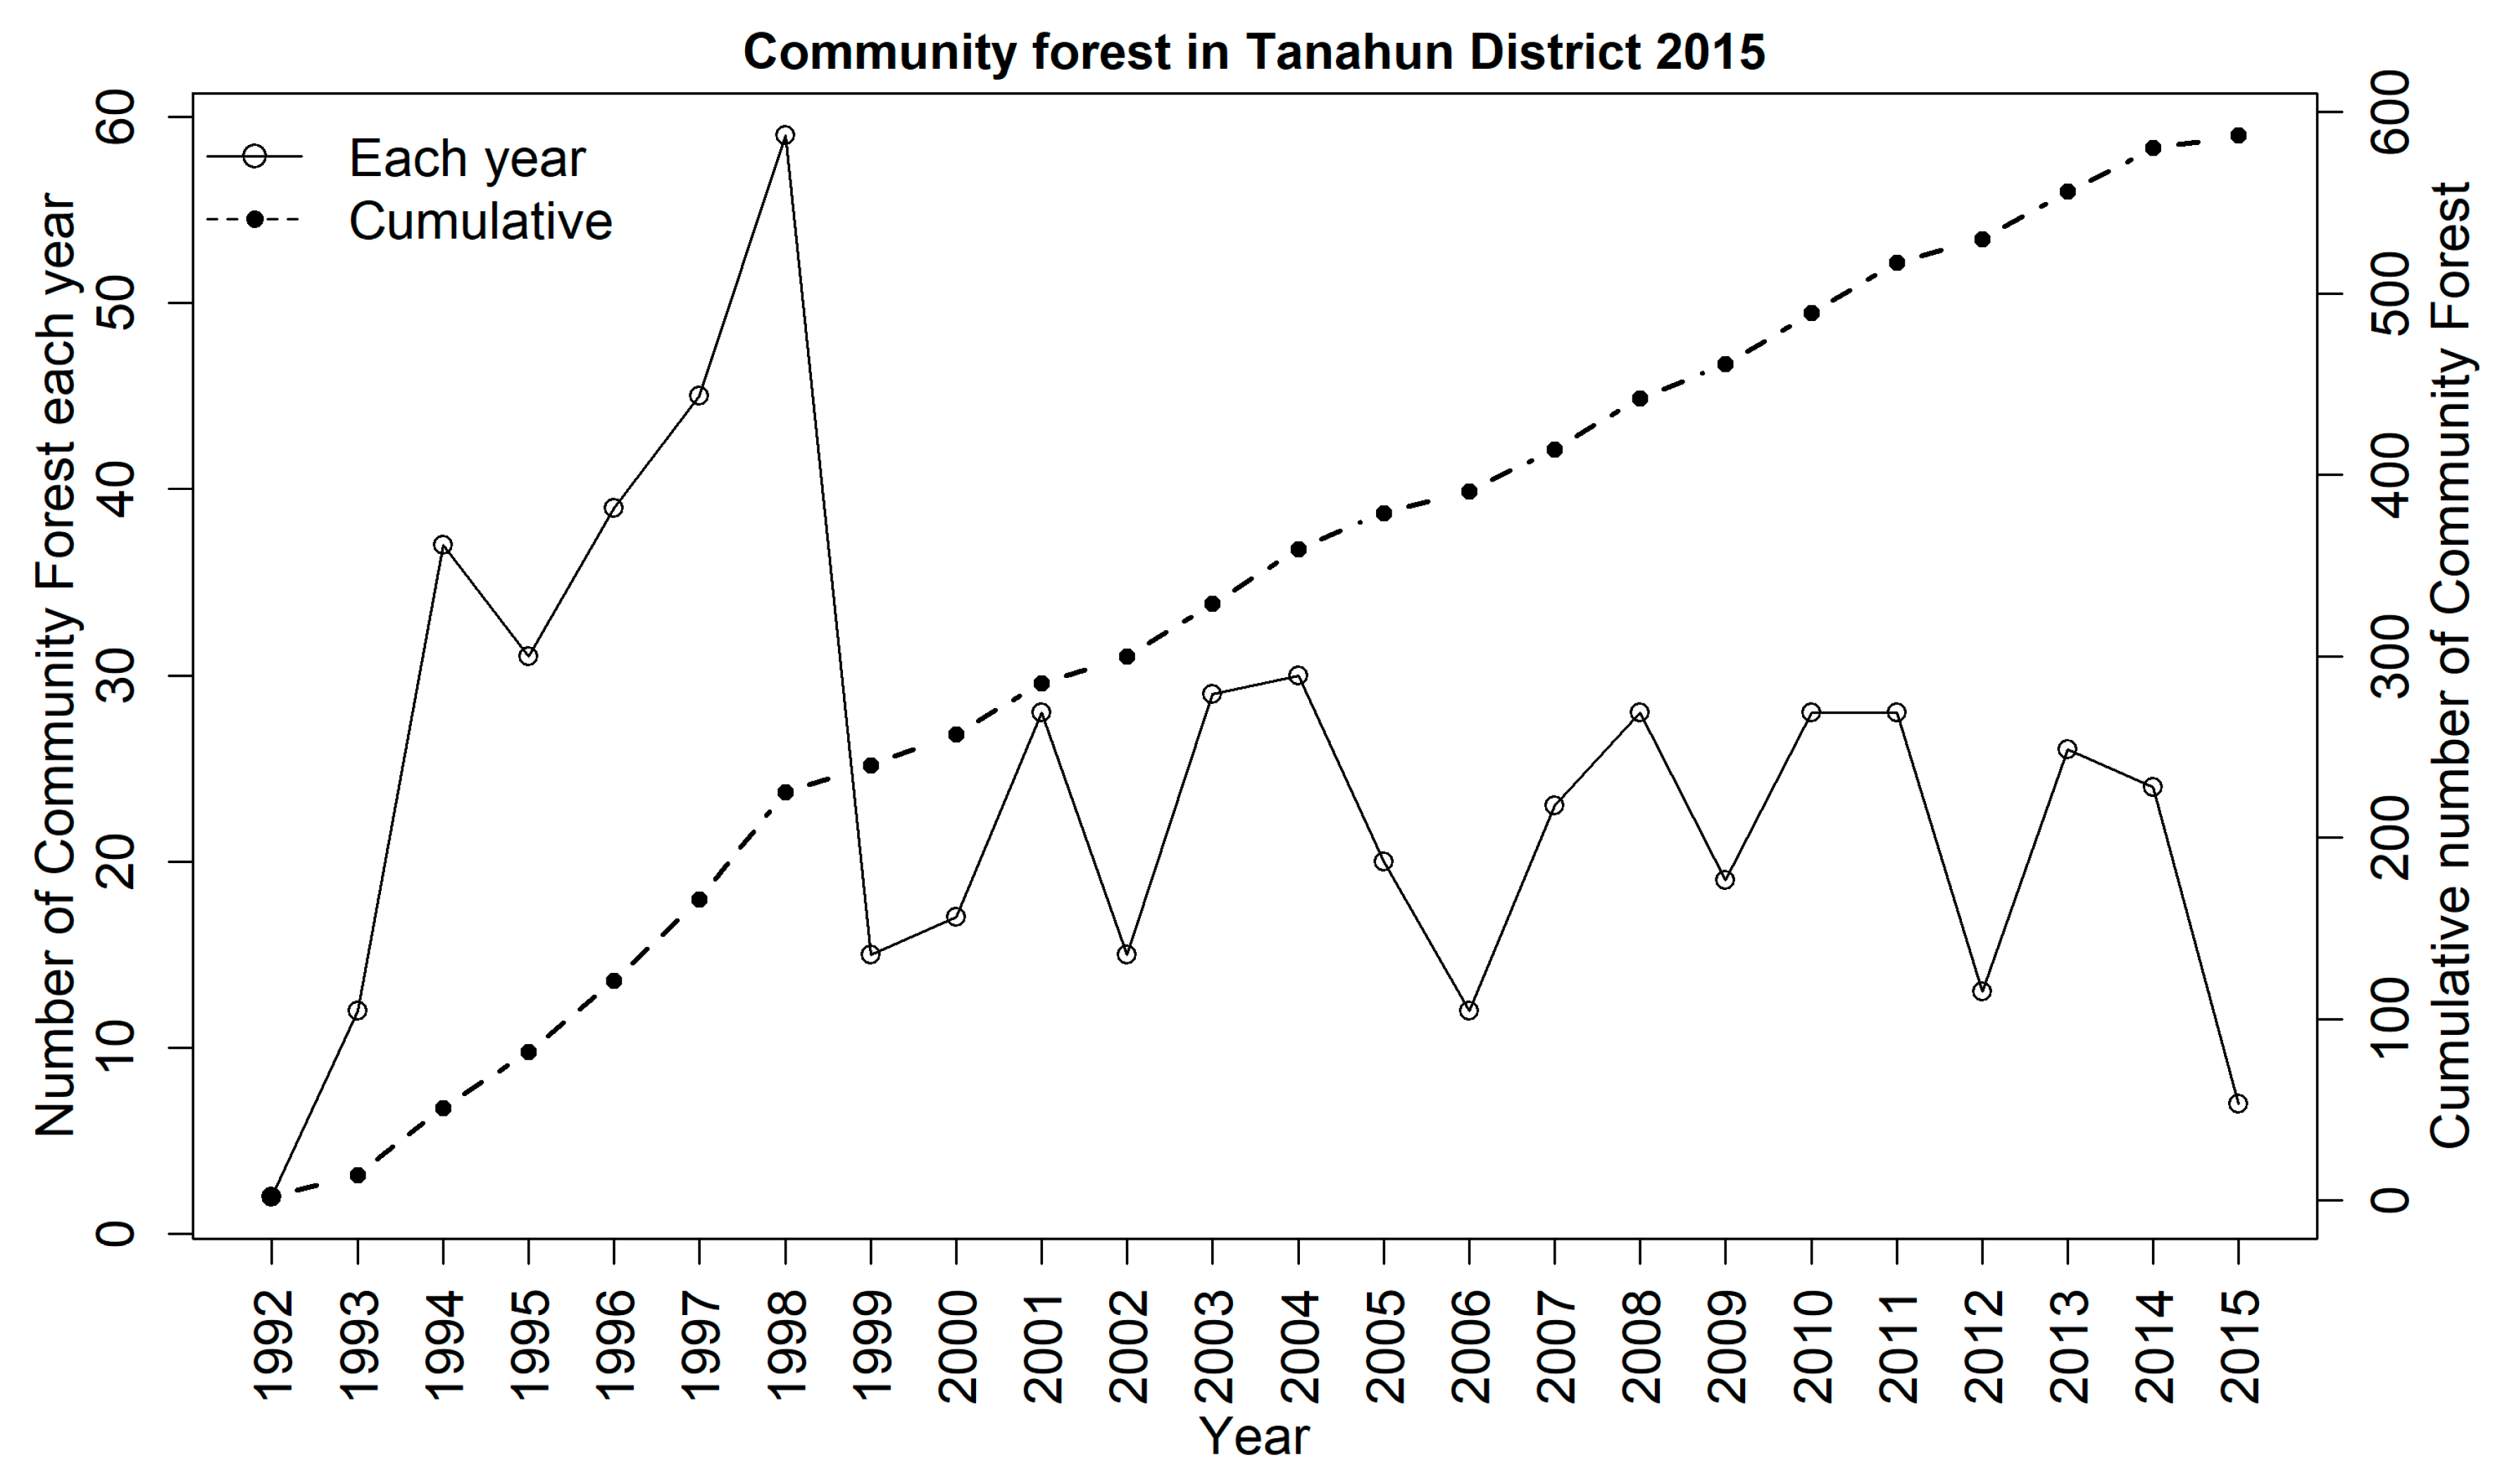
3.2.1. Temporal Forest Cover Trend

The forest cover of Tanahun District rapidly decreased from 1976–1991 and after 1991 forest cover increased smoothly. The forest cover of the Tanahun District decreased at a rate of 0.96% per annum from 1976–1991. However, during 1991 and 2015, the forest cover increased at a rate of 0.63% per annum. The overall rate of change from 1976–2015 was 0.02% (i.e., forest increased at a rate of 0.02% per annum). Trend of forest cover in 1976, 1991, and 2015 in the study area was 60.76%, 52.59%, and 61.28%, respectively.
Forest cover reduction (Figure 6a,b) and enhancement (Figure 7a,b) on different parts of the district during 1976–1991 and 1991–2015 were identified by using a change matrix. During 1976–1991, less forest enhancement was observed. However, during 1991–2015, forest mostly enhanced from barren land and agriculture land. As shown in Figure 6 and Figure 7, there was remarkable deforestation in different places of district during 1976–1991. However, after 1991–2015 there was significantly decreased deforestation and conversion of forest to other land use classes.

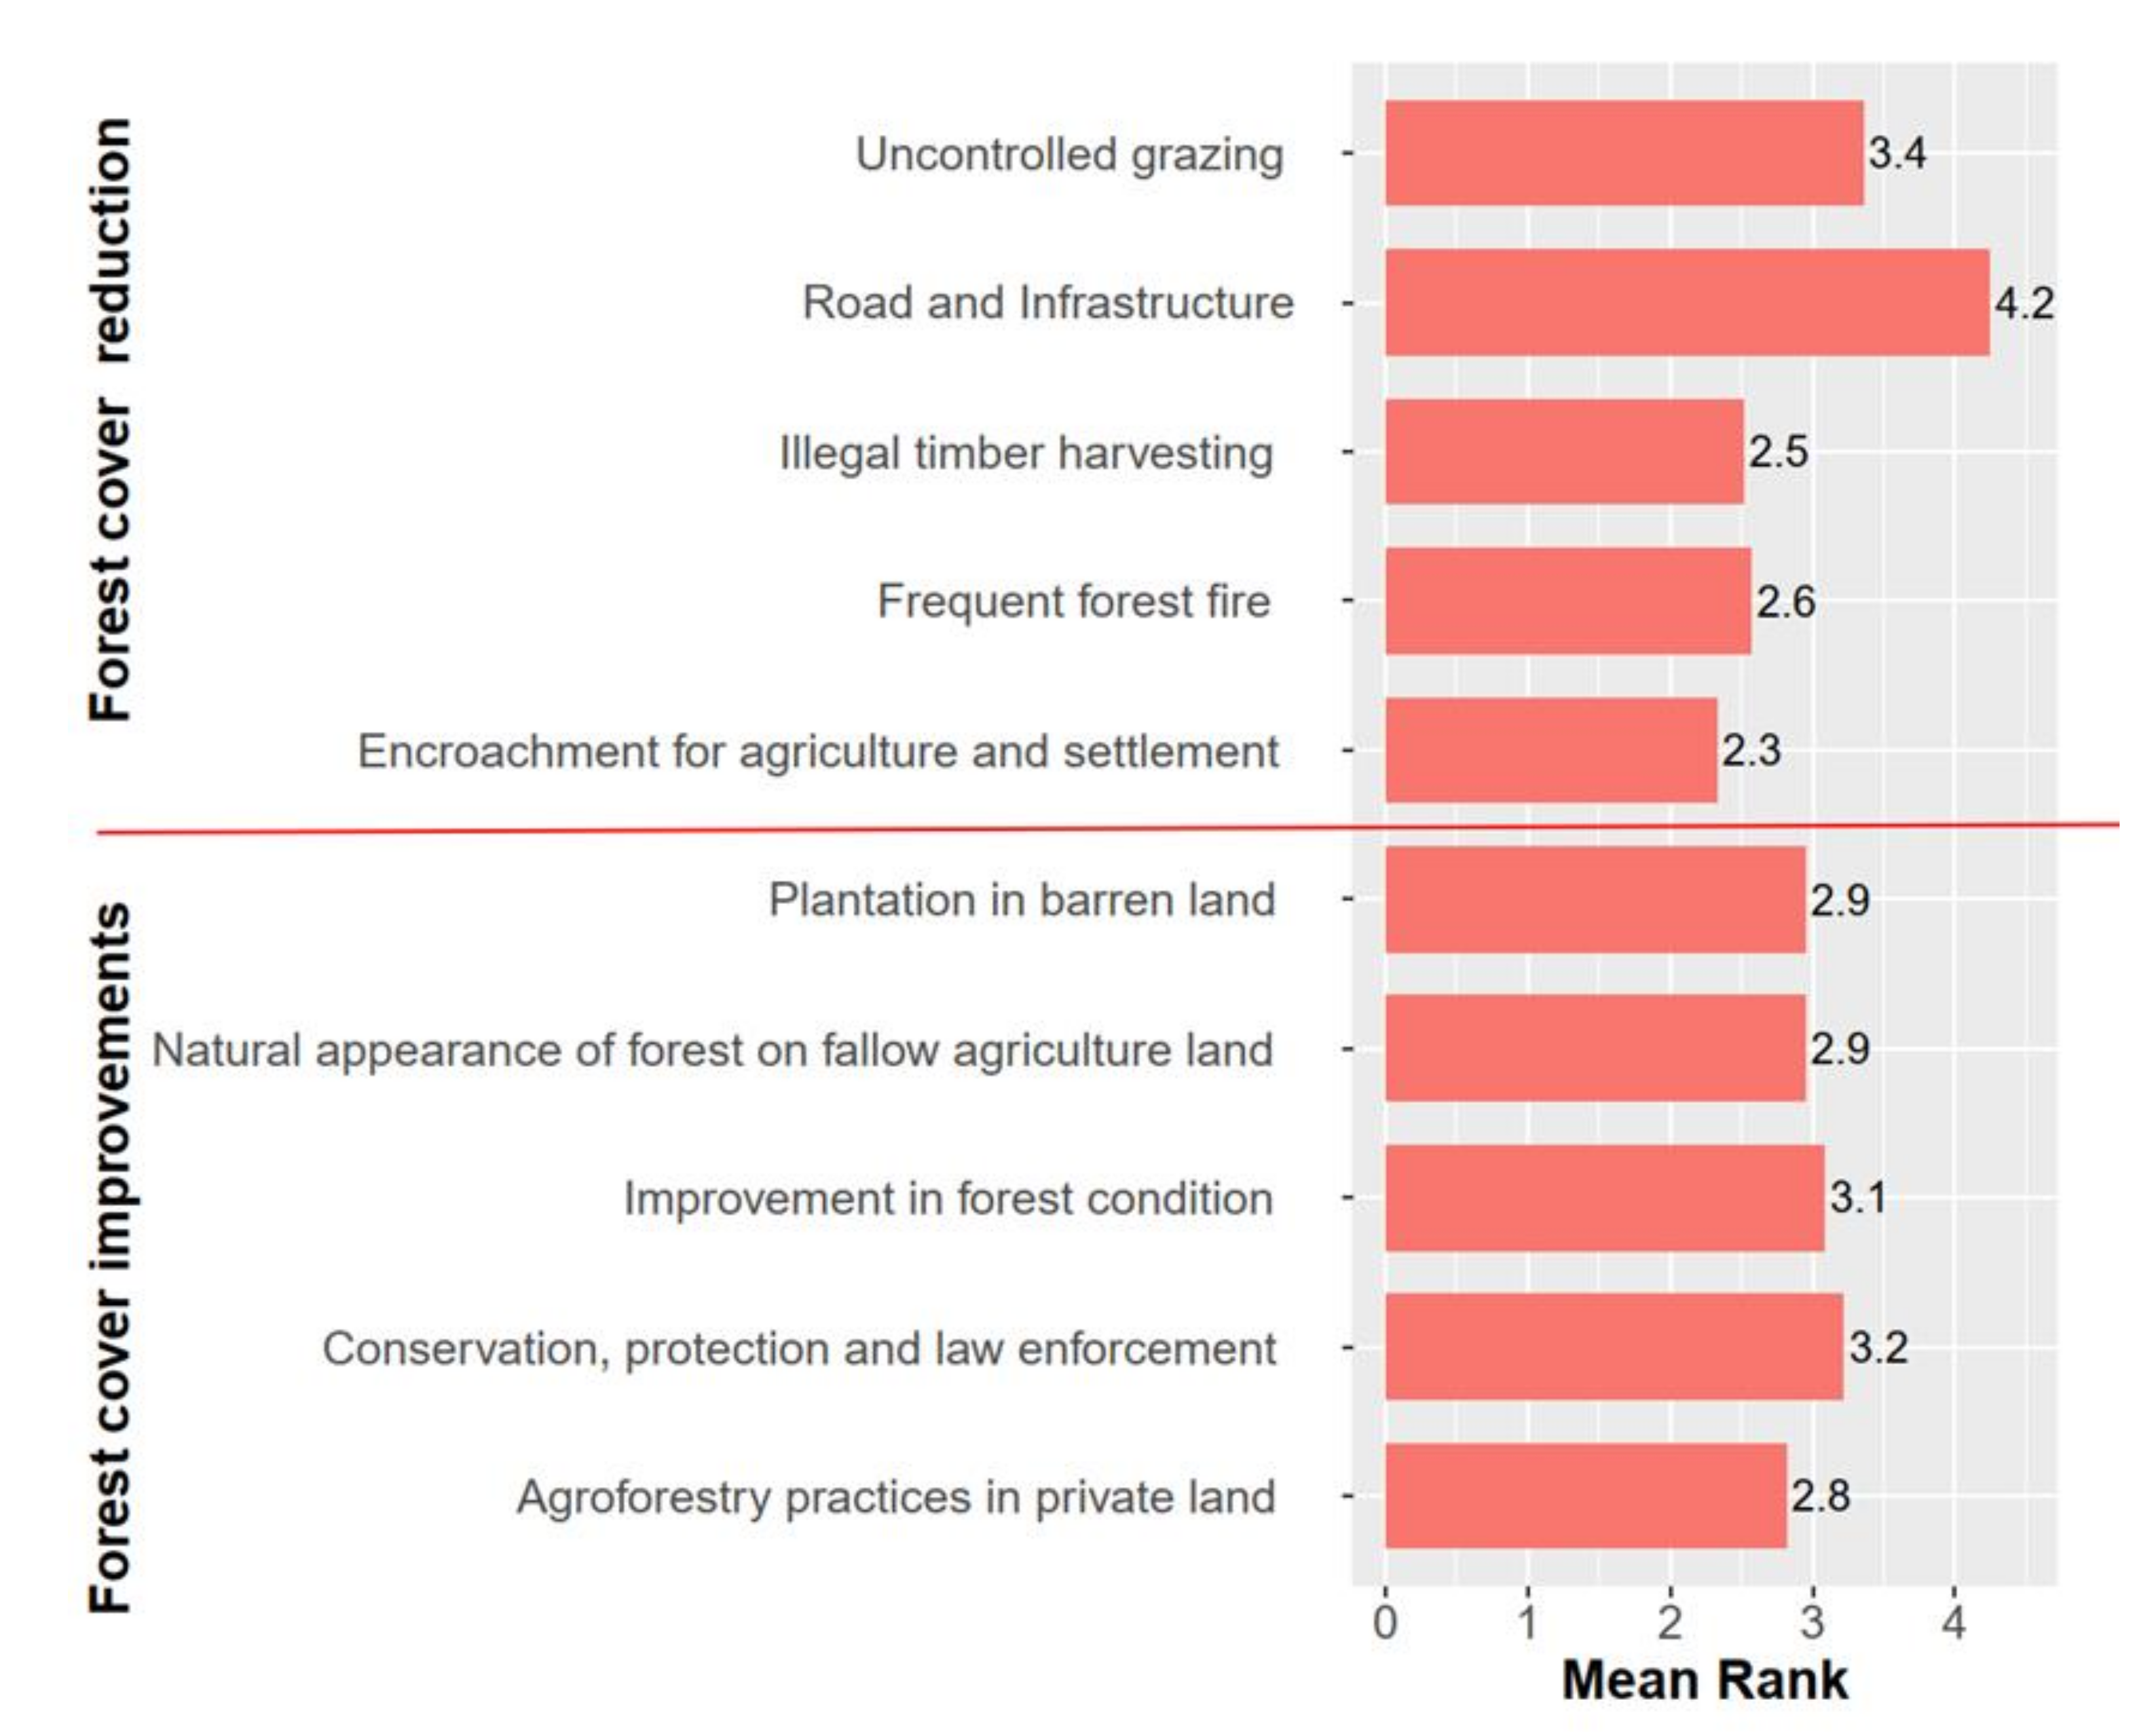
3.2.2. Community Perception on Forest Cover Change and Underlying Causes

From the FGDs and consultation with stakeholders, different causes responsible for forest cover improvements and reduction and CF activities associated with forest cover improvements were analyzed. Common causes responsible for forest cover enhancement and reduction were listed and a prioritization exercise was performed based on community judgement to identify the major causative factors. At the same time, community forestry activities and their effectiveness to improve forest cover status were documented and analyzed based on existing operational plans and local community response. Plantation in public barren land through different conservation programs; increased agroforestry practices in private land; natural appearance of forest on fallowing agriculture land due to migration, occupation shift, and labor shortage; improvements in forest conditions due to CF management activities and reduced dependency on forest through increased use of alternative energy and LP gas; and increased priority on conservation, protection, and forest law enforcement were documented as reasons for forest cover improvements (Figure 8). Deforestation due to road and infrastructure development; encroachment of forest land for agriculture and settlements; illegal timber harvesting; frequent forest fires; and uncontrolled grazing activities were reasons for forest cover reduction (Figure 9). The reduction trend experienced was higher before 1991 and improvements observed were higher after 1991. These community responses validated the results we obtained through satellite image analysis.
Based on prioritization ranking of the identified factors responsible for both positive and negative forest cover change, we found that all the factors listed for forest cover improvements were equally responsible (Friedman’s chi-squared value 1.40; p = 0.84). However, agroforestry practices followed by plantation and natural appearance of forest on fallow agriculture lands were further contributing reasons (Figure 8). In the case of forest cover reductions, community encroachment of forest land for agriculture and settlements was a major cause followed by illegal harvesting, frequent forest fires, uncontrolled grazing, and road and infrastructure development (calculated Friedman’s chi-squared 37.72; p < 0.05). We observed a significant difference among mean rank as community people were more confident about a major cause of the reduction. The literature has revealed that there was remarkable deforestation for agriculture and settlements in hilly areas in previous times. Our satellite image analysis also revealed that there was more conversion of forestland to agriculture and barren land.

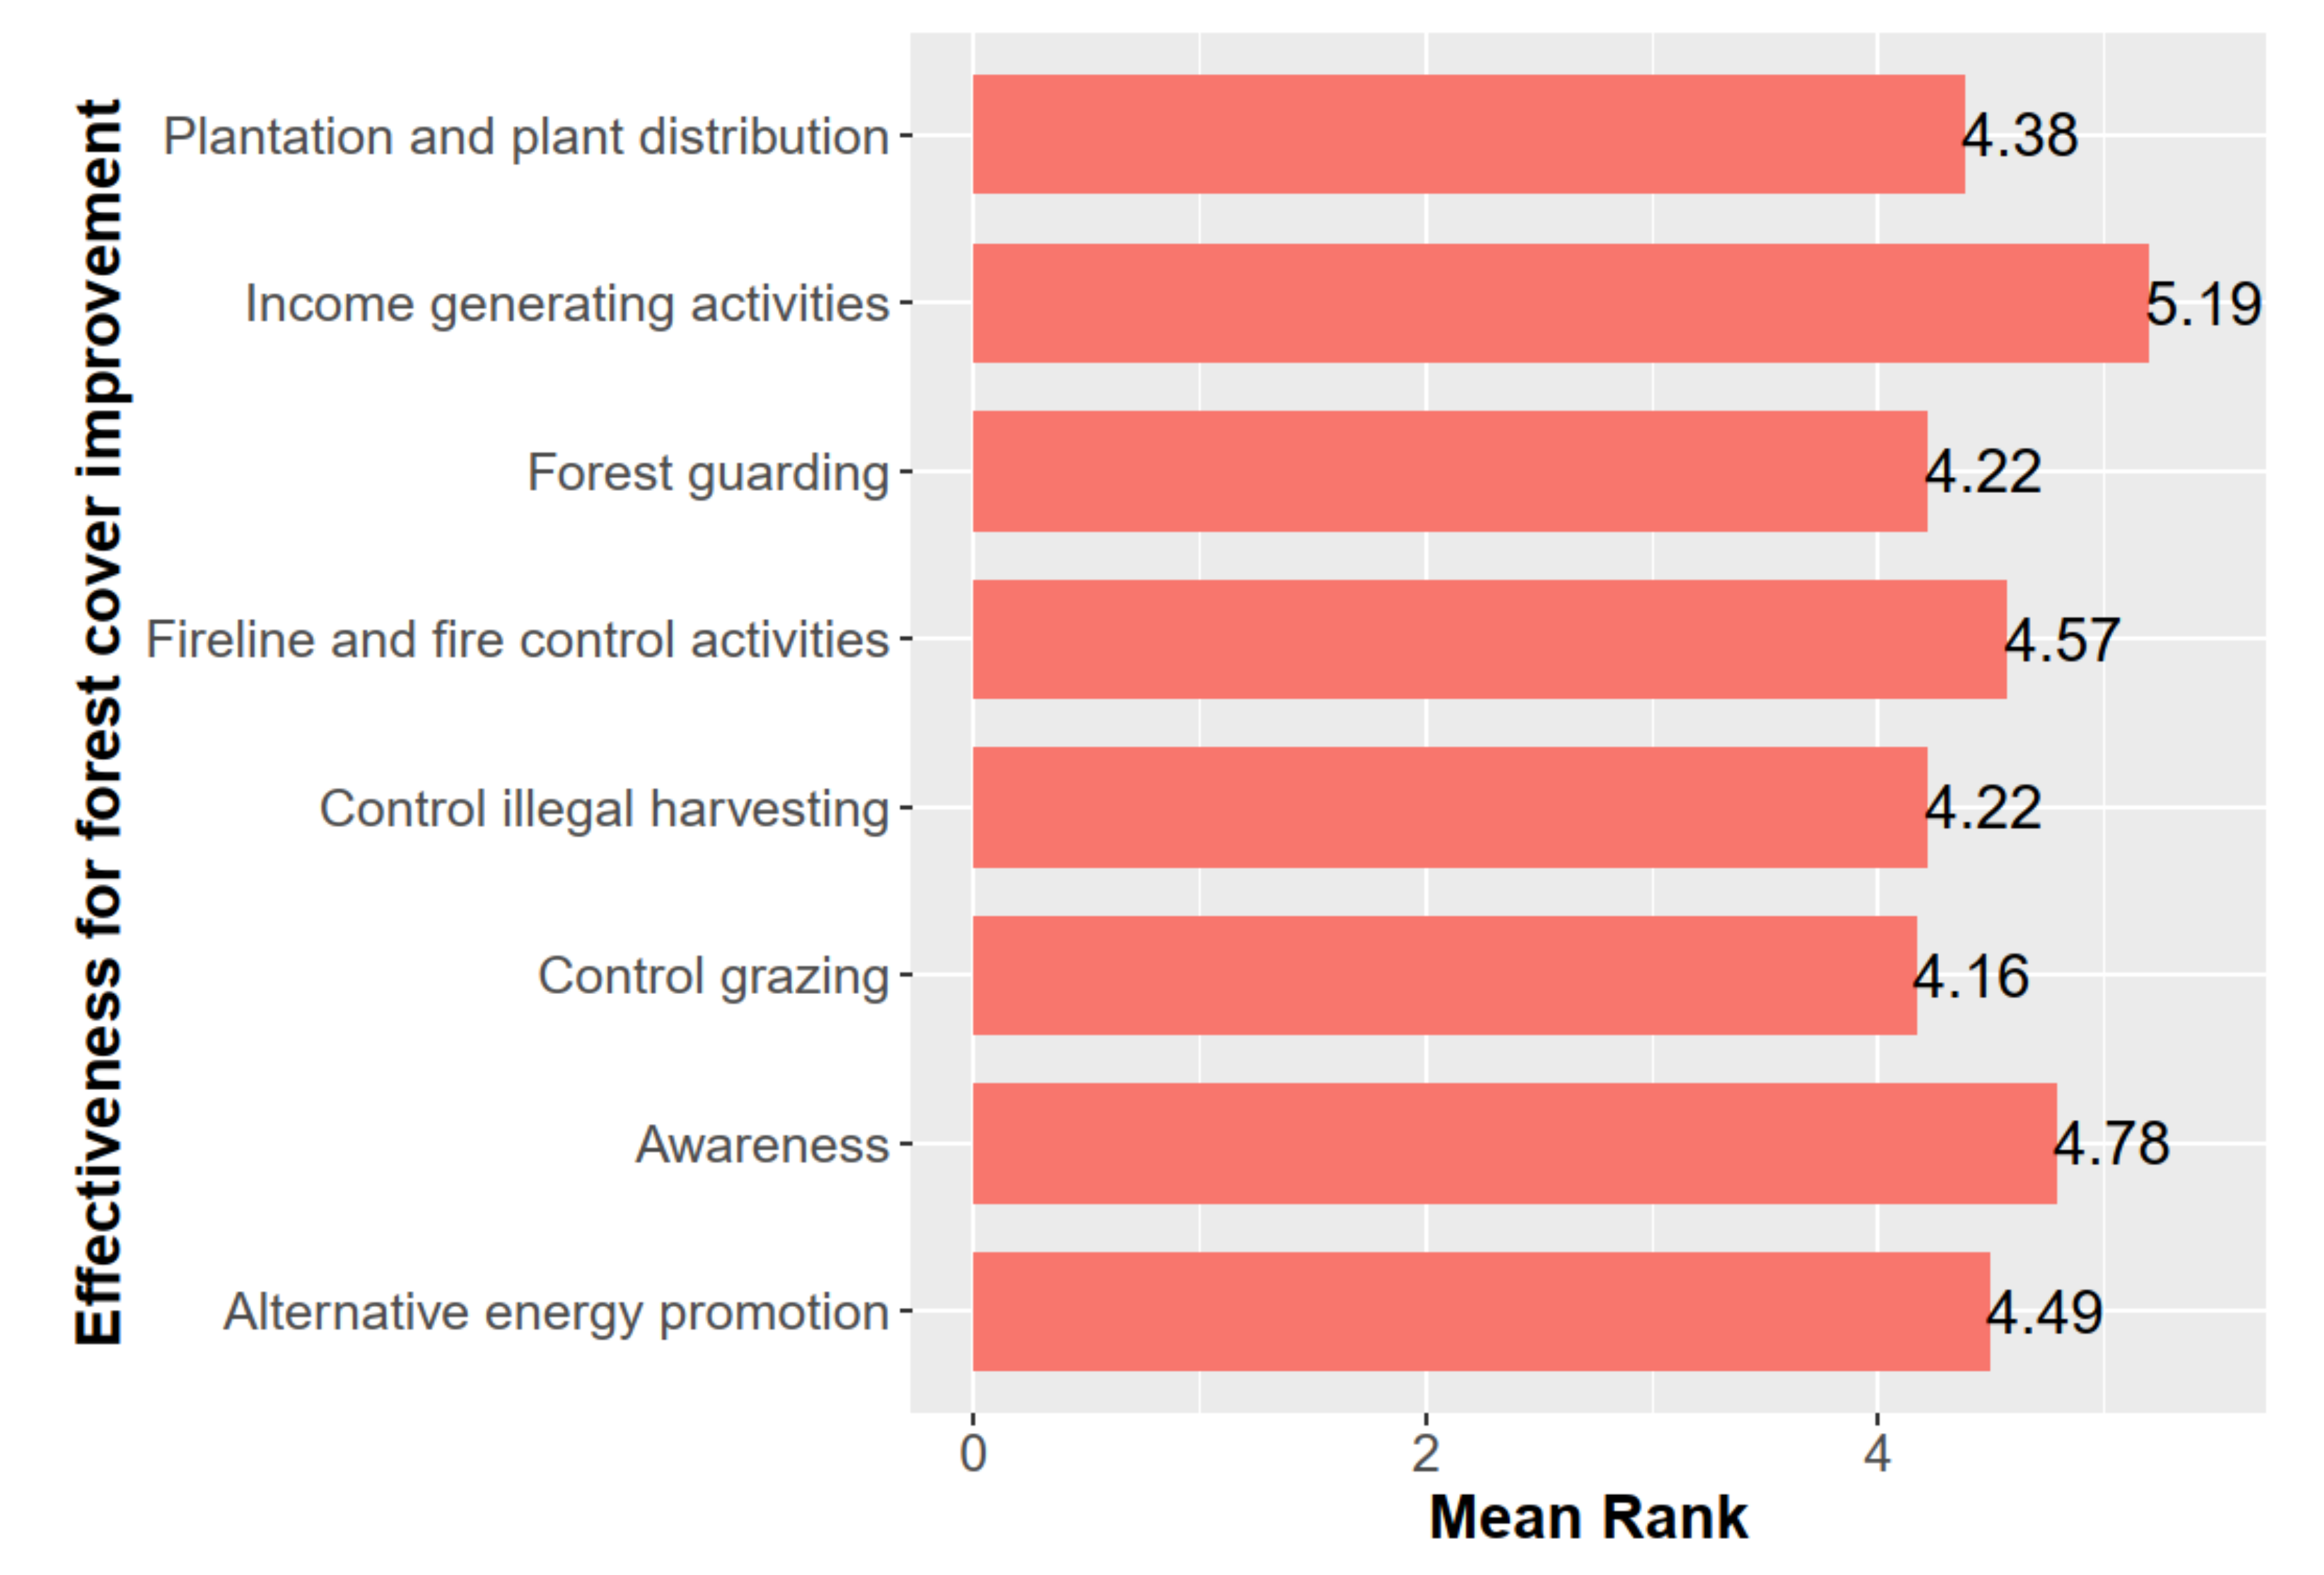
3.2.3. CF Activities and Investment to Improve Forest Cover

Community forest user group activities related to forest cover improvements were documented based on a review of their operation plan and FGD. Thus, a prepared list of activities was shared with individual participants in an FGD to give their priority rank on different activities based on the effectiveness of forest cover improvements. Planation and plant distribution, control of grazing, construction of fire lines and fire control, awareness, promotion of alternative energy, forest guarding, income-generating activities, and control of illegal harvesting were common activities found responsible for forest cover improvements in most of the user groups. Based on community ranking, we observed that all these activities were equally effective for forest cover improvements in the area (Friedman’s test value 5.26; p = 0.63). The majority of the local community perceived that control of illegal activities, control of grazing, and forest guarding were relatively more effective activities (with lesser mean rank) (Figure 8).

4. Discussion

Forest growth was observed in the study area in a period of 40 years. Similar results were observed by [10] in the Dolakha District which lies at the Mid-hills of Nepal, where forest cover increased at a rate of about 2% per year in CF despite a high population growth rate between 1990 to 2010. Forest cover increase in the study area was due to CF management, plantation on barren lands, and forest conservation by forest users. The authors of [27] observed similar results in the Mid-hills between 1978 and 1992, where the high forest increased by 77% in VDCs with CF in comparison with 13% in the VDC without CF. We observed that the expansion of cropland was one of the major drivers of land cover change. Expansion of agricultural land at the cost of forest loss is a common phenomenon in the mountain zones of developing countries [28,29]. Most of the forest cover has gained from barren land, which was also observed by [8] in their study on the Upper Rosi watershed in the middle mountain region [30], in Galaudu and Pokhare Khola watersheds, and [31] in the Upper Ludhi Khola sub-watershed in the Mid-hills of Nepal. The authors of [32] highlighted that the normalized difference vegetation index (NDVI) increased at a rate of 0.0018% per year from 2000 to 2017 for the entire country. Forest cover gain from barren and cultivated land was also observed in the eastern part of Nepal during the period of 2006–2016 [33]. The authors of [34] assessed the LULC change in the Phewa watershed of the western region and concluded that the gain of dense forest was simultaneous with decreasing grassland and cultivated land during the period of 1995 to 2015. The authors of [35] have also assessed the LULC change of the Gandaki River Basin and found a similar result of forest cover increment, which was gained from cropland and barren land during the period of 1990 to 2015.
Increasing population, human settlement encroachments, and road network developments have been identified as factors that accelerate negative forest cover change [36]. Development of infrastructure often facilitates in-migrants’ access to the tropical frontier regions and these new in-migrants then clear-cut forests for farming [37]. The authors of [38] observed a similar result and noted that large tracts of forest were limited only in the higher slope and least accessible areas as development proceeds.
In the last three decades, changes in forest policy have led to immense progress in the conservation and restoration of the nation’s forests [39] with the introduction of the CF program. Effective monitoring of the community forests by local user groups was one of the reasons for improved forest conditions [8]. The authors of [10] observed a similar result; namely, key factors in the increase in forest cover include awareness through education, use of alternative energy resources, provision of incentives to local communities from different programs and projects, and, most importantly, local ownership. High level of participation of user group member on the forest protection activities [40].
LULC change is the result of interactions of multiple factors, where migration from uphill to low land and towards roads and urban places contributed to both loss and gain of forest and changed land-use patterns in the region [41]. There is continuous land abandonment in the Mid-hills due to labor shortage, as the younger population relies heavily on foreign employment. Increased costs of production [42] have created a favorable environment for the natural appearance of natural vegetation.
Our analysis of LULC change dynamics of the study area revealed that forest cover has decreased from 1976–1991 but improved thereafter. The CF program was initiated in 1992, the handover process continued, and now there are 587 CFs in total. As from the discussion with the government agency, it was found that conservation activities conducted by the CF and other organizations were effective in regaining forest cover. CF has played a positive impact on forest cover improvements. However, there are many issues regarding scientific management, bureaucratic control, poor plan implementation, technicality, and policy hurdles. There were many factors that contributed to forest cover change and their relationships are very complex. While the role of CFs is highly appreciated regarding forest cover improvement, understanding the exact contribution of CFs has been challenging as socioeconomic and biophysical activities and CF factors are interconnected. Further focused and multidisciplinary research is needed to understand the role and contribution of CFs.

5. Conclusions

About 60% of the land was covered by forest in 1976, which continuously reduced until 1991 to 52% coverage. The forest subsequently gradually regained and became 61% coverage in 2015. Forest decreased at a rate of 0.96% until 1991, and then from 1991–2015 forest increased at a rate of 0.63%. This may be due to the interventions of CFs. The overall rate of change from 1976–2015 was 0.02%. Change analysis based on temporal Landsat imagery clearly demonstrated the tradeoff between forest and agriculture and barren land uses. Both improvements and forest reductions were mostly associated with agriculture and barren land. These could be the reasons for deforestation (mainly agriculture and timber) and reappearance of forest on agriculture and barren land due to tree plantation and natural regeneration.
Expansion of CF programs and forest cover trend were positively correlated and accepted by community members. Activities such as awareness, fire line construction, overgrazing control practices, plantation, income-generating activities, promotion of alternative energy, and control of illegal activities with better policy enforcement were appreciated.
Along with CF, the natural appearance of trees in private agricultural land (which remains fallow for a long time due to out-migration and occupation shift), plantations in barren land through different conservation programs, promotion of agroforestry practices, and decreased dependency on forest due to increased use of LP gas, electricity, and other alternative energy seems equally responsible for improvements of forest cover. At the same time, expansion of agriculture land and settlements with the encroachment of forest area, haphazard infrastructure development, roads, illegal timber harvesting, frequent forest fires, and uncontrolled grazing were responsible for the reduction of forest area. The overall LULC dynamics of the district were governed by a complex interconnection of different biophysical and socio-economic drivers. Further research is essential to understand their exact contributions, as understanding of forest cover changes and the associated factors is crucial for sustainable land use planning and development.

Author Contributions

Conceptualization, S.T. and H.A.; Formal analysis, H.A., S.T., R.S.; Methodology, S.T. and H.A.; Supervision, R.S.; Writing—original draft, S.T.; Writing—review & editing, R.S. and H.A. All authors have read and agreed to the published version of the manuscript.

Funding

This research received no external funding.

Acknowledgments

Hari Adhikari acknowledges funding from the Academy of Finland for the SMARTLAND project (decision number 318645). Three anonymous reviewers and the Journal Editor are thanked for useful insights and comments that helped improve this work.

Conflicts of Interest

The authors declare no conflict of interest.

References

  1. FRA. On Definitions of Forest and Forest Change; Food and Agriculture Organization of UN: Rome, Italy, 2000.
  2. Uusivuori, J.; Lehto, E.; Palo, M. Population, income and ecological conditions as determinants of forest area variation in the tropics. Glob. Environ. Chang. 2002, 12, 313–323. [Google Scholar] [CrossRef]
  3. Abdullah, S.A.; Nakagoshi, N. Forest fragmentation and its correlation to human land use change in the state of Selangor, peninsular Malaysia. Ecol. Manag. 2007, 241, 39–48. [Google Scholar] [CrossRef]
  4. Amatya, S.; Shrestha, K.R. Nepal Forestry Hand Book; Nepal foresters’ Association Kathmandu Nepal: Kathmandu, Nepal, 2010. [Google Scholar]
  5. DFRS. State of Nepal’s Forests; Forest Resource Assessment (FRA) Nepal, Department of Forest Research and Survey (DFRS): Kathmandu, Nepal, 2015.
  6. Krishna-Bahadur, K.C. Combining Socio-Economic and Spatial Methodologies in Rural Resources and Livelihood Development: A Case from Mountains of Nepal; Margraf: Vicenza, Italy, 2005. [Google Scholar]
  7. Agrawal, A.; Ostrom, E. Collective action, property rights and decentralization in resource use in India and Nepal. Politics Soc. 2001, 29, 485–514. [Google Scholar] [CrossRef] [Green Version]
  8. Gautam, A.P.; Shivakoti, G.P.; Webb, E.L. Forest cover change, physiography, local economy, and institutions in a mountain watershed in Nepal. Environ. Manag. 2004, 33, 48–61. [Google Scholar] [CrossRef] [PubMed]
  9. Jackson, W.J.; Tamrakar, R.M.; Hunt, S.; Shepherd, K.R. Land-use changes in two middle hills districts of Nepal. Mt. Res. Dev. 1998, 18, 193–212. [Google Scholar] [CrossRef]
  10. Niraula, R.R.; Gilani, H.; Pokharel, B.K.; Qamer, F.M. Measuring impacts of community forestry program through repeat photography and satellite remote sensing in the Dolakha district of Nepal. J. Environ. Manag. 2013, 126, 20–29. [Google Scholar] [CrossRef] [PubMed]
  11. Dangi, R. REDD+: Issues and challenges from a Nepalese perspective. Clim. Chang. UNFCCC Negot. Process. 2012, 6, 61. [Google Scholar]
  12. Poudyal, B.H.; Maraseni, T.; Cockfield, G. Scientific forest management practice in Nepal: Critical reflections from stakeholders’. Perspectives 2020, 11, 27. [Google Scholar] [CrossRef] [Green Version]
  13. FAO. State of the World’s Forests; Food and Agriculture Organization of the United Nations: Rome, Italy, 2011. [Google Scholar]
  14. Fawzi, N.I.; Husna, V.N.; Helms, J.A. Measuring deforestation using remote sensing and its implication for conservation in Gunung Palung National Park, West Kalimantan, Indonesia. In IOP Conference Series: Earth and Environmental Science; IOP Publishing: Bristol, UK, 2018; Volume 149, p. 012038. [Google Scholar]
  15. Wulder, M.A.; Masek, J.G.; Cohen, W.B.; Loveland, T.R.; Woodcock, C.E. Opening the archive: How free data has enabled the science and monitoring promise of Landsat. Remote Sens Environ. 2012, 122, 2–10. [Google Scholar] [CrossRef]
  16. Tekle, K.; Hedlund, L. Land cover changes between 1958 and 1986 in kalu district, southern wello, Ethiopia. Mt. Res. Dev. 2000, 20, 42–51. [Google Scholar] [CrossRef]
  17. UN Economic. Guidelines and manual on land-use planning and practices in watershed management and disaster reduction. In Guidelines and Manual on Land-Use Planning and Practices in Watershed Management and Disaster Reduction; UN Economic and Social Commission for Asia and the Pacific: Bangkok, Thailand, 1997. [Google Scholar]
  18. Joerin, F.; Thériault, M.; Musy, A. Using GIS and outranking multicriteria analysis for land-use suitability assessment. Int. J. Geogr. Inf. Sci. 2001, 15, 153–174. [Google Scholar] [CrossRef]
  19. Adhikari, H. Change Detection on the Cultural Landscape in the Philippines with Regards to Redd + Pilot Area over a Period of 21 Years. Ph.D. Thesis, Technische Universitaet Muenchen, Freising, Germany, July 2012. [Google Scholar] [CrossRef]
  20. Vanonckelen, S.; Lhermitte, S.; Van Rompaey, A. The effect of atmospheric and topographic correction on pixel-based image composites: Improved forest cover detection in mountain environments. Int. J. Appl. Earth Obs. Geoinf. 2015, 35, 320–328. [Google Scholar] [CrossRef]
  21. Adhikari, H.; Heiskanen, J.; Maeda, E.E.; Pellikka, P.K.E. The effect of topographic normalization on fractional tree cover mapping in tropical mountains: An assessment based on seasonal Landsat time series. Int. J. Appl. Earth Obs. Geoinf. 2016, 52, 20–31. [Google Scholar] [CrossRef]
  22. Kuemmerle, T.; Radeloff, V.C.; Perzanowski, K.; Hostert, P. Cross-border comparison of land cover and landscape pattern in Eastern Europe using a hybrid classification technique. Remote Sens Environ. 2006, 103, 449–464. [Google Scholar] [CrossRef]
  23. Paudyal, K.; Baral, H.; Putzel, L.; Bhandari, S.P.; Keenan, R.J. Change in Land Use and Ecosystem Services Delivery from Community-Based Forest Landscape Restoration in the Phewa Lake Watershed, Nepal. Int. For. Rev. 2017, 19 (Suppl. 4), 88–101. [Google Scholar] [CrossRef]
  24. Puyravaud, J.-P. Standardizing the calculation of the annual rate of deforestation. Ecol. Manag. 2003, 177, 593–596. [Google Scholar] [CrossRef]
  25. Friedman, M. The use of ranks to avoid the assumption of normality implicit in the analysis of variance. J. Am. Stat. Assoc. 1937, 32, 675–701. [Google Scholar] [CrossRef]
  26. Bhatta, K.P.; Bhattarai, S.; Aryal, A. Community based anti-poaching operation: Effective model for wildlife conservation in Nepal. Poult. Fish. Wildl. Sci. 2018, 6, 2. [Google Scholar] [CrossRef]
  27. Gautam, A.P.; Webb, E.L.; Eiumnoh, A. GIS assessment of land use/land cover changes associated with community forestry implementation in the middle hills of Nepal. Mt. Res. Dev. 2002, 22, 63–69. [Google Scholar] [CrossRef]
  28. Bawa, K.S.; Seidler, R. Deforestation and sustainable mixed-use landscapes: A view from the eastern himalaya. Ann. Mo. Bot. Gard. 2015, 100, 141–149. [Google Scholar] [CrossRef]
  29. Uddin, K.; Chaudhary, S.; Chettri, N.; Kotru, R.; Murthy, M.; Chaudhary, R.P.; Ning, W.; Shrestha, S.M.; Gautam, S.K. The changing land cover and fragmenting forest on the roof of the world: A case study in Nepal’s kailash sacred landscape. Landsc. Urban. Plan. 2015, 141, 1–10. [Google Scholar] [CrossRef] [Green Version]
  30. Balla, M.K.; Awasthi, K.D.; Singh, B.R.; Sitaula, B.K.; Pradhan, B.M. Land use changes and geomorphometric analyses in galaudu and Pokhare Khola watersheds in mid-hill region of Nepal. Int. J. Ecol. Environ. Sci. 2007, 33, 171–182. [Google Scholar]
  31. Lamichhane, B.R. Dynamics and Driving Forces of Land Use/Forest Cover Change and Indicators of Climate Change in a Mountain Sub-Watershed of Gorkha. Master’s Thesis, Tribhuvan University, Pokhara, Nepal, December 2008. [Google Scholar]
  32. Baniya, B.; Tang, Q.; Pokhrel, Y.; Xu, X. Vegetation dynamics and ecosystem service values changes at national and provincial scales in Nepal from 2000 to 2017. Environ. Dev. 2019, 32, 100464. [Google Scholar] [CrossRef]
  33. Rimal, B.; Sharma, R.; Kunwar, R.; Keshtkar, H.; Stork, N.E.; Rijal, S.; Rahman, S.A.; Baral, H. Effects of land use and land cover change on ecosystem services in the Koshi River basin, Eastern Nepal. Ecosyst. Serv. 2019, 38, 100963. [Google Scholar] [CrossRef]
  34. Paudyal, K.; Baral, H.; Bhandari, S.P.; Bhandari, A.; Keenan, R.J. Spatial assessment of the impact of land use and land cover change on supply of ecosystem services in Phewa watershed, Nepal. Ecosyst. Serv. 2019, 36, 100895. [Google Scholar] [CrossRef]
  35. Rai, R.; Zhang, Y.; Paudel, B.; Acharya, B.K.; Basnet, L. Land use and land cover dynamics and assessing the ecosystem service values in the trans-boundary Gandaki River basin, Central Himalayas. Sustainability 2018, 10, 3052. [Google Scholar] [CrossRef] [Green Version]
  36. Pfaff, A.S.P. What drives deforestation in the Brazilian Amazon? Evidence from satellite and socioeconomic data. J. Environ. Econ. Manag. 1999, 37, 26–43. [Google Scholar] [CrossRef]
  37. Peralta, P.; Mather, P. An analysis of deforestation patterns in the extractive reserves of Acre, Amazonia from satellite imagery: A landscape ecological approach. Int. J. Remote Sens 2000, 21, 2555–2570. [Google Scholar] [CrossRef]
  38. Dull, R.A. Evidence for forest clearance, agriculture, and human-induced erosion in pre-Columbian El Salvador. Ann. Assoc. Am. Geogr. 2007, 97, 127–141. [Google Scholar] [CrossRef]
  39. Agrawal, A.; Chhatre, A. Explaining success on the commons: Community forest governance in the Indian Himalaya. World Dev. 2006, 34, 149–166. [Google Scholar] [CrossRef]
  40. Chhetri, B.B.K.; Johnsen, F.H.; Konoshima, M.; Yoshimoto, A. Community forestry in the hills of Nepal: Determinants of user participation in forest management. Policy Econ. 2013, 30, 6–13. [Google Scholar] [CrossRef]
  41. Bhawana, K.C.; Wang, T.; Gentle, P. Internal migration and land use and land cover changes in the middle mountains of Nepal. Mt. Res. Dev. 2017, 37, 446–455. [Google Scholar]
  42. Jaquet, S.; Shrestha, G.; Kohler, T.; Schwilch, G. The effects of migration on livelihoods, land management, and vulnerability to natural disasters in the Harpan watershed in Western Nepal. Mt. Res. Dev. 2016, 36, 494–505. [Google Scholar] [CrossRef] [Green Version]
Figure 1. Study area map showing the Tanahun District and Chhang Range.
Remotesensing 12 02756 g001
Figure 2. Trend of community forest handover in Tanahun District.
Remotesensing 12 02756 g002
Figure 3. Flow chart for methodology of land use and land cover (LULC) map.
Remotesensing 12 02756 g003
Figure 4. Land use and land cover map for (a) 1976, (b) 1991, and (c) 2015.
Remotesensing 12 02756 g004
Figure 5. Comparison of land use and land cover (LULC) class in the years 1976, 1991, and 2015.
Remotesensing 12 02756 g005
Figure 6. (a) Forest reduction in the study area from 1976–1991 and (b) 1991–2015.
Remotesensing 12 02756 g006
Figure 7. (a) Forest enhancement in the study area from 1976–1991 and (b) 1991–2015.
Remotesensing 12 02756 g007
Figure 8. Causes of positive and negative forest cover change. Friedman’s Chi-squared and p-value for forest cover improvements were 1.41 and 0.8,4 respectively, and for forest cover reduction 37.73, and <0.001, respectively.
Remotesensing 12 02756 g008
Figure 9. Perceived effectiveness of community forestry activities for forest cover improvements.
Remotesensing 12 02756 g009
Table 1. Surface reflectance bands of Landsat 2 (Multispectral Scanner), 5 (Thematic Mapper), and 8 (Operational Land Imager) used in this study. NIR and SWIR represent near-infrared band and short-wave infrared band, respectively.
TitleLandsat 2 MSSLandsat 5 TMLandsat 8 OLI
Acquisition daysFebruary 19, 1976March 18, 1991April 05, 2015
Path and rows of images152, 041142, 041142, 041
Cloud cover percentage0%0%0%
BandsGreen (0.5–0.6 μm)Blue (0.45–0.52 μm)Blue (0.45–0.51 μm)
Red (0.6–0.7 μm)Green (0.52–0.60 μm)Green (0.53–0.59 μm)
NIR1 (0.7–0.8 μm)Red (0.63–0.69 μm)Red (0.64–0.67 μm)
NIR2 (0.8–1.1 μm)NIR (0.77–0.90 μm)NIR (0.85–0.88 μm)
SWIR1 (01.55–1.75 μm)SWIR1 (01.57–1.65 μm)
SWIR2 (2.09–2.35 μm)SWIR2 (2.11–2.29 μm)
Table 2. Land use land cover description.
ClassDescription
ForestThe area covered by tree, shrubs, and herbs.
Barren landThe area with exposed soil.
Agriculture landThe land that is cultivated once a year or cultivated before and now that are not cultivated but not converted into barren land or forest.
Sand and settlementThe urban area and sand on riverbank
WaterAll land covered by rivers and lakes.
Table 3. Land use land cover change dynamics from 1976–1991 (in %).
1991
Land Use ClassWaterBarren LandAgricultural LandSand and SettlementForestTotal
1976Water0.240.040.120.060.050.51
Barren land0.090.230.280.060.431.09
Agricultural land0.227.1722.071.516.0537.00
Sand and settlement0.120.010.230.270.010.64
Forest0.087.306.830.5146.0560.76
Total0.7514.7429.532.3952.59100.00
Table 4. Land use land cover change dynamics from 1991–2015 (in %).
2015
Land Use ClassWaterBarren LandAgricultural LandSand and SettlementForestTotal
1991Water0.370.010.120.220.020.75
Barren land0.042.084.350.228.0414.74
Agricultural land0.263.9715.741.617.9529.53
Sand and settlement0.120.301.120.300.572.40
Forest0.072.824.730.2744.7052.59
Total0.869.1826.062.6261.28100.00
Table 5. Land use land cover change dynamics from 1976–2015 (in %).
2015
Land Use ClassWaterBarren LandAgricultural LandSand and SettlementForestTotal
1976Water0.220.020.100.130.030.51
Barren land0.090.130.330.100.451.09
Agricultural land0.315.1619.271.8410.4237.00
Sand and settlement0.160.020.210.240.020.64
Forest0.093.866.150.3150.3560.76
Total0.869.1826.062.6261.28100.00

