1. Introduction and Background
Inventory and control surveys are ordinarily conducted on transportation infrastructures (bridges, retaining walls, embankments, etc.) to validate design assumptions and/or diagnostic examinations to guarantee exploitation safety and/or suitable modernization [
1,
2,
3,
4,
5]. These acquire a special significance in the case of historic objects (as in the present case), which require maintenance with appropriate conservation requirements. Data obtained from the structure inspection constitute an essential source of knowledge about the structure health and/or apparent defects. Such inspections are required in most countries and are implemented based on a routine maintenance and protection plan of transportation infrastructures. Standard examinations and control works are normally carried out only on chosen elements by technical inspectors and conservators.
Usually, inventory, control and conservation works require close contact with the analyzed structures. Such an approach, in some cases, may generate difficulties in terms of construction accessibility for control works. Such works usually require the use of scaffolding, crane or specialized alpinists, which significantly raises control, conservation and maintenance expenses. Sometimes the problem is more complicated when object documentation is missing—particularly for historic bridges. This causes major problems during renovation and/or maintenance operations. Control and inventory works executed using conventional methods (tachymetry, levelling and manual measurements) can be very arduous, particularly in the case of structures with a complicated and complex shape, e.g., trusses or high structures consisting of many elements. In addition, this work requires the use of several research crews. Some investigators [
6,
7,
8] use a traditional method for construction surveys. This requires that a reference survey network be placed both on the measured structure and beyond. The measurement points on the structure are marked or signalized. This method is completely proper, but time-consuming and further analysis of the obtained results can be limited and difficult. Reference points situated outside the examined object permit determination of changes in the object shape (or its elements) in relation to the external geodetic network.
The rapid development of survey methods, especially hybrid measurement, allows the attainment of complete data relating to object geometry and information about potential damages. New technologies enable the inventory and control works to be carried out faster, more accurately and at relatively low costs. Photogrammetric and terrestrial laser scanning (TLS) techniques seem to be very good alternatives to traditional inventory and conservation tools. Such methods are very useful thanks to advanced measurement tools and the possibility of computer visualization of the obtained results [
9,
10,
11,
12,
13,
14,
15].
TLS technique—apart from the higher operational cost—has drawbacks related to the technical performance under certain circumstances such as:
- (i)
Some parts of the structure are invisible to the laser scanner (for example bottom parts of the bridge deck);
- (ii)
The texture of the tested bridge elements is not correctly presented, which makes potential corrosion of the elements is invisible;
- (iii)
It can generate large volumes of data, most of which are redundant, which makes data processing more complicated.
While the photogrammetric technique can generate precise 3D data captured in different positions and orientations [
16]. Nowadays, the close-range photogrammetric technique is becoming very popular for research purposes due to the high correlation between the efficiency and low-cost of digital cameras. Therefore, the combination of two techniques (TLS and photogrammetric) is very useful. These techniques can get descriptive and metric data that is necessary to generate photorealistic 3D structure models.
The literature is replete with various applications of photogrammetric and laser scanning techniques. Such methods are used for archaeological, engineering, art, tourism, urban security, urban planning, videogames industries (generation of 3D/4D photorealistic building models), digital preservation of singular elements (for example generation of a 3D model of a church) and digital preservation of the historical heritage purposes [
16,
17,
18,
19,
20,
21,
22,
23,
24,
25,
26,
27]. Three-dimensional modeling using TLS and photogrammetric techniques is also used for secure of civil engineering infrastructures (as prevention, i.e., maintenance). This is especially important for the strategic transportation infrastructures like bridges, roads, airports, etc. The TLS and photogrammetric techniques provide the opportunity to obtain a point cloud [
11,
16,
24,
28,
29,
30]; therefore, they can be efficiently applied in the inventory and maintenance of objects (including historic)—in particular, those with difficult access. This can be interpreted as a kind of reverse engineering.
Petrovic et al. [
31] illustrated various surveying techniques for the inventory and study of cultural heritage structures. Yu et al. [
8] presented an analysis of survey techniques, survey accuracy, tested structure types and the cost of applied survey methods. Nevertheless, it should be underlined that the given data (for example regarding TLS) is overly ambitious because obtaining an accuracy of less than one millimeter is practically restricted to small structures. Additionally, in these cases the distance between the examined structures and the scanner should be relatively short. Vicente et al. [
32] presented an approach to monitor displacements and rotations of structures using a novel laser- and video-based displacement transducer. The proposed system combines the use of laser beams, LED lights and a digital video camera and was specifically designed to capture static and slow-varying displacements. Dabous and Feroz [
33] presented four noncontact technologies—namely, ground penetrating radar, close-range photogrammetry, infrared thermography and TLS—for bridge condition testing.
In bridge engineering, the TLS technique is particularly used to determine bridge deflections and to assess bridge condition [
13,
34,
35,
36,
37]. In addition, Perez et al. [
38] used TLS to show the geometry of the Roman bridge of Alcántara, which made it possible to analyze its deformations and assess its structure. Kermarrec et al. [
39] used TLS to assess the impact of neglecting correlations of distance computation when a mathematical approximation is performed. The results of the simulations were extended to real observations from a bridge under load. Liu et al. [
40] presented a practical framework for bridge damage detection and analysis by using three techniques: TLS, microwave interferometry and permanent scatterer interferometry synthetic aperture radar. TLS was applied to obtain the 3D deformation map to find potential damage areas of bridges.
In some cases, the photogrammetric technique is also used for bridge monitoring, mainly in the form of unmanned aerial vehicles and terrestrial close-range photogrammetry. Pan et al. [
41] attempted to bridge the gap between the photogrammetry and remote sensing and applications from bridge engineering. An automatic framework for reconstructing structural surface models of heritage bridges was developed using photogrammetry and point cloud processing. Abolhasannejad et al. [
42] presented a combination of an image motion correction algorithm and a 2D-image-based deformation measurement technique to address the issue of camera motion during image data acquisition for bridge deformation measurement. Chen et al. [
43] proposed a process using an imagery-based point cloud. A bridge inspection procedure was introduced, including data acquisition, 3D reconstruction, data quality evaluation and subsequent damage detection. Perez-Gracia et al. [
44] presented research on a medieval bridge located in Fillaboa (northern Spain). The drawings of the bridge were produced with the use of close-range photogrammetry.
This paper examines the use of TLS and photogrammetric techniques on a historic cast-iron bridge. This bridge structure is quite complex and difficult to measure using traditional methods. Measurement capabilities of TLS and photogrammetric techniques were examined, including the benefits of inventory and control work. The obtained TLS and photogrammetry results are compared with data obtained from traditional surveys (treated as reference data) using a measuring tape, rangefinder and total station. The study mainly addresses to the point-wise aspect (determining the lengths and distances of the bridge elements). The area-based aspect is also partly taken into account, especially for data conversion to the AutoCAD environment. The main principles of operation of TLS and photogrammetric techniques are presented. Laboratory tests of TLS accuracy were also carried out. It was established that one of the most crucial determinants influencing the accuracy of the survey is the distance of the instruments (digital camera or/and TLS) from the measured structure as well as the nature of the structure (its complexity). The presented method in the laboratory conditions also enables the higher accuracy of the measurements. To date, close-range photogrammetry was usually used. In the present case, the maximum distance between the instrumentation and the examined structure (ca. 40 m) is greater than the distances generally considered in close-range photogrammetric acquisitions. In summary, this article presents a case study of noncontact measurement techniques applied to a comparatively small bridge; however, this structure is impressive from a structural, architectural and historical point of view. The obtained results confirm that both applied methods are useful for inventory and control works on complex structures. The methods used enable the collection of information about the actual dimensions of the bridge structure with sufficient accuracy.
2. Bridge Description
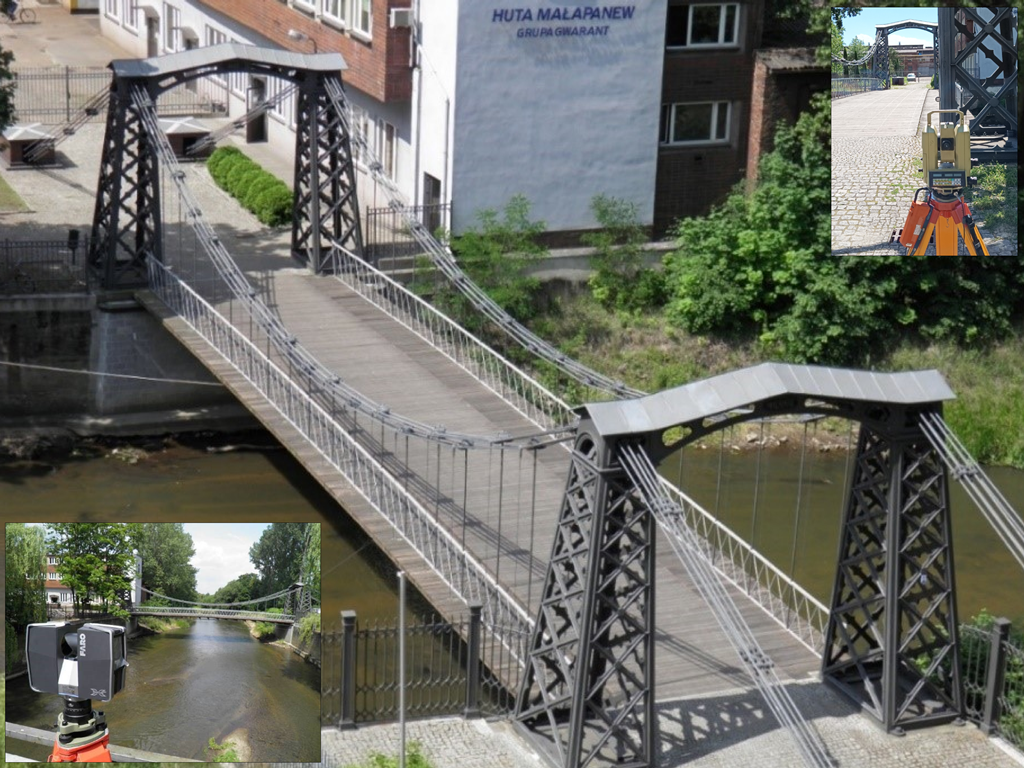
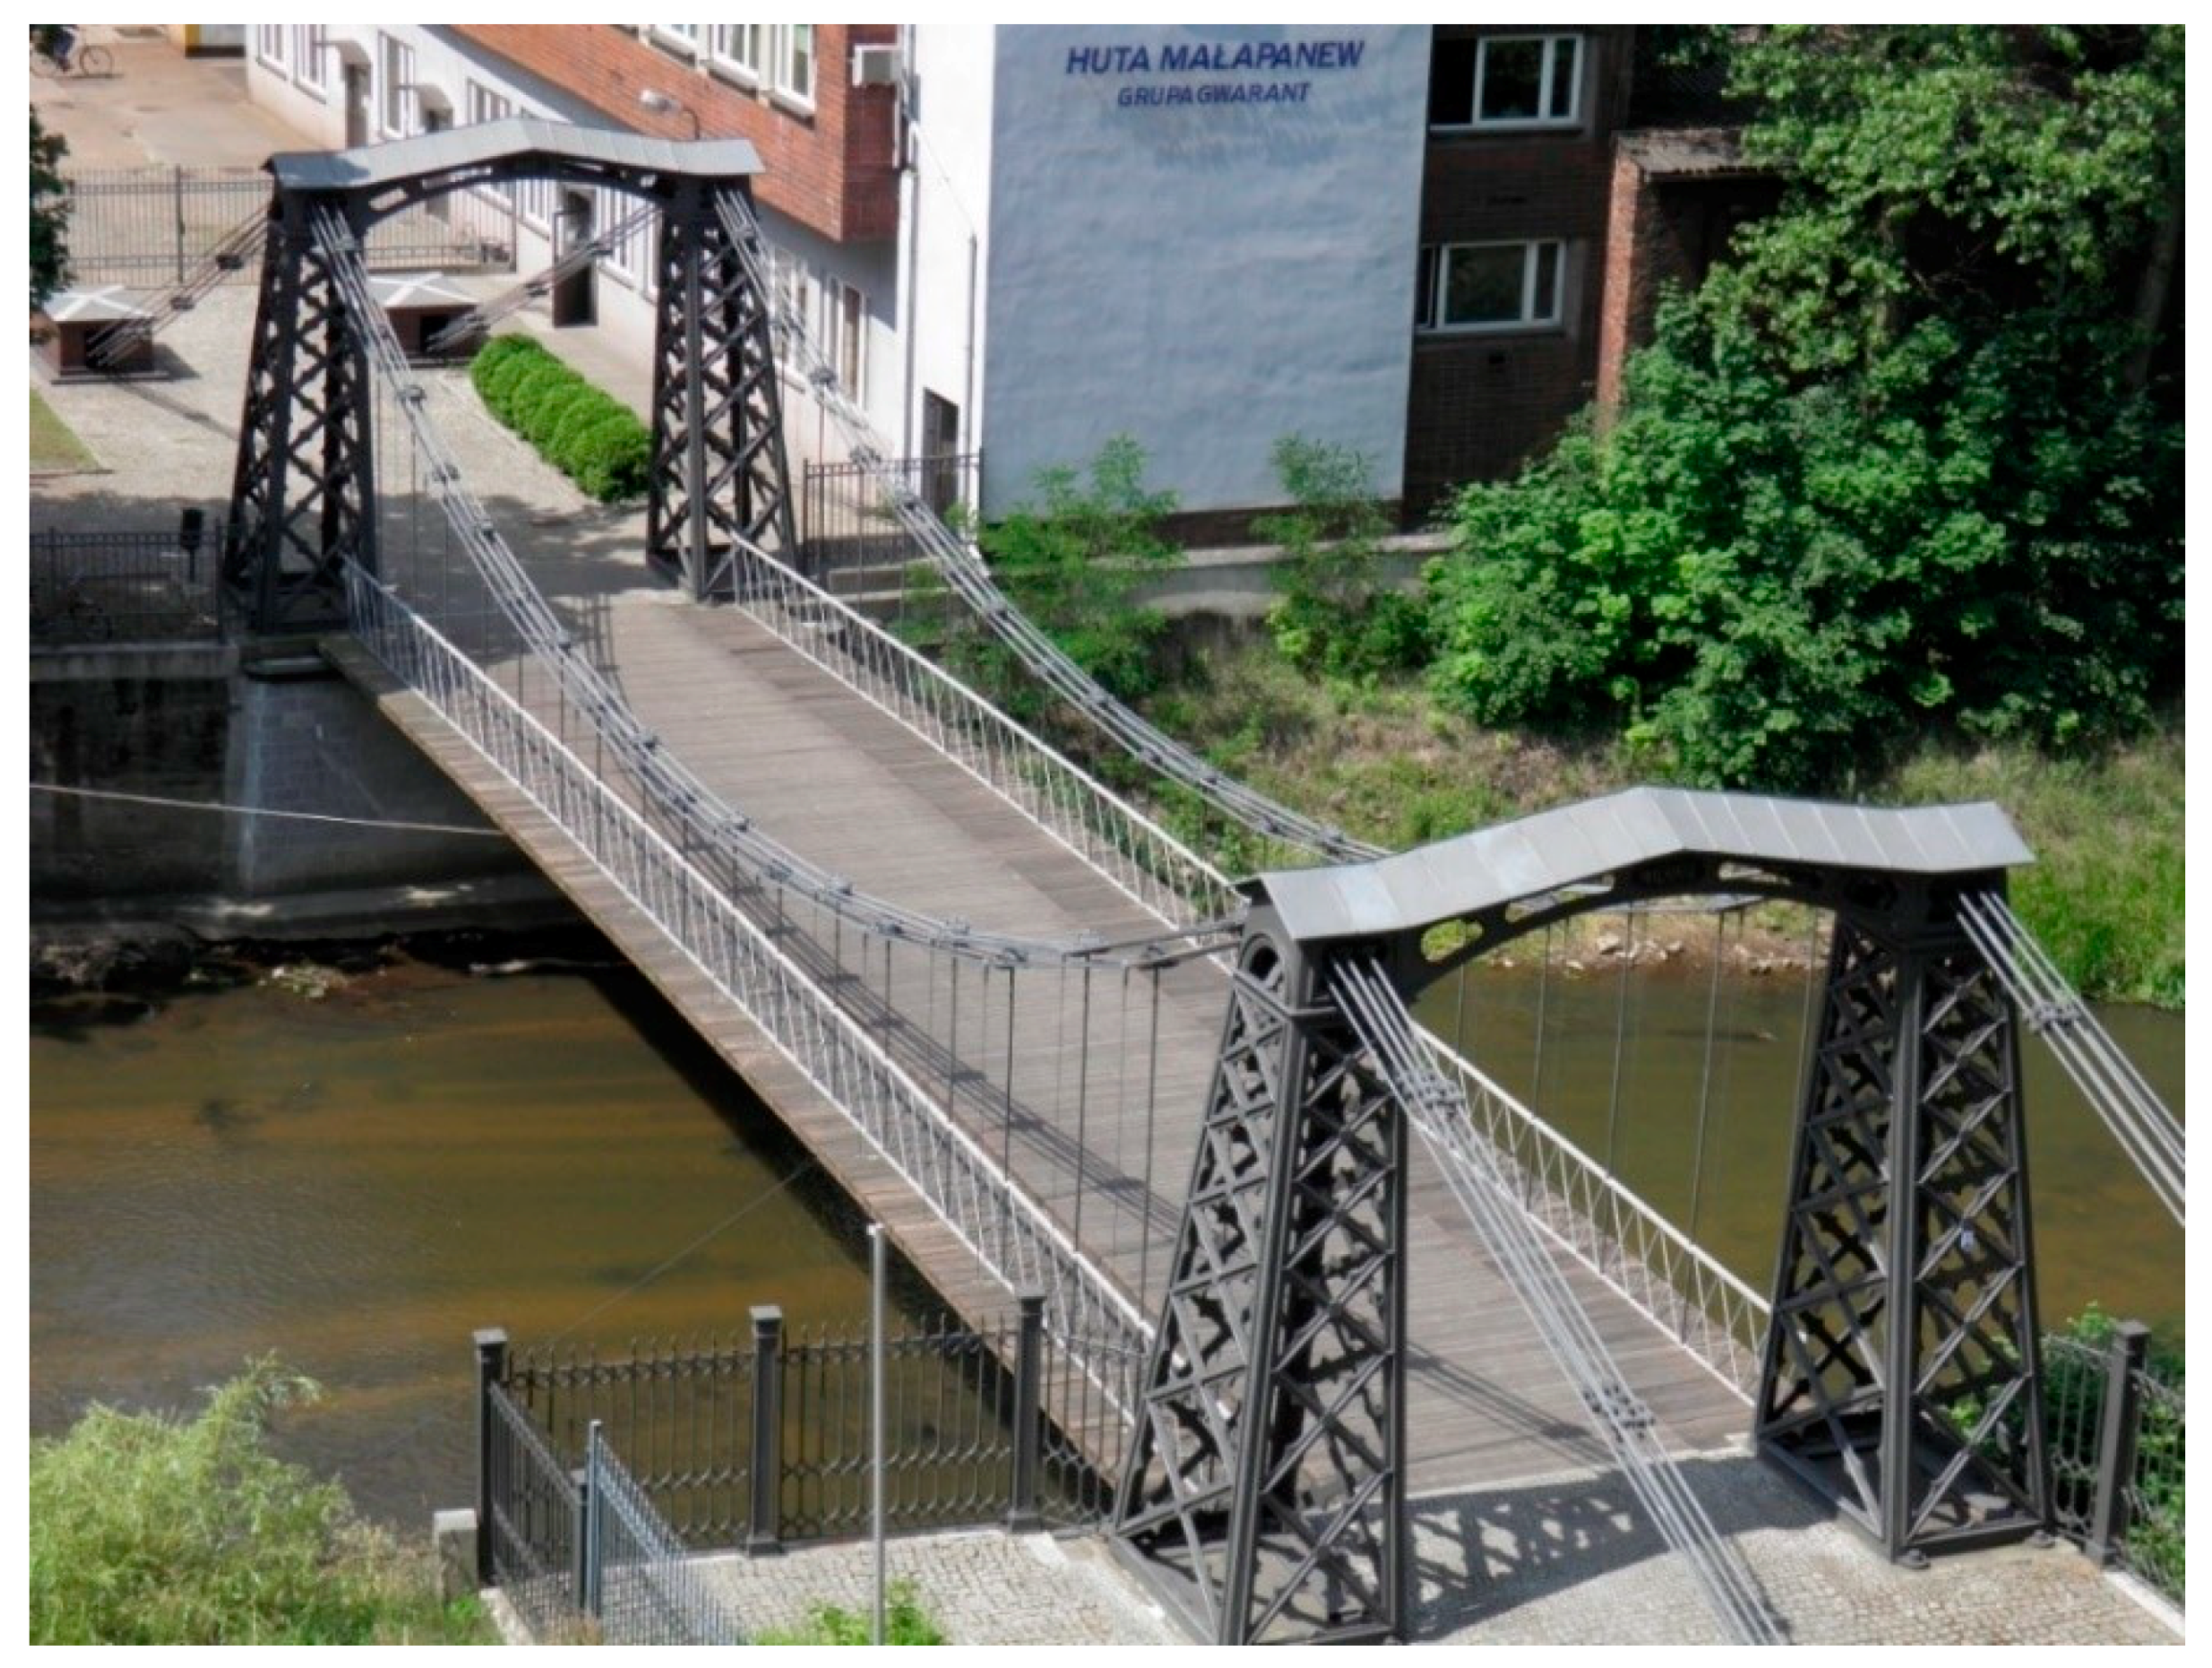
The examined structure is the historical bridge in Ozimek, Southern Poland (
Figure 1). This bridge is the oldest surviving suspension bridge with a chain structure suspended on openwork iron pylons. It was made in 1825–1827 at the Malapane iron mill in Ozimek. The main constructor of the bridge was Karl Schottelius. It should be added that an older (still existing) cast-iron suspension bridge was constructed in 1819–1826 in Wales (crossing the Menai Strait), but it has stone pylons. It was one of the first bridges in the world to use this technique, bearing testimony to the history of industrial culture and technological thought of the early 19th century. Commissioned in 1827, the bridge survived in an unchanged form, performing the function of a road bridge right up until the 1970s, when it was converted into a pedestrian bridge. The monumental, cast-iron pylons positioned on both sides of the river which support the suspended chains are a distinctive and unique feature of the load-carrying structure of the bridge in Ozimek. Each pylon takes the form of a truncated, slender pyramid made out of four openwork panels joined together using screws.
The tested historical bridge has the following parameters: a span of 27.7 m, an axial distance between cast-iron pylons of 31.5 m, and a bridge deck width of 6.6 m. The entire length of the bridge is 77 m (including the underground chain anchors). Fifty-seven tons of cast iron and 14 tons of wrought iron were used for its construction. The bridge load-carrying capacity was estimated at 3 tons, but, in reality, it carried much higher loads (15 tons).
A total restoration of the bridge was conducted in 2009–2010. All elements of the old bridge were dismantled and thoroughly repaired and subsequently reassembled into the completed bridge. All construction and conservation works were carried out under the supervision of a provincial conservator. This bridge was reinforced using steel cables, taking into account calculation analysis. During the world Footbridge Award 2014 competition, the presented bridge was deemed the best-renovated structure [
45]. In March 2017, the bridge was entered onto the list of historical monuments in Poland.
The studied bridge is distinguished not only by its technical value (it has survived until now), but also by cultural and historical aspects. For these reasons, it is advisable to apply modern measurement technologies to determine not only essential constructional elements, but also esthetic and architectural features.
3. Methodology of Inventory and Control Works
3.1. General Notes
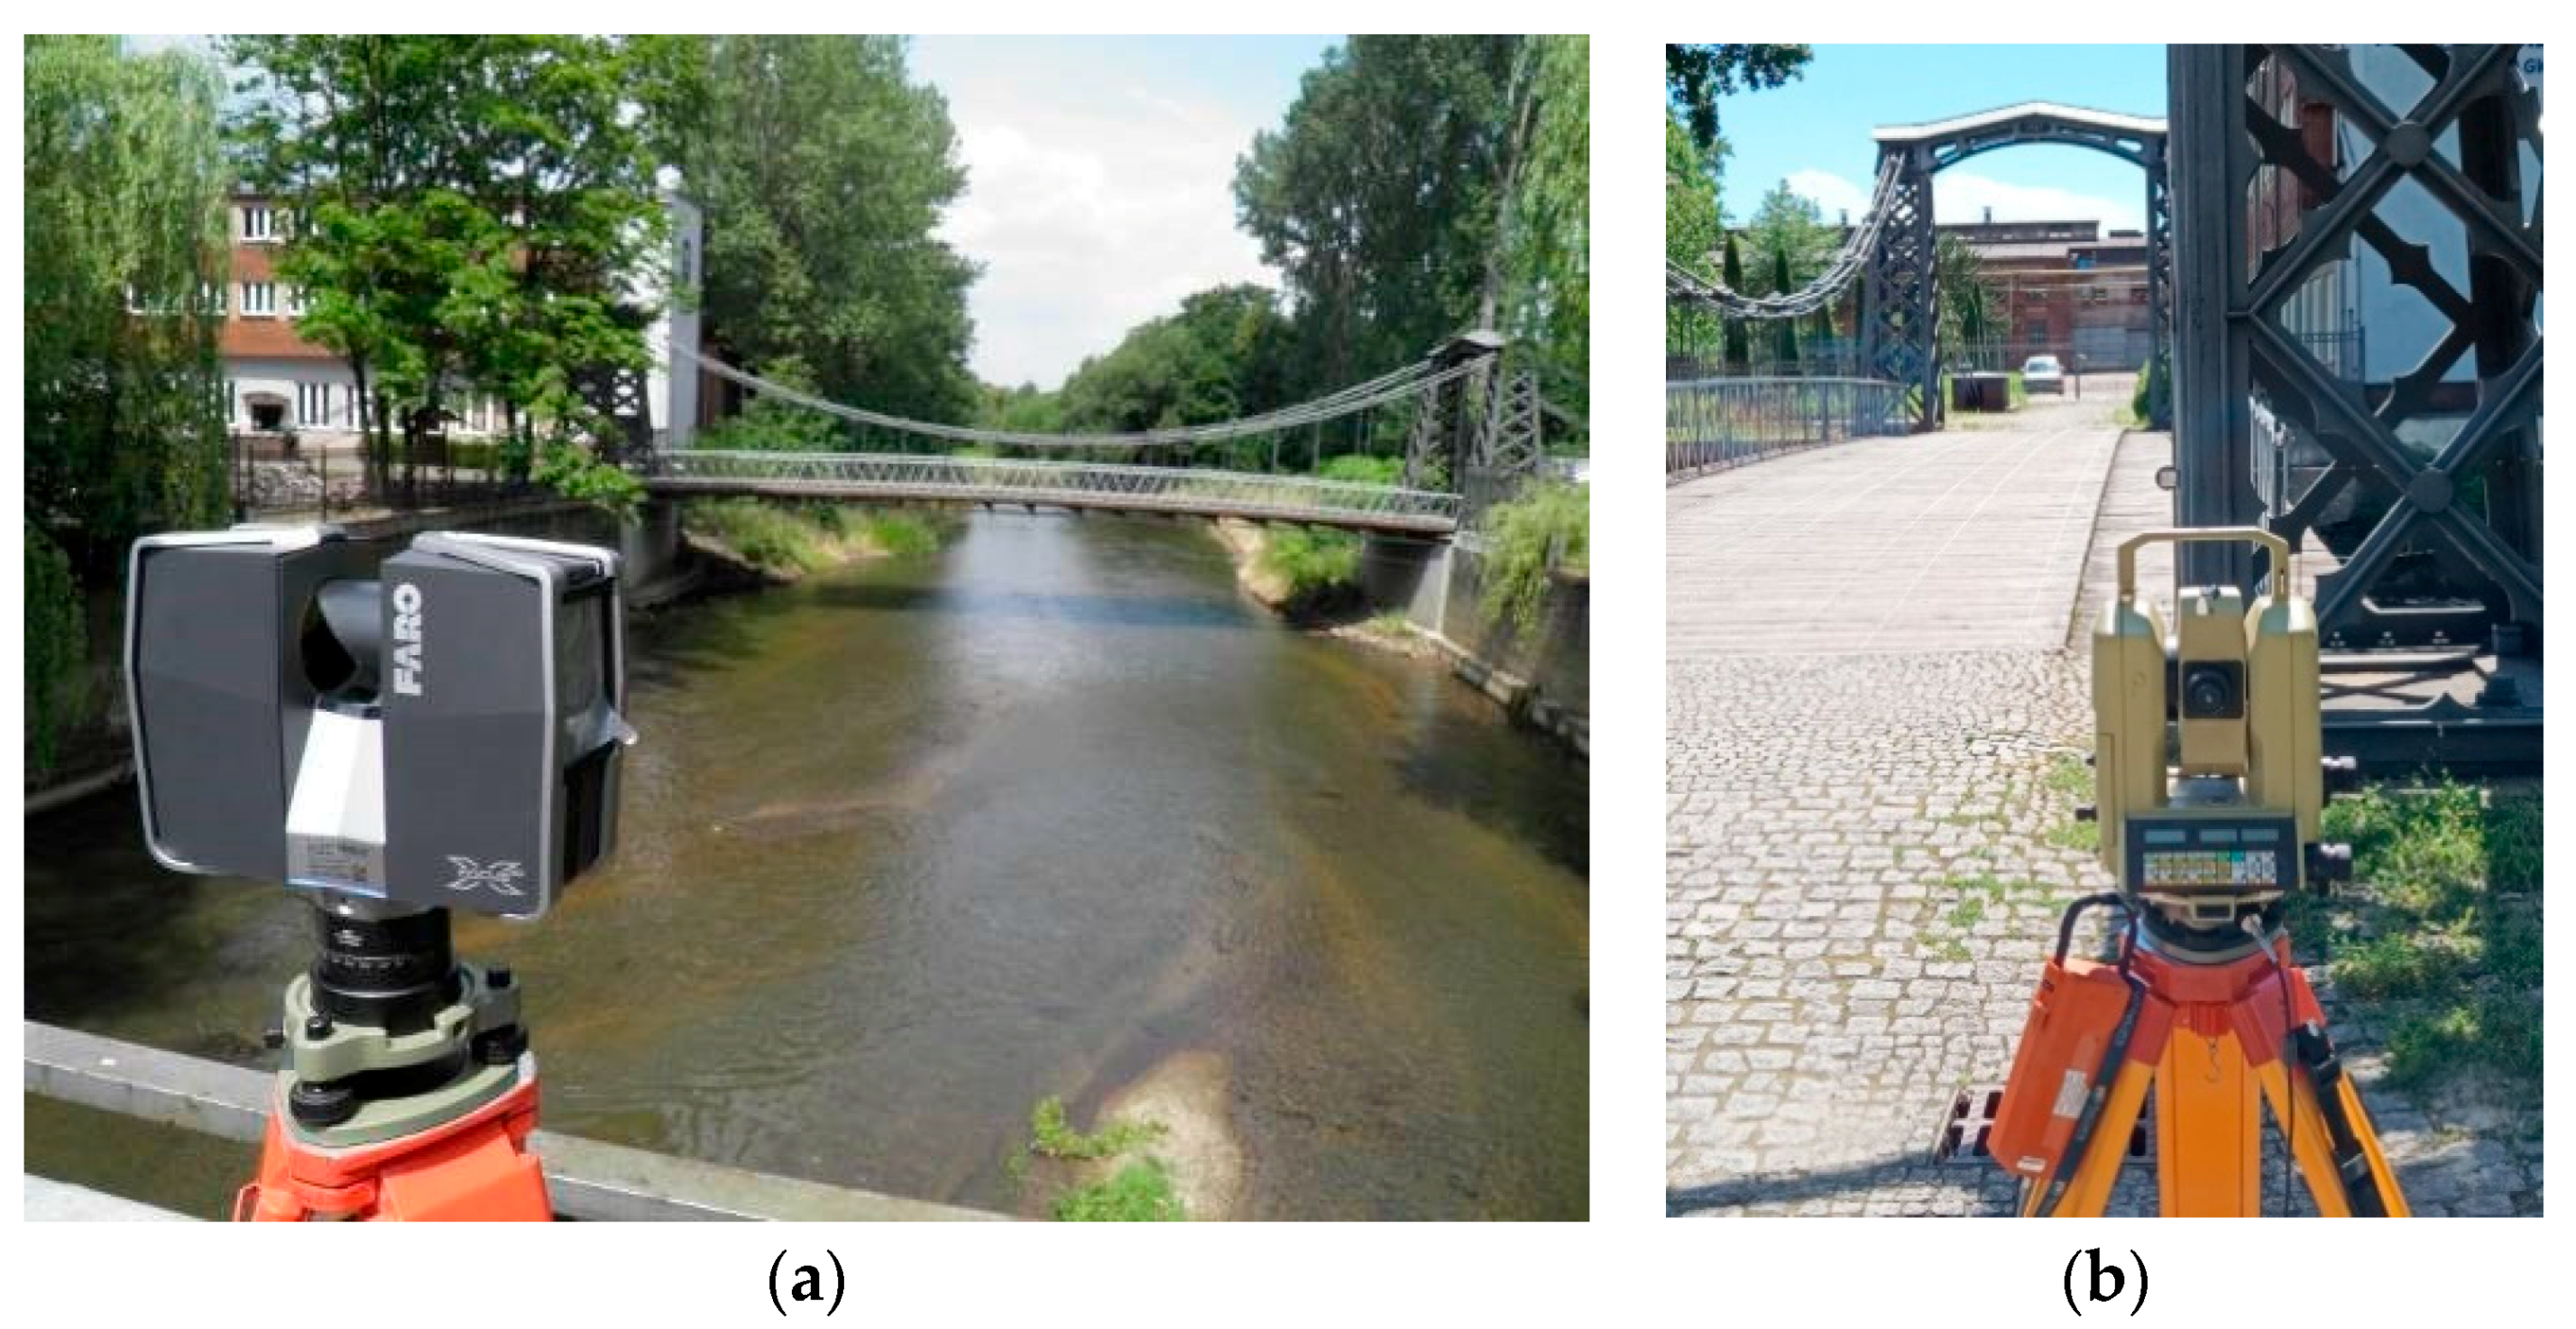
Modern measurement techniques—for example TLS and photogrammetric—allow to obtain such a dense point cloud that the surface can be considered quasi-continuously. The most critical determinants in the choice of measuring method are the geometry and complexity of the examined structure. Taking into account that the monitored bridge is a linear transport object with a total length of 77 m, the bridge length may affect the obtained measuring results. The bridge length is crucial for measurement accuracy because the exact determination of the location of points falls with a rise in survey distance. This aspect should be taken into consideration during testing preparation. It should also be added that in TLS measurements, the point cloud density decreases with distance, but the software interpolates the characteristic surfaces and estimates the distances based on the parameters of these surfaces. In the case of photograms, the accuracy of measurements is improved by the use of auxiliary lines or curves representing characteristic elements. This examination was carried out after a restoration of the bridge in 2010. Because the bridge is intended only for pedestrians (no possibility to conduct testing under heavy vehicles), multipoint survey technologies (i.e., TLS, photogrammetric techniques and traditional survey methods) were applied as inventory and control tools. The maximum distance between the instruments used (laser scanner and digital camera) and the examined bridge was ca. 40 m (
Figure 2). Usually, other researchers use close-range photogrammetry with shorter measurement distances. The data obtained were compared with the results of traditional surveys and the project. Four persons using a measuring tape, rangefinder and total station with the measurement shields placed on magnets (
Figure 2) conducted traditional measurements, and these were treated as the reference results. A Leica TC2002 total station was used for tachymetry measurements and to check the distance of the selected bridge points using TLS and photogrammetric techniques. The total station used is theoretically accurate to 1 mm and for measuring directions of 0.15 mgon (0.5″). Taking into account practical experiences [
3], the received accuracy is commonly significantly smaller: i.e., 1–5 mm for distance measuring and 0.9–3 mgon (3–10″) for direction measuring. However, in the analyzed example, the length of sight did not exceed 30 m. Thus, the measurement accuracy using the tachymetry method was up to 1 mm.
Accuracy of point-wise measurements (e.g., using total station) is limited by instrumental accuracy, and multiple repetitions of measurements allow only a limited increase in final accuracy, according to Equation (1):
where
is the standard error of the mean,
is the average value of the observation,
n is the number of measurements,
m is the single observation error, and
v is the apparent error.
Clearly visible and characteristic bridge elements (e.g., spacing of pylons, length of hangers, bridgehead height, distance between pylons in the portals) were chosen as measurement and control points which can also be measured using traditional methods. Such an approach allows minimization of the preliminary works on the bridge. Verifications in the vertical direction of chosen points and elements on the bridge were performed using the spirit-levelling method elaborated by Anigacz et al. [
6].
The authors tried to minimize the impact of external environmental conditions on the accuracy of measurements by making them in the most favorable weather conditions. According to the TLS manufacturer recommendations, the temperature should be in the range of 5 °C–40 °C, humidity up to 90%, without rain and fog. Therefore, the tests were conducted at a temperature of 23 °C, 70% humidity and partial cloudiness.
3.2. TLS Method
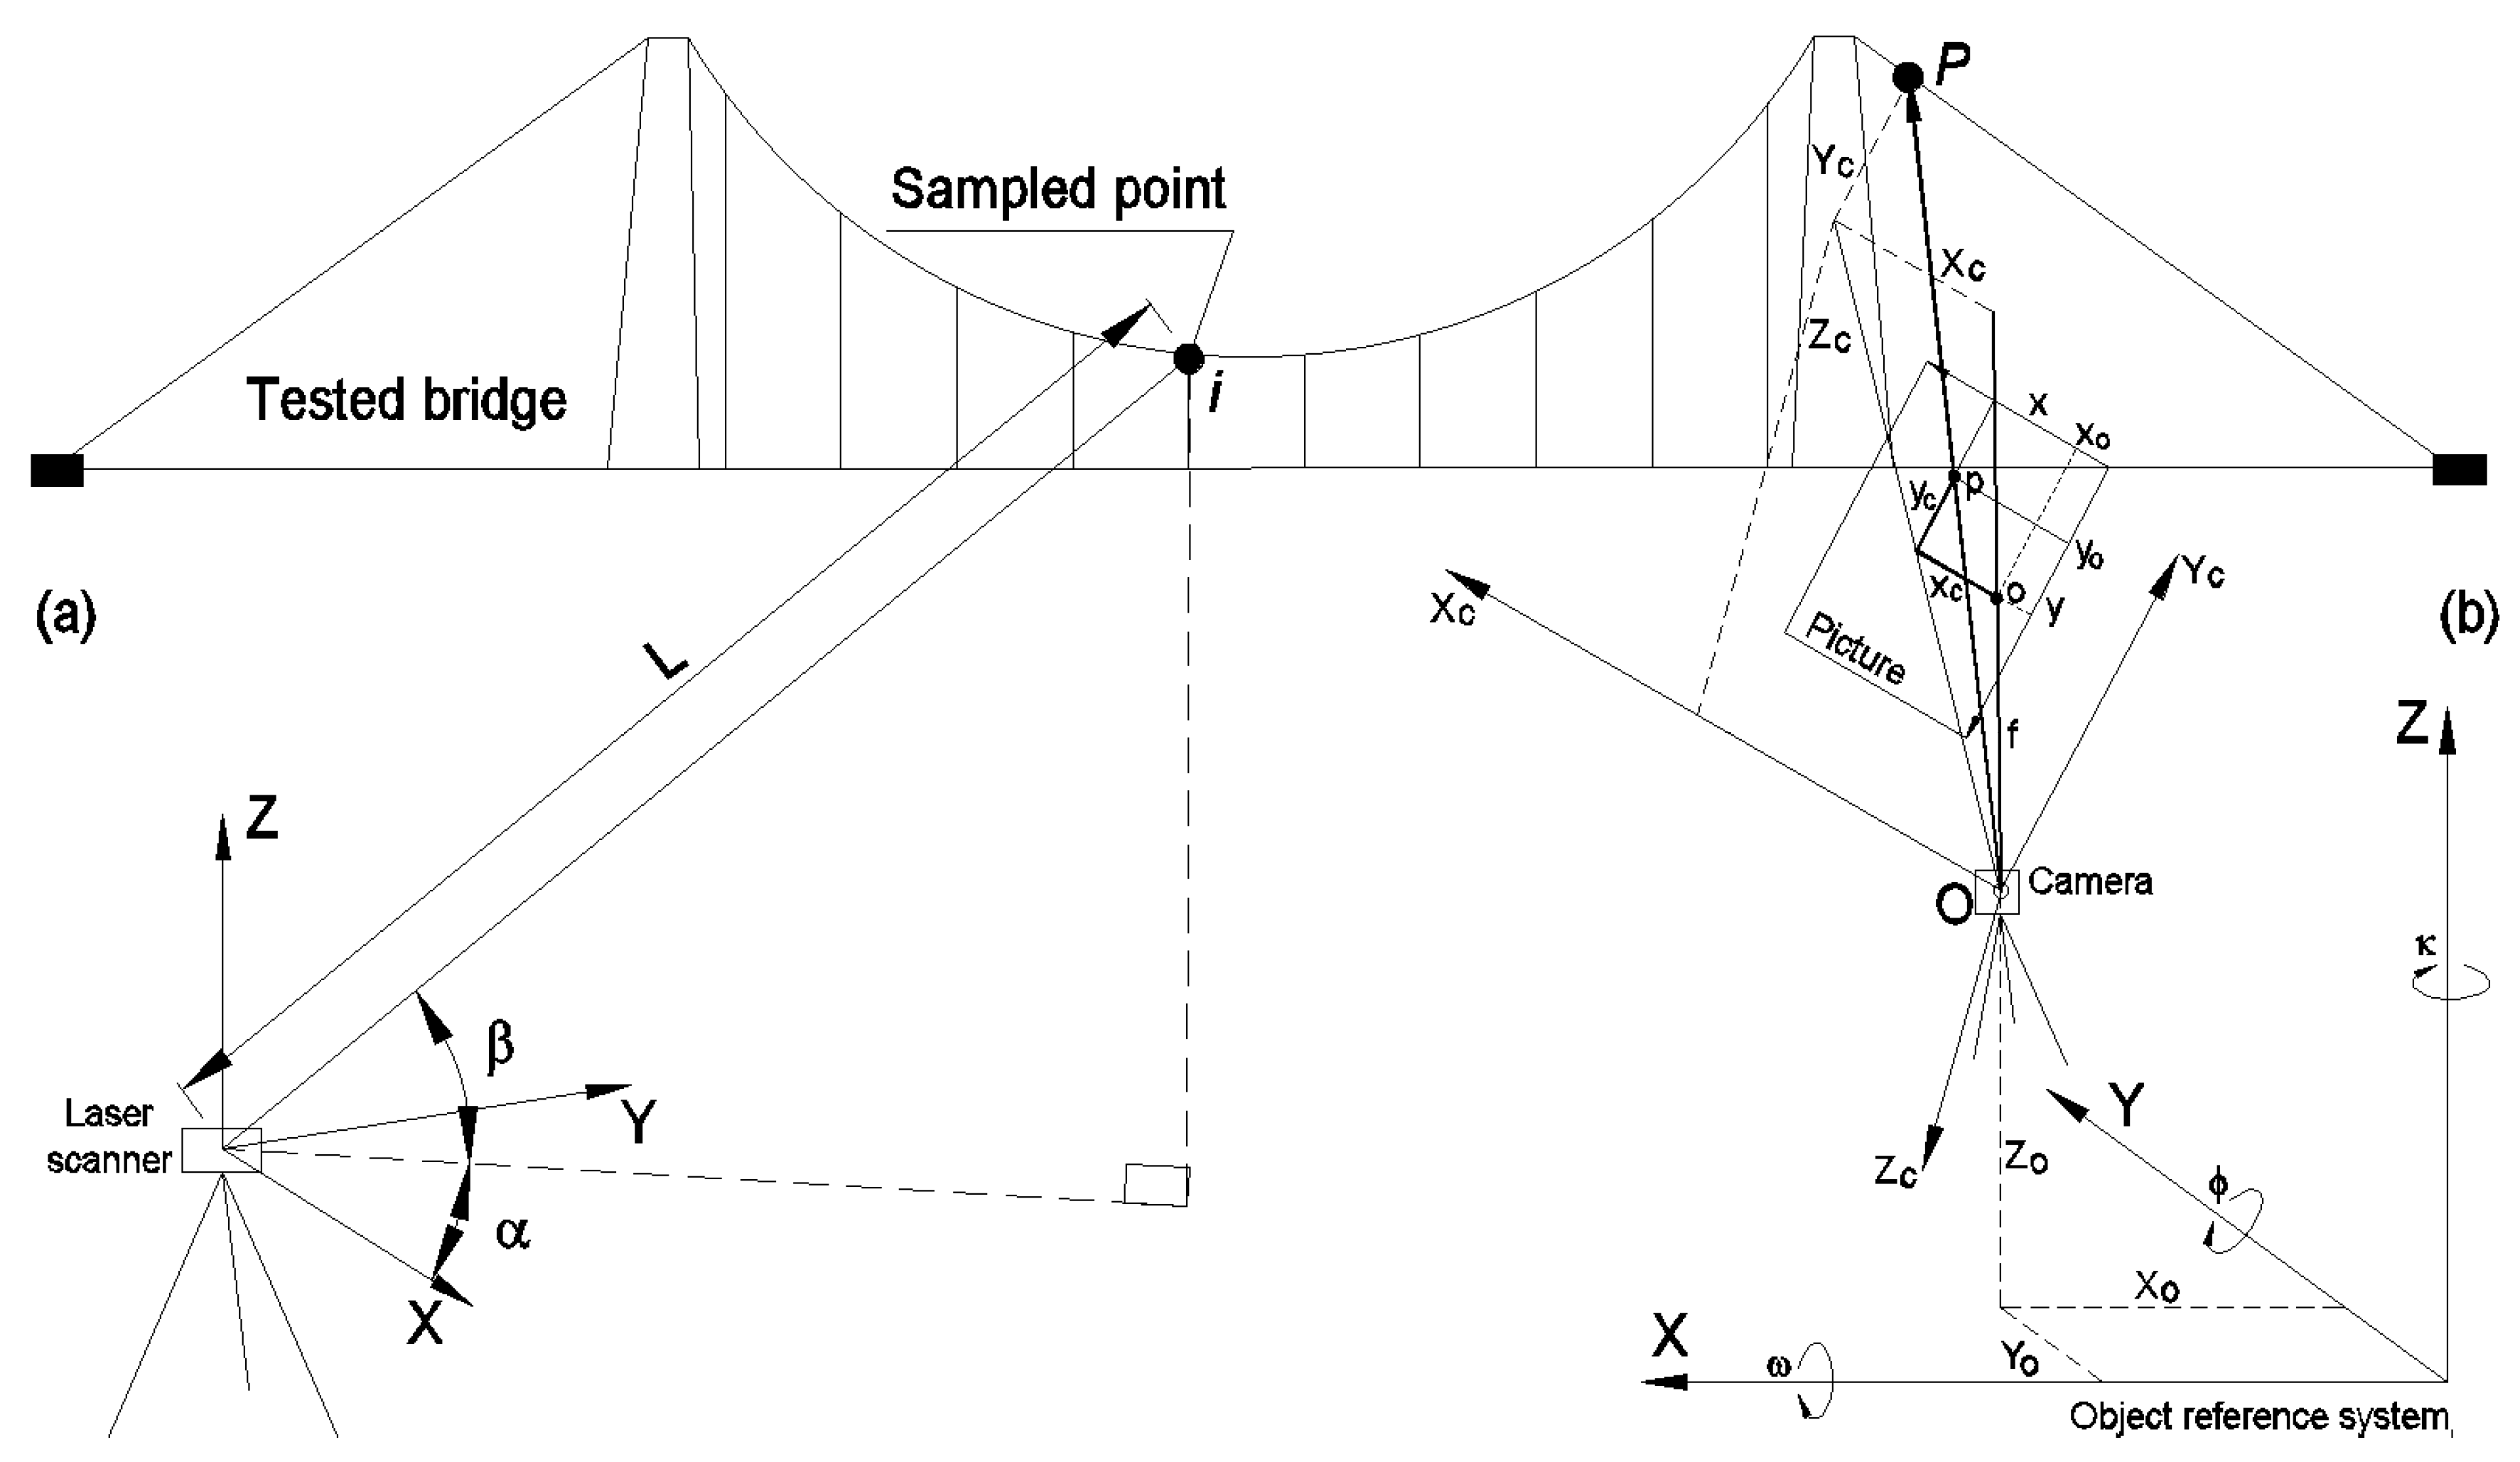
The TLS method constitutes a quite new survey technique which enables attainment of a quasi-continuous and three-dimensional presentation of the region of the tested construction observed in the central view. These results in obtaining spatial point clouds of the external region of the object viewed from the scan position.
As mentioned before, the accuracy of the obtained results depends essentially on the distance from the laser scanner to the observed bridge. A scanner emits a laser beam that returns to the scanner after reflection from the tested object. The distance is calculated based on the phase difference of the reflected and the emitted beams. It is possible to rotate the scanner 360 degrees in the horizontal direction. The laser scanner creates scanned points through a series of measurements with uniform angular increments in both vertical and horizontal planes. This is monitored by rotating and nodding mirrors and rotating head mechanisms. Therefore, spherical coordinates with a distance measurement (
L), vertical angle (
β) and horizontal angle (
α) determine each sampled point (
Figure 3).
If the distance (
L) between the laser scanner and a tested point (
i) is known, vertical angle (
α) and horizontal angle (
β), the coordinates of a point in a 3D coordinate system in real time, can be calculated using Equation (2):
where
is the measured distance (
Figure 3a).
In the case of TLS, the accuracy of determining the spatial coordinates of a single point depends mainly on the accuracy of the distance measurement, which in turn depends on the accuracy of the timing of the electronics integrated into the circuit (see Equation (3)). Obviously, in order to determine the three-dimensional position of a given point, it is also necessary to know the angular orientation (Equation (2) and
Figure 3a). Moreover, the measured distance accuracy is inversely proportional to the ratio of signal to noise, which depends on different factors: i.e., the power of the received signal, input bandwidth, background radiation and amplifier noise [
46]:
where
t is the time interval between the emission and the pulse and its reception of the backscattered portion, and
c is the velocity of light through the air (3 × 10
8 m/s).
Each scanned point is automatically transformed into a set of 3D Cartesian coordinates (
X,
Y,
Z) by laser scanner software, and the origin coordinate is situated at the scanner. The scanner also acquires intensity values, which is a measure of the electronic signal strength obtained by converting and amplifying backscattered optical power. Pfeifer et al. [
47] introduced the relationship between the received (
Prec.) and emitted power (
Pem.) as expressed in Equation (4):
in which
γ is the material reflectance,
L is the distance measurement and
ψatm. and
ψsys. are the atmospheric and system losses, respectively. The temporal variations of the pulse power are neglected in this equation. In addition, Equation (4) suggests that the intensity values highly depend on the material reflectance, the incidence angle and the distance measurement and can be expressed using Equation (5) [
48]:
where
f1,
f2 and
f3 are the functions of target reflectance (
γ), incidence angle (
θ) and distance (
L), respectively. Distance measurement errors of TLS are also influenced by target reflectance, incidence angle and distance and can be expressed by Equation (6):
where
ω1,
ω2 and
ω3 are the functions of target reflectance, incidence angle and distance, respectively.
The FARO Focus 130 3D scanner was applied for inventory and control measurements of the bridge. The maximum declared measurement range is 130 m with upright incidence to a 90% reflective surface. The scanning process was carried out in 13 various positions of the laser scanner (
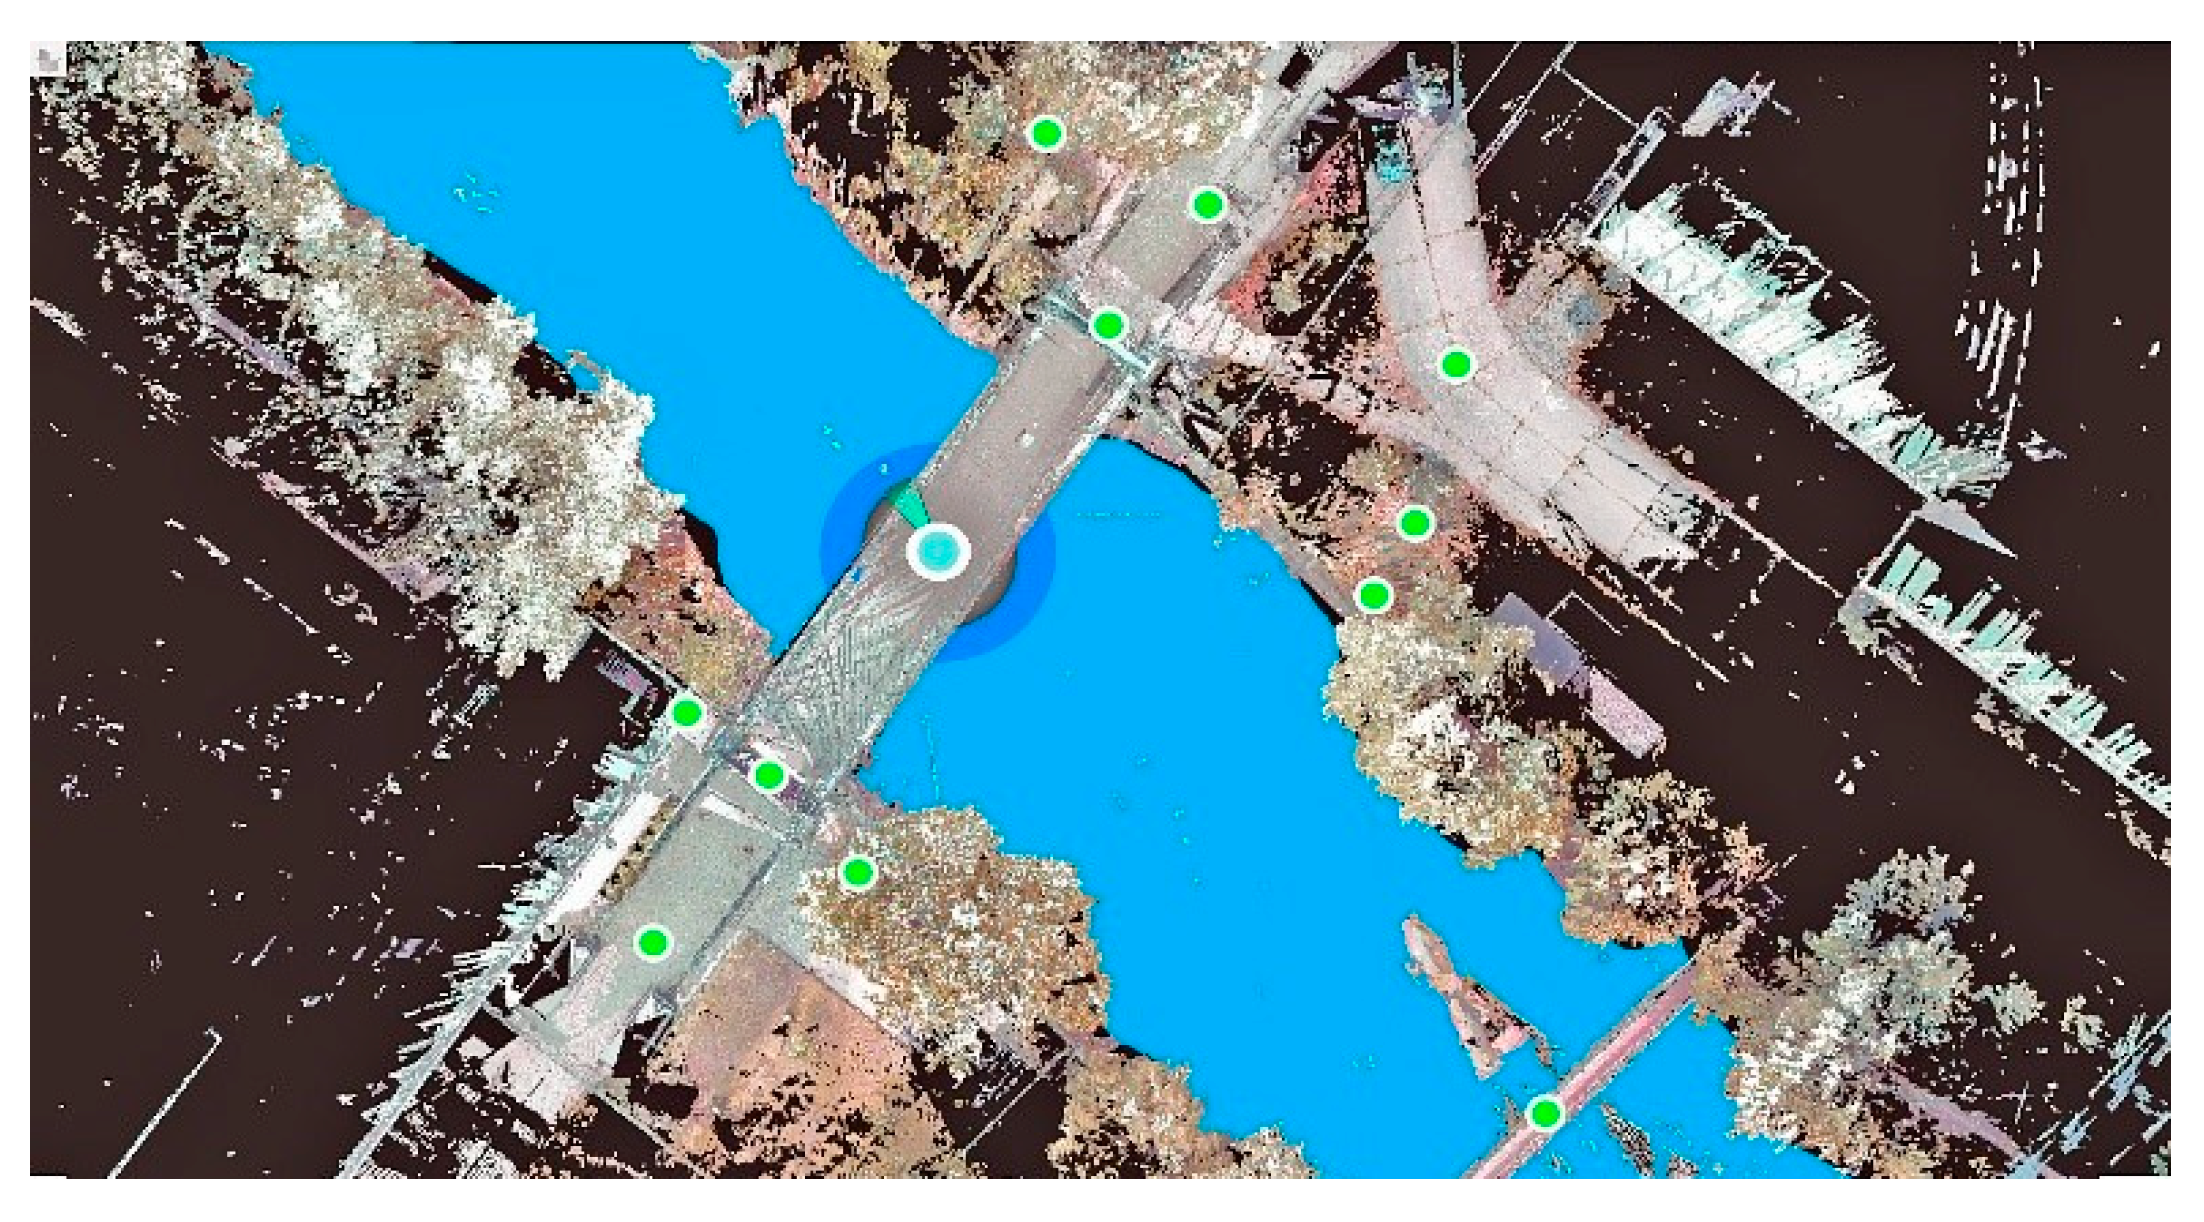
Figure 4). The measurement positions were selected such as to obtain a complete image of all bridge elements taking into account (i) the spatial nature of the bridge, (ii) the maximum distance between the scanner and the bridge (40 m) and (iii) the acquisition of most elements from a single position. The density of the recorded point cloud permitted sufficient identification of the main bridge elements as well as architectural details.
The applied scanner collects almost a million points per second and permits building clouds consisting of more than a billion points. The conventional unit of measurement of point cloud density is dpi (dots per inch). The manufacturer states that the accuracy of the distance measurement is ±2 mm, and the angular resolution is equal to 0.16 mrad. The laser wavelength is 1.5 μm, and the laser beam divergence is 0.19 mrad. From a practical point of view, usually, the elements and points of the observed object are located at various distance ranges from the laser scanner; therefore, it is better to apply angular resolution instead of dpi (because it can be variable depending on the change in distance).
Trimble RealWorks 10.2 [
49] software was applied to analyze obtained data and for postprocessing of the point cloud. The program is a comprehensive tool which efficiently records, analyses, designs and generates data using results obtained from practically any origin. The program also permits auto-interpolation of the indicator center of the characteristic bridge elements (in the same way as for measurement spheres).
Generally, measurement targets and white reference spheres can also be used, if the bridge elements are not satisfactory and well visible (but not in this case). Information received from such a laser scanner is saved in a “.fls” format. It is then converted to a “.rcs” format using the ReCap Pro program [
50]. It is also important to consider that a file with a “.rcs” extension is compatible with any Autodesk environment. The ensuing scans are adapted to specific points on the bridge in such a way that the subsequent scanning sessions are compatible with each other. Such an approach allows a significant decrease in working time on the bridge (or other structures).
For higher accuracy, it is necessary to use a higher class of instrumentation. An alternative to obtaining higher accuracy is the use of reference objects such as measuring spheres. Point clouds representing their external surfaces allow interpolative determination of sphere centers—in practice, with at least one order accuracy higher than instrumental accuracy.
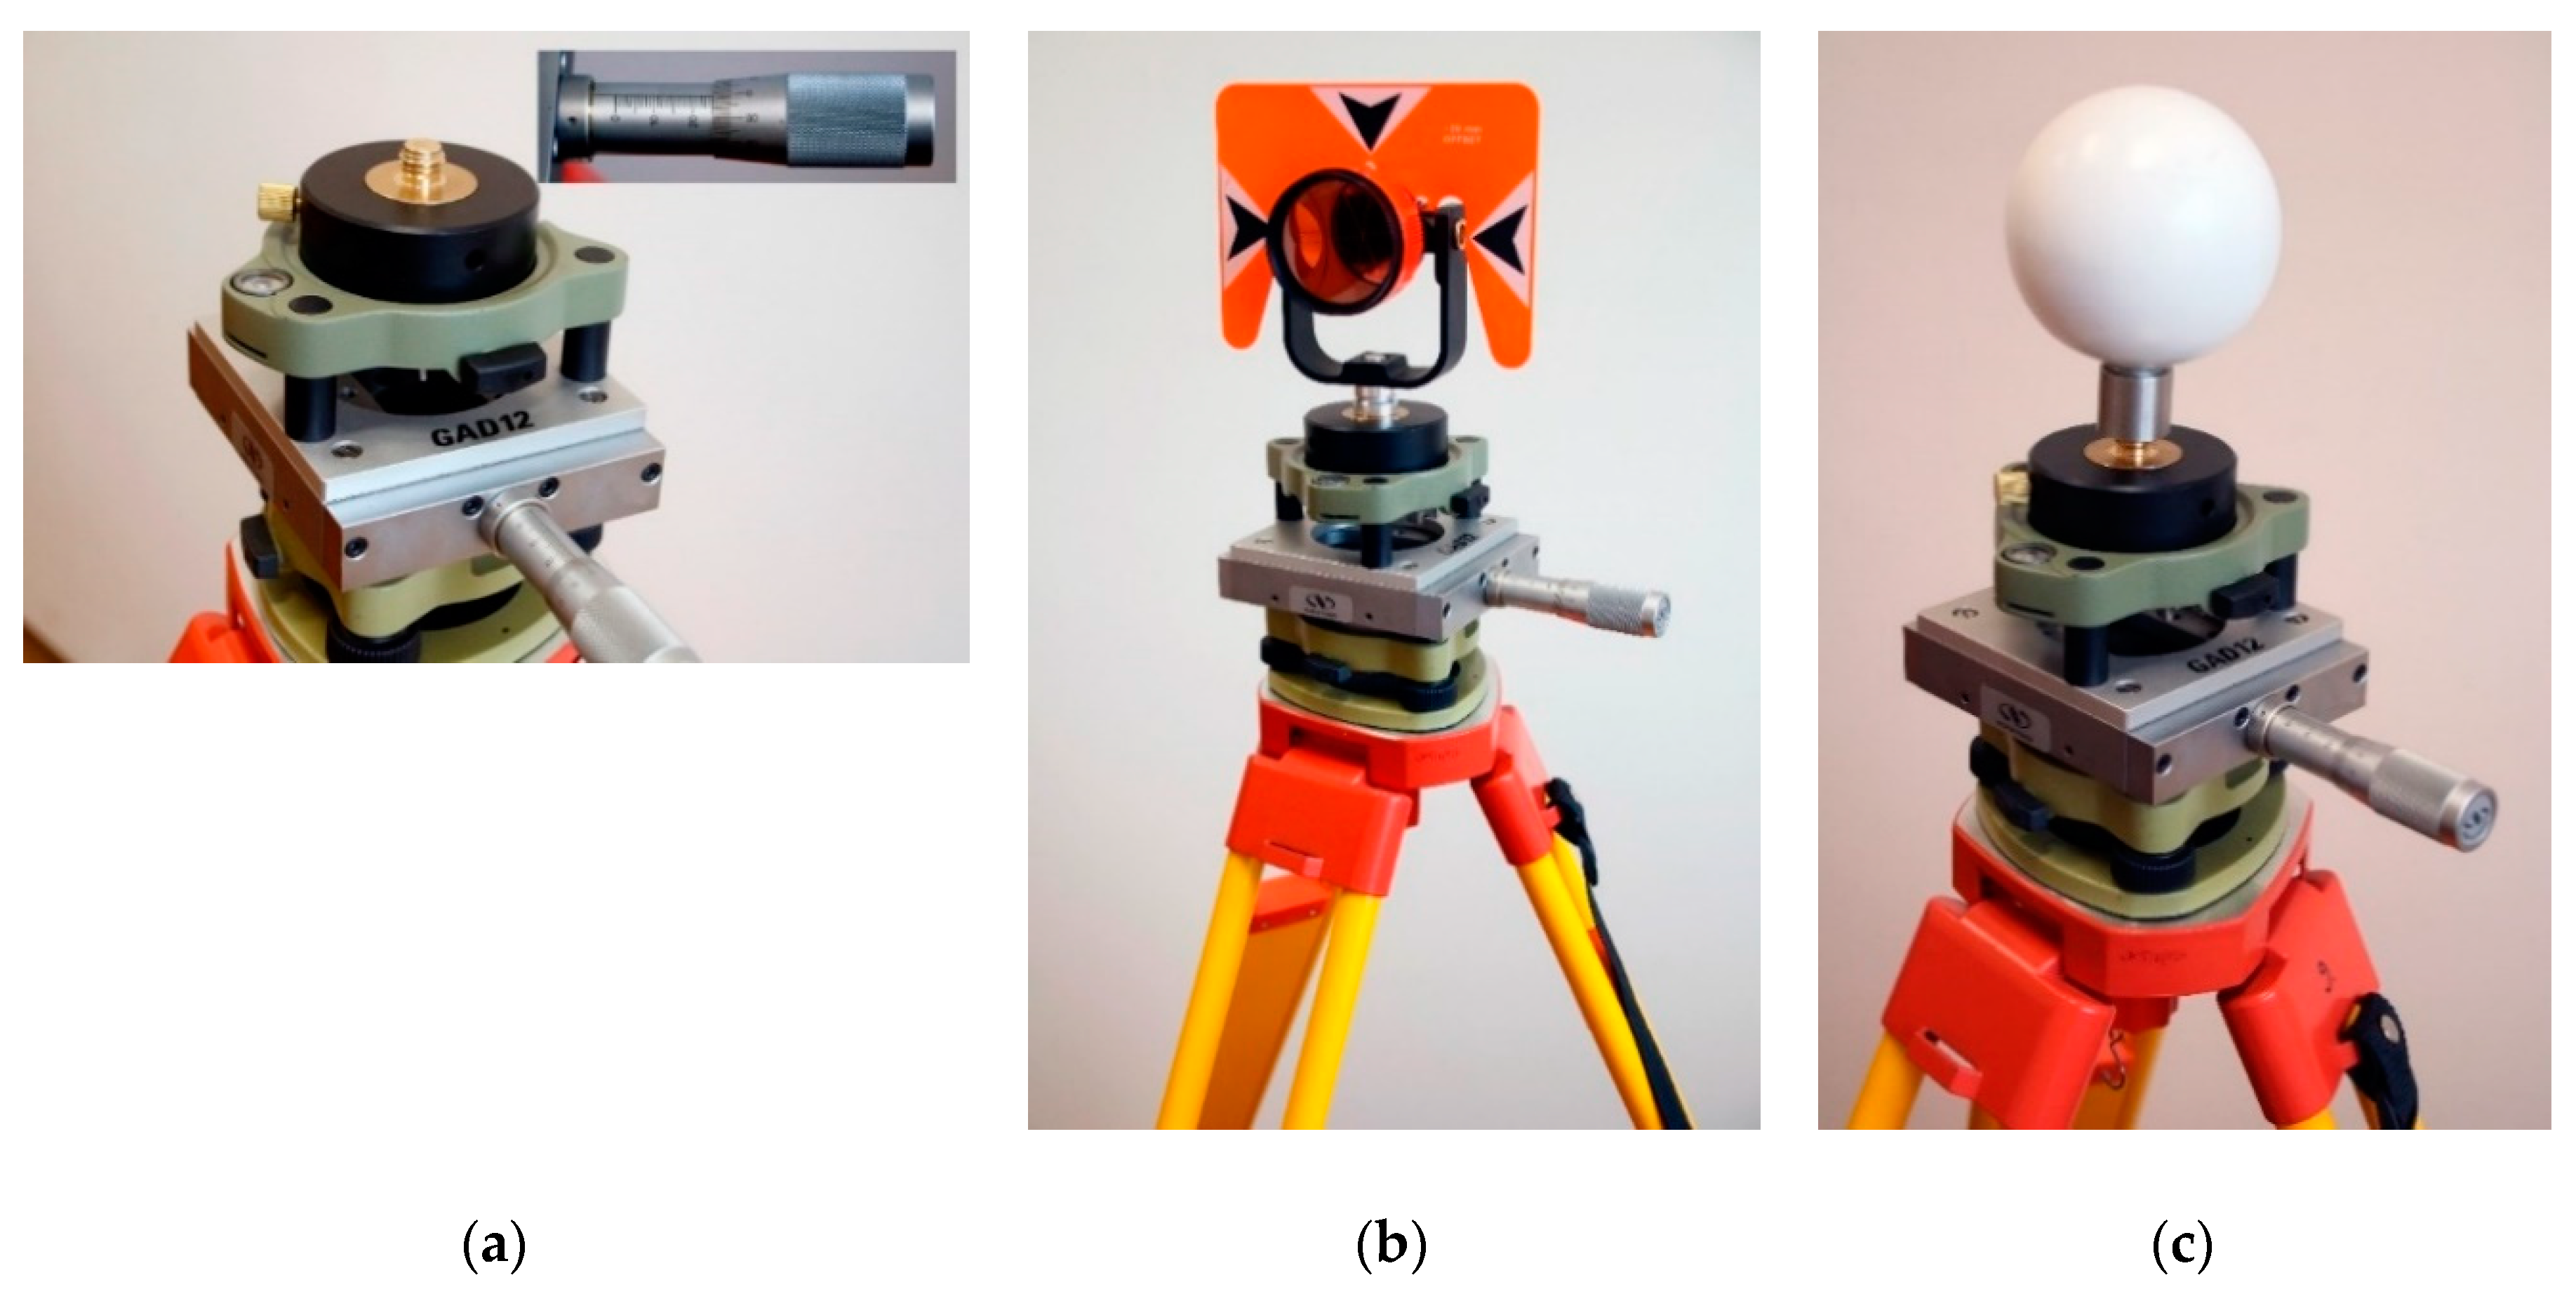
In order to confirm the accuracy of the TLS technique, laboratory tests to determine the accuracy of measuring the translation of reference objects–, i.e., the prism and the measuring sphere—were carried out. The aim of the experiment was laboratory confirmation and assessment of improving the accuracy of translation measurement using the measurement sphere relative to a single measurement per prism (
Figure 5b,c). As a reference measurement, a translation of reference objects was carried out on the GAD12 precision translation stage, ensuring a measurement accuracy of at least 0.01 mm (
Figure 5). The prism applied to the first series of measurements allowed us to assess the instrumental accuracy of the Leica TC2002 total station used. The differences recorded, when compared with the precision translation stage when measured from a distance of 3–30 m, did not exceed 1 mm according to the manufacturer’s statement. An analogous measurement in the laboratory conditions for the used sphere with a diameter of 100 mm made with the FARO Focus 130 3D scanner revealed differences of 0.05–0.07 mm in the whole distance range. In this case, the compared value was the interpolated center of the point cloud describing the surface of the sphere. It should be underlined that in the real bridge measurements, there may be unfavorable environmental conditions (wind, rain, high or low temperature, vibrations) that affect the accuracy of the measurements. Therefore, in order to obtain greater accuracy, the indirect methods using the measuring sphere system (
Figure 5) can be used.
3.3. Photogrammetric Technique
Digital mono-photogrammetric was the second measuring technique used. The position of the camera reference system (
Xc,
Yc,
Zc) relative to the clockwise geocentric or local reference system of the object (
X,
Y,
Z) when photographing the object is determined by the coordinates of the origin of the system O—
Figure 3 (center of camera views
X0,
Y0,
Z0)—and system rotation angles (
ω,
ϕ,
κ– determining the position of the camera’s optical axis relative to the axis of the object reference system). These parameters are called “the parameters for the external orientation of the photo”. Determining the location of a photo in three-dimensional space at the time of shooting is called “external orientation”. Euler’s rotation angles
ω,
ϕ,
κ are determined in such a way that by rotating the object reference system (
X,
Y,
Z) successively around the
X,
Y and
Z axes, the axes of this system become parallel to the camera system axis (
Xc,
Yc,
Zc) (see
Figure 3). Thus, the transformation of
X,
Y,
Z coordinates into
Xc,
Yc,
Zc coordinates in the camera reference system can be written as:
where
R is the rotation matrix.
During shooting, each point of the object
P is moved according to the principle of the central projection (along the radius
PO) on the image plane
p (
Figure 3). As a result, the terrain coordinates of the
P point in the camera system (
Xc,
Yc,
Zc) are converted to the image coordinates (
xc,
yc) of the
p point in the same system according to the following equations of the central projection (specified in the camera system):
where
s is the dimension of square photosensitive silicon elements, each of which registers and then enables reading of an electrical signal proportional to the amount of light falling on it. These elements make up a rectangular matrix—the CCD (charge coupled device) raster.
A Canon 750D digital camera with a fixed-focus lens of 85 mm was applied to obtain the photograms. The preliminary analysis of fixed-focus lengths has shown that it is optimal for the detailed perception of bridge details. The camera was placed on a GigaPano turntable in order to allow automatic execution of the image sequences. To verify the assumed technique of photogrammetric measurements and its accuracy, a laboratory test was conducted [
3]. Thirteen panoramic photograms of the historical bridge were taken. To be able to directly compare the obtained results, the photograms were taken from the same places as in the TLS survey (
Figure 4).
The size of the spherical deviations of the applied apparatus was estimated in the lab based on a test using graph paper with a dimension of 420 × 297 mm. The maximum distortion was 3 pixels, which means that the percentage deformation is (2 × 3)/6000 = 0.001, i.e., 0.1%. The registered deformation of the camera lens system used allows for computerized adjustment with an accuracy of one pixel. Only the central part of the frame (2000/1333 pixels), constituting 1/9 of the entire surface of the frame, was used for the measurement. This was due to the use of stitching covering 1/3 of the frame. For the 2000/1333 pixel frame field used, the distortion did not exceed 1 pixel, which is within the interpretational error limit. Therefore, because of the expected measurement accuracy and the inability to register deformations in the central part with an accuracy below 1 pixel, it was justified to abandon the calibration procedure. Details of laboratory testing are presented in [
3].
A Kolor AutoPano Giga 4.0 program was applied to process photograms. Additionally, a Photoshop CC computer program was implemented to calibrate the formed photograms by rescaling in order to define the “size” of a single pixel using the known reference distance on the photogram. This program allows a linear rescaling of the size of the pixel. In this case, the images were scaled in such a way that the distance expressed in pixels was consistent with the distance measured in millimeters, which means that a single pixel gains a size of 1 mm. The obtained bridge panoramas were scaled to the set pixel size using bridge characteristics such as span, pylon height, deck width, etc. Of course, it is very important to choose the same bridge elements as used in the TLS technique. Thanks to the scaling of the images, the distances between the indicated pixels on an oriented surface can be read, but their three-dimensional coordinates are not directly accessible.
The mono-photogrammetric technique has the following advantages: short examination time (taking pictures and/or picture series), simultaneous measurement of the entire structure and economical attractiveness [
7,
10,
13,
14].
4. The Inventory Results with Analysis and Discussion
In order to process the obtained results, the individual scans were adapted to distinctive elements of the historic bridge, so that the subsequent measuring sessions were compatible with each other. The position of selected control sections on photograms and scans is demonstrated in
Figure 6. In addition, a comparison between correspondent measurements of the control sections of the bridge, obtained from TLS, photogrammetric and traditional survey is presented in
Table 1.
In the case of TLS, thanks to the Trimble RealWorks software, measurements of distance or their components (X, Y, Z) are based on parameters of interpolated surface fragments. The software that interpolates the characteristic surfaces performs this process automatically. However, in the case of photograms, the accuracy of measurements is improved by the use of auxiliary lines or curves representing characteristic elements such as a line through the pylon beams, hangers, etc.
It should be also added that the laser scans and photograms were levelled. In the case of TLS, the FARO Focus 130 3D scanner have a compensation mechanism (after initial manual leveling) that automatically levels the point clouds with an accuracy close to levelers. While photograms required rotation determined by the leveler’s indications allowing the marking of points in the field on the same level.
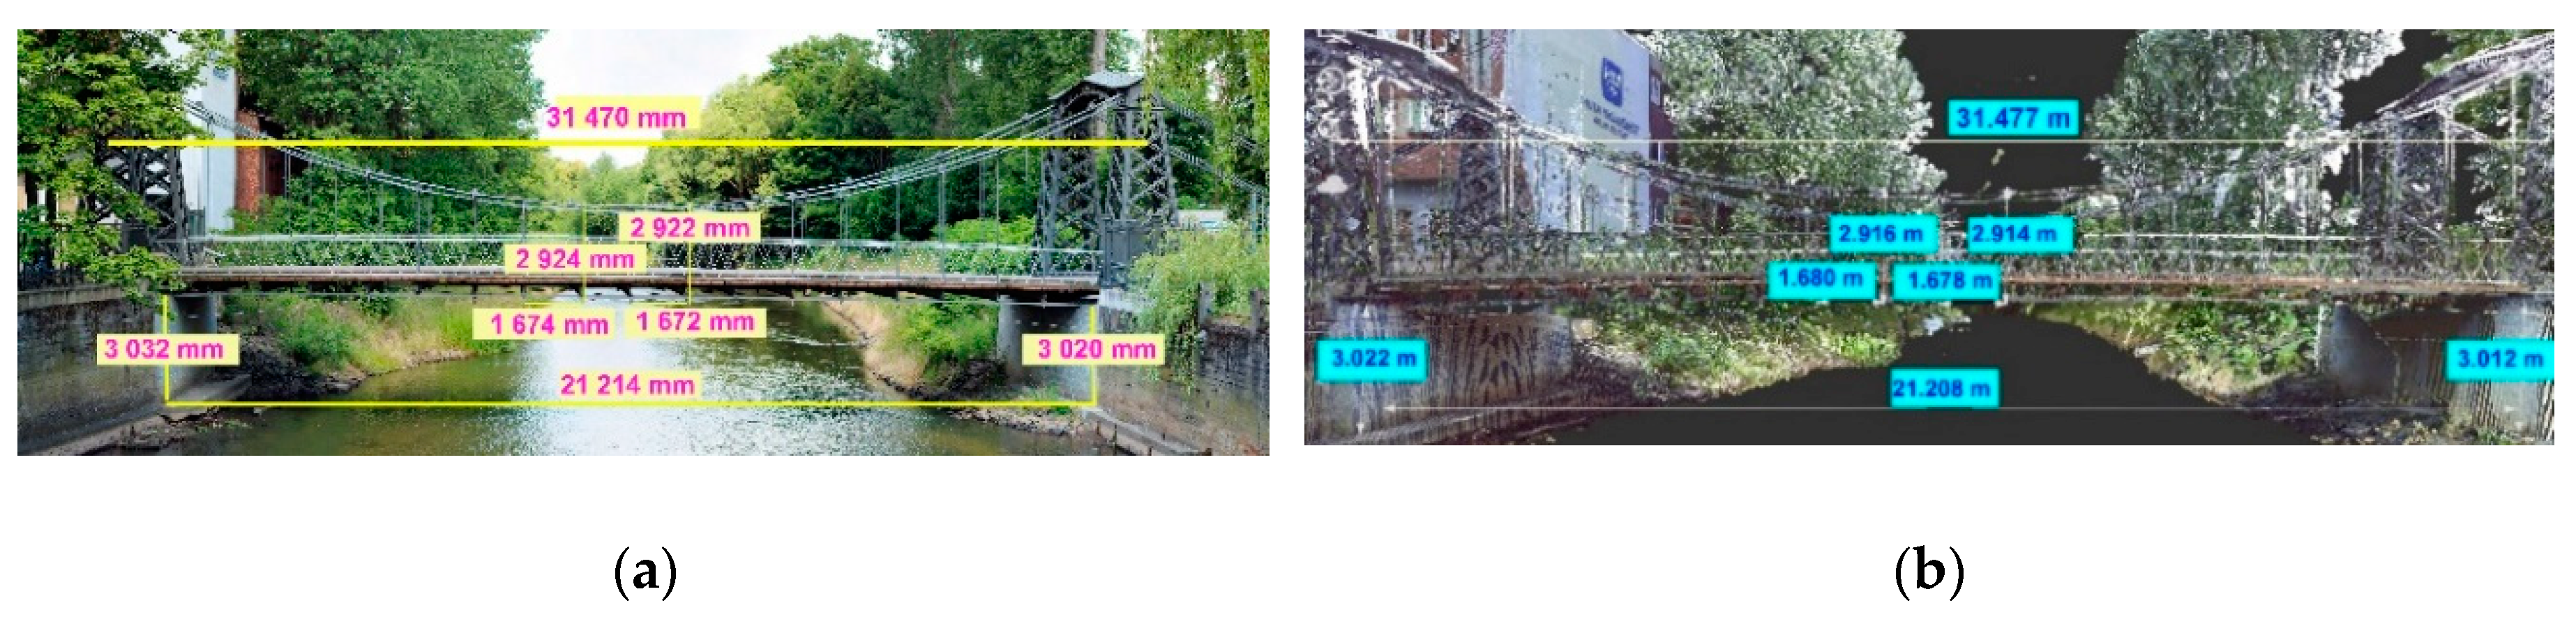
The registered TLS sessions of the historical bridge were completed with digital photograms of 0.5 mm pixel size in analyzed control sections (
Figure 6a). Taking into account the complex structure of the analyzed bridge, the disparities between TLS results and photogrammetric surveys can be considered satisfactory because they are not larger than 10 mm. The obtained TLS and photogrammetry results can also be compared with data received from the traditional survey (treated as reference data using a measuring tape, rangefinder and total station). The traditional survey results differed from TLS and photogrammetry results by a maximum of 4 mm and 10 mm, respectively. Taking into account the differences in percentages, these are not greater than 0.2% for TLS and 0.5% for photogrammetric technique when compared with the traditional survey. Thus, the TLS results are closer to the reference data. However, it is very important to emphasize that the obtained results (both TLS and photogrammetry) are quite close to project documentation (used for bridge modernization purposes). Taking into account the project data of the bridge, the differences obtained vs. applied methods do not exceed 30 mm. Greater discrepancies between measurement results (TLS, photogrammetric and traditional survey) and project occur for the largest dimensions:, e.g., spacing of pylons. For smaller lengths (e.g., hangers), the differences do not exceed 10 mm.
In some cases, it may happen that the dimensions of the structure (obtained from the project) differ from the actual dimensions (as in this case). This proves that the construction works, and operation of the bridge can affect the dimensions of bridge components. In general, the differences obtained can result from construction deviations and/or incorrect behavior of the tested structure due to overloading, material degradation and destruction of structure components. Therefore, it is important to regularly check the condition of bridge components.
Taking into account the dimensional tolerances in civil engineering, the obtained differences are acceptable and can be considered satisfactory [
51,
52]. Better convergence of the results was obtained for TLS than photogrammetry. The TLS method can be treated as a more accurate measurement technique (the results are closer to real bridge dimensions). In addition, it should be underlined that acquisition distances within 40 m lead to obtaining considerably accurate results.
Finally, in the case of the photogrammetric technique, photograms were registered on a 24-megapixel Canon 750D matrix. The resolution depends on the distance from the camera to the tested object and focal length of the lens used. The investigated bridge elements were verified using a rescaled image resolution, which was 1 pixel = 1 mm. The photogram resolution allows for a fairly accurate photorealistic estimation of the technical condition of bridge elements (
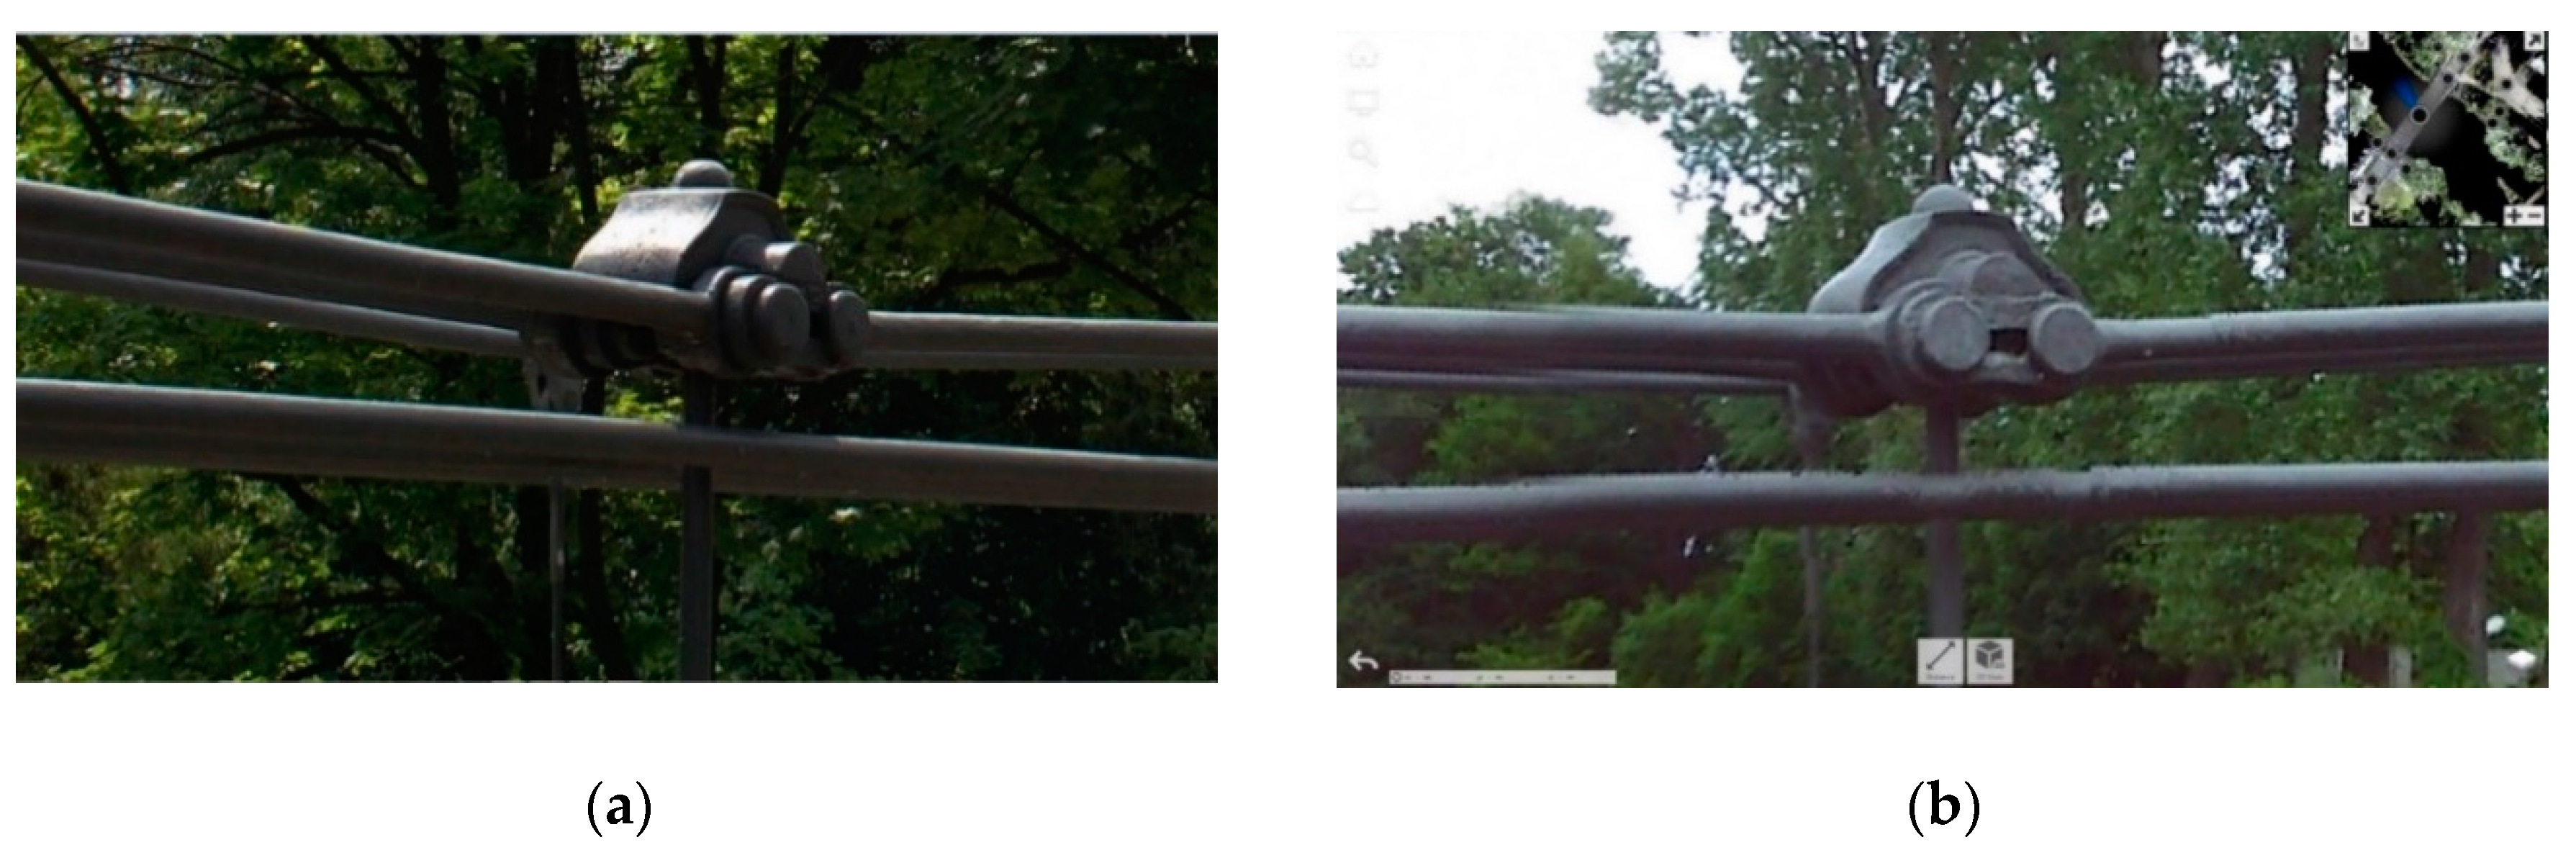
Figure 7). Variations occurring in the length of individual bridge elements are related to the precision of the matching of photograms and the adequacy of parallel projection (meaning the sphere projection on a surface). The computation of a selected bridge element’s length on a photogram is done within the image surface by summing pixels and then multiplying by the pixel size (according to the scaled resolution). The orthogonalization error for this particular measurement oscillates around 1 mm and is negligible for the obtained measurement accuracy (for FARO Focus 130 3D < 2 mm).
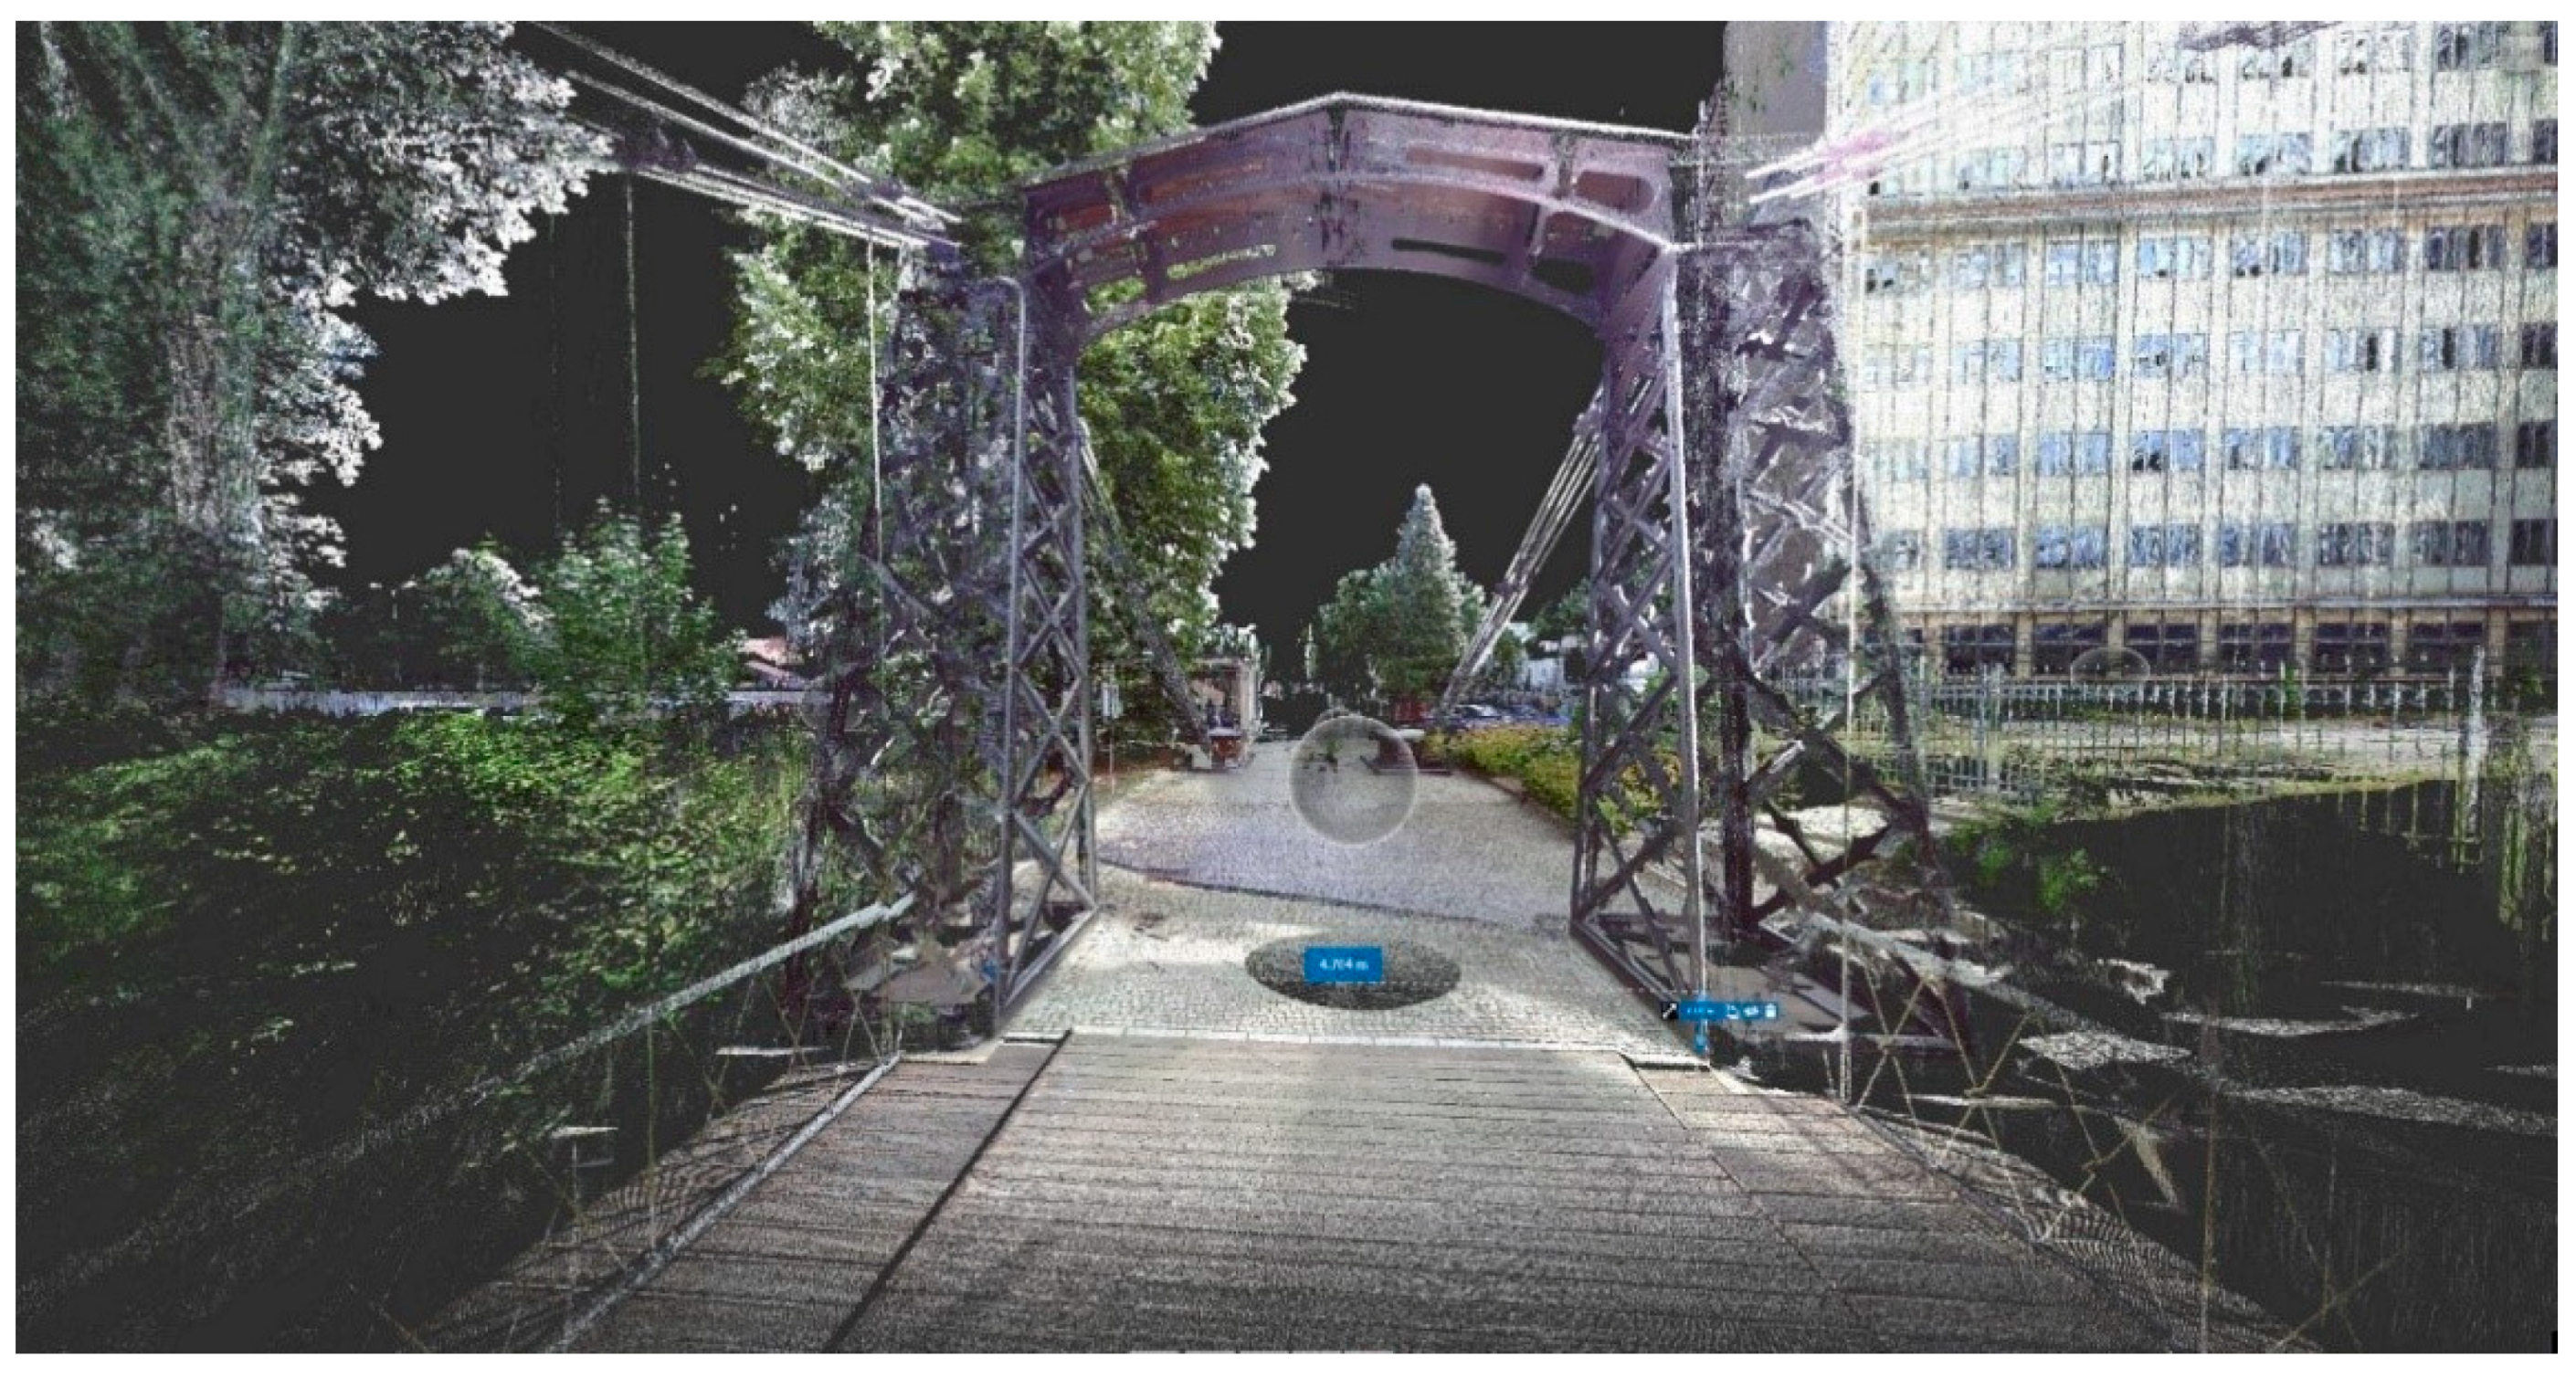
The measuring results presented in the form of scans and photograms (
Figure 8,
Figure 9 and
Figure 10) show that the bridge elements are well visible and can be easily recognized. It should be added that the given images also include surroundings (other buildings, plants, people, vehicles) which can disturb the obtained results. However, these additional elements can be readily removed from scans and photograms if needed. Moreover, the TLS and photogrammetric techniques allow measurement and checking of any details of the bridge (
Figure 7a,b) and, additionally, bridge inspectors (or conservators) can obtain a full 3D model of the structure (
Figure 8). Inspectors using such results (in color) can make a decision to check some elements in detail. The photogrammetric technique, which uses high camera focus, can obtain details of bridge damages, such as cracks, deformations, etc.
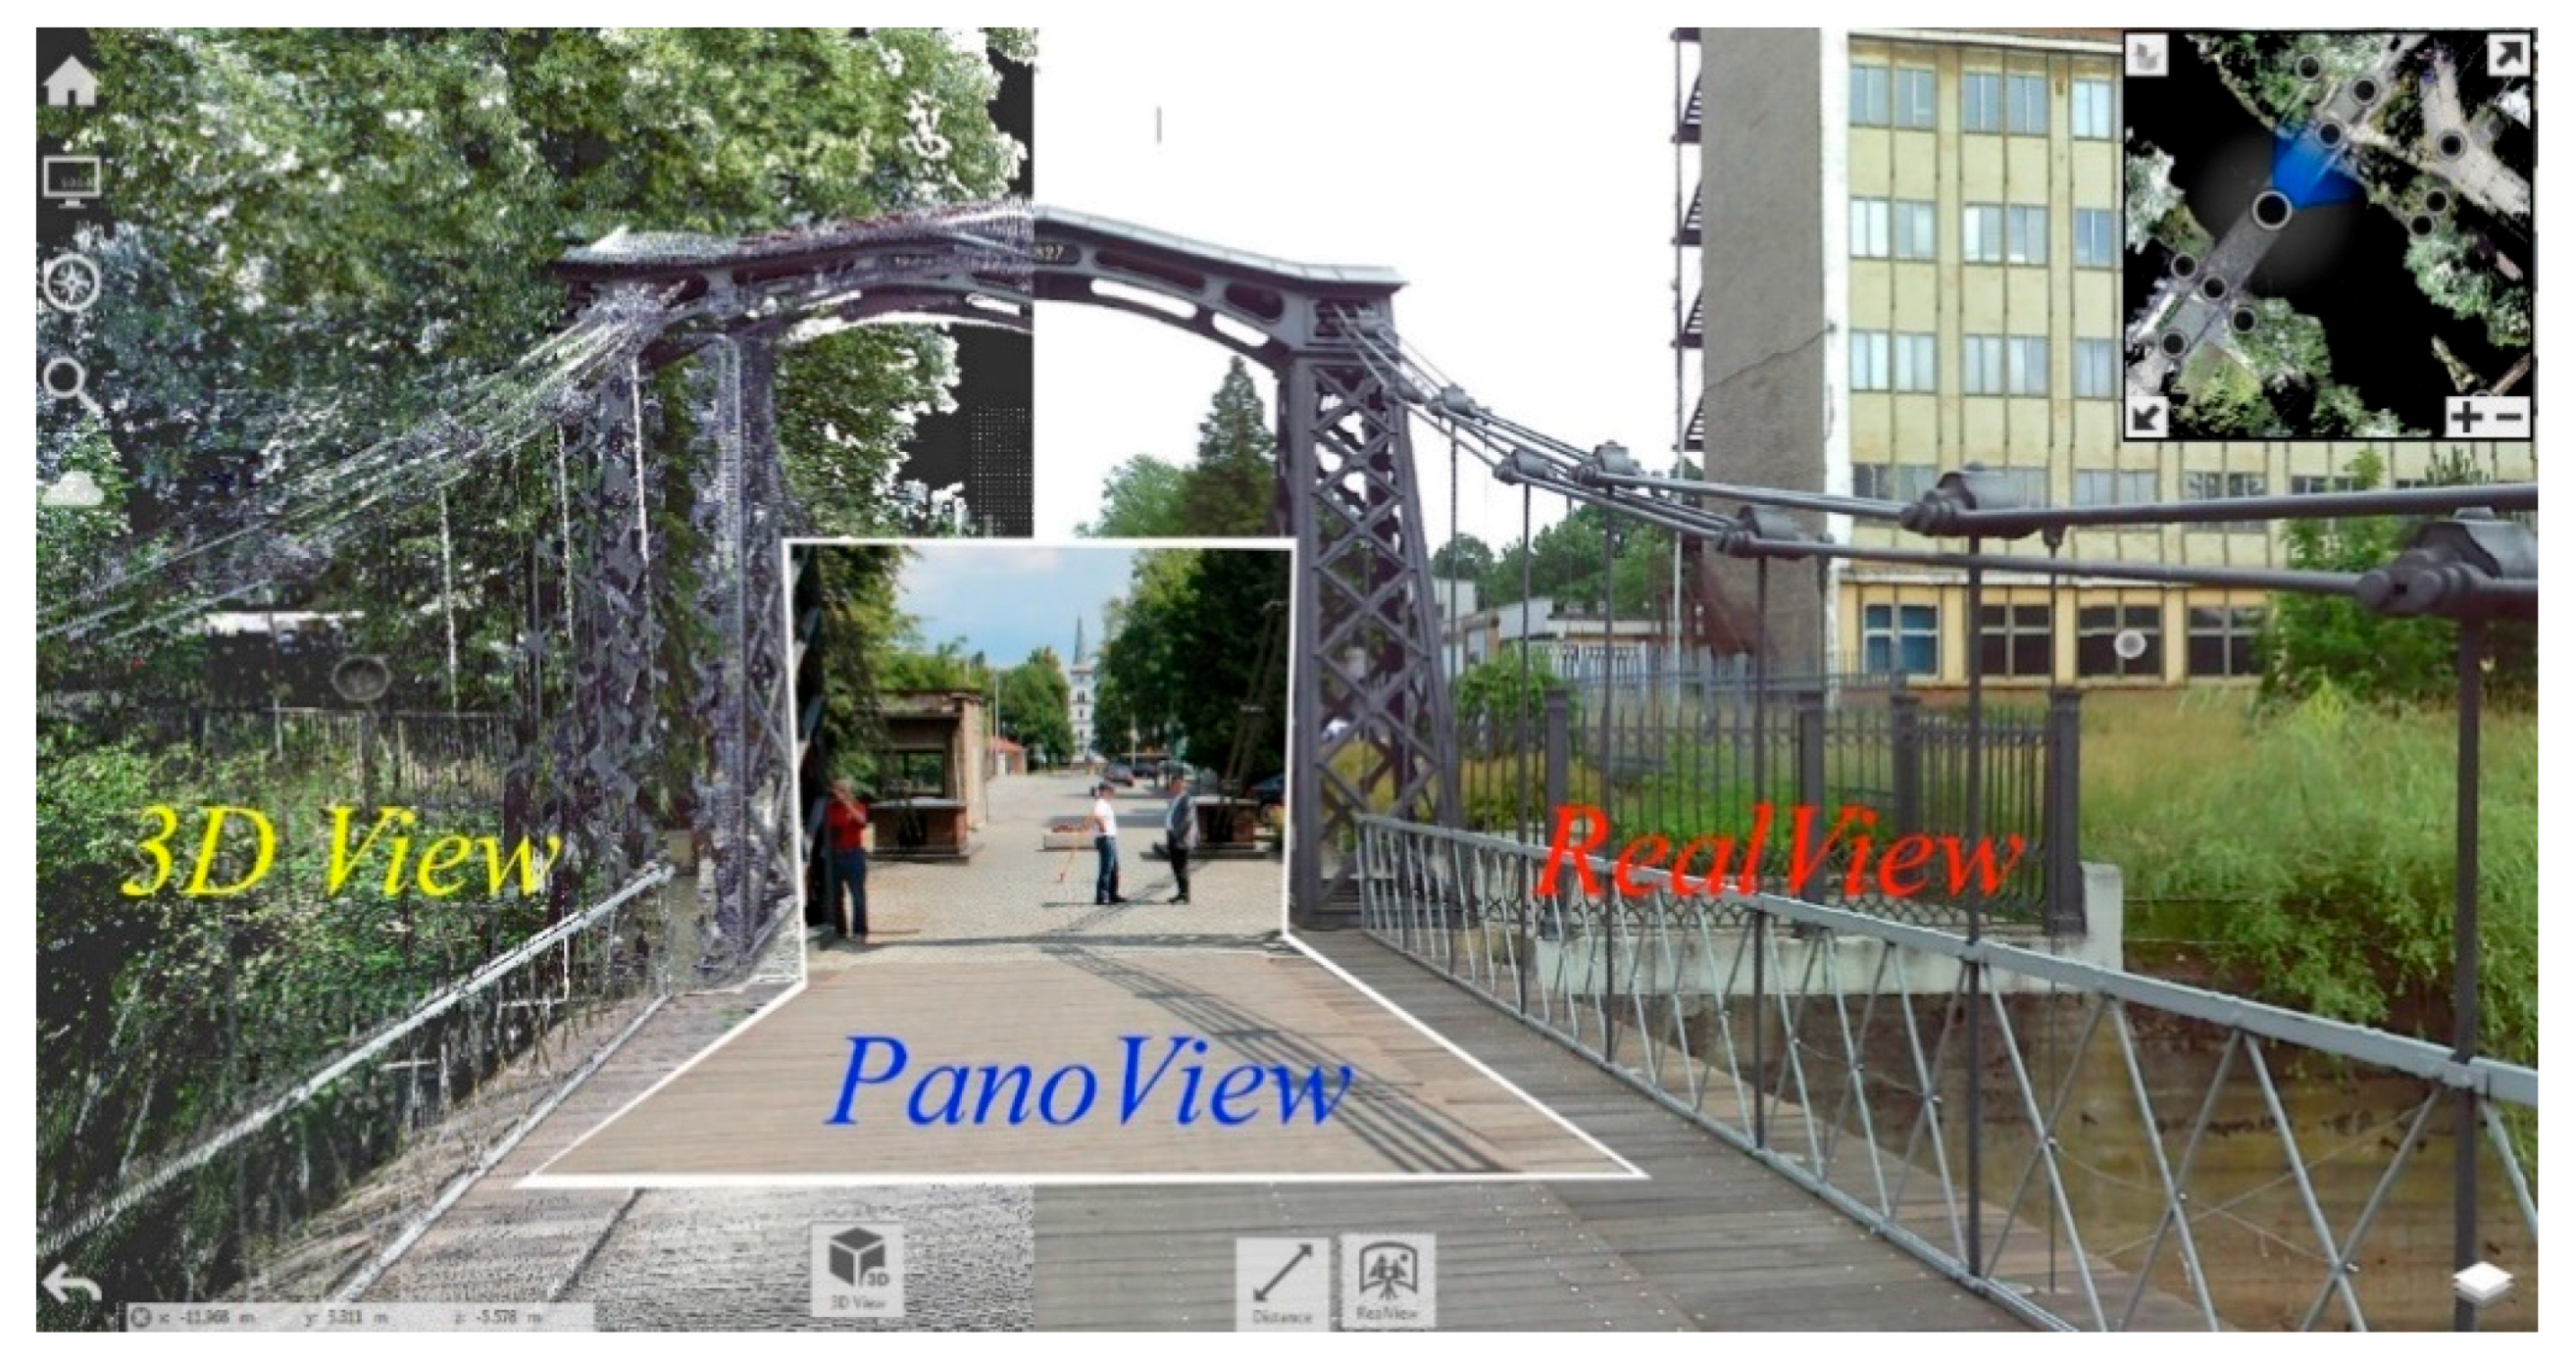
Nowadays, TLS is one of the costliest measuring techniques. The best solution may be to simultaneously apply different techniques (for example TLS, tachymetry or photogrammetric) to survey bridges. Moreover, the obtained measuring data clearly show that there is no versatile survey apparatus. On the other hand, it is very interesting to combine several visualizations into one view (
Figure 9). Therefore, during preparation for testing using TLS and photogrammetry, the following issues should be taken into account: object type, its size and complexity and the expected distance to the scanner (or camera). In addition, it should be highlighted that accuracies indicated by manufacturers are not always consistent with real measuring. This is demonstrated in this study and one of the causes can be bridge type, element textures and color of the tested elements.
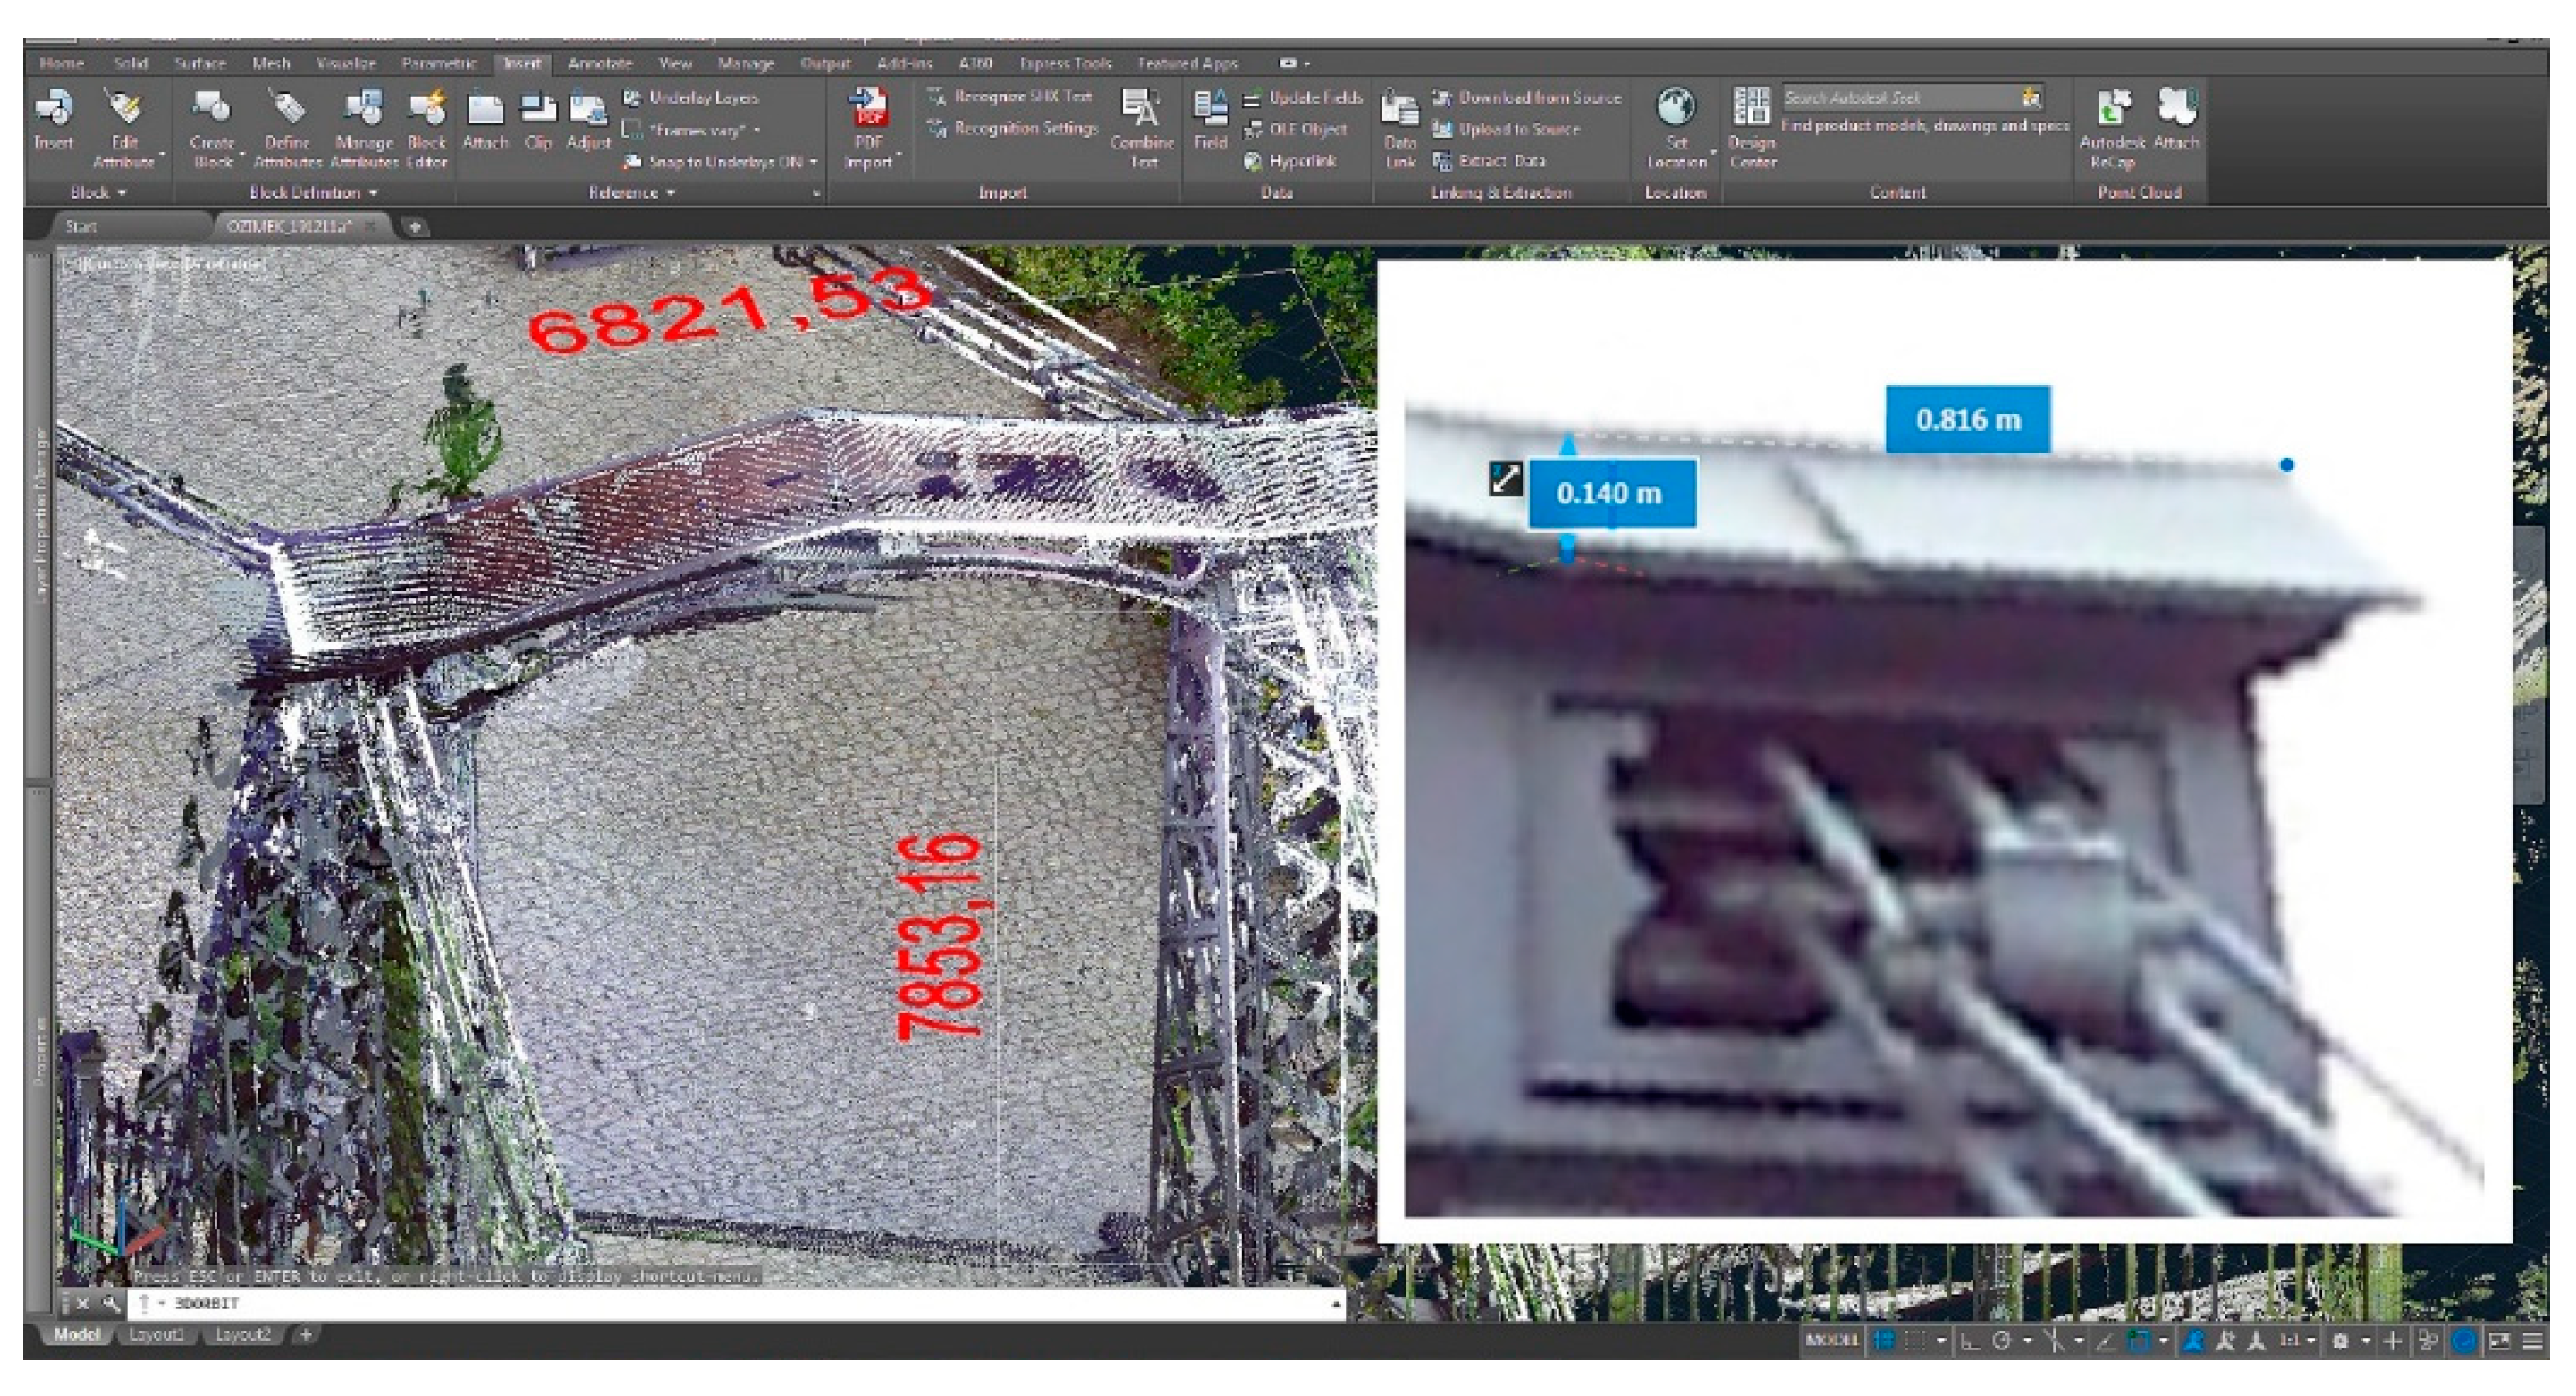
From a practical point of view, it is very important to be able to import the laser scanning point clouds (.rcs <> RecapPro format) into AutoDesk AutoCad (
Figure 10) with access to all the features of this environment [
53]. Then, the designer or conservator can use real photograms of structures quickly and efficiently, for example, to measure selected elements, etc.
It should also be mentioned that all measurement sessions using TLS and photogrammetry on the analyzed bridge took two hours. As a result, the designer or conservator obtains the full 3D bridge model for further analysis. Using traditional tools, such inventory works can take at least a few days and several more days to prepare appropriate drawings and 3D models. Thus, TLS and photogrammetric techniques offer great potential for inventory works that are not very time-consuming and with satisfactory accuracy.


