Recent Changes in Water Discharge in Snow and Glacier Melt-Dominated Rivers in the Tienshan Mountains, Central Asia

 ,
, 

 ,
,  and
and
Abstract
1. Introduction
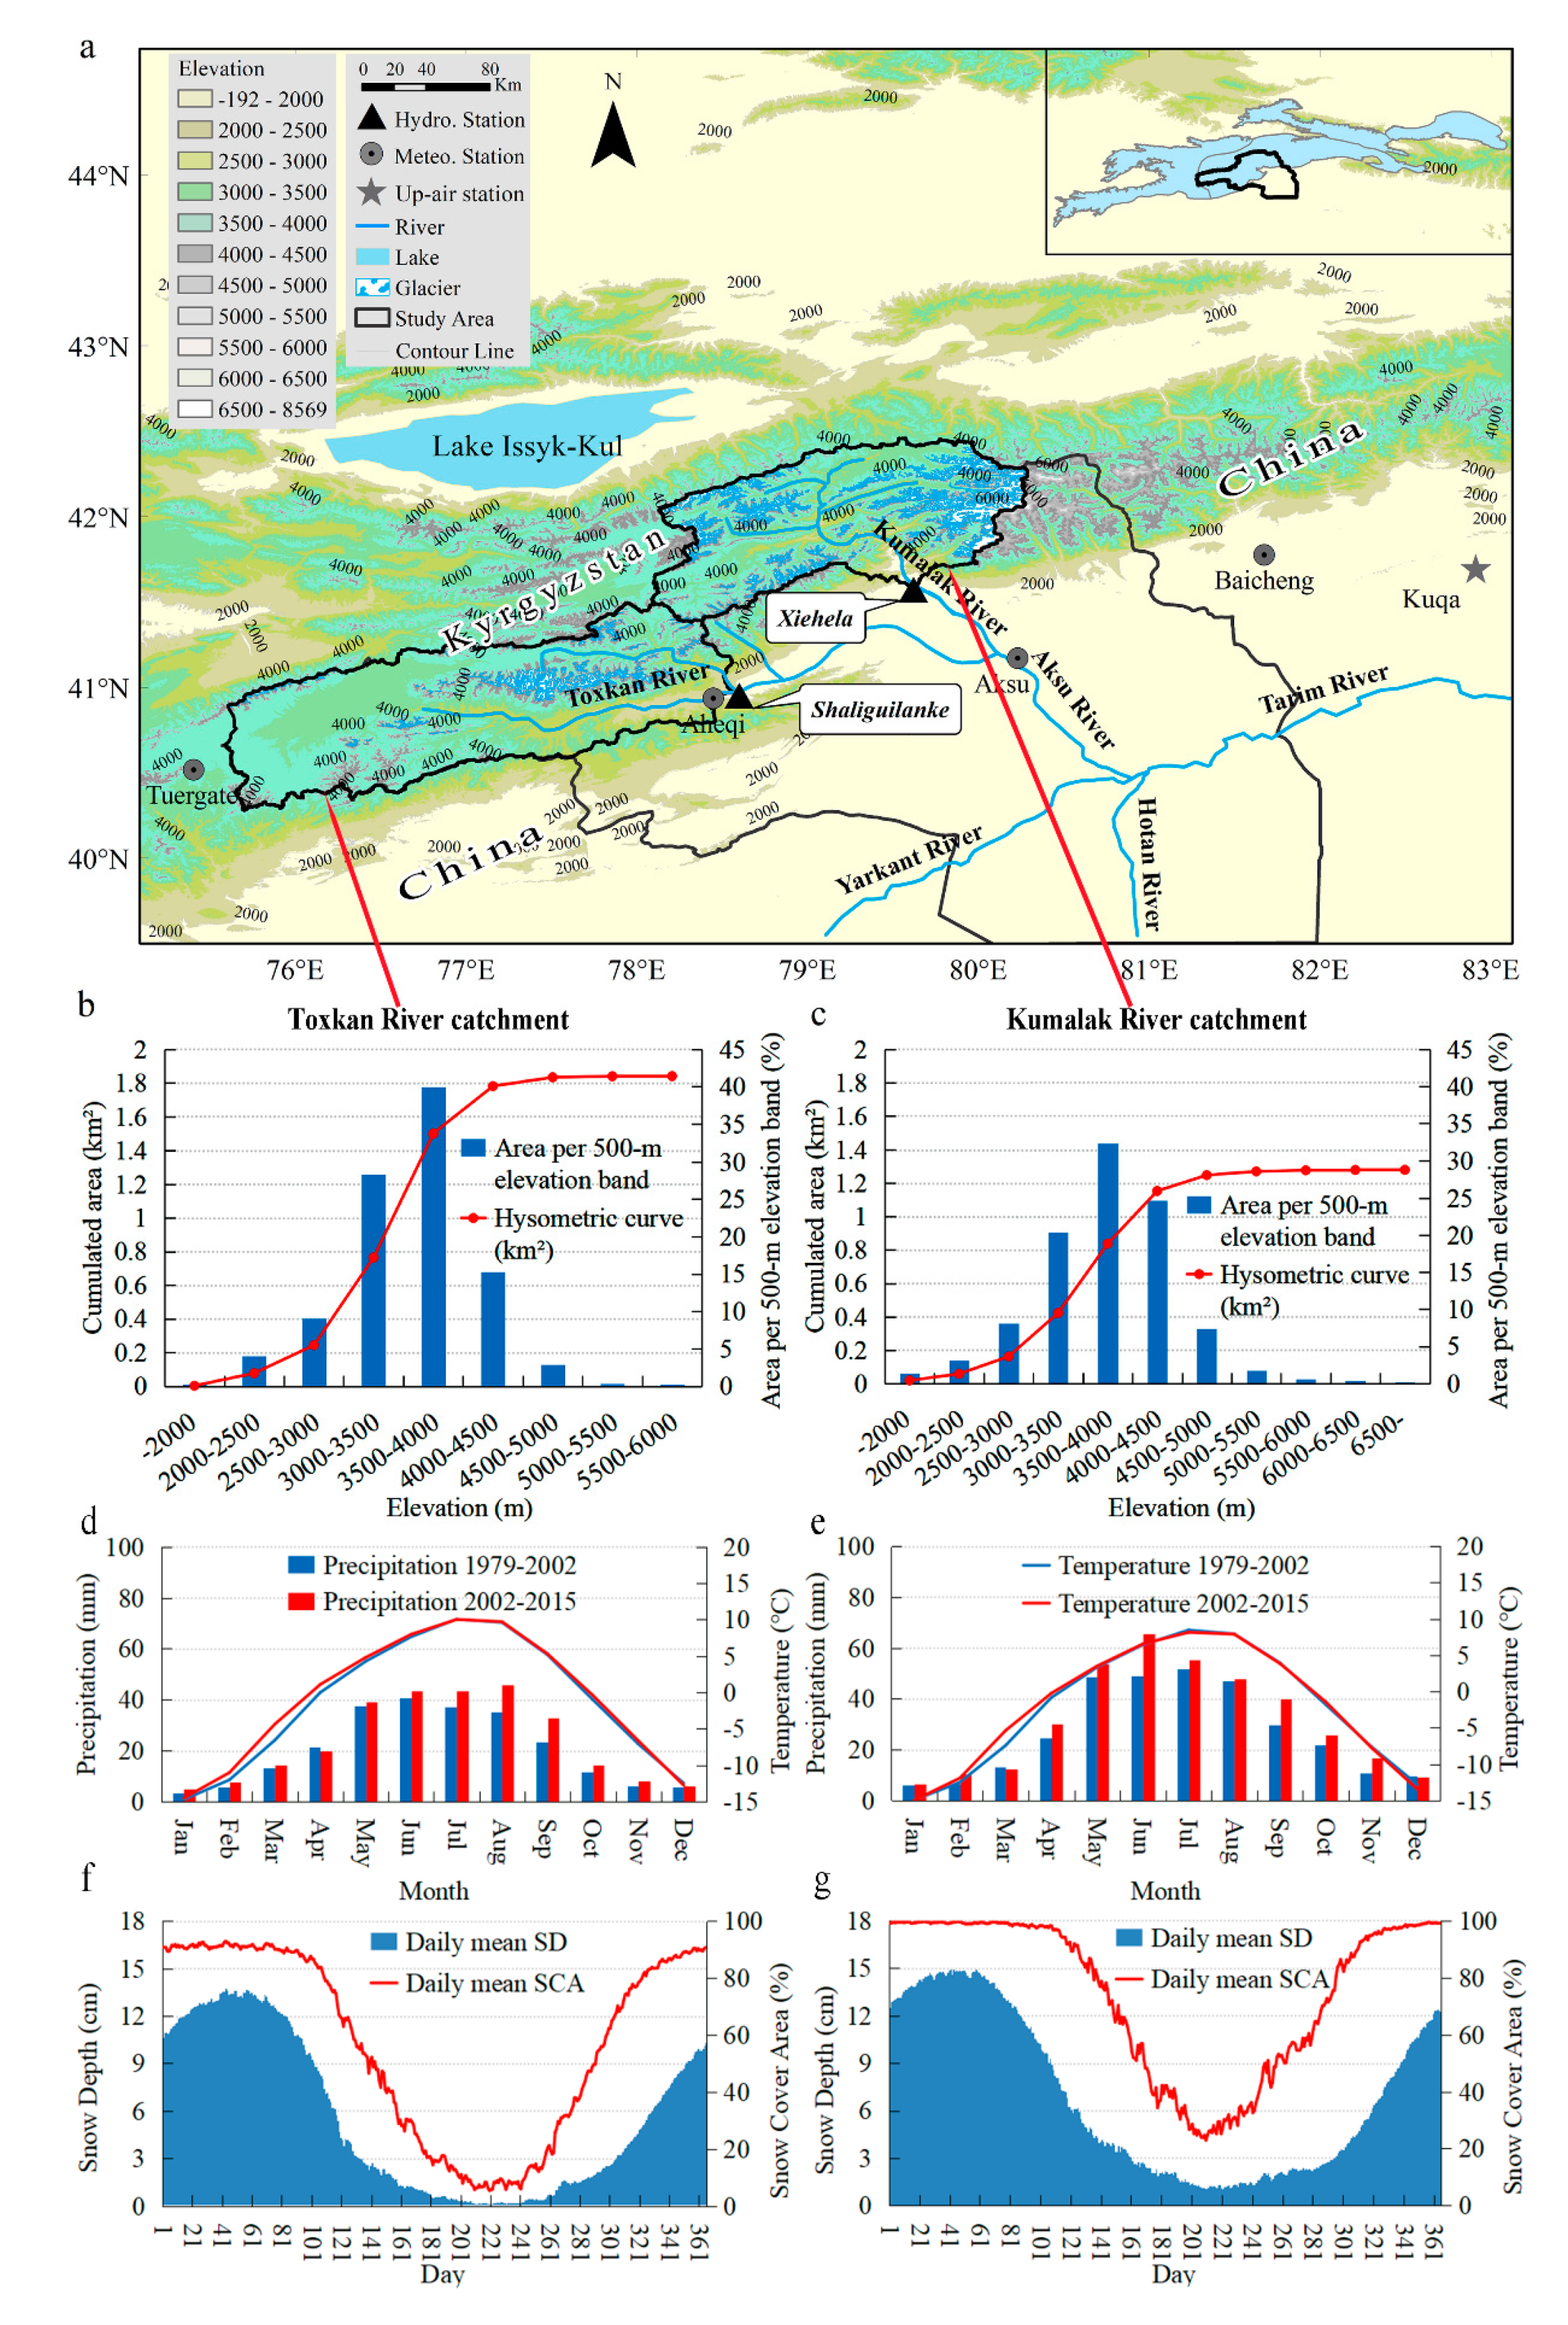
2. Research Area
3. Material and Methods
3.1. Material
3.1.1. Meteorological and Streamflow Data
3.1.2. LSDPC Snow Depth and MODIS Snow Cover Data
3.1.3. ASTER DEM
3.2. Methods
3.2.1. Trend Analysis
3.2.2. Summer Altitude of 0 °C Isotherm Calculations
3.2.3. Glacier Mass Balance Calculations
3.2.4. Snow Cover Mapping Calculations
3.2.5. Sensitivity and Correlation Analysis between Snow Cover Area, Snow Depth, and Runoff
4. Results
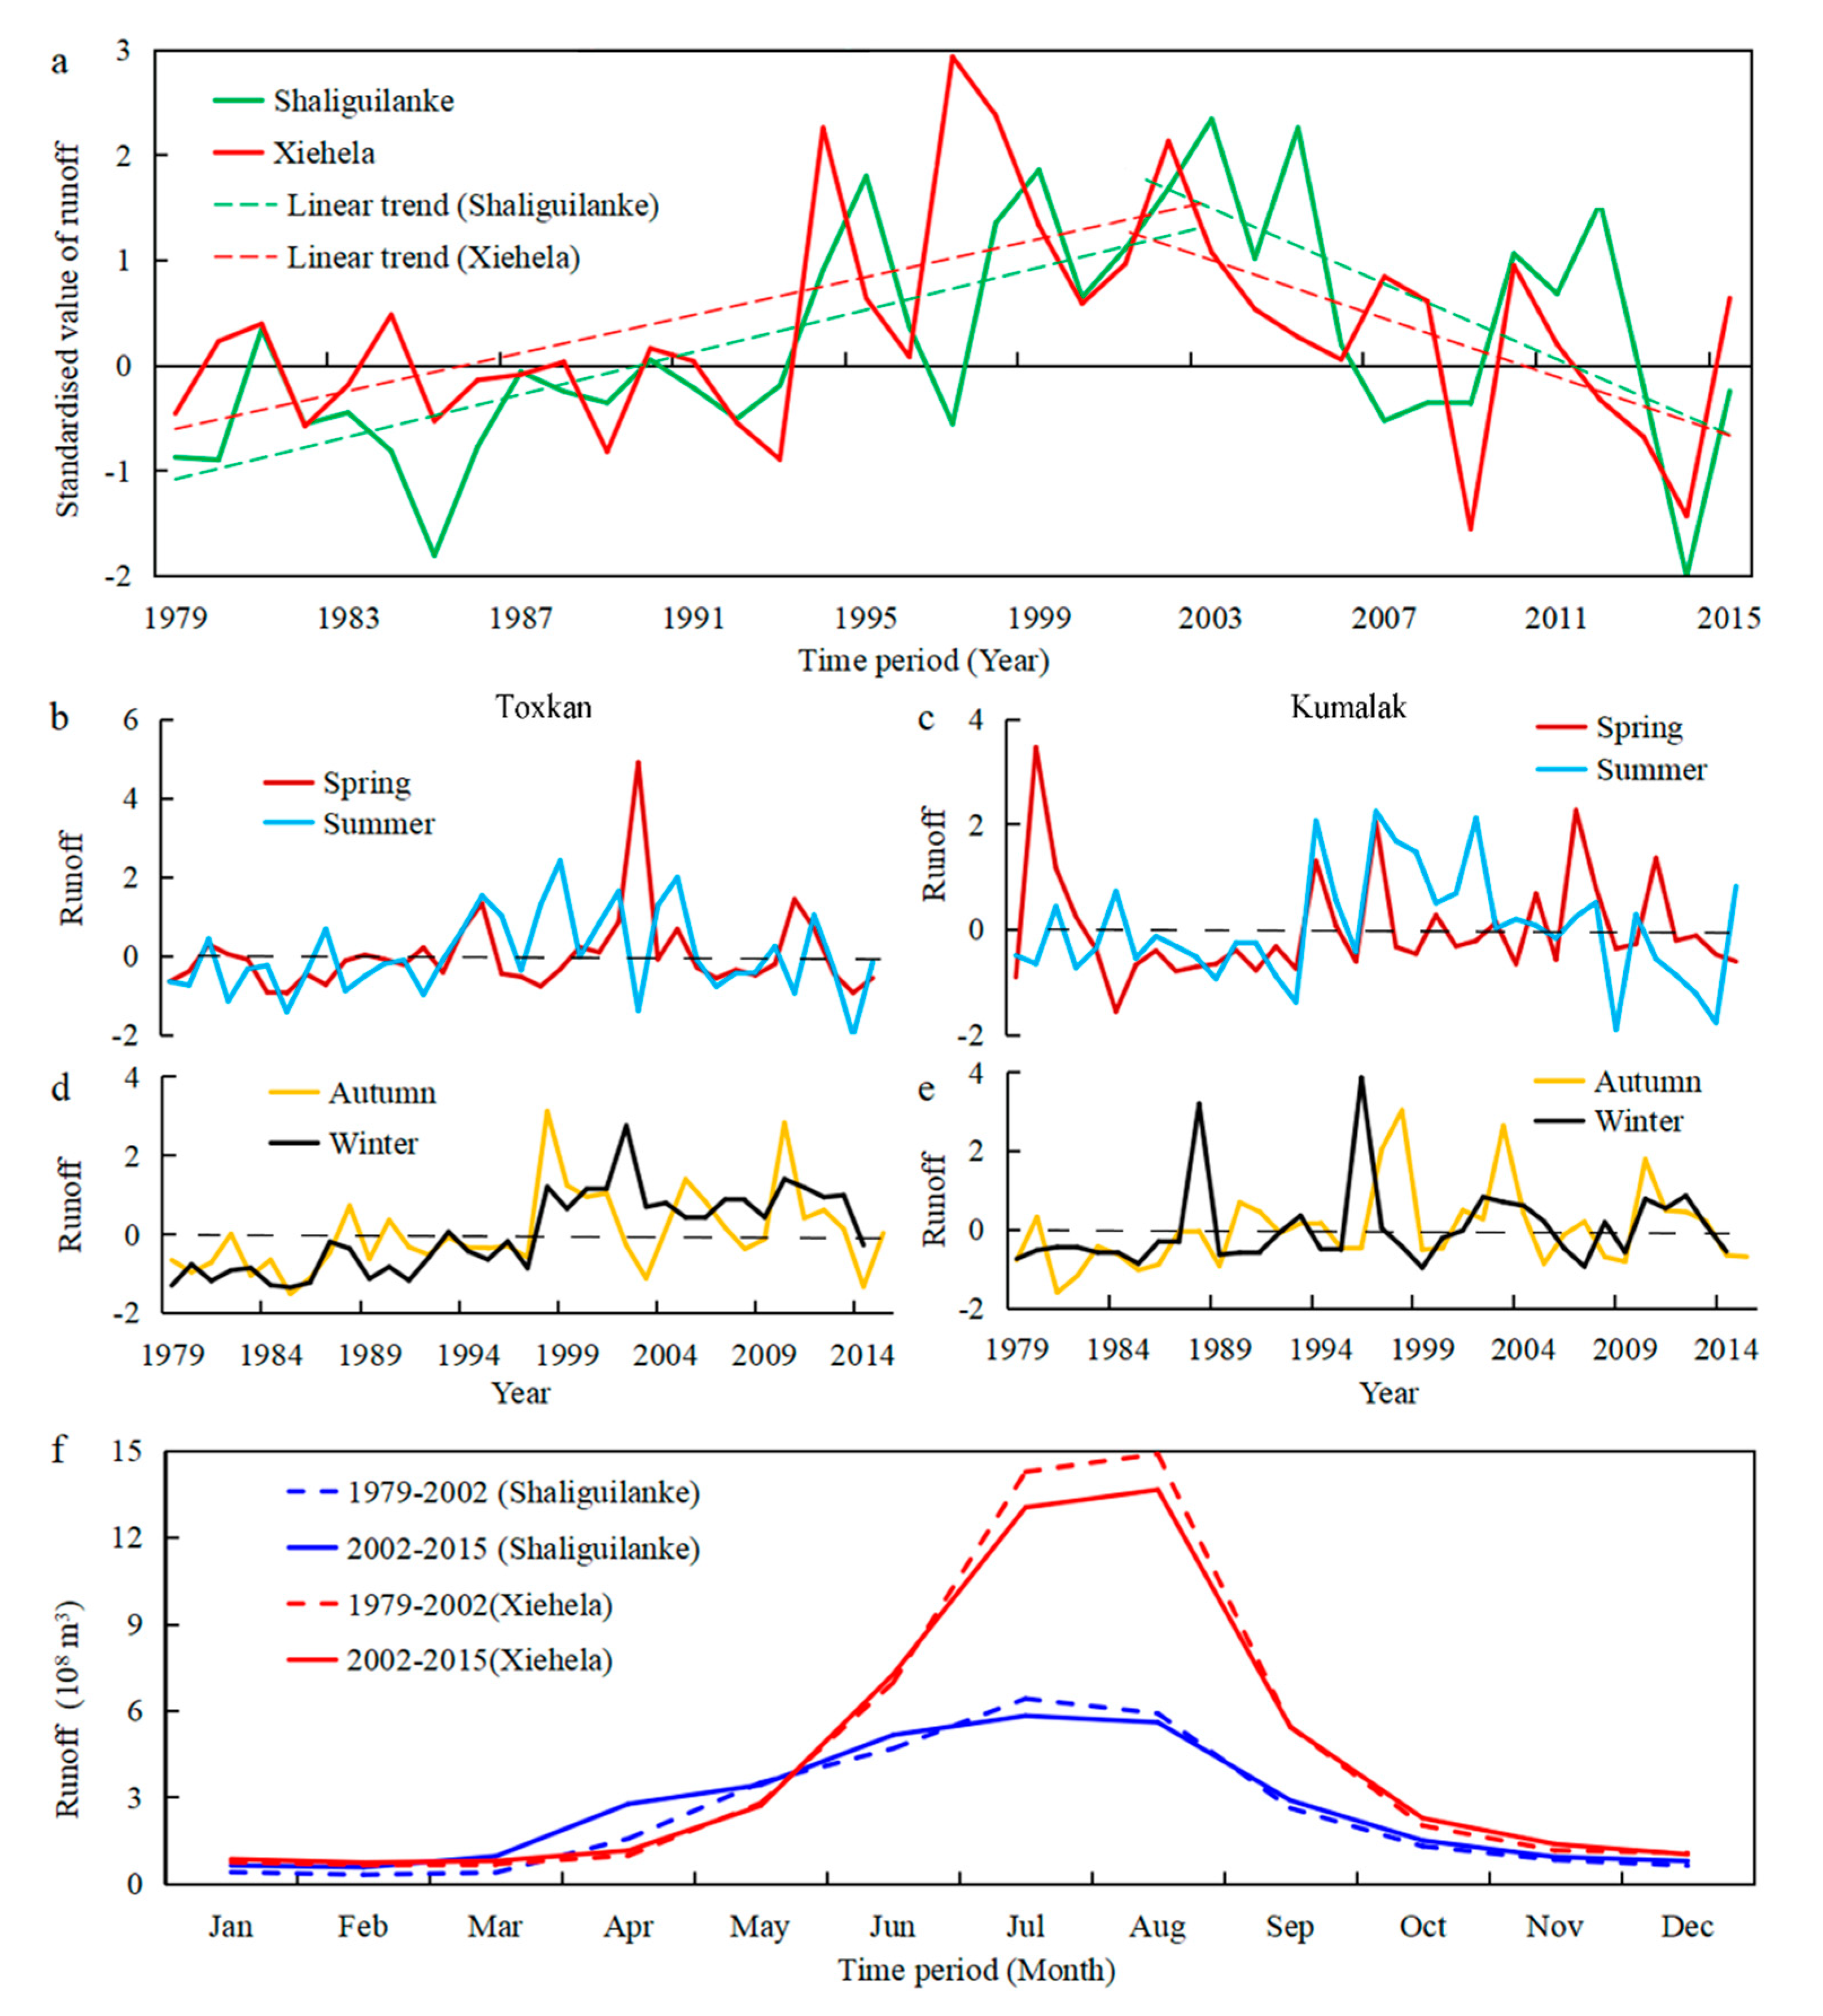
4.1. Changes in River Runoff
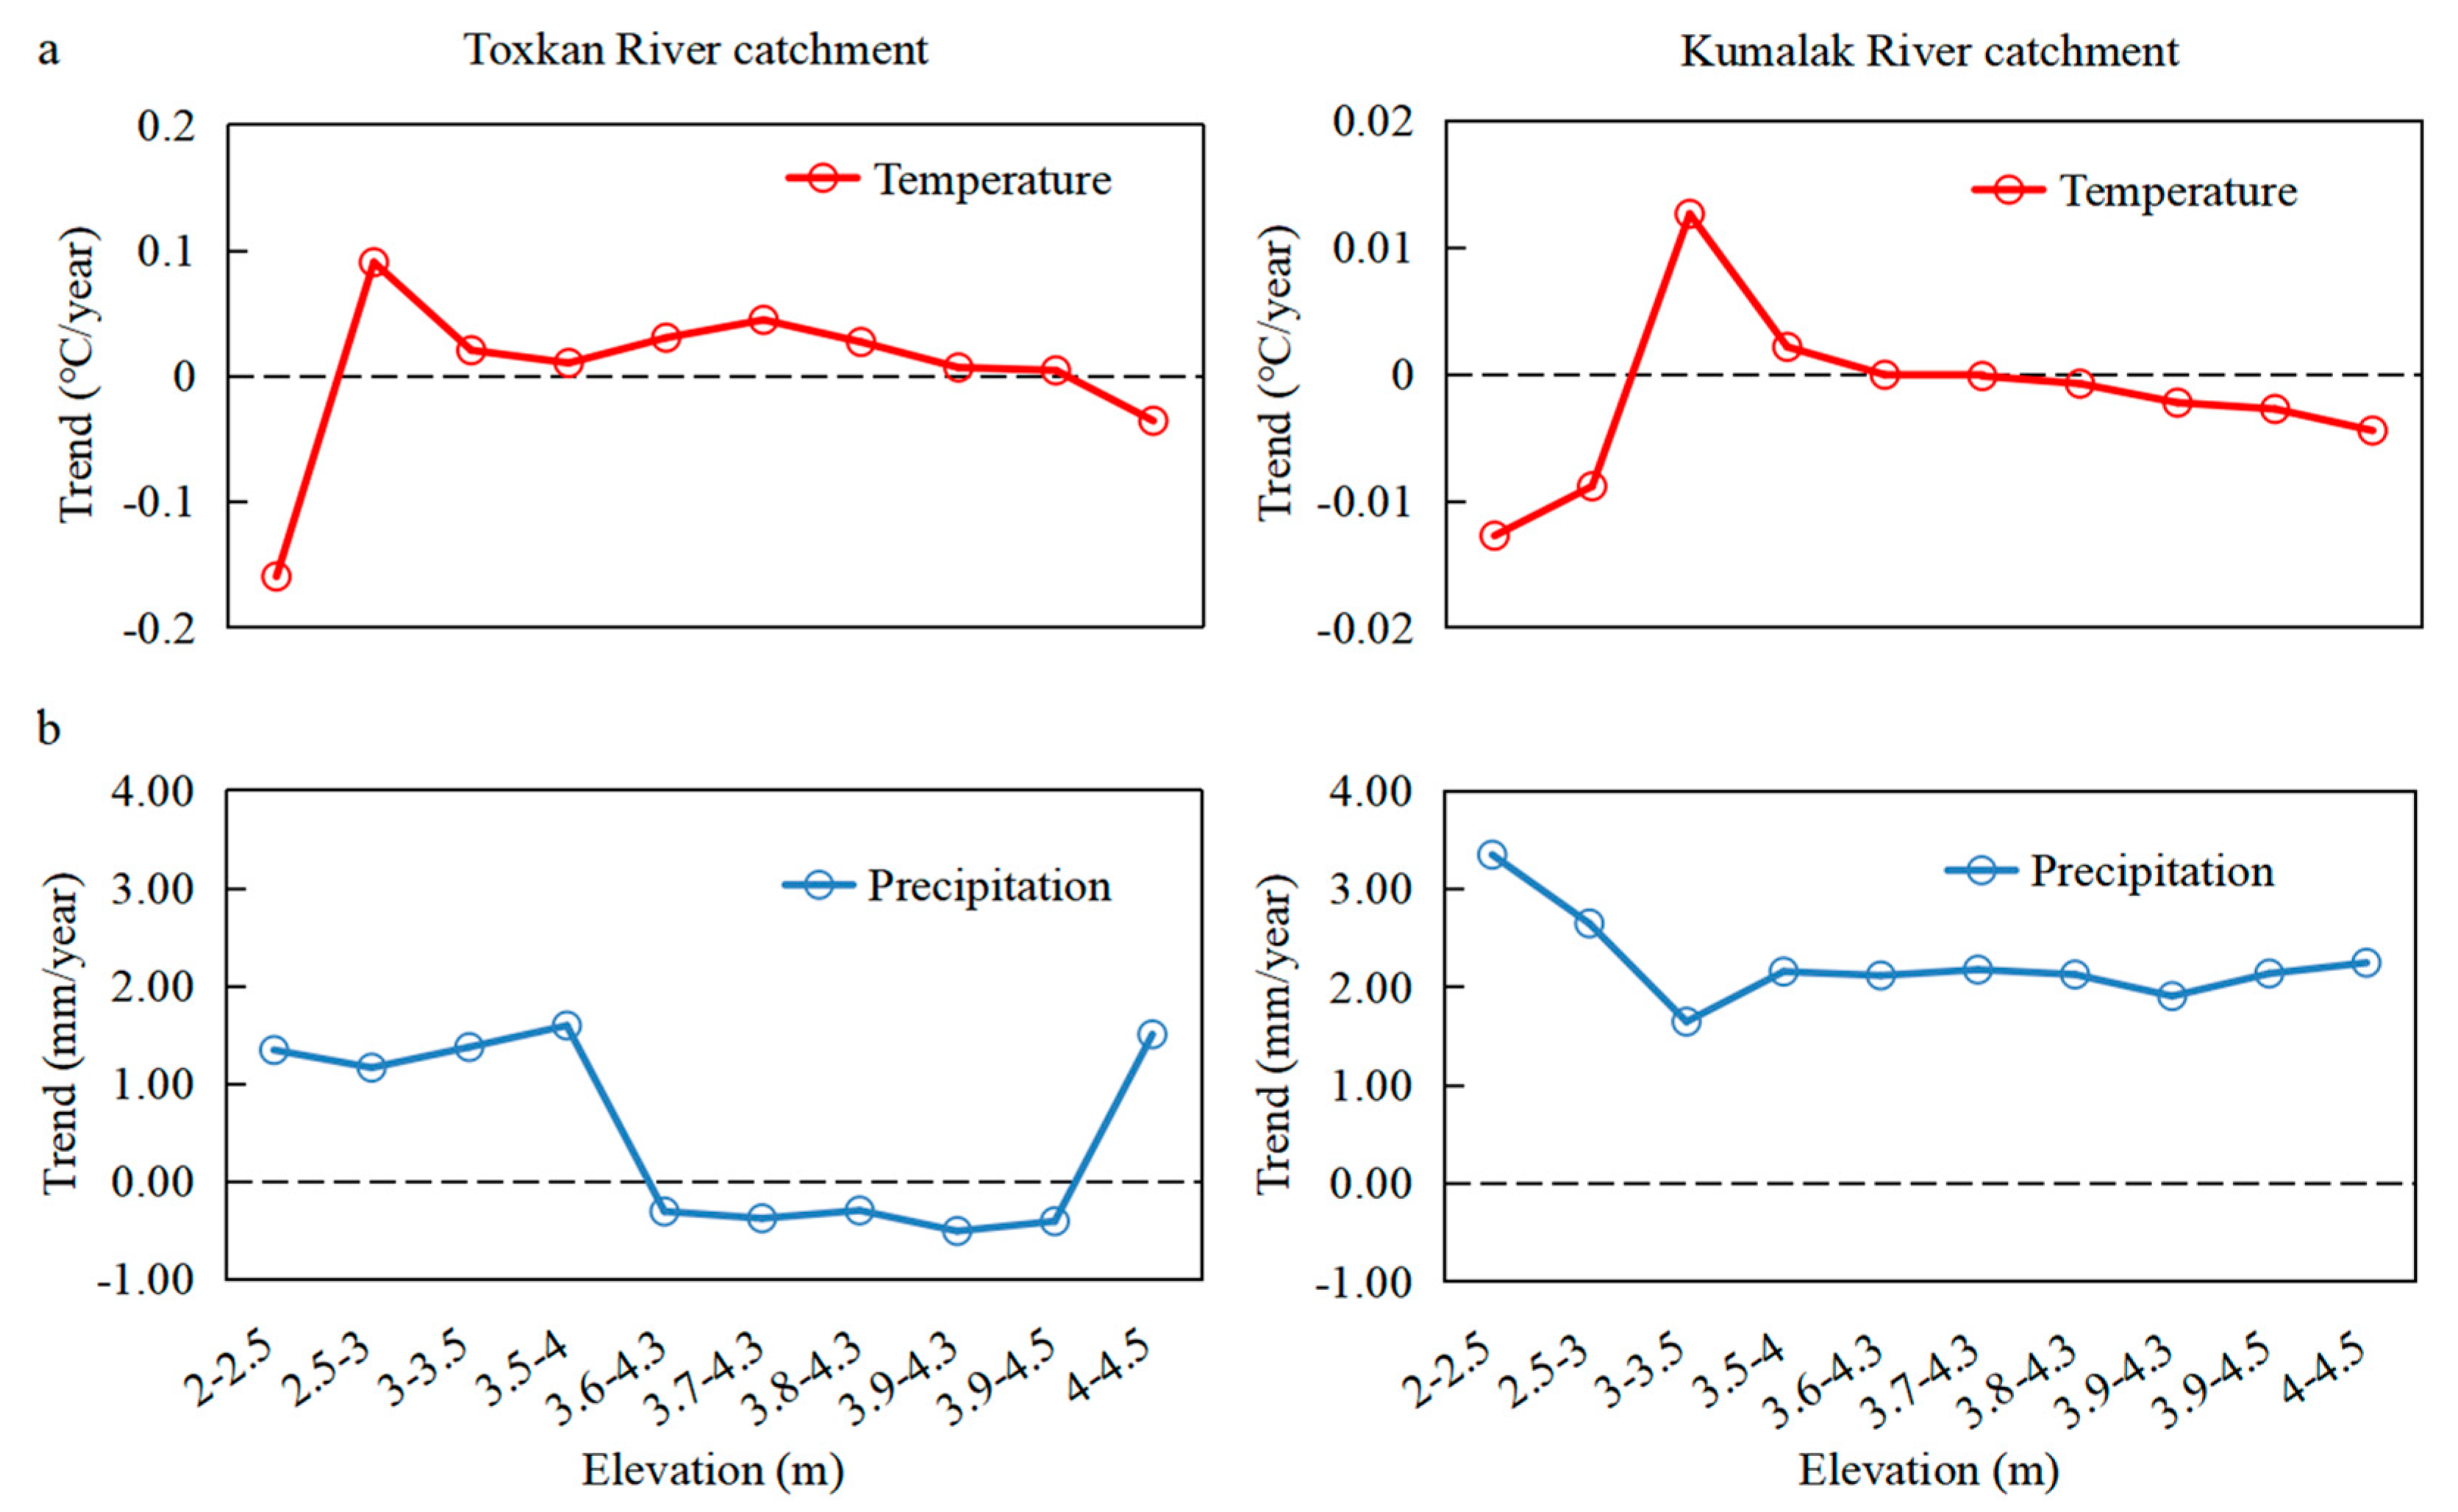
4.2. Relationship between Temperature, Precipitation, and Runoff
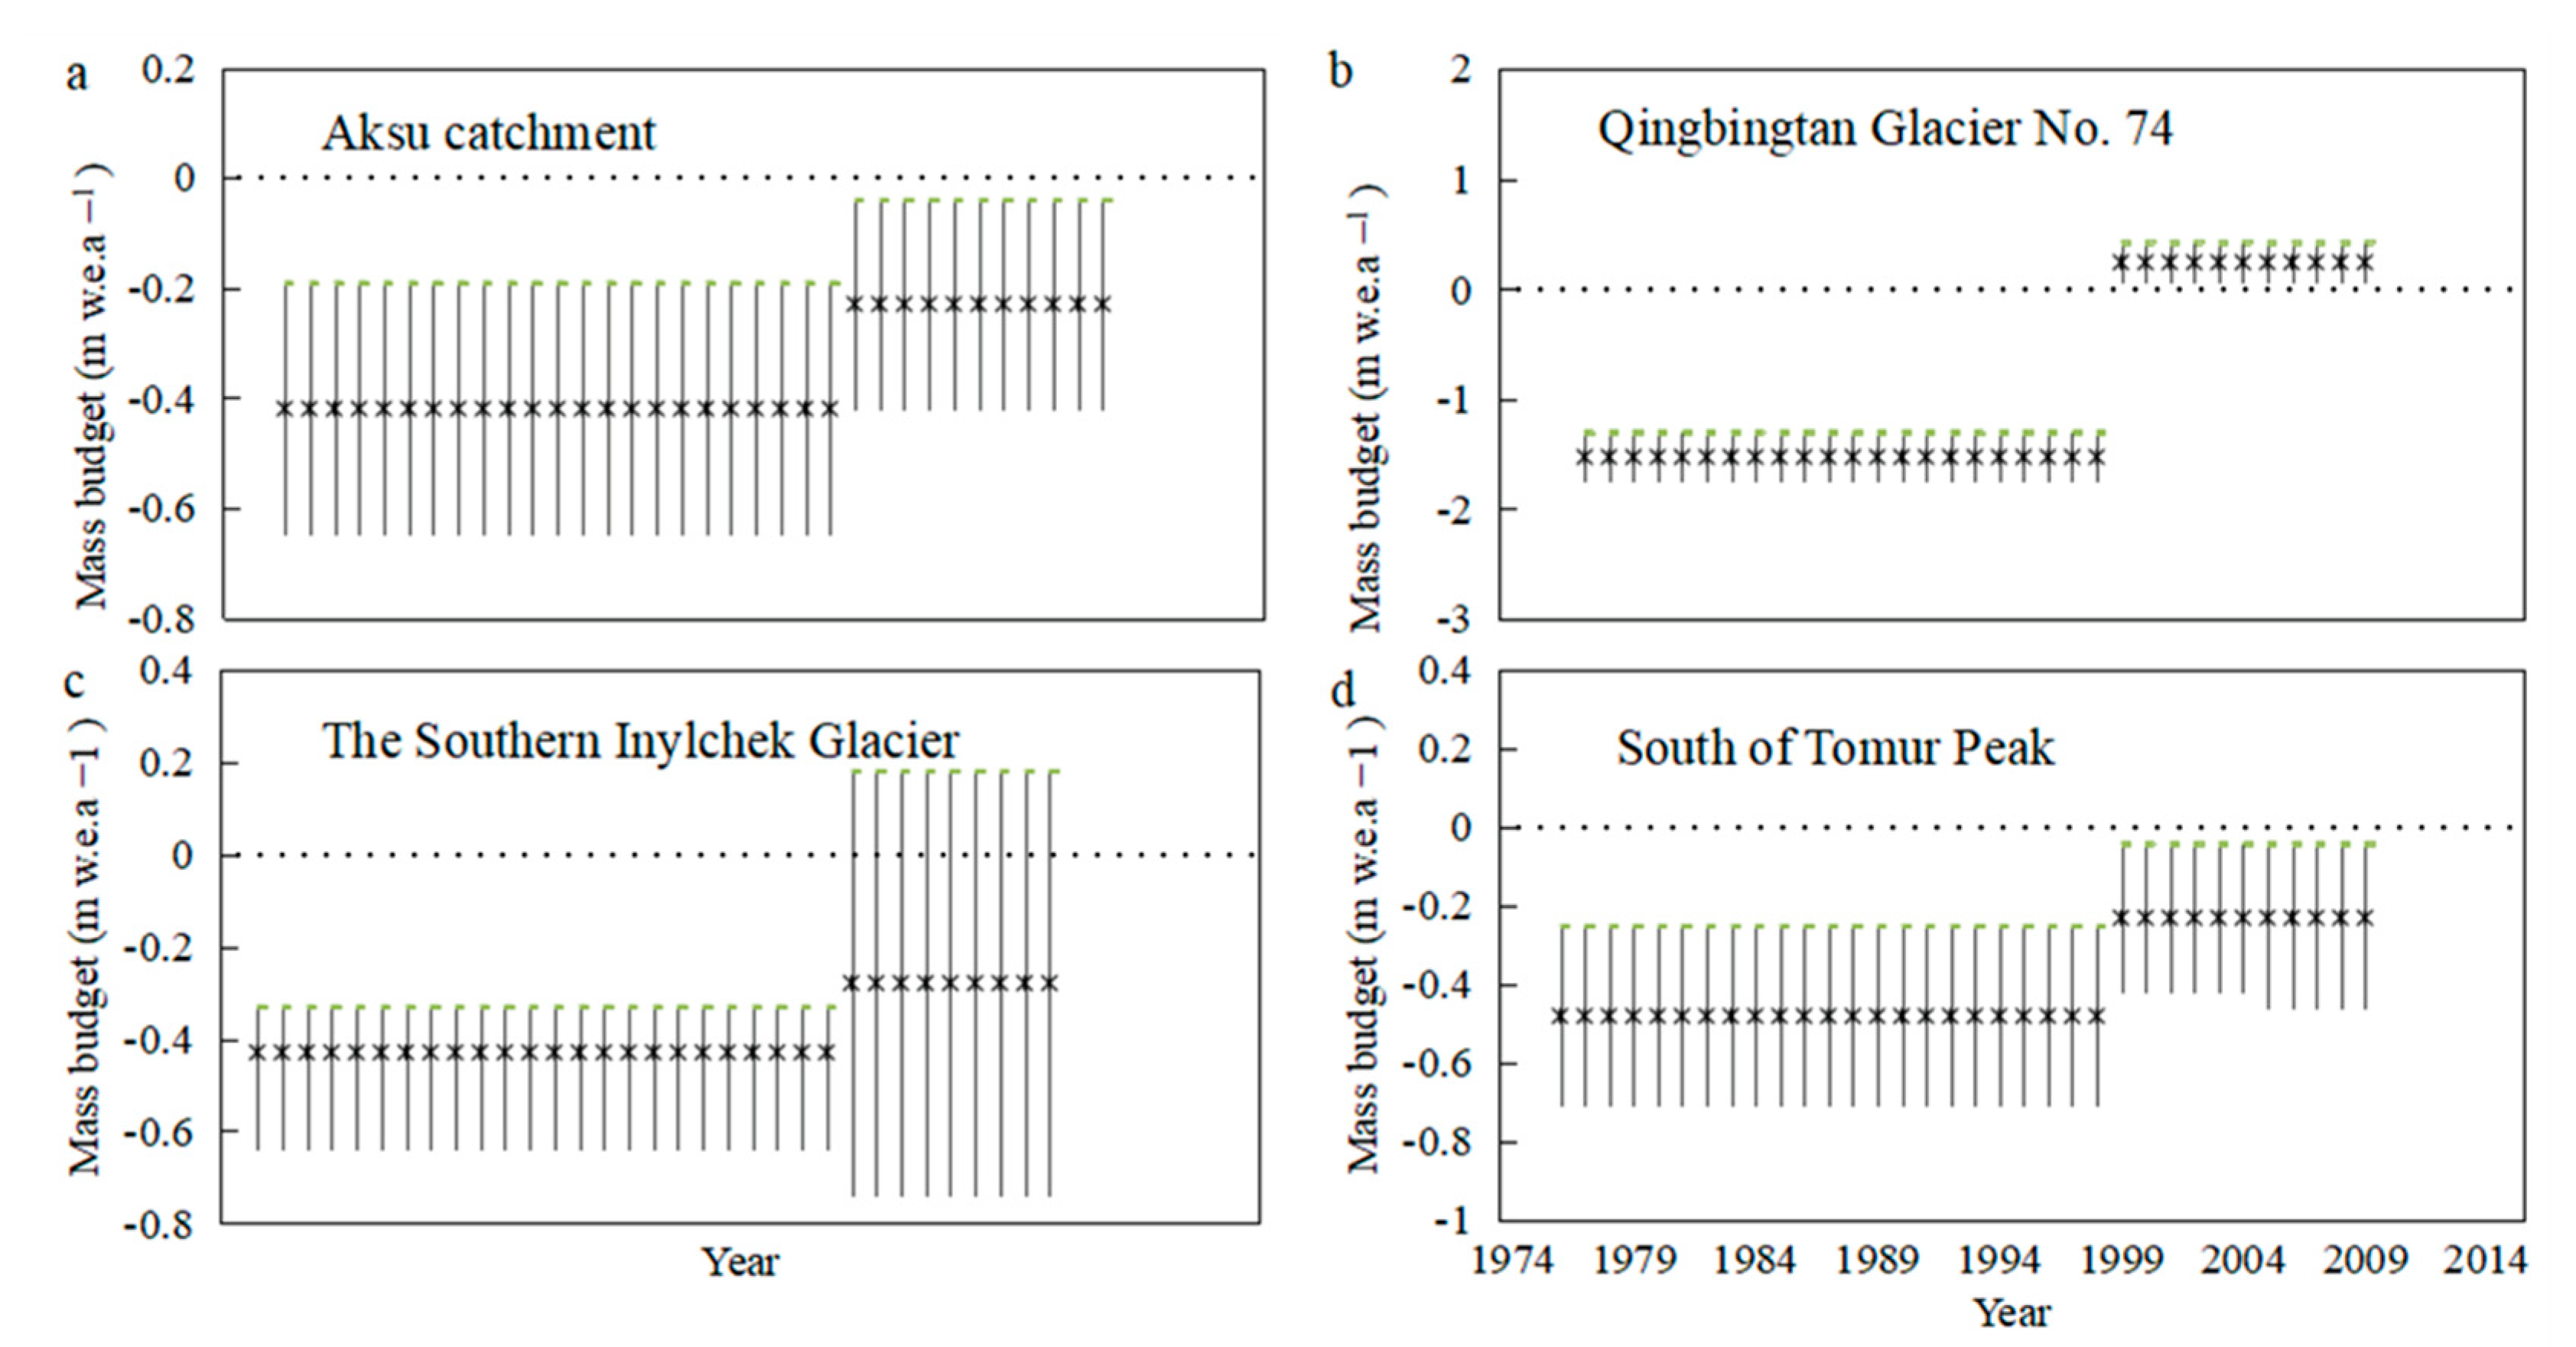
4.3. Relationship between Glacier Mass Balance and Runoff
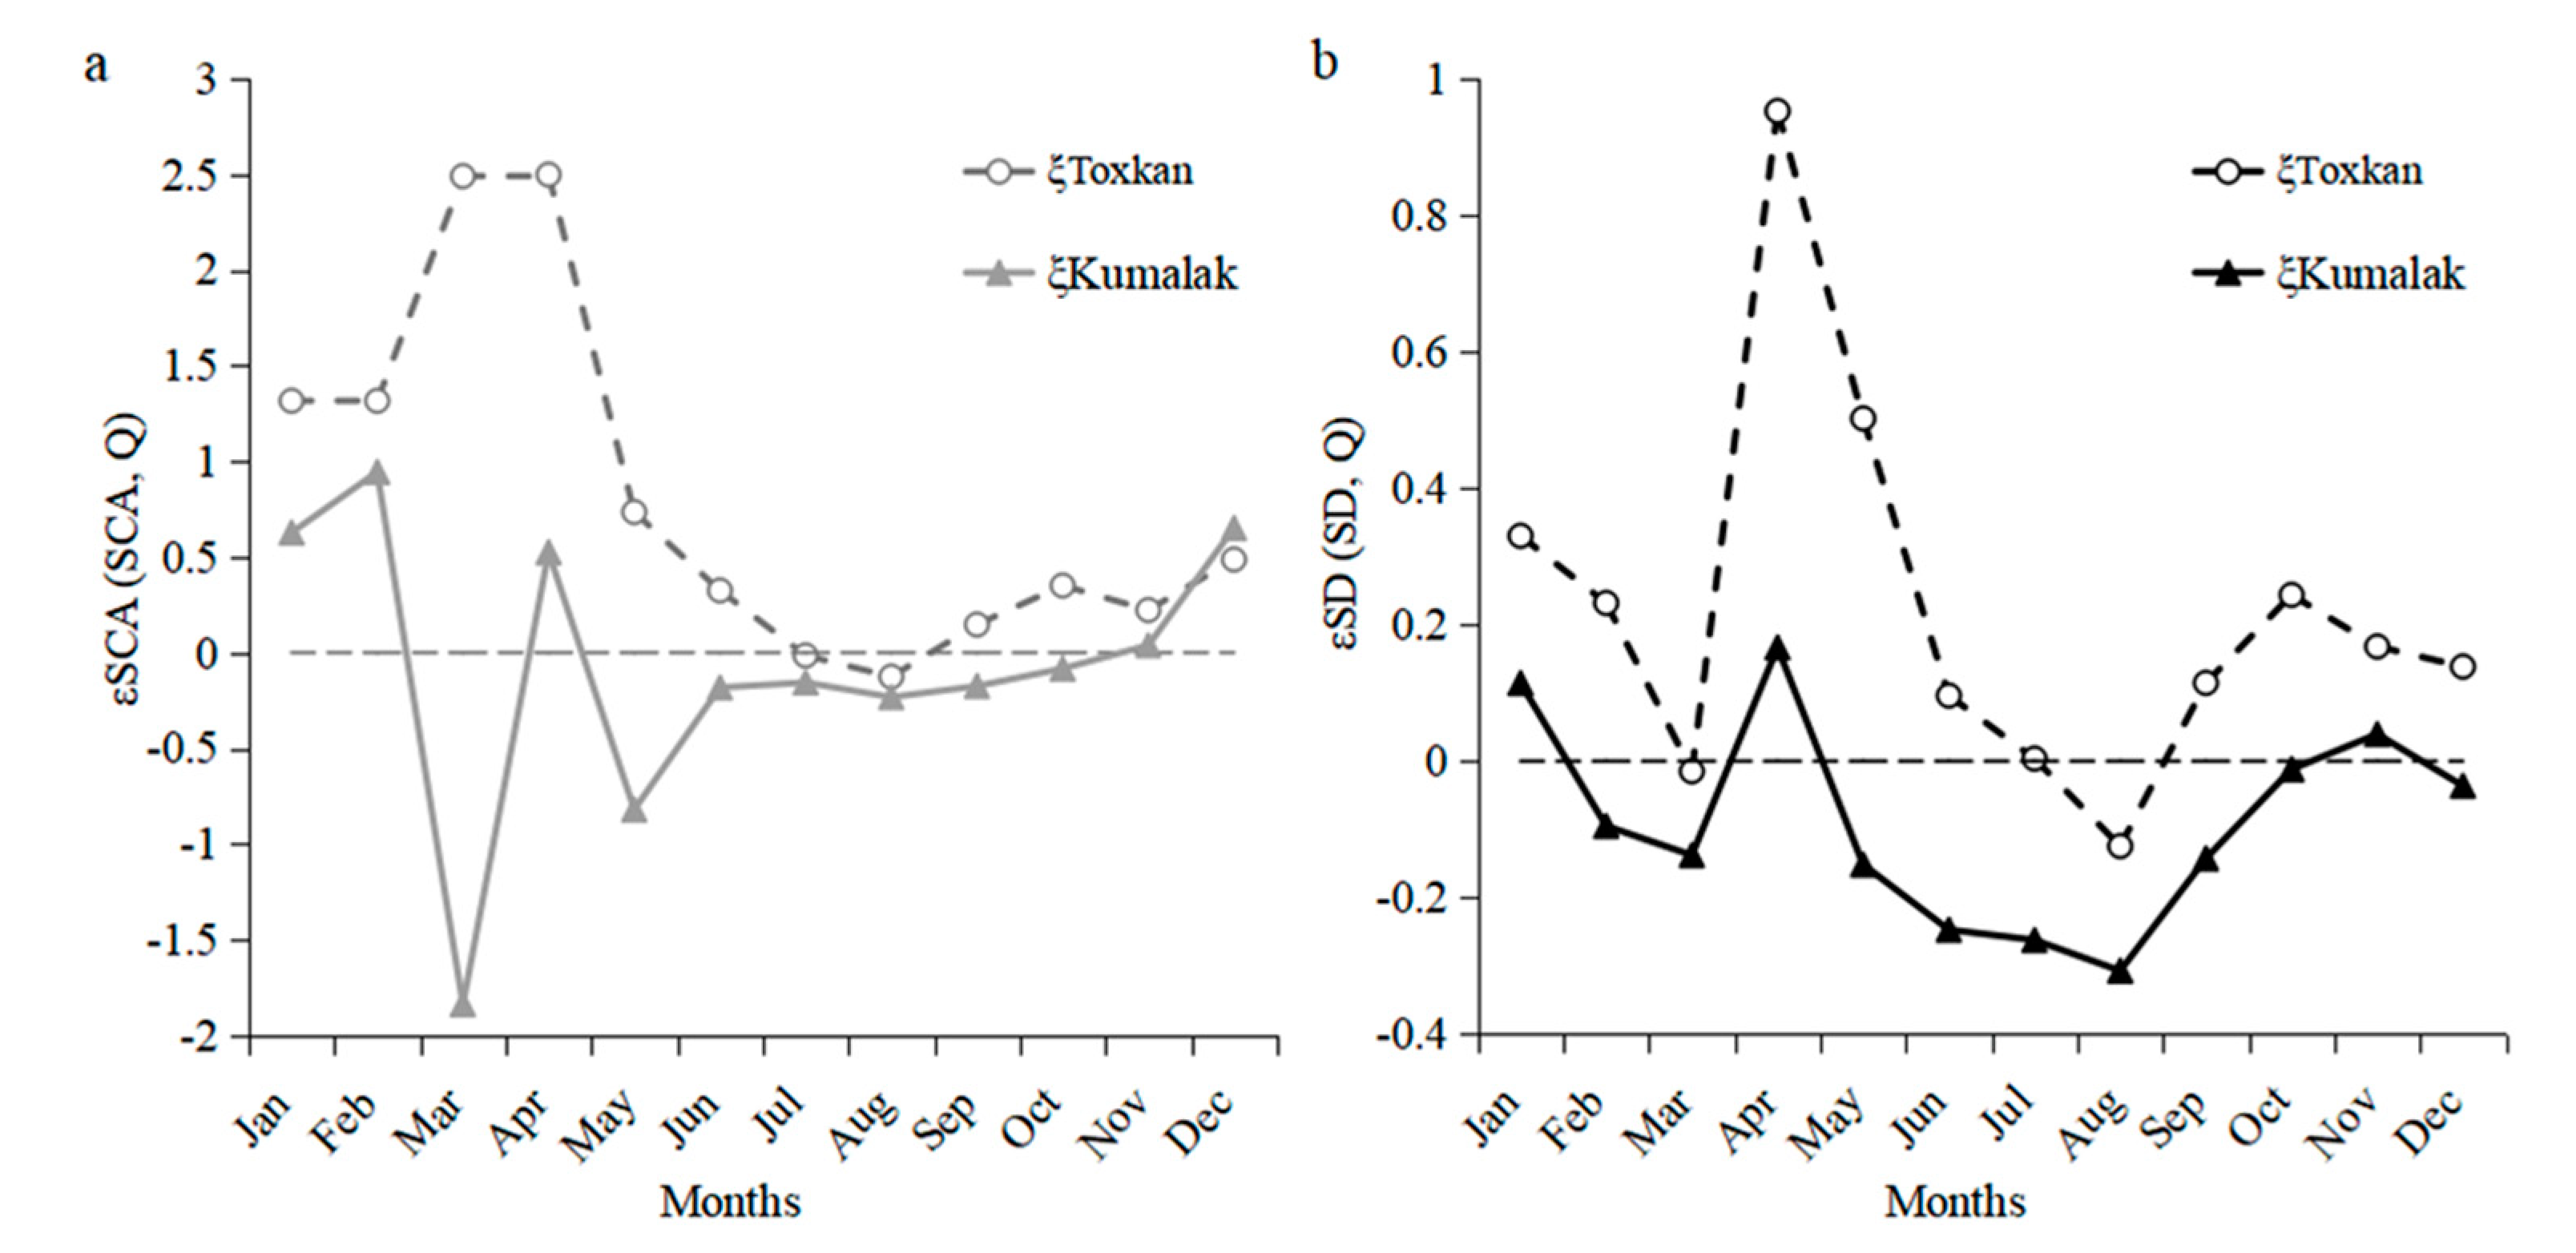
4.4. Relationship between Snow Cover Area, Snow Depth, and Runoff
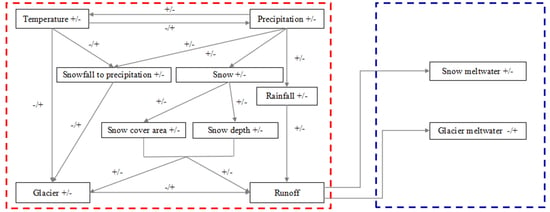
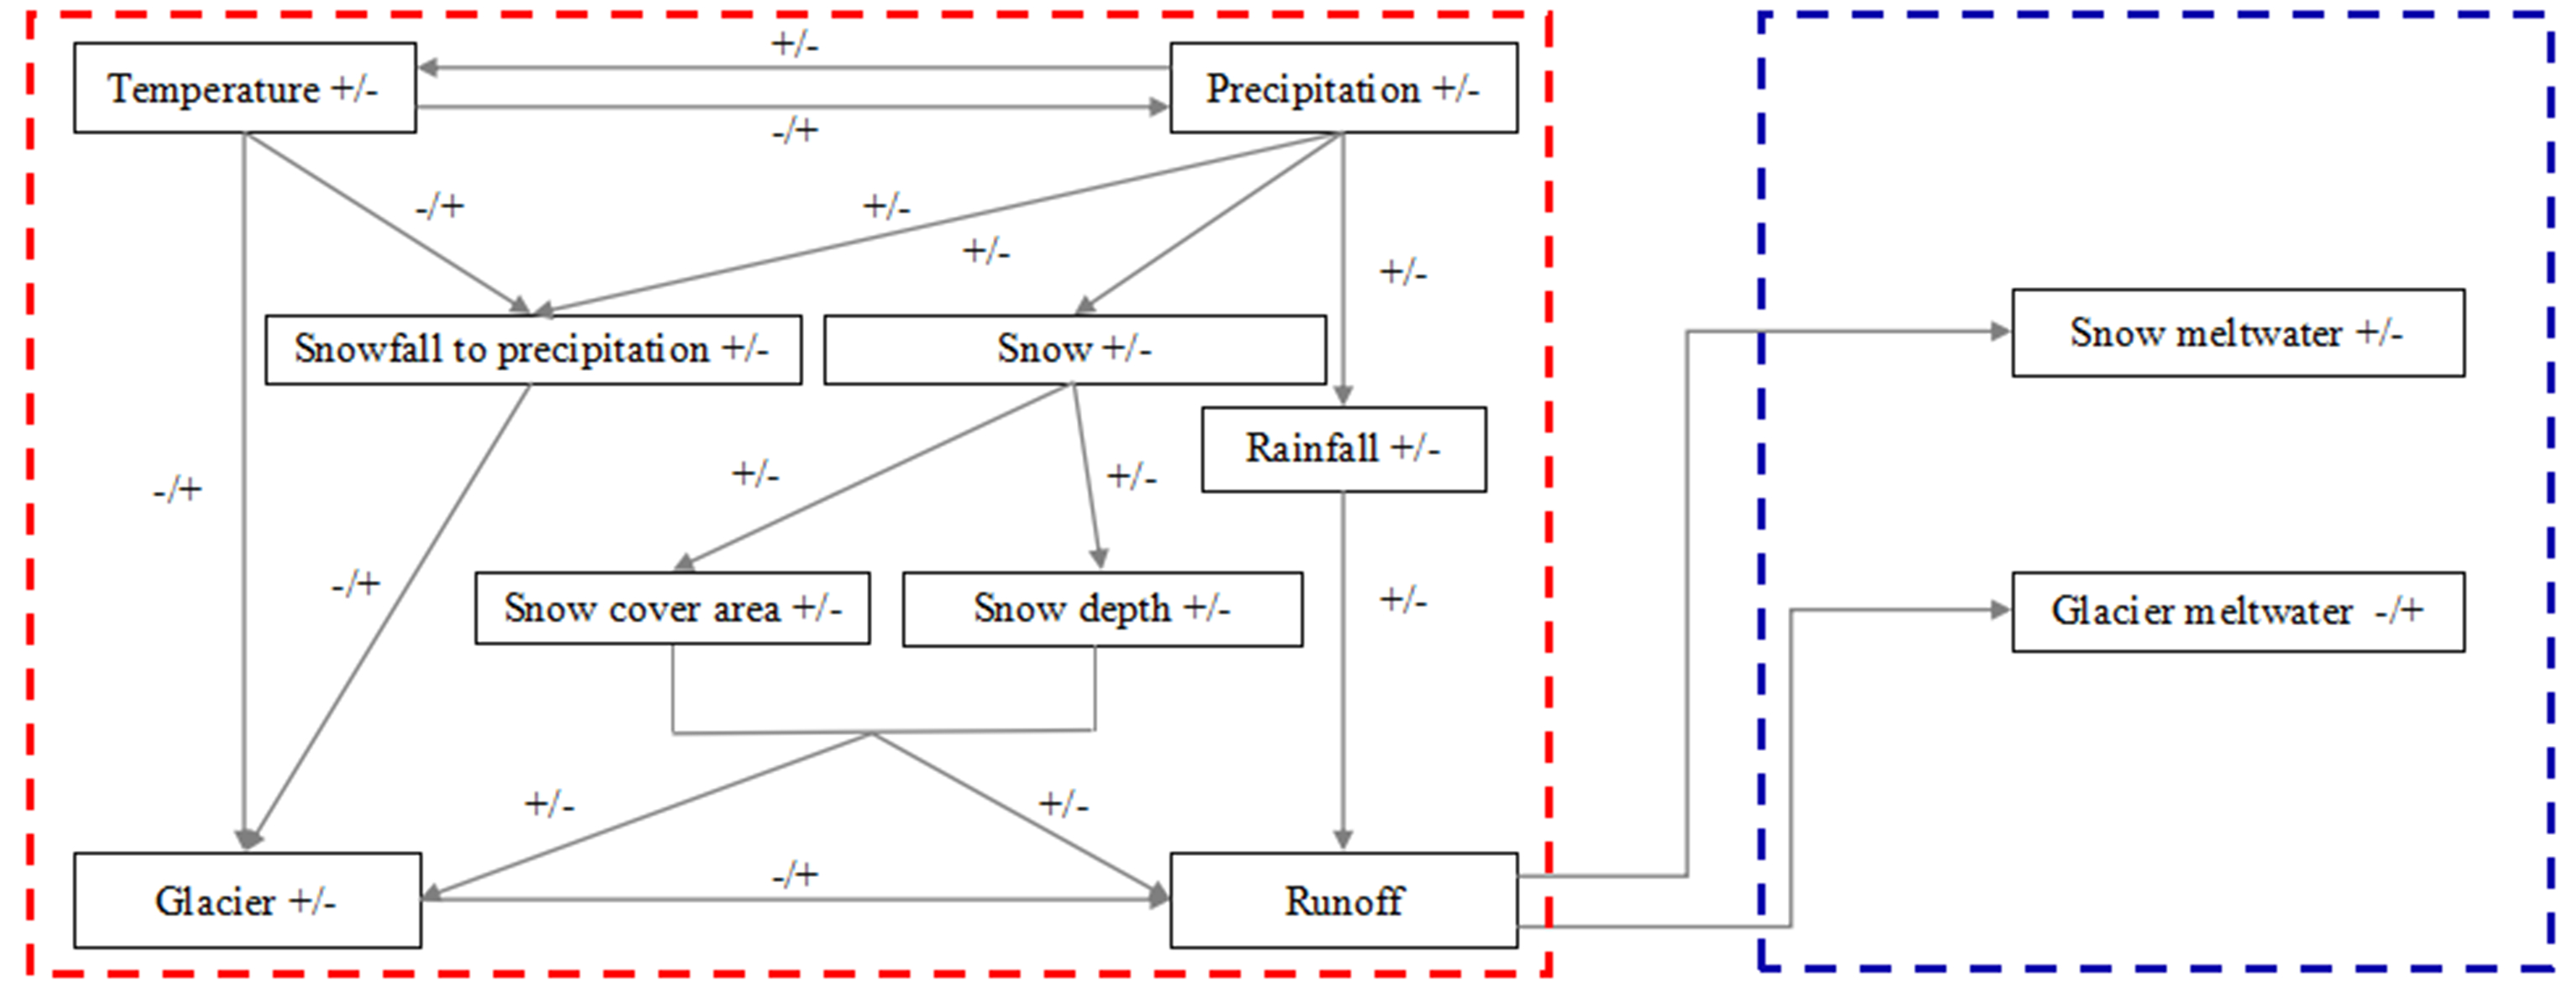
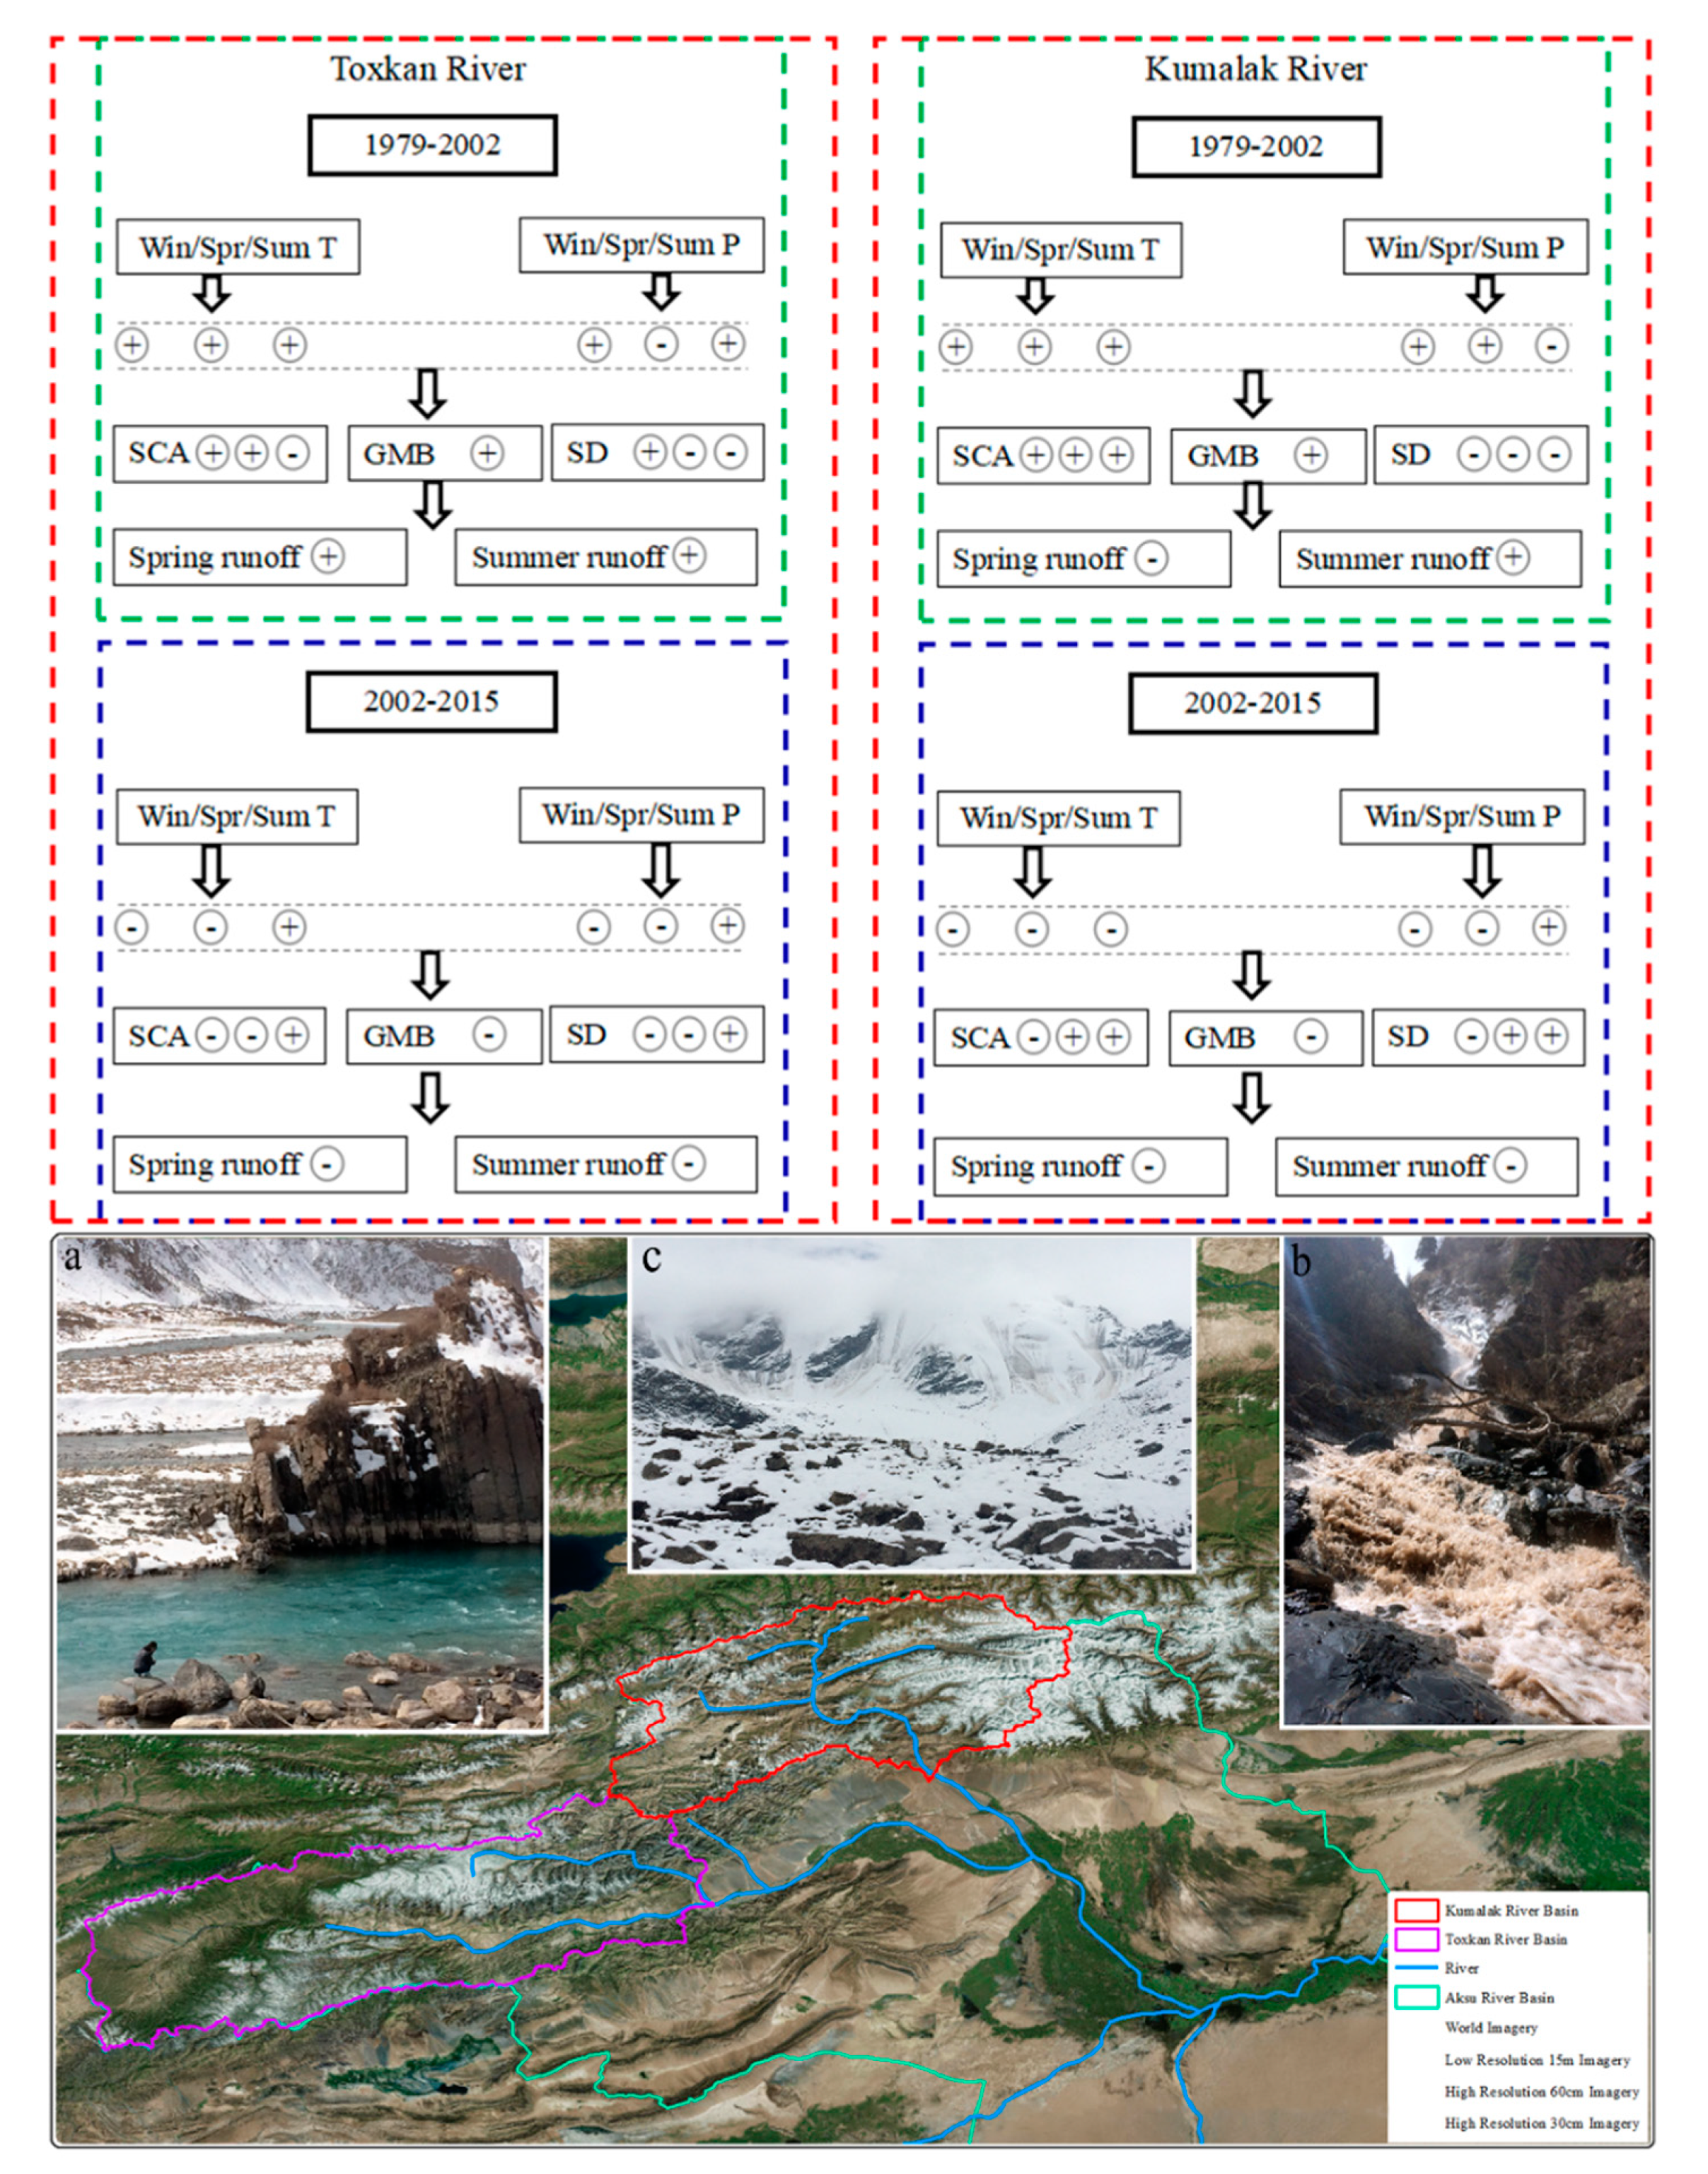
4.5. Mechanism Analysis
5. Discussion
6. Conclusions
Supplementary Materials
Author Contributions
Funding
Acknowledgments
Conflicts of Interest
References
- IPCC. Working Group I Contribution to the IPCC Fifth Assessment Report, Climate Change 2013: The Physical Science Basis: Summary for Policymakers; Cambridge University Press: Cambridge, UK, 2013. [Google Scholar]
- Pritchard, H.D. Asia’s shrinking glaciers protect large populations from drought stress. Nature 2019, 569, 649–654. [Google Scholar] [CrossRef] [PubMed]
- Gao, H.K.; Li, H.; Duan, Z.; Ren, Z.; Meng, X.Y.; Pan, X.C. Modelling glacier variation and its impact on water resource in the Urumqi Glacier No. 1 in Central Asia. Sci. Total Environ. 2018, 644, 1160–1170. [Google Scholar] [CrossRef] [PubMed]
- Karamouz, M.; Nazif, S.; Falahi, M. Hydrology and Hydroclimatology; CRC Press: Boca Raton, FL, USA, 2012. [Google Scholar]
- Ragettli, S.; Immerzeel, W.W.; Pellicciotti, F. Contrasting climate change impact on river flows from high-altitude catchments in the Himalayan and Andes Mountains. Proc. Natl. Acad. Sci. USA 2016, 113, 9222–9227. [Google Scholar] [CrossRef] [PubMed]
- Shen, Y.J.; Shen, Y.J.; Fink, M.; Kralisch, S.; Chen, Y.N.; Brenning, A. Trends and variability in streamflow and snowmelt runoff timing in the southern Tianshan Mountains. J. Hydrol. 2018, 557, 173–181. [Google Scholar] [CrossRef]
- Li, Y.; Tao, H.; Su, B.D.; Kundzewicz, Z.W.; Jiang, T. Impacts of 1.5 °C and 2 °C global warming on winter snow depth in Central Asia. Sci. Total Environ. 2019, 651, 2866–2873. [Google Scholar] [CrossRef]
- Sorg, A.; Bolch, T.; Stoffel, M.; Solomina, O.; Beniston, M. Climate change impacts on glaciers and runoff in Tien Shan (Central Asia). Nat. Clim. Chang. 2012, 2, 725–731. [Google Scholar] [CrossRef]
- Sorg, A.; Huss, M.; Rohrer, M.; Stoffel, M. The days of plenty might soon be over in glacierized Central Asian catchments. Environ. Res. Lett. 2014, 9, 104018. [Google Scholar] [CrossRef]
- Sun, M.P.; Li, Z.Q.; Yao, X.J.; Zhang, M.J.; Jin, S. Modeling the hydrological response to climate change in a glacierized high mountain region, northwest China. J. Glaciol. 2015, 61, 127–136. [Google Scholar] [CrossRef]
- Luo, Y.; Wang, X.L.; Piao, S.L.; Sun, L.; Ciais, P.; Zhang, Y.Q.; Ma, C.K.; Gan, R.; He, C.S. Contrasting streamflow regimes induced by melting glaciers across the Tien Shan-Pamir-North Karakoram. Sci. Rep. 2018, 8, 16470. [Google Scholar] [CrossRef]
- Li, B.F.; Chen, Y.N.; Chipman, J.W.; Shi, X.; Chen, Z.S. Why does the runoff in Hotan River show a slight decreased trend in northwestern China? Atmos. Sci. Lett. 2018, 19, e800. [Google Scholar] [CrossRef]
- Xu, M.; Wu, H.; Kang, S.C. Impacts of climate change on the discharge and glacier mass balance of the different glacierized watersheds in the Tianshan Mountains, Central Asia. Hydrol. Process. 2017, 32, 126–145. [Google Scholar] [CrossRef]
- Gan, R.; Luo, Y.; Zuo, Q.T.; Sun, L. Effects of projected climate change on the glacier and runoff generation in the Naryn River Basin, Central Asia. J. Hydrol. 2015, 523, 240–251. [Google Scholar] [CrossRef]
- Kaldybayev, A.; Chen, Y.N.; Vilesov, E. Glacier change in the Karatal river basin, Zhetysu (Dzhungar) Alatau, Kazakhstan. Ann. Glaciol. 2016, 57, 11–19. [Google Scholar] [CrossRef]
- Dahlke, H.E.; Lyon, S.W.; Stedinger, J.R.; Rosqvist, G.; Jansson, P. Contrasting trends in floods for two sub-arctic catchments in northern Sweden-does glacier presence matter? Hydrol. Earth Syst. Sci. 2012, 16, 2123–2141. [Google Scholar] [CrossRef]
- Maurya, A.S.; Rai, S.P.; Joshi, N.; Dutt, K.S.; Rai, N. Snowmelt runoff and groundwater discharge in Himalayan rivers: A case study of the Satluj River, NW India. Environ. Earth Sci. 2018, 77, 694. [Google Scholar] [CrossRef]
- Kääb, A.; Berthier, E.; Nuth, C.; Gardelle, J.; Arnaud, Y. Contrasting patterns of early twenty-first-century glacier mass change in the Himalayas. Nature 2012, 488, 495–498. [Google Scholar] [CrossRef]
- Sakai, A.; Fujita, K. Contrasting glacier responses to recent climate change in high-mountain Asia. Sci. Rep. 2017, 7, 13717. [Google Scholar] [CrossRef]
- Brown, M.E.; Racoviteanu, A.E.; Tarboton, D.G.; Gupta, A.S.; Nigro, J.; Policelli, F.; Habib, S.; Tokay, M.; Shrestha, M.S.; Bajracharya, S.; et al. An integrated modeling system for estimating glacier and snow melt driven streamflow from remote sensing and earth system data products in the Himalayas. J. Hydrol. 2014, 519, 1859–1869. [Google Scholar] [CrossRef]
- Bonekamp, P.N.J.; de Kok, R.J.; Collier, E.; Immerzeel, W.W. Contrasting Meteorological Drivers of the Glacier Mass Balance Between the Karakoram and Central Himalaya. Front. Earth Sci. 2019, 7, 107. [Google Scholar] [CrossRef]
- Hilton, I.; Schild, A.; Munasinghe, M.; Gyawali, D. Regional Cooperation at the Third Pole: The Himalayan-Tibetan Plateau and Climate Change. Asia Pac. J. 2009, 7, 1–7. [Google Scholar]
- Gyawali, D.; Thompson, M.; Verweij, M. Aid Technology and Development: The Lessons from Nepal; Earthscan-Routledge: London, UK, 2017. [Google Scholar]
- Fan, Y.T.; Chen, Y.N.; Li, W.H. Increasing precipitation and baseflow in Aksu River since the 1950s. Quatern. Int. 2014, 336, 26–34. [Google Scholar] [CrossRef]
- Luo, M.; Liu, T.; Meng, F.H.; Duan, Y.C.; Frankl, A. Identifying climate change impacts on water resources in Xinjiang, China. Hydrol. Sci. J. 2019, 676, 613–626. [Google Scholar] [CrossRef] [PubMed]
- Duethmann, D.; Bolch, T.; Farinotti, D.; Kriegel, D.; Vorogushyn, S.; Merz, B.; Pieczonka, T.; Jiang, T.; Su, B.; Güntner, A. Attribution of streamflow trends in snow and glacier melt-dominated catchments of the Tarim River, Central Asia. Water Resour. Res. 2015, 51, 4727–4750. [Google Scholar] [CrossRef]
- Tahir, A.A.; Chevallier, P.; Arnaud, Y.; Ahmad, B. Snow cover dynamics and hydrological regime of the Hunza River basin, Karakoram Range, Northern Pakistan. Hydrol. Earth Syst. Sci. 2011, 15, 2275–2290. [Google Scholar] [CrossRef]
- Dinar, S.; Katz, D.; de Stefano, L.; Blankespoor, B. Climate change, conflict, and cooperation: Global analysis of the effectiveness of international river treaties in addressing water variability. Political Geography. 2015, 45, 55–66. [Google Scholar] [CrossRef]
- Zeitoun, M.; Cascão, A.E.; Warner, J.; Mirumachi, N.; Matthews, N.; Menga, F.; Farnum, R. Transboundary water interaction III: Contest and compliance. Int. Environ. Agreem. Politics Law Econ. 2017, 17, 271–294. [Google Scholar] [CrossRef]
- Gleick, P.H. Water, Drought, Climate Change, and Conflict in Syria. Weather Clim. Soc. 2014, 6, 331–340. [Google Scholar] [CrossRef]
- Avisse, N.; Tilmant, A.; Rosenberg, D.; Talozi, S. Quantitative Assessment of Contested Water Uses and Management in the Conflict-Torn Yarmouk River Basin. J. Water Resour. Plan. Manag. 2020, 146, 05020010. [Google Scholar] [CrossRef]
- Cascão, A.E. Changing Power Relations in the Nile River Basin: Unilateralism vs. Cooperation? Water Altern. 2009, 2, 245–268. [Google Scholar]
- Hussein, H. Whose ‘reality’? Discourses and hydropolitics along the Yarmouk River. Contemp. Levant 2017, 2, 103–115. [Google Scholar] [CrossRef]
- Hussein, H.; Grandi, M. Dynamic political contexts and power asymmetries: The cases of the Blue Nile and the Yarmouk Rivers. Int. Environ. Agreem. Politics Law Econ. 2017, 17, 795–814. [Google Scholar] [CrossRef]
- Zeitoun, M.; Dajani, M.; Abdallah, C.; Khresat, S.E.; Elaydi, H. The Yarmouk tributary to the Jordan River II: Infrastructure impeding the transformation of equitable transboundary water arrangements. Water Altern. 2019, 12, 1095–1122. [Google Scholar]
- Zeitoun, M.; Abdallah, C.; Dajani, M.; Khresat, S.E.; Elaydi, H.; Alfarra, A. The Yarmouk tributary to the Jordan River I: Agreements impeding equitable and sustainable transboundary water arrangements. Water Altern. 2019, 12, 1064–1094. [Google Scholar]
- Hussein, H. Yarmouk, Jordan, and Disi basins: Examining the impact of the discourse of water scarcity in Jordan on transboundary water governance. Mediterr. Politics. 2018, 24, 269–289. [Google Scholar] [CrossRef]
- Talozi, S.; Altz-Stamm, A.; Hussein, H.; Reich, P. What constitutes an equitable water share A reassessment of equitable apportionment in the Jordan - Israel water agreement 25 years later. Water Policy 2019, 21, 911–933. [Google Scholar] [CrossRef]
- Cascão, A.E.; Nicol, A. GERD: New norms of cooperation in the Nile Basin? Water Int. 2016, 41, 550–573. [Google Scholar] [CrossRef]
- Yihdego, Z.; Rieu-Clarke, A.; Cascão, A.E. How has the Grand Ethiopian Renaissance Dam changed the legal, political, economic and scientific dynamics in the Nile Basin? Water Int. 2016, 41, 503–511. [Google Scholar] [CrossRef]
- Neal, M.J.; Patrick, F.G.; Connell, D.; Conrad, J. The Social-Environmental Justice of Groundwater Governance. Integrated Groundwater Management; Springer International Publishing: Cham, Switzerland, 2016. [Google Scholar]
- Hussein, H.; Menga, F.; Greco, F. Monitoring Transboundary Water Cooperation in SDG 6.5.2: How a Critical Hydropolitics Approach Can Spot Inequitable Outcomes. Sustainability 2018, 10, 3640. [Google Scholar] [CrossRef]
- Hussein, H. The Guarani Aquifer System, highly present but not high profile: A hydropolitical analysis of transboundary groundwater governance. Environ. Sci. Policy. 2018, 83, 54–62. [Google Scholar] [CrossRef]
- Da Silva, L.P.B.; Hussein, H. Production of scale in regional hydropolitics: An analysis of La Plata River Basin and the Guarani Aquifer System in South America. Geoforum 2019, 99, 42–53. [Google Scholar] [CrossRef]
- Daoudy, M. The Origins of the Syrian Conflict: Climate Change and Human Security; Cambridge University Press: Cambridge, UK, 2020. [Google Scholar]
- Selby, J.; Dahi, O.S.; Fröhlich, C.; Hulme, M. Climate change and the Syrian civil war revisited. Political Geogr. 2017, 60, 232–244. [Google Scholar] [CrossRef]
- Selby, J.; Dahi, O.; Fröhlich, C.; Hulme, M. Climate change and the Syrian civil war revisited: A rejoinder. Political Geogr. 2017, 60, 253–255. [Google Scholar] [CrossRef]
- Selby, J. Climate change and the Syrian civil war, Part II: The Jazira’s agrarian crisis. Geoforum 2019, 101, 260–274. [Google Scholar] [CrossRef]
- Fröhlich, C.J. Climate migrants as protestors? Dispelling misconceptions about global environmental change in pre-revolutionary Syria. Contemp. Levant 2016, 1, 38–50. [Google Scholar] [CrossRef]
- Hussein, H.; Natta, A.; Yehya, A.A.K.; Hamadna, B. Syrian Refugees, Water Scarcity, and Dynamic Policies: How Do the New Refugee Discourses Impact Water Governance Debates in Lebanon and Jordan? Water 2020, 12, 325. [Google Scholar] [CrossRef]
- Thevs, N.; Ovezmuradov, K.; Zanjani, L.V.; Zerbe, S. Water consumption of agriculture and natural ecosystems at the Amu Darya in Lebap Province, Turkmenistan. Environ. Earth Sci. 2015, 73, 731–741. [Google Scholar] [CrossRef]
- Menga, F. Building a nation through a dam: The case of Rogun in Tajikistan. Natl. Pap. 2015, 43, 479–494. [Google Scholar] [CrossRef]
- Conker, A. The power struggle in the layer of transnational hydropolitics: The case of the Ilisu dam project. Eurasian J. Soc. Sci. 2016, 4, 14–34. [Google Scholar] [CrossRef]
- Conker, A.; Hussein, H. Hydropolitics and issue-linkage along the Orontes River Basin: An analysis of the Lebanon-Syria and Syria-Turkey hydropolitical relations. Int. Environ. Agreem. Politics Law Econ. 2020, 20, 103–121. [Google Scholar] [CrossRef]
- Conker, A.; Hussein, H. Hydraulic Mission at Home, Hydraulic Mission abroad? Examining Turkey’s Regional ‘Pax-Aquarum’ and Its Limits. Sustainability 2019, 11, 228. [Google Scholar] [CrossRef]
- Conker, A. An Enhanced Notion of Power for Inter-State and Transnational Hydropolitics: An Analysis of Turkish-Syrian Water Relations and the Ilısu Dam Conflict between the Opponents and Proponents of the Dam; University of East Anglia: Norwich, UK, 2014. [Google Scholar]
- Yu, Y.; Pi, Y.Y.; Yu, X.; Ta, Z.J.; Sun, L.X.; Disse, M.; Zeng, F.J.; Li, Y.M.; Chen, X.; Yu, R.D. Climate change, water resources and sustainable development in the arid and semi-arid lands of Central Asia in the past 30 years. J. Arid Land 2019, 11, 1–14. [Google Scholar] [CrossRef]
- Karthe, D.; Karthe, D.; Chalov, S.; Chalov, S.; Borchardt, D.; Borchardt, D. Water resources and their management in central Asia in the early twenty first century: Status, challenges and future prospects. Environ. Earth Sci. 2015, 73, 487–499. [Google Scholar] [CrossRef]
- Chen, Y.N.; Li, Z.; Fang, G.H.; Li, W.H. Large Hydrological Processes Changes in the Transboundary Rivers of Central Asia. J. Geophys. Res. Atmos. 2018, 123, 5059–5069. [Google Scholar] [CrossRef]
- Chen, Y.N.; Li, W.H.; Deng, H.J.; Fang, G.H.; Li, Z. Changes in Central Asia’s Water Tower: Past, Present and Future. Sci. Rep. 2016, 6, 35458. [Google Scholar] [CrossRef] [PubMed]
- Hu, Z.Y.; Zhang, C.; Hu, Q.; Tian, H.Q. Temperature changes in Central Asia from 1979 to 2011 based on multiple datasets. J. Clim. 2014, 27, 1143–1167. [Google Scholar] [CrossRef]
- Unger-Shayesteh, K.; Vorogushyn, S.; Farinotti, D.; Gafurov, A.; Duethmann, D.; Mandychev, A.; Merz, B. What do we know about past changes in the water cycle of Central Asian headwaters? A review. Glob. Planet. Chang. 2013, 110, 4–25. [Google Scholar] [CrossRef]
- Marty, C.; Meister, R. Long-term snow and weather observations at Weissfluhjoch and its relation to other high-altitude observatories in the Alps. Theor. Appl. Clim. 2012, 110, 573–583. [Google Scholar] [CrossRef]
- Wang, W.; Huang, X.D.; Deng, J.; Xie, H.J.; Liang, T.G. Spatio-Temporal Change of Snow Cover and Its Response to Climate over the Tibetan Plateau Based on an Improved Daily Cloud-Free Snow Cover Product. Remote Sens. 2014, 7, 169–194. [Google Scholar] [CrossRef]
- Berghuijs, W.R.; Woods, R.A.; Hrachowitz, M. A precipitation shift from snow towards rain leads to a decrease in streamflow. Nat. Clim. Chang. 2014, 4, 583–586. [Google Scholar] [CrossRef]
- Chen, Y.N.; Li, Z.; Fang, G.H.; Deng, H.J. Impact of climate change on water resources in the Tianshan Mountians, CentralAsia. Acta Geogr. Sin. 2017, 72, 18–26. [Google Scholar]
- Clow, D.W. Changes in the Timing of Snowmelt and Streamflow in Colorado: A Response to Recent Warming. J. Clim. 2010, 23, 2293–2306. [Google Scholar] [CrossRef]
- Wang, P.Y.; Li, Z.Q.; Cao, M.; Li, H.L. Variation of Qingbingtan Glacier No.72 in Mt.Tuomuer Region during Past 45 Years. Acta Geogr. Sin. 2010, 30, 962–967. [Google Scholar]
- Chen, Y.N. Water Resources Research in Northwest China; Springer: Dordrecht, The Netherlands, 2014. [Google Scholar]
- Kriegel, D.; Mayer, C.; Hagg, W.; Vorogushyn, S.; Duethmann, D.; Gafurov, A.; Farinotti, D. Changes in glacierisation, climate and runoff in the second half of the 20th century in the Naryn basin, Central Asia. Glob. Planet. Chang. 2013, 110, 51–61. [Google Scholar] [CrossRef]
- Krysanova, V.; Wortmann, M.; Bolch, T.; Merz, B.; Duethmann, D.; Walter, J.; Huang, S.; Tong, J.; Buda, S.; Kundzewicz, Z.W. Analysis of current trends in climate parameters, river discharge and glaciers in the Aksu River basin (Central Asia). Hydrol. Sci. J. 2015, 60, 566–590. [Google Scholar] [CrossRef]
- Duishonakunov, M.; Imbery, S.; Narama, C.; Mohanty, A.; King, L. Recent glacier changes and their impact on water resources in Chon and Kichi Naryn Catchments, Kyrgyz Republic. Water Supply. 2014, 14, 444–452. [Google Scholar] [CrossRef]
- Kapitsa, V.; Shahgedanova, M.; Machguth, H.; Severskiy, I.; Medeu, A. Assessment of evolution and risks of glacier lake outbursts in the Djungarskiy Alatau, Central Asia, using Landsat imagery and glacier bed topography modelling. Nat. Hazard. Earth Sys. 2017, 17, 1837–1856. [Google Scholar] [CrossRef]
- Pan, B.T.; Zhang, G.L.; Wang, J.; Cao, B.; Geng, H.P.; Zhang, C.; Ji, Y.P. Glacier changes from 1966–2009 in the Gongga Mountains, on the south-eastern margin of the Qinghai-Tibetan Plateau and their climatic forcing. Cryosphere 2012, 6, 1087–1101. [Google Scholar] [CrossRef]
- Tao, C.; Dai, L.Y.; Zheng, X.M.; Li, X.F.; Zhao, K. Estimation of snow depth from passive microwave brightness temperature data in forest regions of northeast China. Remote Sens. Environ. 2016, 183, 334–349. [Google Scholar]
- Pieczonka, T.; Bolch, T.; Wei, J.F.; Liu, S.Y. Heterogeneous mass loss of glaciers in the Aksu-Tarim Catchment (Central Tien Shan) revealed by 1976 KH-9 Hexagon and 2009 SPOT-5 stereo imagery. Remote Sens. Environ. 2013, 130, 233–244. [Google Scholar] [CrossRef]
- Li, B.F.; Chen, Y.N.; Chen, Z.S.; Li, W.H. Trends in runoff versus climate change in typical rivers in the arid region of northwest China. Quatern. Int. 2012, 282, 87–95. [Google Scholar] [CrossRef]
- Deng, H.J.; Chen, Y.N. Influences of recent climate change and human activities on water storage variations in Central Asia. J. Hydrol. 2017, 544, 46–57. [Google Scholar] [CrossRef]
- Zhang, Q.F.; Chen, Y.N.; Li, Z.; Li, Y.P.; Xiang, Y.Y.; Bian, W. Glacier changes from 1975 to 2016 in the Aksu River Basin, Central Tianshan Mountains. J. Geogr. Sci. 2019, 29, 984–1000. [Google Scholar] [CrossRef]
- Fu, L.X.; Chen, Y.N.; Li, W.H.; He, B.; Xu, C.C. Relation between Climate Change and Runoff Volume in the Headwaters of the Tarim River during the Last 50 Years. J. Desert Res. 2010, 30, 204–209. [Google Scholar]
- Chen, H.Y.; Chen, Y.N.; Li, W.H.; Li, Z. Quantifying the contributions of snow/glacier meltwater to river runoff in the Tianshan Mountains, Central Asia. Glob. Planet. Chang. 2019, 174, 47–57. [Google Scholar] [CrossRef]
- Zhao, Q.D.; Ye, B.S.; Ding, Y.J.; Zhang, S.Q.; Yi, S.H.; Wang, J.; Shangguan, D.H.; Zhao, C.C.; Han, H.D. Coupling a glacier melt model to the Variable Infiltration Capacity (VIC) model for hydrological modeling in north-western China. Environ. Earth Sci. 2013, 68, 87–101. [Google Scholar] [CrossRef]
- Fang, G.H.; Yang, J.; Chen, Y.N.; Li, Z.; Ji, H.P.; Maeyer de, P. How Hydrologic Processes Differ patially in a Large Basin: Multisite and Multiobjective Modeling in the Tarim River Basin. J. Geophys. Res. Atmos. 2018, 123, 7098–7113. [Google Scholar]
- Zhao, Q.D.; Zhang, S.Q.; Ding, Y.J.; Wang, J.; Han, H.D.; Xu, J.; Zhao, C.C.; Guo, W.Q.; Shangguan, D.H. Modeling Hydrologic Response to Climate Change and Shrinking Glaciers in the Highly Glacierized Kunma Like River Catchment, Central Tian Shan. J. Hydrometeorol. 2015, 16, 2383–2402. [Google Scholar] [CrossRef]
- Yang, T.; Li, Q.; Ahmad, S.; Zhou, H.F.; Li, L.H. Changes in Snow Phenology from 1979 to 2016 over the Tianshan Mountains, Central Asia. Remote Sens. 2019, 11, 499. [Google Scholar] [CrossRef]
- Shen, Y.P.; Xie, Z.C.; Ding, L.F.; Liu, J.S. Estimation of average mass balance for glacier in a watershed and its application. Sci. Cold Arid Reg. 1997, 19, 302–307. [Google Scholar]
- Dai, L.Y.; Che, T.; Ding, Y.J. Inter-Calibrating SMMR, SSM/I and SSMI/S Data to Improve the Consistency of Snow-Depth Products in China. Remote Sens. 2015, 7, 7212–7230. [Google Scholar] [CrossRef]
- Che, T.; Li, X.; Jin, R.; Armstrong, R.; Zhang, T. Snow depth derived from passive microwave remote-sensing data in China. Ann. Glaciol. 2008, 49, 145–154. [Google Scholar] [CrossRef]
- Che, T.; LI, X. Retrieval of Snow Depth in China by Passive Microwave Remote Sensing Data and Its Accuracy Assessment. Remote Sens. Technol. Appl. 2004, 19, 301–306. [Google Scholar]
- Liu, X.J.; Chen, R.S.; Liu, J.F.; Wang, X.Q.; Zhang, B.G.; Han, C.T.; Liu, G.H.; Guo, S.H.; Liu, Z.W.; Song, Y.X. Effects of snow-depth change on spring runoff in cryosphere areas of China. Hydrol. Sci. J. 2019, 64, 789–797. [Google Scholar] [CrossRef]
- Hall, D.K.; Riggs, G.A. Accuracy assessment of the MODIS snow products. Hydrol. Process 2007, 21, 1534–1547. [Google Scholar] [CrossRef]
- Mann, H.B. Nonparametric tests against trend. Econometrica 1945, 13, 245–259. [Google Scholar] [CrossRef]
- Kendall, M.G. Rank Correlation Methods; Springer: Boston, MA, USA, 1975. [Google Scholar]
- Ke, C.Q.; Li, X.C.; Xie, H.J.; Liu, X.; Kou, C. Variability in snow cover phenology in China from 1952 to 2010. Hydrol. Earth Syst. Sci. 2016, 20, 755–770. [Google Scholar] [CrossRef]
- Chen, Z.S.; Chen, Y.; Li, W.H. Response of runoff to change of atmospheric 0 °C level height in summer in arid region of Northwest China. Sci. China Earth Sci. 2012, 55, 1533–1544. [Google Scholar] [CrossRef]
- Zheng, H.X.; Zhang, L.; Zhu, R.R.; Liu, C.M.; Sato, Y.; Fukushima, Y. Responses of streamflow to climate and land surface change in the headwaters of the Yellow River Basin. Water Resour. Res. 2009, 45. [Google Scholar] [CrossRef]
- Kour, R.; Patel, N.; Krishna, A.P. Assessment of temporal dynamics of snow cover and its validation with hydro-meteorological data in parts of Chenab Basin, western Himalayas. Sci. China Earth Sci. 2016, 59, 1081–1094. [Google Scholar] [CrossRef]
- Li, Z.X.; Yuan, R.F.; Feng, Q.; Zhang, B.J.; Lv, Y.M.; Li, Y.G.; Wei, W.; Chen, W.; Ning, T.T.; Gui, J.; et al. Climate background, relative rate, and runoff effect of multiphase water transformation in Qilian Mountains, the third pole region. Sci. Total Environ. 2019, 663, 315–328. [Google Scholar] [CrossRef]
- Kutuzov, S.; Shahgedanova, M. Glacier retreat and climatic variability in the eastern Terskey–Alatoo, inner Tien Shan between the middle of the 19th century and beginning of the 21st century. Glob. Planet. Chang. 2009, 69, 59–70. [Google Scholar] [CrossRef]
- Osmonov, A.; Bolch, T.; Xi, C.; Kurban, A.; Guo, W. Glacier characteristics and changes in the Sary-Jaz River Basin (Central Tien Shan, Kyrgyzstan)-1990–2010. Remote Sens. Lett. 2013, 4, 725–734. [Google Scholar] [CrossRef]
- Krasting, J.P.; Broccoli, A.J.; Dixon, K.W.; Lanzante, J.R. Future Changes in Northern Hemisphere Snowfall. J. Clim. 2013, 26, 7813–7828. [Google Scholar] [CrossRef]
- Liu, S.Y. Field Observations in Glaciological Research; Science Press: Beijing, China, 2012. [Google Scholar]
- Kang, S.C.; Chen, F.; Gao, T.G.; Zhang, Y.J. Early onset of rainy season suppresses glacier melt: A case study on Zhadang glacier, Tibetan Plateau. J. Glaciol. 2009, 55, 755–758. [Google Scholar] [CrossRef][Green Version]
- Wang, L.; Li, Z.Q.; Wang, F.T.; Li, H.L.; Wang, P.Y. Glacier changes from 1964 to 2004 in the Jinghe River basin, Tien Shan. Cold Reg. Sci. Technol. 2014, 102, 78–83. [Google Scholar] [CrossRef]
- Yao, T.D.; Thompson, L.; Yang, W.; Yu, W.S.; Gao, Y.; Guo, X.J.; Yang, X.X.; Duan, K.Q.; Zhao, H.B.; Xu, B.Q. Different glacier status with atmospheric circulations in Tibetan Plateau and surroundings. Nat. Clim. Chang. 2012, 2, 663–667. [Google Scholar] [CrossRef]
- Wang, C.; Xu, J.H.; Chen, Y.N.; Bai, L.; Chen, Z.S. A hybrid model to assess the impact of climate variability on streamflow for an ungauged mountainous basin. Clim. Dynam. 2018, 50, 2829–2844. [Google Scholar] [CrossRef]
- Shangguan, D.H.; Bolch, T.; Ding, Y.J.; Kröhnert, M.; Pieczonka, T.; Wetzel, H.U.; Liu, S.Y. Mass changes of Southern and Northern Inylchek Glacier, Central Tian Shan, Kyrgyzstan, during~1975 and 2007 derived from remote sensing data. Cryosphere 2015, 9, 703–717. [Google Scholar] [CrossRef]
- Tăut, I.; Șimonca, V.; Badea, O.; Moldovan, M. The Favorable Climatic Regime in Triggering the Decline of Oak Stands. ProEnviron. Promediu 2015, 8, 583–589. [Google Scholar]
- Kaldybayev, A.; Chen, Y.; Issanova, G.; Wang, H.; Mahmudova, L. Runoff response to the glacier shrinkage in the Karatal river basin, Kazakhstan. Arab. J. Geosci. 2016, 9, 1–8. [Google Scholar] [CrossRef]
- Xing, W.C.; Li, Z.Q.; Zhang, H.; Zhang, M.J.; Liang, P.B.; Mu, J.X. Spatial-temporal variation of glacier resources in Chinese Tianshan Mountains since 1959. Acta Geogr. Sin. 2017, 72, 1594–1605. [Google Scholar]
- Wang, J.; Li, H.; Hao, X. Responses of snowmelt runoff to climatic change in an inland river basin, Northwestern China, over the past 50 years. Hydrol. Earth Syst. Sci. 2010, 14, 1979–1987. [Google Scholar] [CrossRef]
- Wang, P.Y.; Li, Z.Q.; Wang, W.B.; Li, H.L.; Zhou, P.; Jin, S. Changes of six selected glaciers in the Tomor region, Tian Shan, Central Asia, over the past 50 years, using high-resolution remote sensing images and field surveying. Quatern. Int. 2013, 311, 123–131. [Google Scholar]
- Mavlyudov, B.R. Inylchek Glacier and the Merzbacher Lake: Situation in 1997. Data Glaciol. Study 1999, 86, 142–148. [Google Scholar]
- Pieczonka, T.; Bolch, T. Region-wide glacier mass budgets and area changes for the Central Tien Shan between~1975 and 1999 using Hexagon KH-9 imagery. Glob. Planet. Chang. 2015, 128, 1–13. [Google Scholar] [CrossRef]


| Catchments | Area (104 km2) | Glacier Area Proportion (%) | Average Altitude (m a.s.l.) | Annual Mean Runoff (108 m3) | SDR (108 m3) | CV (-) |
|---|---|---|---|---|---|---|
| Toxkan | 1.84 | 3.66 | 3567 | 29.19 | 5.93 | 0.20 |
| Kumalak | 1.28 | 16.34 | 3730 | 50.70 | 7.23 | 0.14 |
| Datasets | Name | Spatial Resolution | Temporal Resolution | Periods | Sources |
|---|---|---|---|---|---|
| a. Observed meteorological data | Chinese stations | - | Daily | 1979–2015 | http://data.cma.cn/en |
| b. Gridded data | ERA-Interim temperature | 0.25° | Monthly | 1979–2015 | https://apps.ecmwf.int/datasets/ |
| GPCC precipitation | 0.25° | Monthly | 1979–2015 | https://www.dwd.de/EN/ourservices/gpcc/gpcc.html | |
| c. Upper-air station | Kuqa station | - | 12-h | 1979–2015 | http://www.weather.uwyo.edu/upperair/sounding.html |
| d. Stream data | Toxkan/Kumalak River | - | Monthly | 1979–2015 | Aksu River Management Bureau |
| e. Snow depth | LSDPC | 0.25° | Daily | 1979–2015 | http://westdc.westgis.ac.cn |
| f. Snow cover area | MODIS10A2 | 500 m | 8-day | 2002–2015 | https://nsidc.org/data/MOD10A2 |
| g. Topography | ASTER DEM | 30 m | - | 2009 | http://www.gscloud.cn |
| Period | River | Spring | Summer | Autumn | Winter | Annual |
|---|---|---|---|---|---|---|
| a. Runoff | ||||||
| 1979–2002 | FSC/AC (%) | |||||
| Toxkan River | 16.52 | 53.15 | 21.32 | 9.01 | 100 | |
| Kumalak River | −1.60 | 79.13 | 18.80 | 3.67 | 100 | |
| 2002–2015 | FSC/AC (%) | |||||
| Toxkan River | −58.57 | −39.21 | 0.87 | −3.09 | −100 | |
| Kumalak River | −2.67 | −81.96 | −13.14 | −2.23 | −100 | |
| b. Temperature | ||||||
| 1979–2002 | FSC/AC (%) | |||||
| Toxkan River | 21.38 | 19.95 | 29.68 | 28.99 | 100 | |
| Kumalak River | 21.48 | 24.04 | 26.00 | 28.48 | 100 | |
| 2002–2015 | FSC/AC (%) | |||||
| Toxkan River | −11.34 | 0.80 | −32.94 | −56.52 | −100 | |
| Kumalak River | −0.45 | 0.90 | −52.77 | −47.68 | −100 | |
| c. Precipitation | ||||||
| 1979–2002 | FSC/AC (%) | |||||
| Toxkan River | −7.63 | 54.75 | 57.66 | −4.78 | 100 | |
| Kumalak River | 8.80 | −184.46 | 183.94 | 91.72 | 100 | |
| 2002–2015 | FSC/AC (%) | |||||
| Toxkan River | −561.83 | 476.57 | 37.52 | −52.26 | −100 | |
| Kumalak River | −164.75 | 135.13 | −49.11 | −21.27 | −100 | |
| d. SCA (%) | ||||||
| 1979–2002 | FSC/AC (%) | |||||
| Toxkan River | 290.51 | −344.30 | −697.26 | 651.05 | −100 | |
| Kumalak River | 45.81 | 84.80 | −43.24 | 12.63 | 100 | |
| 2002–2015 | FSC/AC (%) | |||||
| Toxkan River | −50.85 | 32.11 | 43.68 | −124.94 | −100 | |
| Kumalak River | 0.44 | 56.87 | 47.58 | −4.90 | 100 | |
| e. SD | ||||||
| 1979–2002 | FSC/AC (%) | |||||
| Toxkan River | −14.61 | −78.90 | −19.16 | 212.67 | 100 | |
| Kumalak River | −33.27 | −7.98 | −33.75 | −25.00 | −100 | |
| 2002–2015 | FSC/AC (%) | |||||
| Toxkan River | −53.09 | 15.51 | 42.92 | −105.32 | −100 | |
| Kumalak River | 3.27 | 90.05 | 82.33 | −75.65 | 100 |
| Spring Runoff | Summer Runoff | |||
|---|---|---|---|---|
| Toxkan River | Kumalak River | Toxkan River | Kumalak River | |
| Winter SCA | 0.45 ** | 0.06 | ||
| Winter SD | 0.36 * | 0.22 | ||
| Spring SCA | 0.47 ** | −0.20 | ||
| Spring SD | 0.41 * | 0.04 | ||
| Summer SCA | 0.10 | −0.33 * | ||
| Summer SD | 0.09 | −0.54 ** | ||
| Code | Elevation | Aksu River Catchment | Kumalak River Catchment | Toxkon River Catchment | ||||
|---|---|---|---|---|---|---|---|---|
| Range (m) | Year | Year | Spring | Summer | Year | Spring | Summer | |
| 1 | −2000 | ↓ | ↓ | ↓ | ↓ | ↓ | ↓ | ↓ |
| 2 | 2000–2500 | ↓ | ↓ | ↓ | ↓ | ↓ | ↓ | ↓ |
| 3 | 2500–3000 | ↑ | ↓ | ↓ | ↓ | ↓ | ↓ | ↓ |
| 4 | 3000−3500 | ↓ | ↓ | ↓ | ↓ | ↓ | ↓ | ↓ |
| 5 | 3500−4000 | ↓ | ↓ | ↓ | ↑ | ↓ | ↓ | ↓ |
| 6 | 4000−4500 | ↑ | ↑ | ↓ | ↑ | ↑ | ↑ | ↑ |
| 7 | 4500−5000 | ↑ | ↑ | ↑ | ↓ | ↑ | ↑ | ↑ |
| 8 | 5000−5500 | ↑ | ↑ | ↑ | ↓ | ↑ | ↑ | ↑ |
| 9 | 5500−6000 | ↑ | ↑ | ↑ | ↓ | ↑ | ↑ | ↑ |
| 10 | 6000−6500 | ↑ | ↑ | ↓ | ↓ | |||
| 11 | 6500−7000 | ↑ | ↑ | ↓ | ↓ | |||
| 12 | 7000−7500 | ↑ | ↑ | ↓ | ↓ | |||
© 2020 by the authors. Licensee MDPI, Basel, Switzerland. This article is an open access article distributed under the terms and conditions of the Creative Commons Attribution (CC BY) license (http://creativecommons.org/licenses/by/4.0/).
Share and Cite
Zhang, Q.; Chen, Y.; Li, Z.; Fang, G.; Xiang, Y.; Li, Y.; Ji, H. Recent Changes in Water Discharge in Snow and Glacier Melt-Dominated Rivers in the Tienshan Mountains, Central Asia. Remote Sens. 2020, 12, 2704. https://doi.org/10.3390/rs12172704
Zhang Q, Chen Y, Li Z, Fang G, Xiang Y, Li Y, Ji H. Recent Changes in Water Discharge in Snow and Glacier Melt-Dominated Rivers in the Tienshan Mountains, Central Asia. Remote Sensing. 2020; 12(17):2704. https://doi.org/10.3390/rs12172704
Chicago/Turabian StyleZhang, Qifei, Yaning Chen, Zhi Li, Gonghuan Fang, Yanyun Xiang, Yupeng Li, and Huiping Ji. 2020. "Recent Changes in Water Discharge in Snow and Glacier Melt-Dominated Rivers in the Tienshan Mountains, Central Asia" Remote Sensing 12, no. 17: 2704. https://doi.org/10.3390/rs12172704
APA StyleZhang, Q., Chen, Y., Li, Z., Fang, G., Xiang, Y., Li, Y., & Ji, H. (2020). Recent Changes in Water Discharge in Snow and Glacier Melt-Dominated Rivers in the Tienshan Mountains, Central Asia. Remote Sensing, 12(17), 2704. https://doi.org/10.3390/rs12172704