1. Introduction
Drought is recognized as a complex natural disaster that has severe effects on wildlife, agriculture, and the economy [
1,
2,
3]. The number of people affected by drought is greater than from any other class of natural disaster [
2,
4]. In recent years, the frequency and severity of droughts are increasing due to several factors, including climate change. Indeed, there have been many large-scale droughts affecting sizable areas of Europe, Africa, Asia, Australia, South America, Central America, and North America that can be linked to significant economic losses, food shortages, and in some cases, starvation for millions of people [
5,
6,
7].
Agriculture is always the first sector to be affected by the onset of drought [
8,
9,
10]. The adverse effects of drought are normally increased if drought occurs in an agrarian and densely populated region, such as South Asia, where millions of people are directly or indirectly dependent on diverse agricultural activities [
11]. However, the severity of drought in some parts of South Asia such as in Bangladesh has been extensively reduced by intensive irrigation, using easily available but slowly declining underground water for the cultivation of high yield variety (HYV) boro rice [
12].
Massive irrigation practices during the hot pre-monsoon season has created a complex scenario: (i) meteorological drought, which exists mainly due to high temperature and low rainfall, (ii) agricultural drought, which may or may not occur depending on the availability of irrigation, and (iii) a future threat to irrigation practices due to the regular depletion of underground water. This situation urgently requires detailed investigation of recent drought scenarios to minimize the potential risk of agricultural drought and its consequences for food security. However, a clear quantification of drought is not easy to accomplish in complex environmental settings that have evolved over decades through the integration of climate variables (temperature and rainfall) with human activities (i.e., irrigation and groundwater extraction) [
13,
14].
Significant efforts have been made to develop drought indices. Indeed, hundreds of drought indices, broadly based on meteorological and satellite data, have been developed [
15,
16]. The use of meteorological data-based drought indices, such as the Standardized Precipitation Index (SPI [
17]) and the Palmer Drought Severity Index (PDSI [
18]) are common in the literature [
15]. Similarly, the use of satellite-derived indices such as the Normalized Difference Vegetation Index (NDVI) [
19], the Vegetation Condition Index (VCI) [
20], the Temperature Condition Index (TCI) [
20], the Vegetation Health Index (VHI) [
20], and the Temperature Vegetation Dryness Index (TVDI) [
21] for the detection of drought have been well documented [
21,
22,
23].
Despite the apparent successful use of drought indices, there are reports that indices based on meteorological data or remote sensing data alone have limitations for the characterization of drought [
15]. This is especially true when anthropogenic activity modifies the surface conditions. Thus, in complex environmental settings, both types of drought index are limited: (i) meteorological data-based indices are unable to address the surface moisture contributed by anthropogenic activities and (ii) satellite-based drought indices are largely able to address the surface moisture conditions but unable to recognize the potential of climatological drought. Both factors are vital for understanding future drought risk.
Consequently, numerous studies have attempted to (i) develop new models [
24,
25,
26,
27], (ii) use multiple indices and ancillary data [
28,
29,
30], (iii) combine meteorological indices and remote sensing indices [
31], and (iv) use multi-sensor data [
32,
33,
34] in an endeavor to quantify the irregularities in reporting of drought intensity and spatial–temporal extent. However, none of these studies have been able to detect drought or foresee future drought, which requires distinguishing between moisture sources (i.e., rainfall or anthropogenic sources). For example, the SPI is based on meteorological data, comparing rainfall at a given location with historic rainfall records. The TDVI combines optical and thermal wavebands of satellite images to estimate the degree of moisture stress in vegetation canopies. However, the drought stress detected by either index cannot inform the cause of the drought or the risk of future drought.
Given the challenge of applying single source drought indices to a multi-dimensional problem, this study develops an integrated method that quantifies the present drought status and allows an examination of the potential risk of drought by integrating remote sensing-based drought indices, climate data (i.e., rainfall and temperature), and field observations. This paper considers several important requirements: (i) the need for an effective drought assessment technique for complex drought settings, where drought detection is difficult using either remote sensing or climate data-based drought indices alone, (ii) the importance of future agricultural drought risk assessment for this densely populated region, to ensure food security, and (iii) to explore the possibility of relating satellite-driven drought measurement with climate variables and field investigations.
3. Method
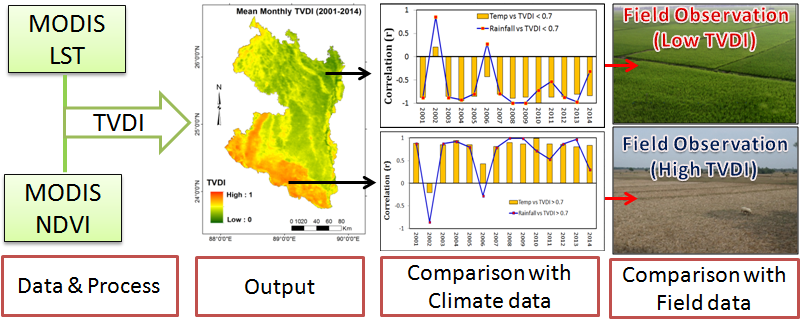
In this study, we integrated the results of the TVDI, climate data (i.e., rainfall and temperature), and field observations for detecting present drought conditions and future drought risk. For TVDI, we followed the general methodology [
21,
22] for the processing of two kinds of MODIS satellite, i.e., NDVI and LST. Thus, the overall data processing method of this study comprises four steps: (i) pre-processing, (ii) calculation of TVDI, (iii) integration of the TVDI results with climate variables (i.e., temperature and rainfall), and (iv) comparison of the TVDI results with field observations. These are described in the following subsections.
3.1. Pre-Processing
All of the downloaded NDVI and LST images were pre-processed as follows: (i) the necessary data (i.e., NDVI, LST, and quality assessment files) were extracted and re-projected using the MODIS Conversion Toolkit, using the Universal Transverse Mercator (UTM) projection and World Geodetic System (WGS) 84 datum, (ii) complete coverage of the study area was obtained by mosaicking two tiles, followed by sub-setting to include the study area only, (iii) a temporal averaging process was carried out to produced monthly LST from the daily LST product (MOD11A1, collection 6), since we have used monthly NDVI (MOD13A3) for generating the TVDI, and (iv) LST values were converted from Kelvin to Celsius.
3.2. Calculation of TVDI
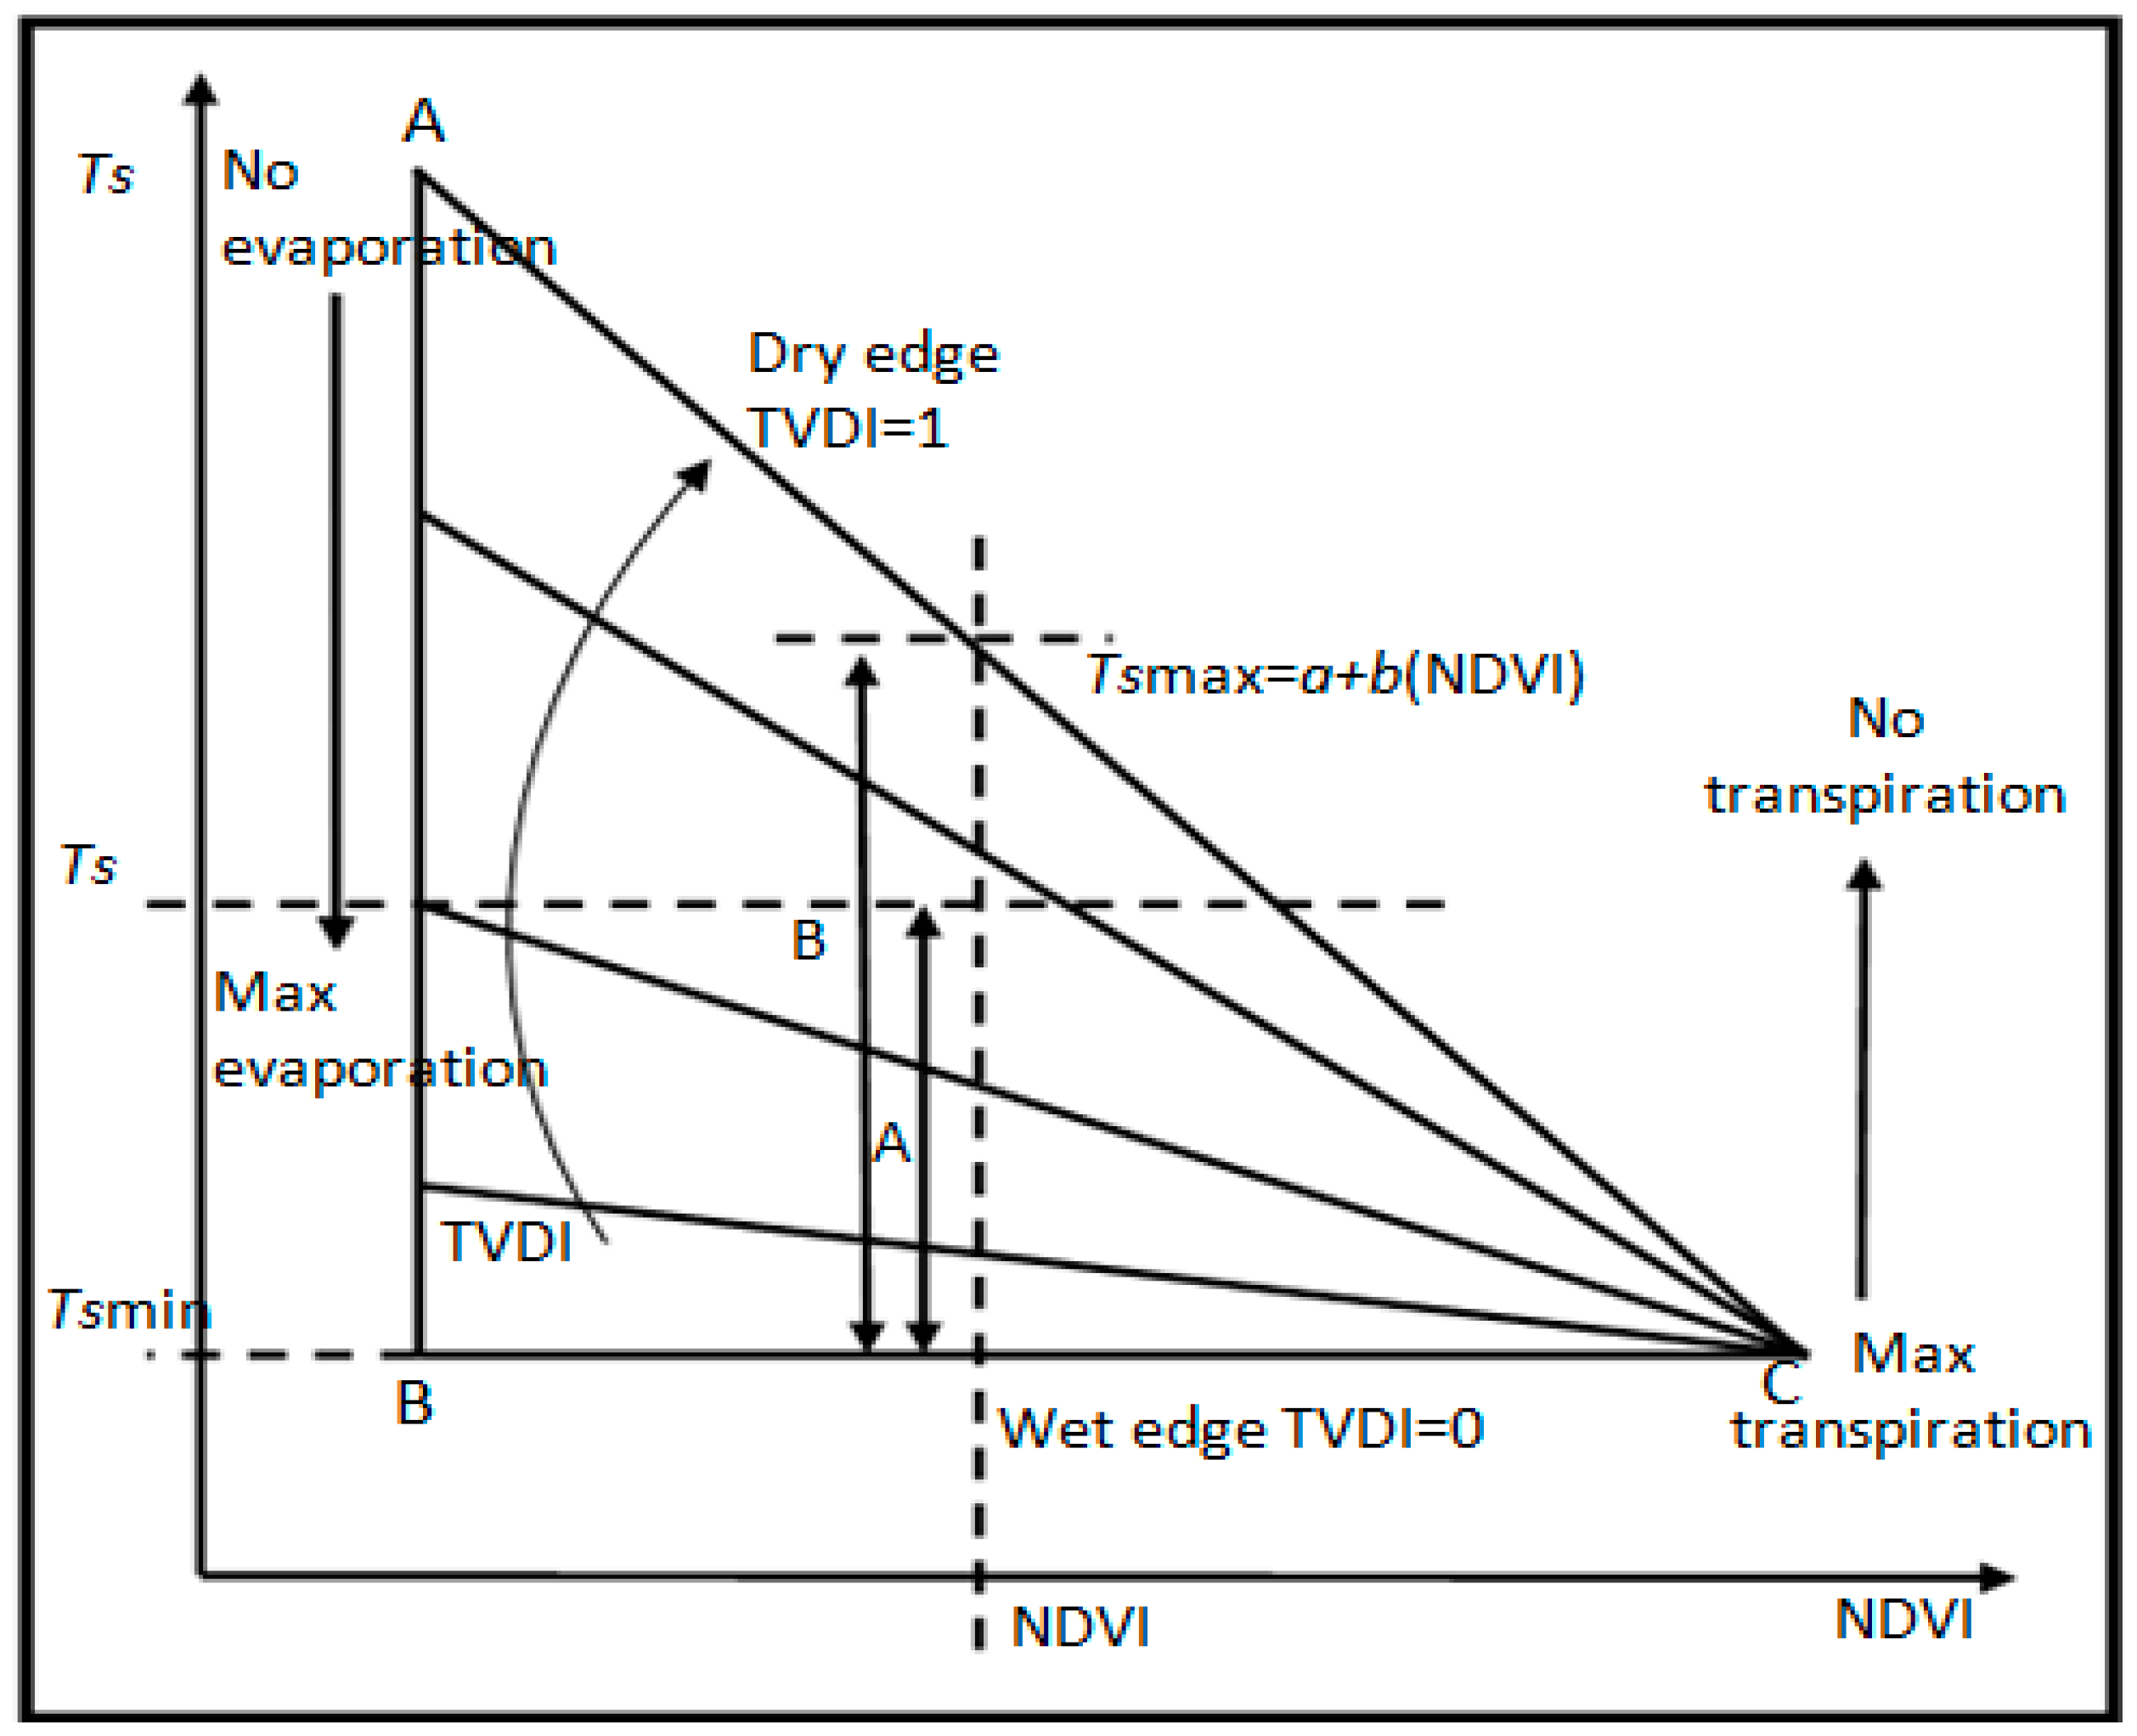
A conceptual NDVI–LST space, with LST plotted as a function of NDVI, is presented in
Figure 2. Based on the NDVI–LST space empirical relation, a simplified water stress/dryness index (TVDI) was suggested by [
21]. In this approach, the “wet edge” is modeled as a horizontal line (i.e., parallel to the NDVI axis) as opposed to a sloping wet edge in the trapezoid approach, and the “dry edge” is modeled as a linear fit to NDVI [
49,
51]. According to [
21], the TVDI can be defined simply as:
In Equation (1), LST is the observed surface temperature at the given pixel, NDVI is the observed normalized difference vegetation index, and a and b are the intercept and slope of the dry edge, respectively (the upper straight line in the triangle) (
Figure 2) calculated from NDVI–LST space regression with small intervals of NDVI (LSTmax = a1 + b1*NDVI), where LSTmax is the maximum surface temperature observation for a given NDVI value. The lower horizontal line of the triangle represents the wet edge (LSTmin = a2 + b2*NDVI) (
Figure 2), which can be calculated by averaging a group of points in the lower limits of the LST–NDVI scatterplots [
21]. Both the dry edge (LSTmax) and wet edge (LSTmin) are determined by linear regression analysis.
For this calculation, we first filtered out water pixels from NDVI and any unwanted LST values from the pre-processed MODIS NDVI and LST data. Then, we sliced the NDVI values into 100 intervals of 0.01 to obtain LST values for each NDVI interval. We applied least-squares regression fitting to extract the maximum LST value and the minimum LST value of the NDVI interval in steps of 0.01 from the LST–NDVI trapezoid to obtain the fitting equations for the dry edge (LSTmax = a1 + b1*NDVI) and the wet edge (LSTmin = a2 + b2*NDVI). Once these two edges were obtained, we produced the TVDI for each month using Eq.1.
The TVDI was calculated for January through April from 2001 to 2014 for several reasons: (i) January is the coldest and driest month while April is the hottest, (ii) rainfall is very low and temperatures rise quickly in later part of this period, (iii) the soil moisture deficit is ubiquitous, (iv) many severe drought events have occurred during the latter part of this period, and (v) High Yielding Variety (HYV) boro rice, which is essential to the economy, and which requires a plentiful moisture supply, is cultivated during these months.
The results of the TVDI and its spatial and temporal variation are presented in two ways: (i) by the simple stretching of the TVDI between 0 and 1 (
Figure 3A and
Figure S1A) and (ii) by classifying the TVDI into five categories [
22] (
Figure 3B and
Figure S1B). The five TVDI categories are wet (0–0.2), normal (0.2–0.4), slight drought (0.4–0.6), moderate drought (0.6–0.7), and severe drought (0.7–1). However, slight changes in the last two categories of the TVDI were made. These included using the TVDI with an upper limit of 0.7 for moderate drought instead of 0.8 and adjusting the TVDI range for the last category, taking into account the effect of massive irrigation practices.
3.3. Integration of TVDI Results with Climate Variables
Integration of the TVDI results with the climate variables temperature and rainfall was performed as follows. First, the study area was divided into two groups based on the classified TVDI values i.e., (i) TVDI < 0.07, and (ii) TVDI > 0.70, where TVDI < 0.07 indicates very low to moderate drought condition and TVDI > 0.07 indicates high to severe drought condition. Secondly, the percentage area in each group was calculated for all four months (i.e., January, February, March, and April) over the whole period. Finally, besides graphical presentation, a statistical relationship was determined by estimating the correlation coefficient (r) between the area of each TVDI group and the climate variables for each month and subsequently for each year over the period.
3.4. Comparison of TVDI Results with Field Observations
The collected field observations were examined, and these qualitative data were used for two purposes i.e., (i) to understand the relationship between the TVDI results and field conditions and (ii) to solve two opposite arguments: why in large parts of the study area, the TVDI results disagree with climate data (i.e., rainfall and temperature), and why in small parts of the study area, the TVDI results agree with climate data. All the field observations are presented as figures, and their characteristics explained with respect to the TVDI results in
Section 4.3).
4. Results
Results are presented in three groups: (i) assessment of drought using the TVDI, (ii) integration of TVDI results with climate variables, and (iii) comparison of TVDI results with field observations.
4.1. Assessment of Drought using TVDI
Fourteen years (2001–2014) of mapped monthly (i.e., January, February, March, and April) mean TVDI (
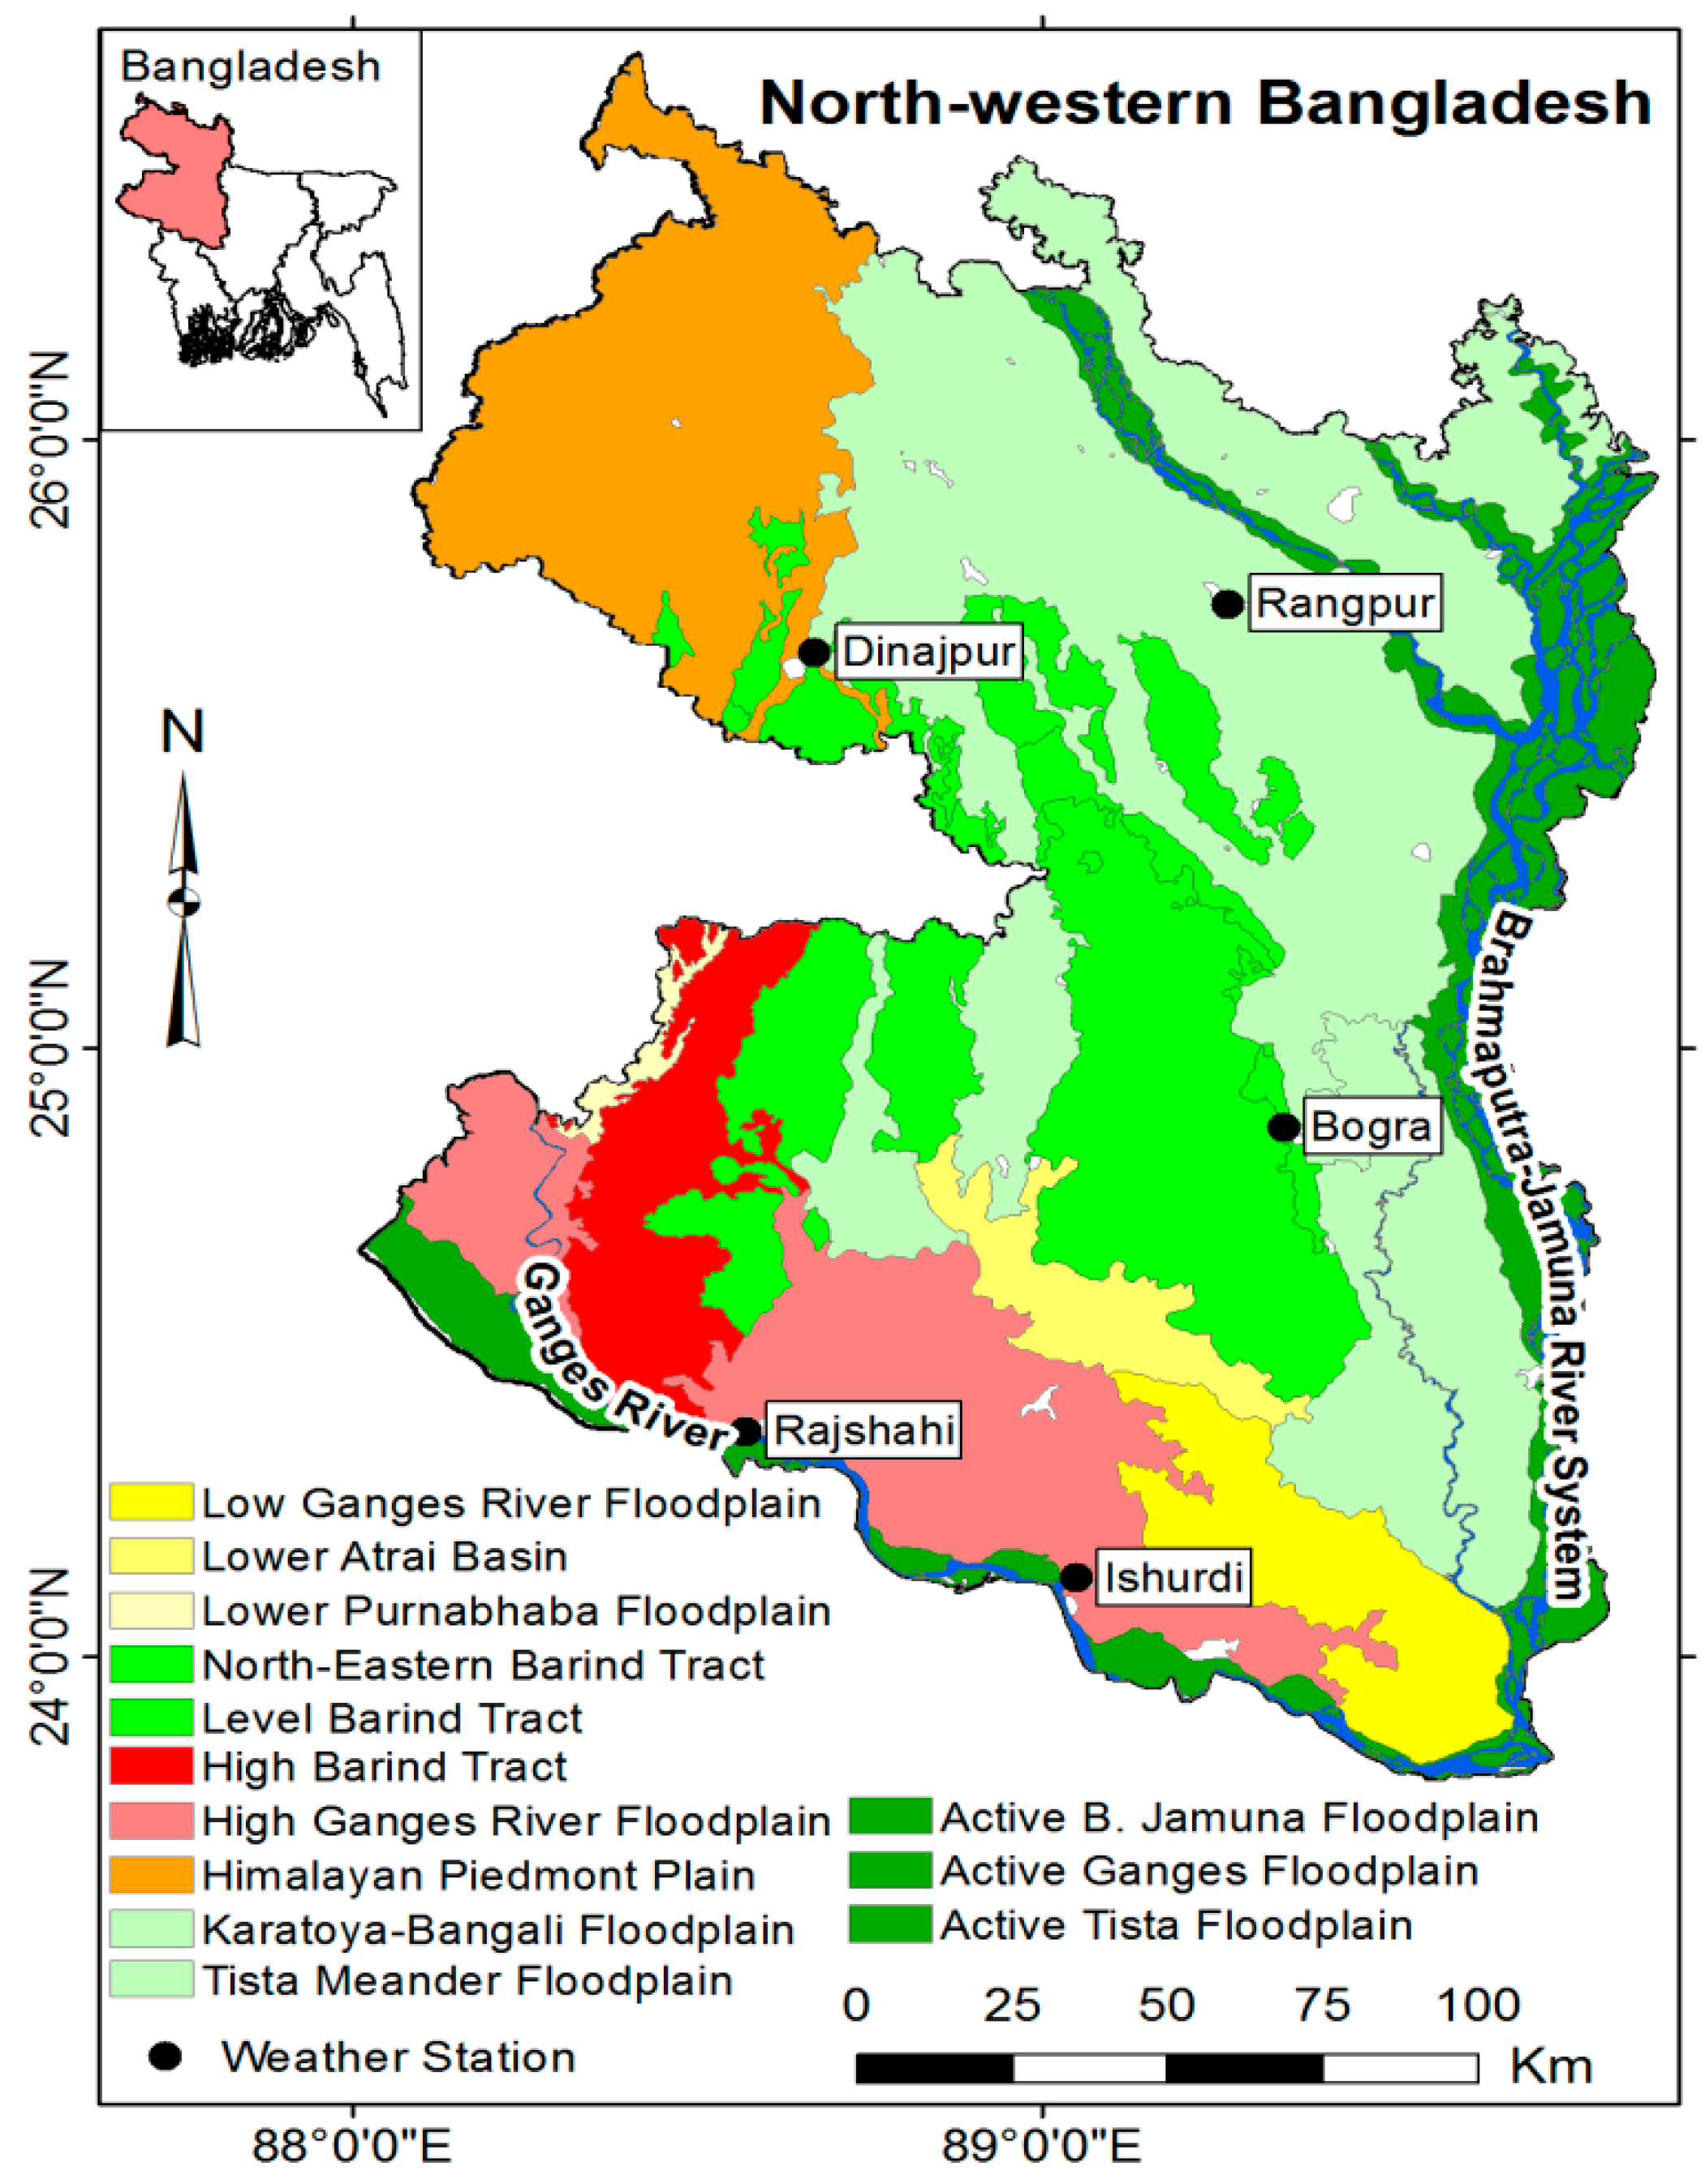
Figure 3) and likewise 14 years of individual months (S1A and S1B) indicate that the TVDI varies spatially and temporally within the pre-monsoon 4-month period (i.e., 4 months within a single year) as well as for each month among different years. In a single period/year (e.g., January–April 2001), a very low to moderate drought condition (TVDI < 0.70) was observed almost throughout the study area in the months of January and February. Moreover, a similar drought situation (TVDI < 0.7) was observed in the months of March and April, but with higher TVDI areas (TVDI > 0.7), which indicates severe drought problems were observed, mostly in the HBT as well as along the GRFP, both in the south of the study area (
Figure 1). The variation of the TVDI over the January to April period of all other years is notably similar, where the TVDI is mostly low in January and increases gradually, becoming highest in the hottest months of March and April and indicating severe drought over a small part of the study area in northwestern Bangladesh.
The inter-annual variation of the TVDI for the single month of January was low (e.g., January 2001 to January 2014) (Column 1 of
Figure S1A,B), indicating no major change in the spatial distribution of the TVDI over the 14-year period. The TVDI for January was nearly always low over the 14-year period, indicating that no severe drought-prone areas were observed. The one exception was 2002, when a few areas were found to be suffering severe drought (TVDI > 0.7). A stable pattern of inter-annual variation of the TVDI was also observed for the month of February (Column 2 of
Figure S1A,B), although more areas with higher TVDI values were noticed compared to January. Similar to January and February, the inter-annual spatial variation of the TVDI in March and April during this 14-year period was not also noteworthy. Generally, the high TVDI representing severe drought was observed in April, over approximately 15% of NWB, notably in the southern part of the study area, throughout the 14-year period, although the TVDI for most of NWB was still < 0.70; i.e., it was not severe (Columns 3 and 4 of
Figure S1A,B).
The simple finding from the above results is that NWB did not suffer much from severe drought during the four selected months (i.e., January through April) over the 14-year period. Very few severely drought-prone areas (TVDI > 0.7) were detected in January and February over the period; therefore, these two months can be considered as less susceptible to drought hazard. Considering the large areas with slight to moderate drought (TVDI > 0.40 to <0.70), March and April can also be considered primarily free from drought risk as well. However, small parts of NWB (mostly in the south and south-western part) were affected by severe drought (TVDI > 0.70) throughout the 14-year period, indicating that these two months are not completely free from drought risk.
The outcomes obtained using the TVDI are not in agreement with the findings of several previous drought studies based on meteorological data [
52,
53]. These studies indicate the northwestern part of Bangladesh as the most drought-prone area in the country and also that droughts during the pre-monsoon summer (March–April) are severe due to high temperature and low rainfall. Therefore, in this study, an effort has been made to integrate the TVDI results with climate data (i.e., temperature and rainfall) in order to understand the anomalies between this and previous studies [
52,
53], as well as to put the TVDI outcomes observed in context of climate data.
4.2. TVDI Results with Temperature and Rainfall
To integrate the TVDI results and climate data, we first categorized the TVDI results into two groups: (i) TVDI < 0.07 (very low to moderate drought conditions (hereafter lowTVDI)) and (ii) TVDI > 0.70 (severe drought conditions (hereafter highTVDI)).
4.2.1. Integration of LowTVDI Area with Temperature and Rainfall
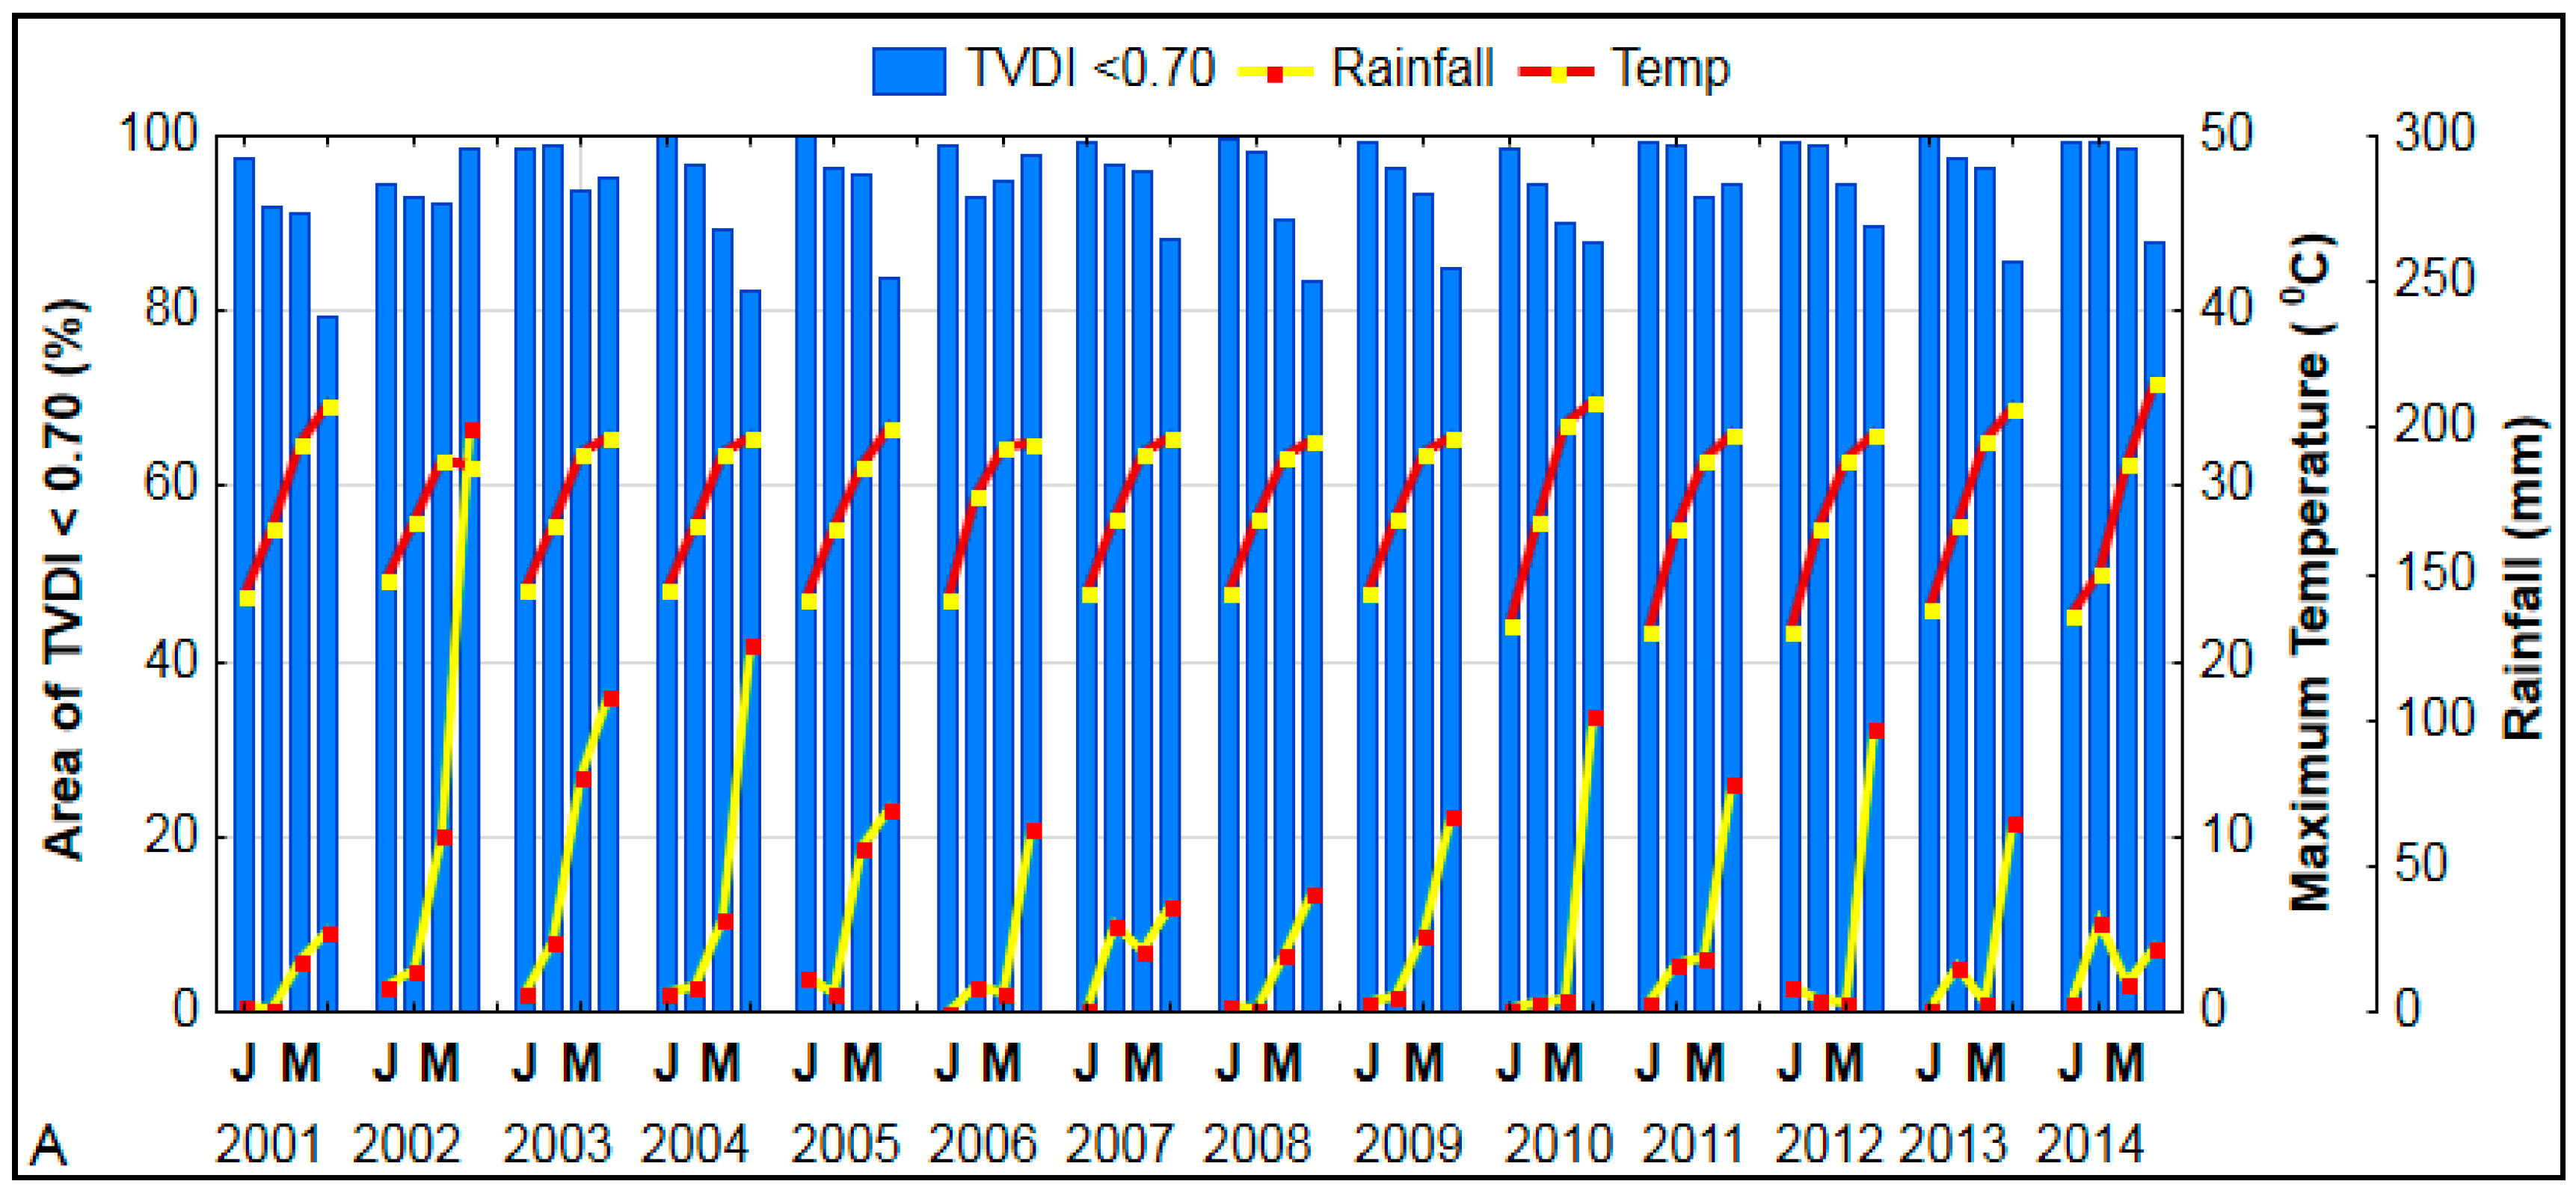
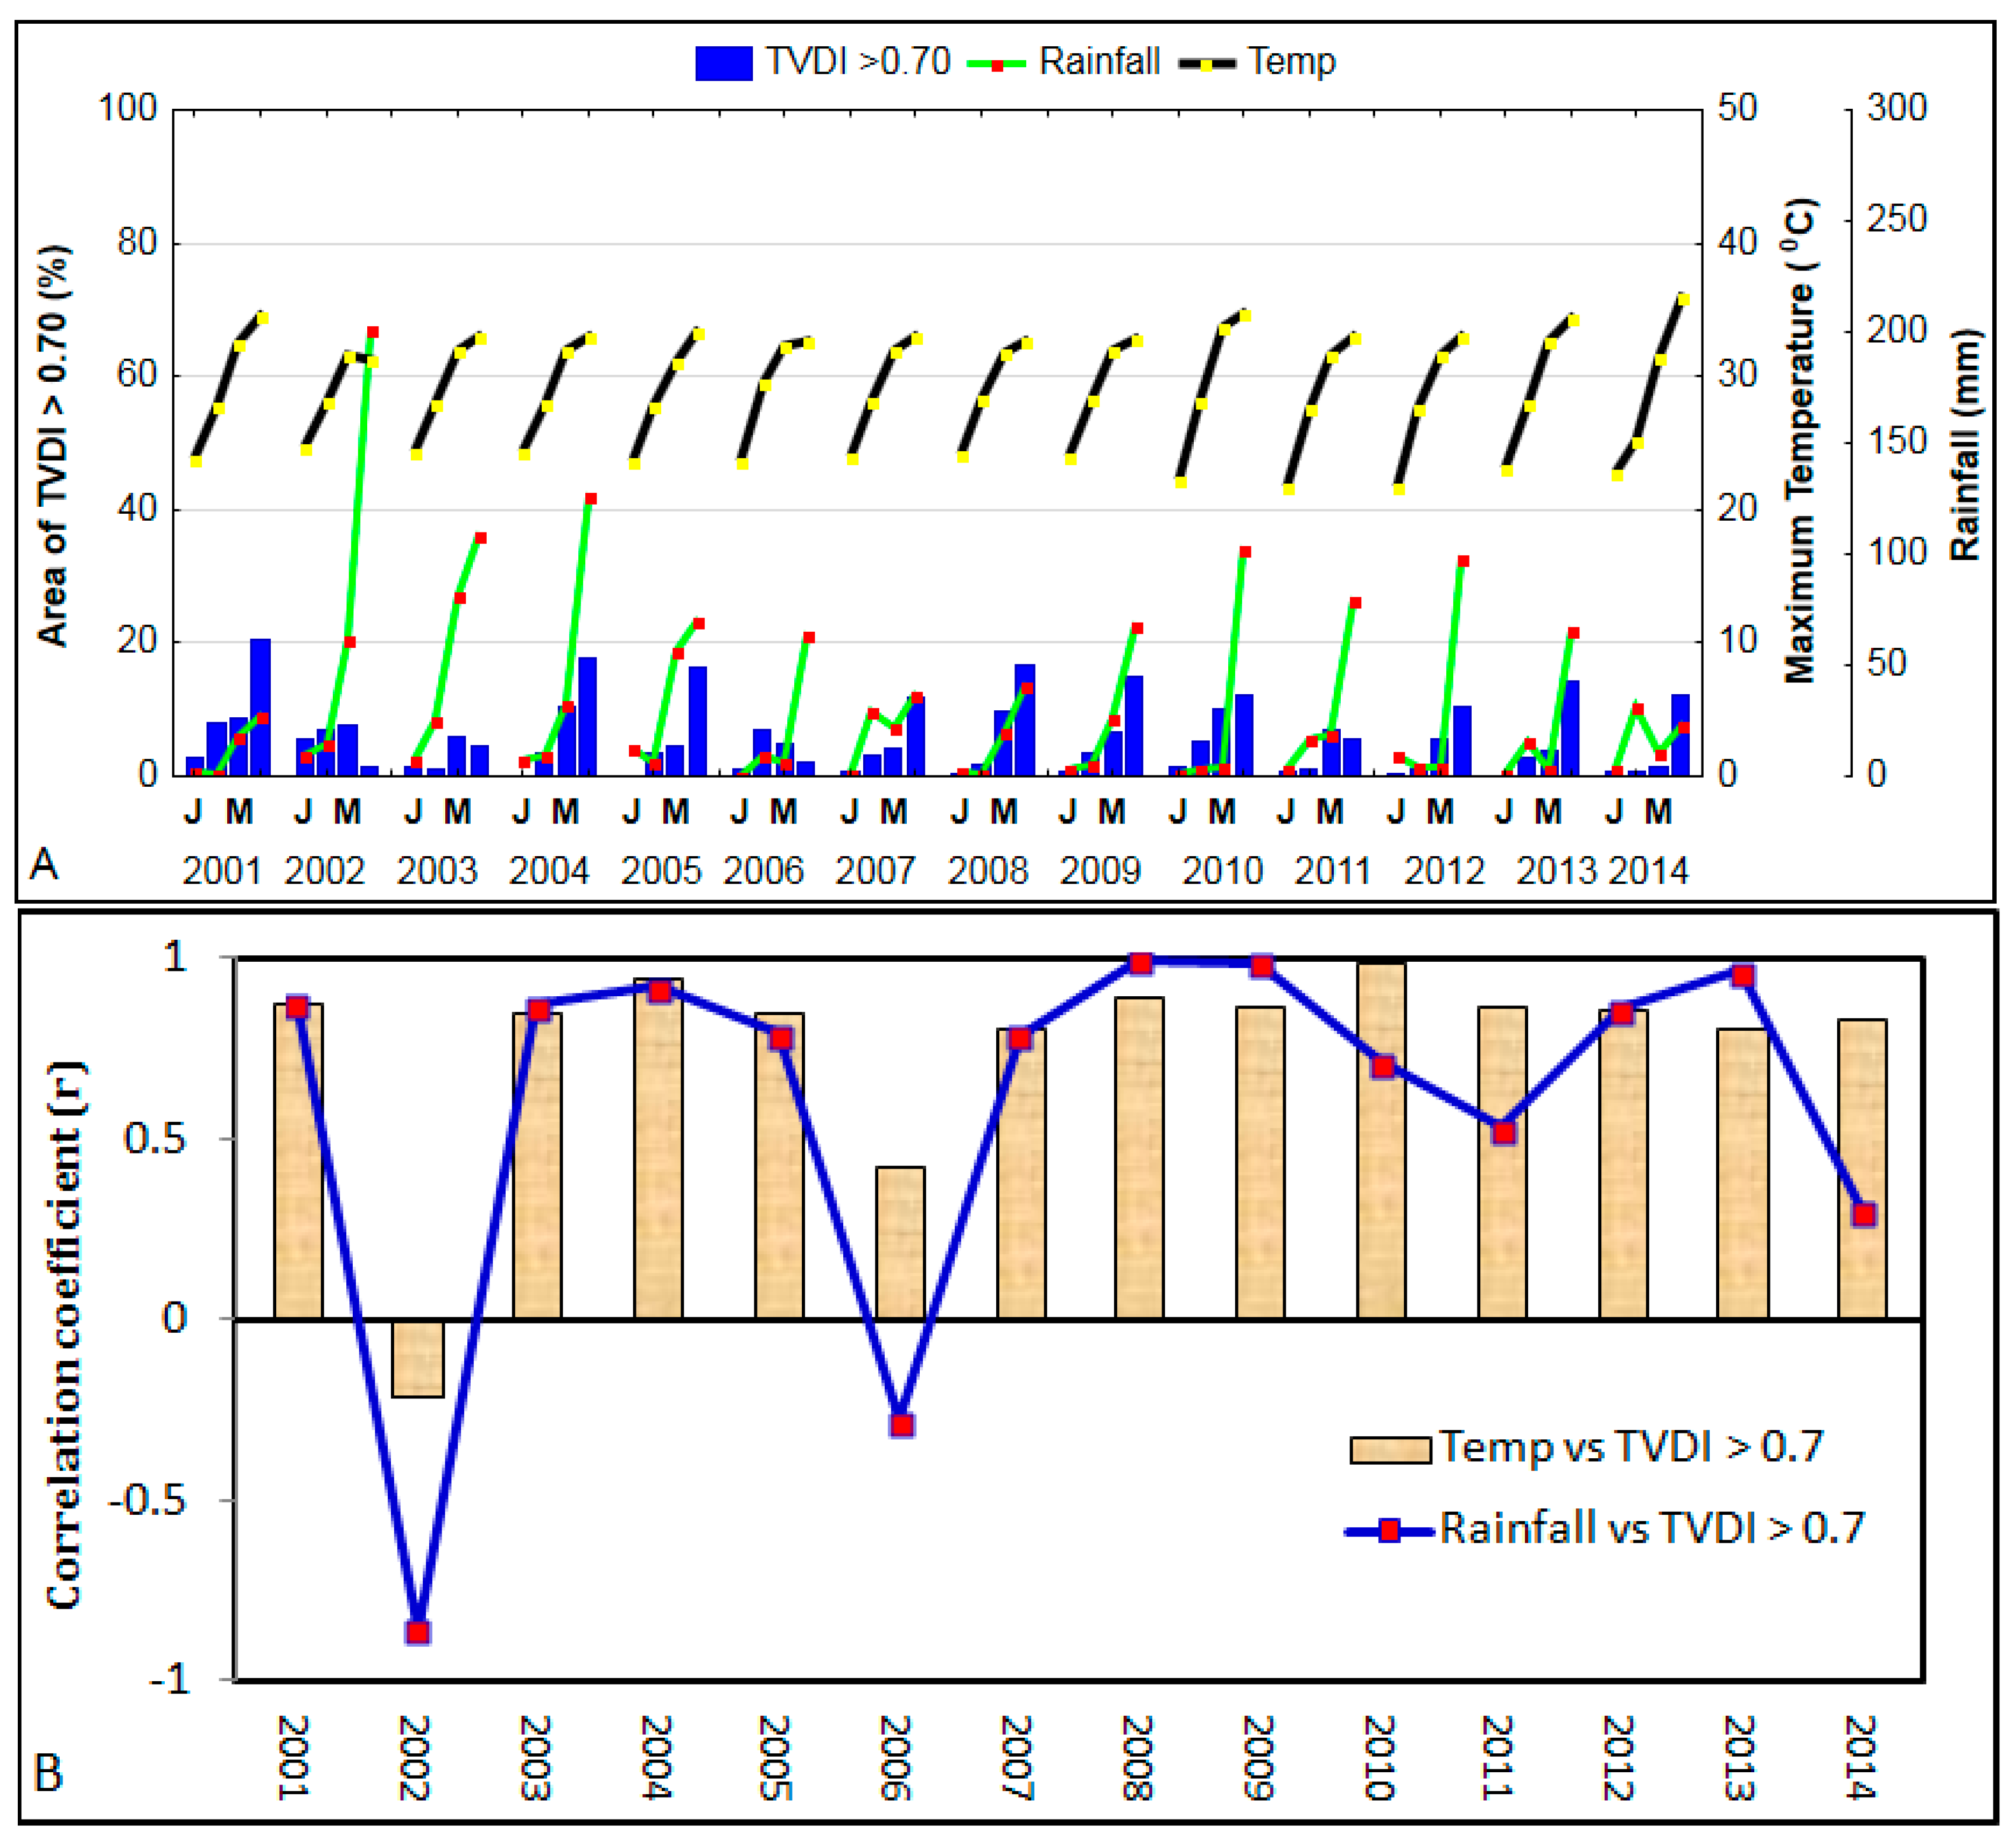
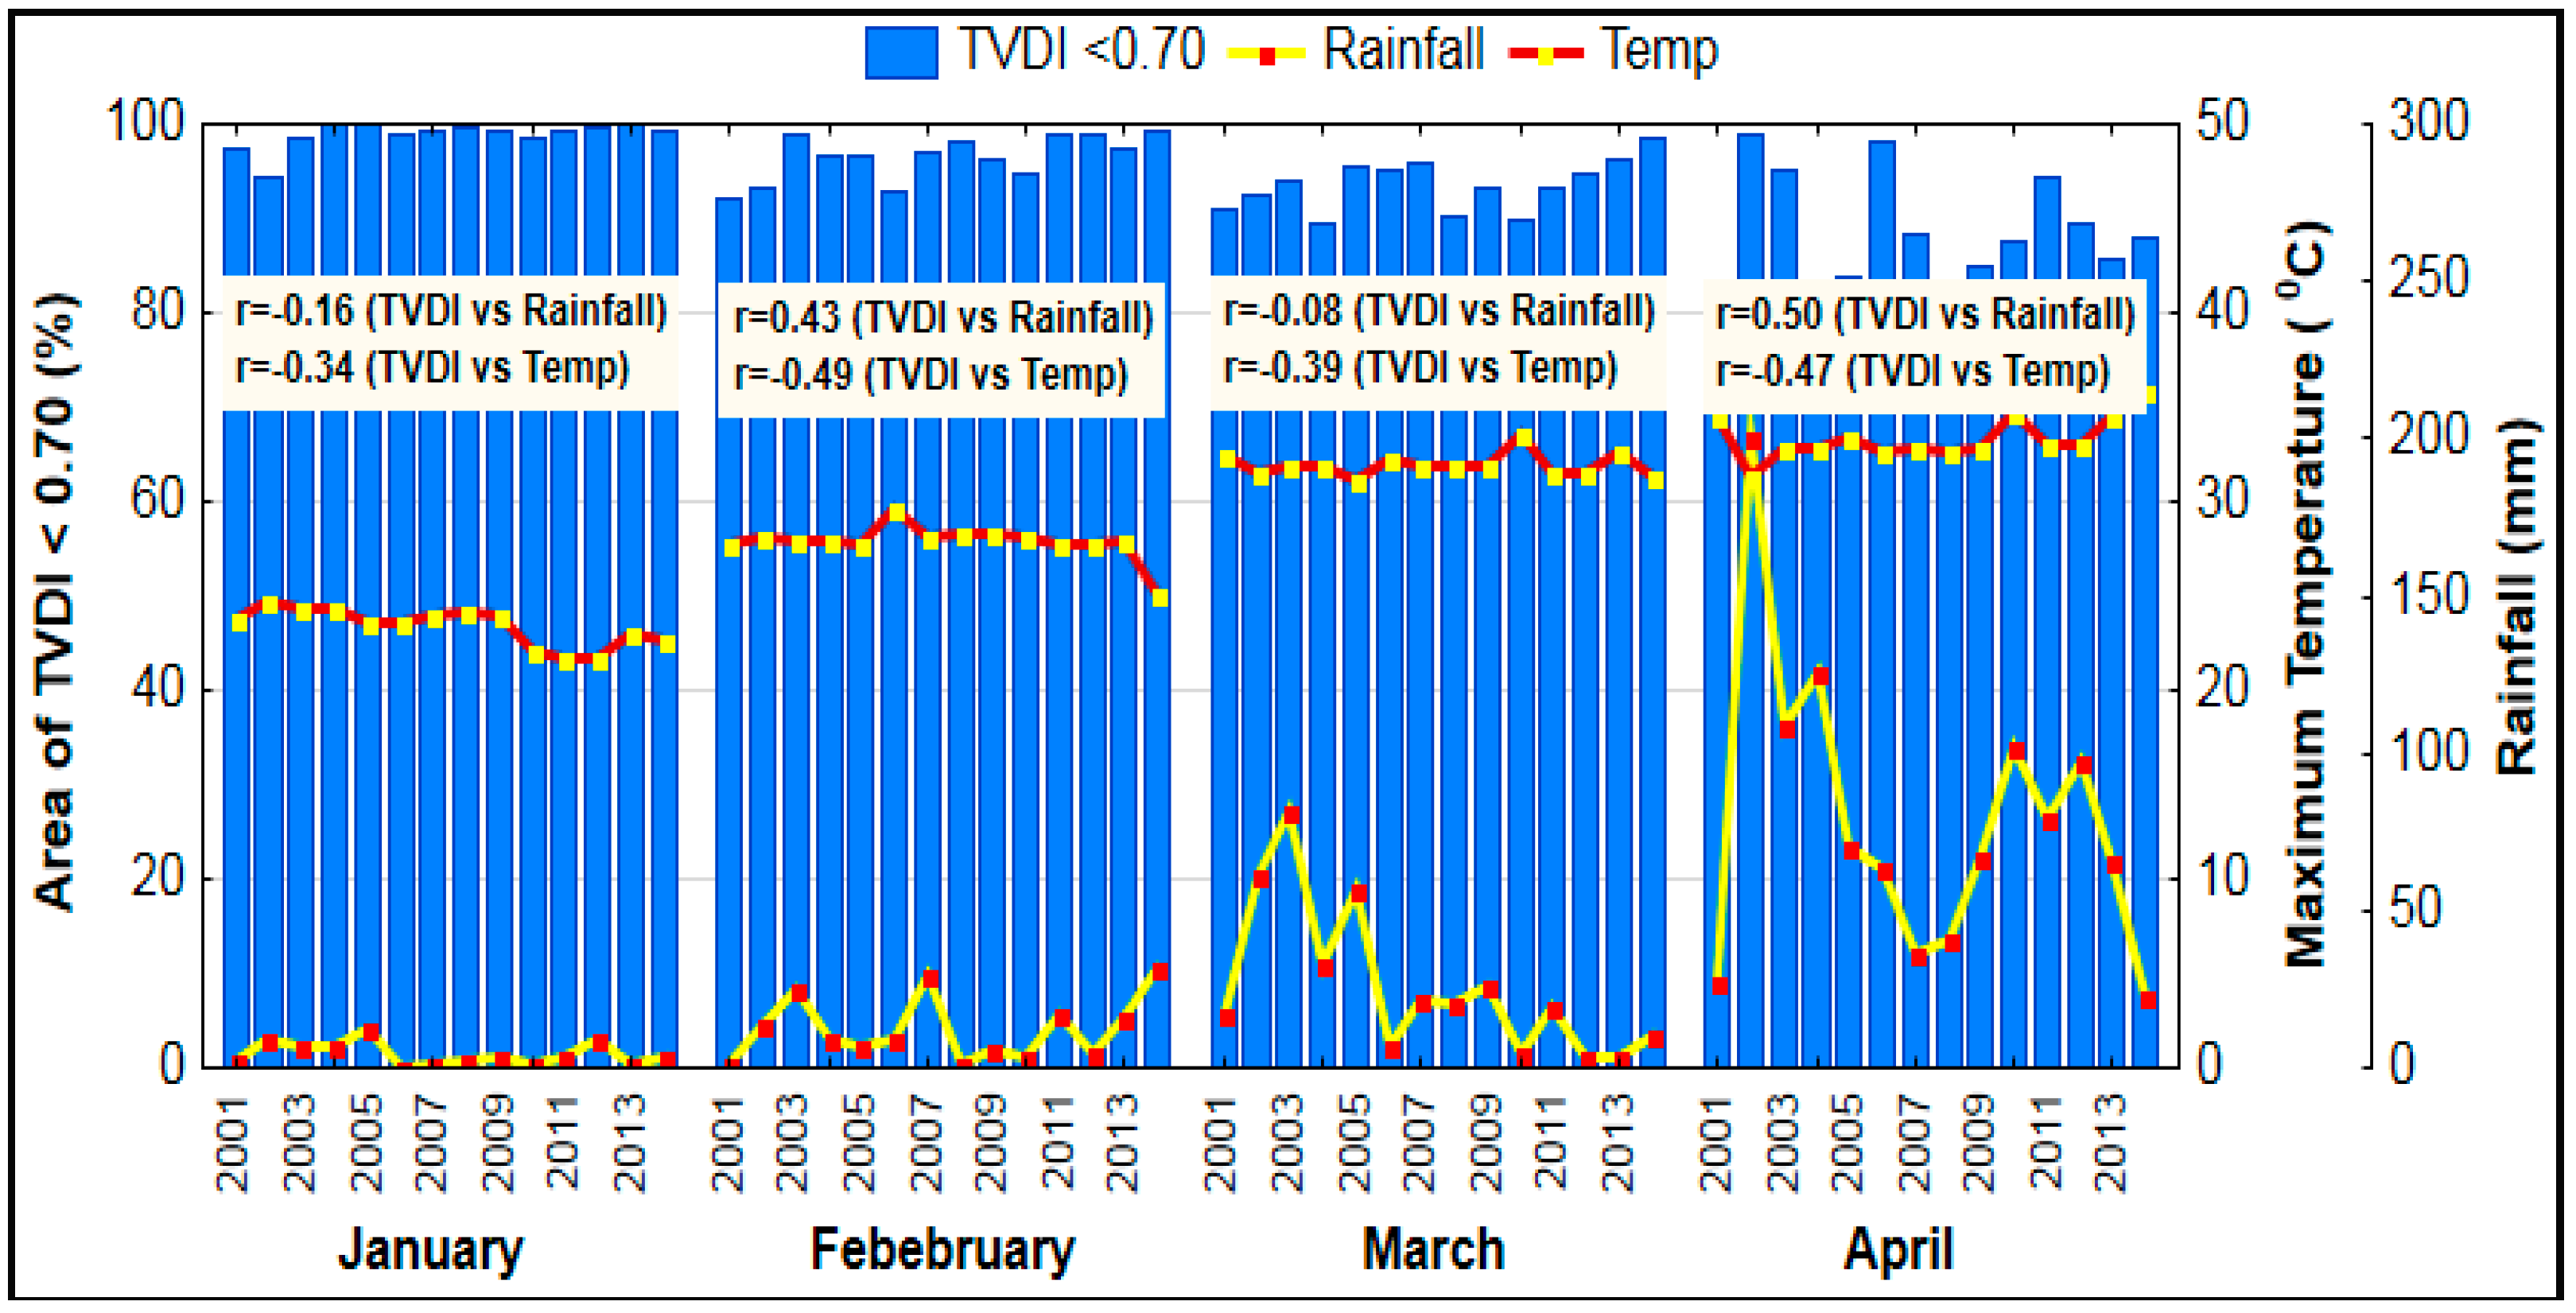
Figure 4 shows temperature and rainfall in the areas of lowTVDI (TVDI <0.7 representing low to moderate drought) in all years. In these areas, temperatures increase rapidly from January to February and February to March, and at a slower pace from March until the peak in April (
Figure 4A). This pattern of temperature increase is consistent over the 14-year period with slight anomalies in a few years such as 2001, 2002, 2011, and 2012 (
Figure 4A). Similar to temperature, rainfall also increases from January and reaches its peak in April, although variation in rainfall from year to year is evident (
Figure 4A). The lowTVDI areas appear to be greatest in January (99.99% in 2005) and gradually decrease during the season. The least area of lowTVDI occurs in April (79.50% in 2001), although some variation in this trend is noticeable, especially for April in 2002, 2003, 2006, and 2011 (
Figure 4A).
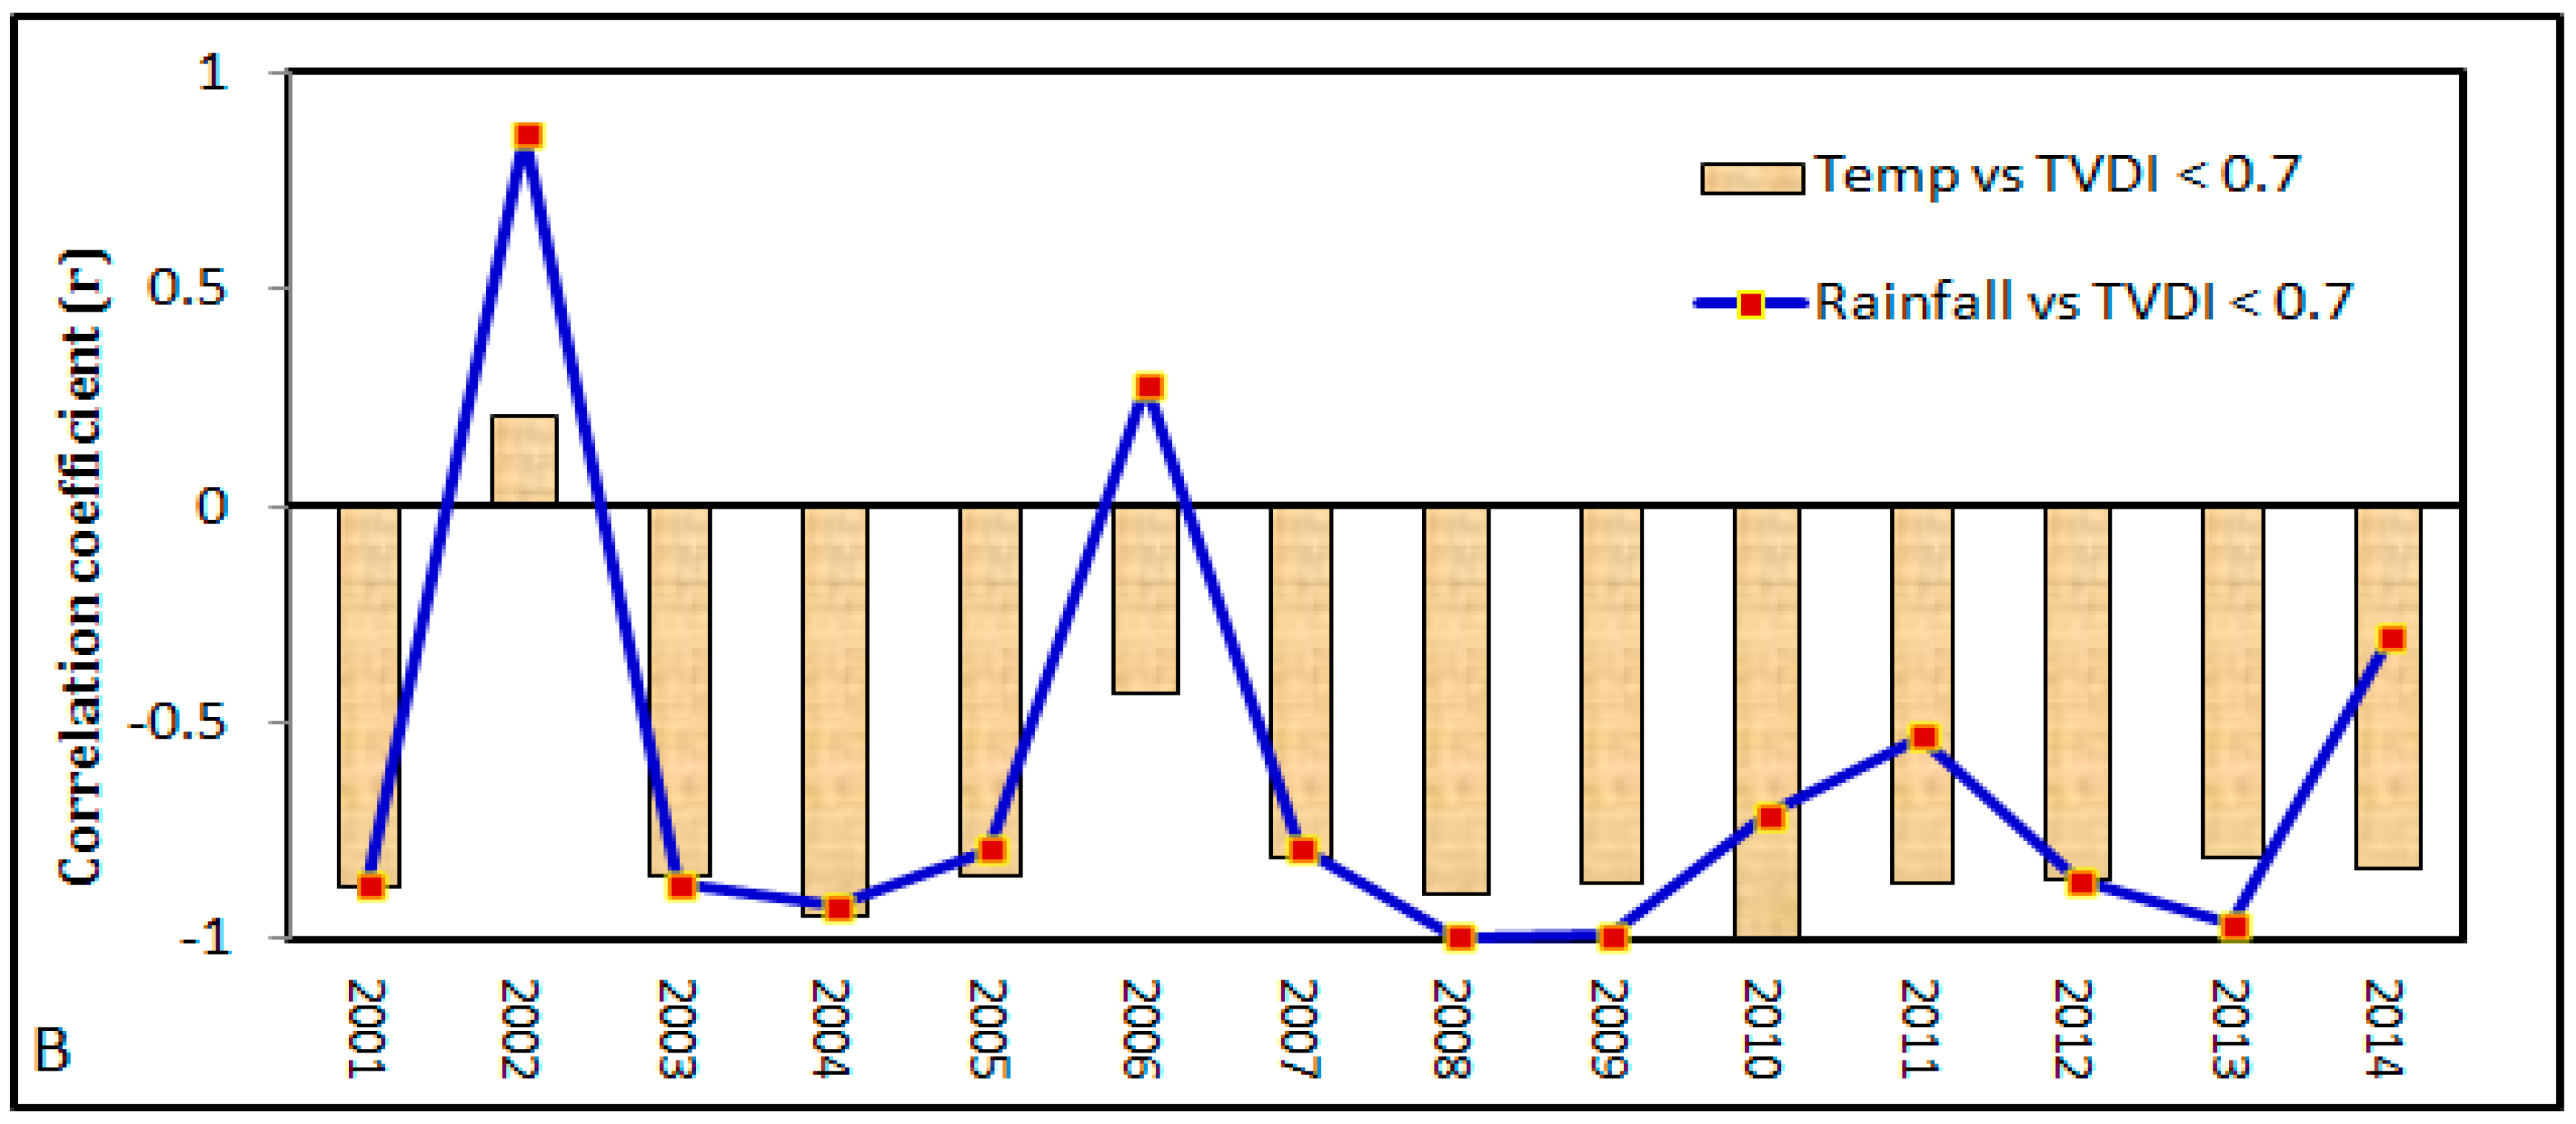
In general, strong negative correlation was observed between the area of lowTVDI and temperature, as well as between lowTVDI and rainfall, except in the years 2002 and 2006 (
Figure 4B). The negative correlation found is expected, as high temperature increases evaporation, resulting in soil moisture deficit. Notably, in spite of the strong negative relationship between temperature and the TVDI, approximately 80% of the study area is still unaffected by drought (indicated by lowTVDI), even in March and April, when the average temperature is above 32 °C (
Figure 4A). This situation contradicts expected scenarios and suggests three possibilities: (i) soil moisture is available from the adequate rainfall or stored soil moisture from previous months, (ii) there is an additional supply of water apart from rainfall, and (iii) the TVDI results are not representative of climate data.
The rainfall during the period increases between January and April (
Figure 4A) but the extent of lowTVDI areas (not drought-affected) does not increase; therefore, we obtained a negative correlation between lowTVDI areas and rainfall (
Figure 4B). A negative correlation between lowTVDI and rainfall is not expected since high rainfall increases soil moisture, resulting in lowTVDI. However, the impact of rainfall on the lowTVDI area is not observable, since the rainfall is very low over the whole dry season (January to April) period (
Figure 4A). Moreover, the possibility of moisture supply from the rainfall of the previous months, November and December, is also low, since the average rainfall in November and December is less than 10 mm/month. Therefore, it is understood from the climate data and previous studies that soil moisture in these lowTVDI areas (mostly planted to HYV boro rice) has been supplied by intensive groundwater-based irrigation systems [
41,
42] to meet the irrigation requirements of an average of 8.8 mm/day [
40]. A report [
54] indicated that the contribution of groundwater to HYV boro rice cultivation increased from 41% in 1982/83 to 85% in 2009/2010. This explains the observed disagreement between lowTVDI area and rainfall data.
4.2.2. Integration of the HighTVDI Area with Temperature and Rainfall
It is worthwhile to note that highTVDI areas were consistently observed over only a minor portion of NWB in the south and southwest (
Figure 3,
Figure S1A,B). These sites belong to the High Barind Tract and High Ganges River Floodplain (
Figure 1) where irrigation facilities are mostly unavailable.
It is obvious that highTVDI areas are negligible or absent in January and increase gradually, reaching the highest percentage (maximum of 20%) in April (
Figure 5A). The increase in highTVDI area with respect to time (month) is positively correlated with both temperature and rainfall (
Figure 5B). The positive agreement between highTVDI area and temperature is expected, but that with rainfall is not.
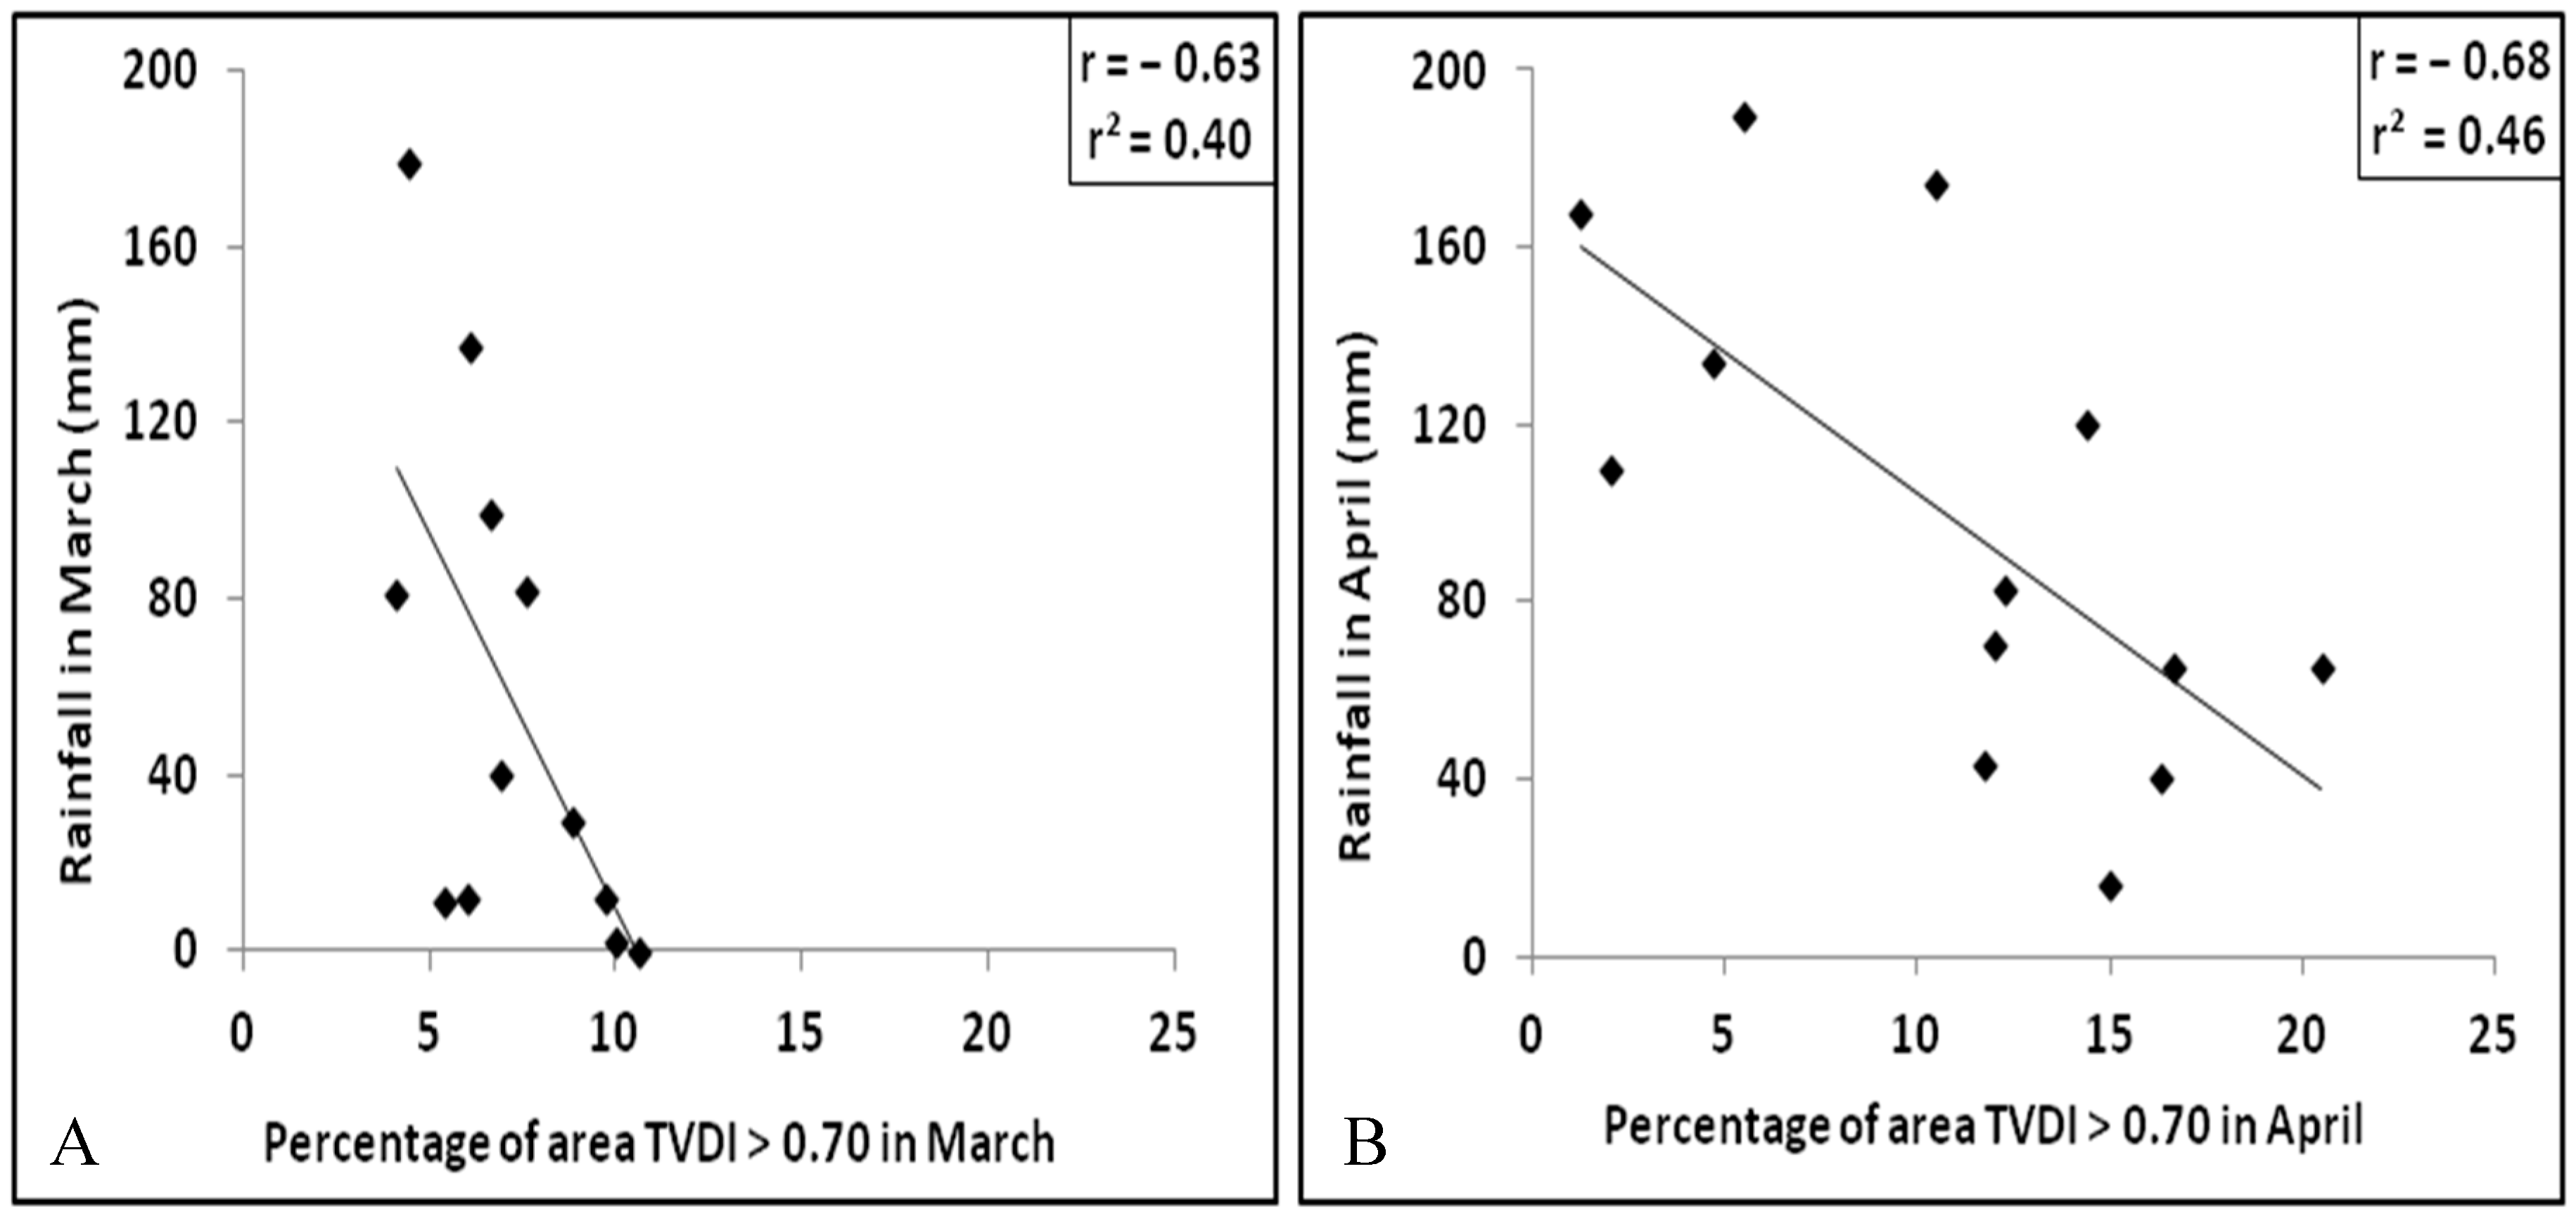
The positive agreement between highTVDI and rainfall (
Figure 5B) may have occurred due to the averaging of rainfall data from all 5 weather stations across NWB (
Figure 1), of which only two (i.e., Rajshahi and Ishwardi,
Figure 1) are located near the highTVDI areas. Based on rainfall data from these two stations, results for the months of March using 12 years of data (
Figure 6A) and April using 13 years of data (
Figure 6B) showed a negative correlation (R = −0.63 for March and R = −0.68 for April) between highTVDI area and rainfall.
The negative agreement between the highTVDI area and rainfall, and the positive correlation between highTVDI and temperature, demonstrated that both of these climate variables have a direct impact on the drought situation in the part of NWB where highTVDI values were found continuously over the period. At this point, remote sensing drought index results (i.e., TVDI results) are in agreement with the variation of rainfall and temperature.
4.3. TVDI Results and Field Observations
The TVDI results and climate variables suggested that the major factor behind the lowTVDI was ground water-based irrigation, with temperature playing a minor role. On the other hand, temperature and rainfall both played major roles in the highTVDI area, with little or no impact from irrigation. To confirm this, it would be necessary to have in situ field data that are unfortunately rarely available in developing counties such as Bangladesh. Therefore, a small-scale field campaign was carried out in the months of March and April to examine the field situation/moisture conditions. Several locations within the (i) lowTVDI areas and (ii) highTVDI areas were investigated to determine the real ground conditions.
4.3.1. Field Observations in the LowTVDI Area
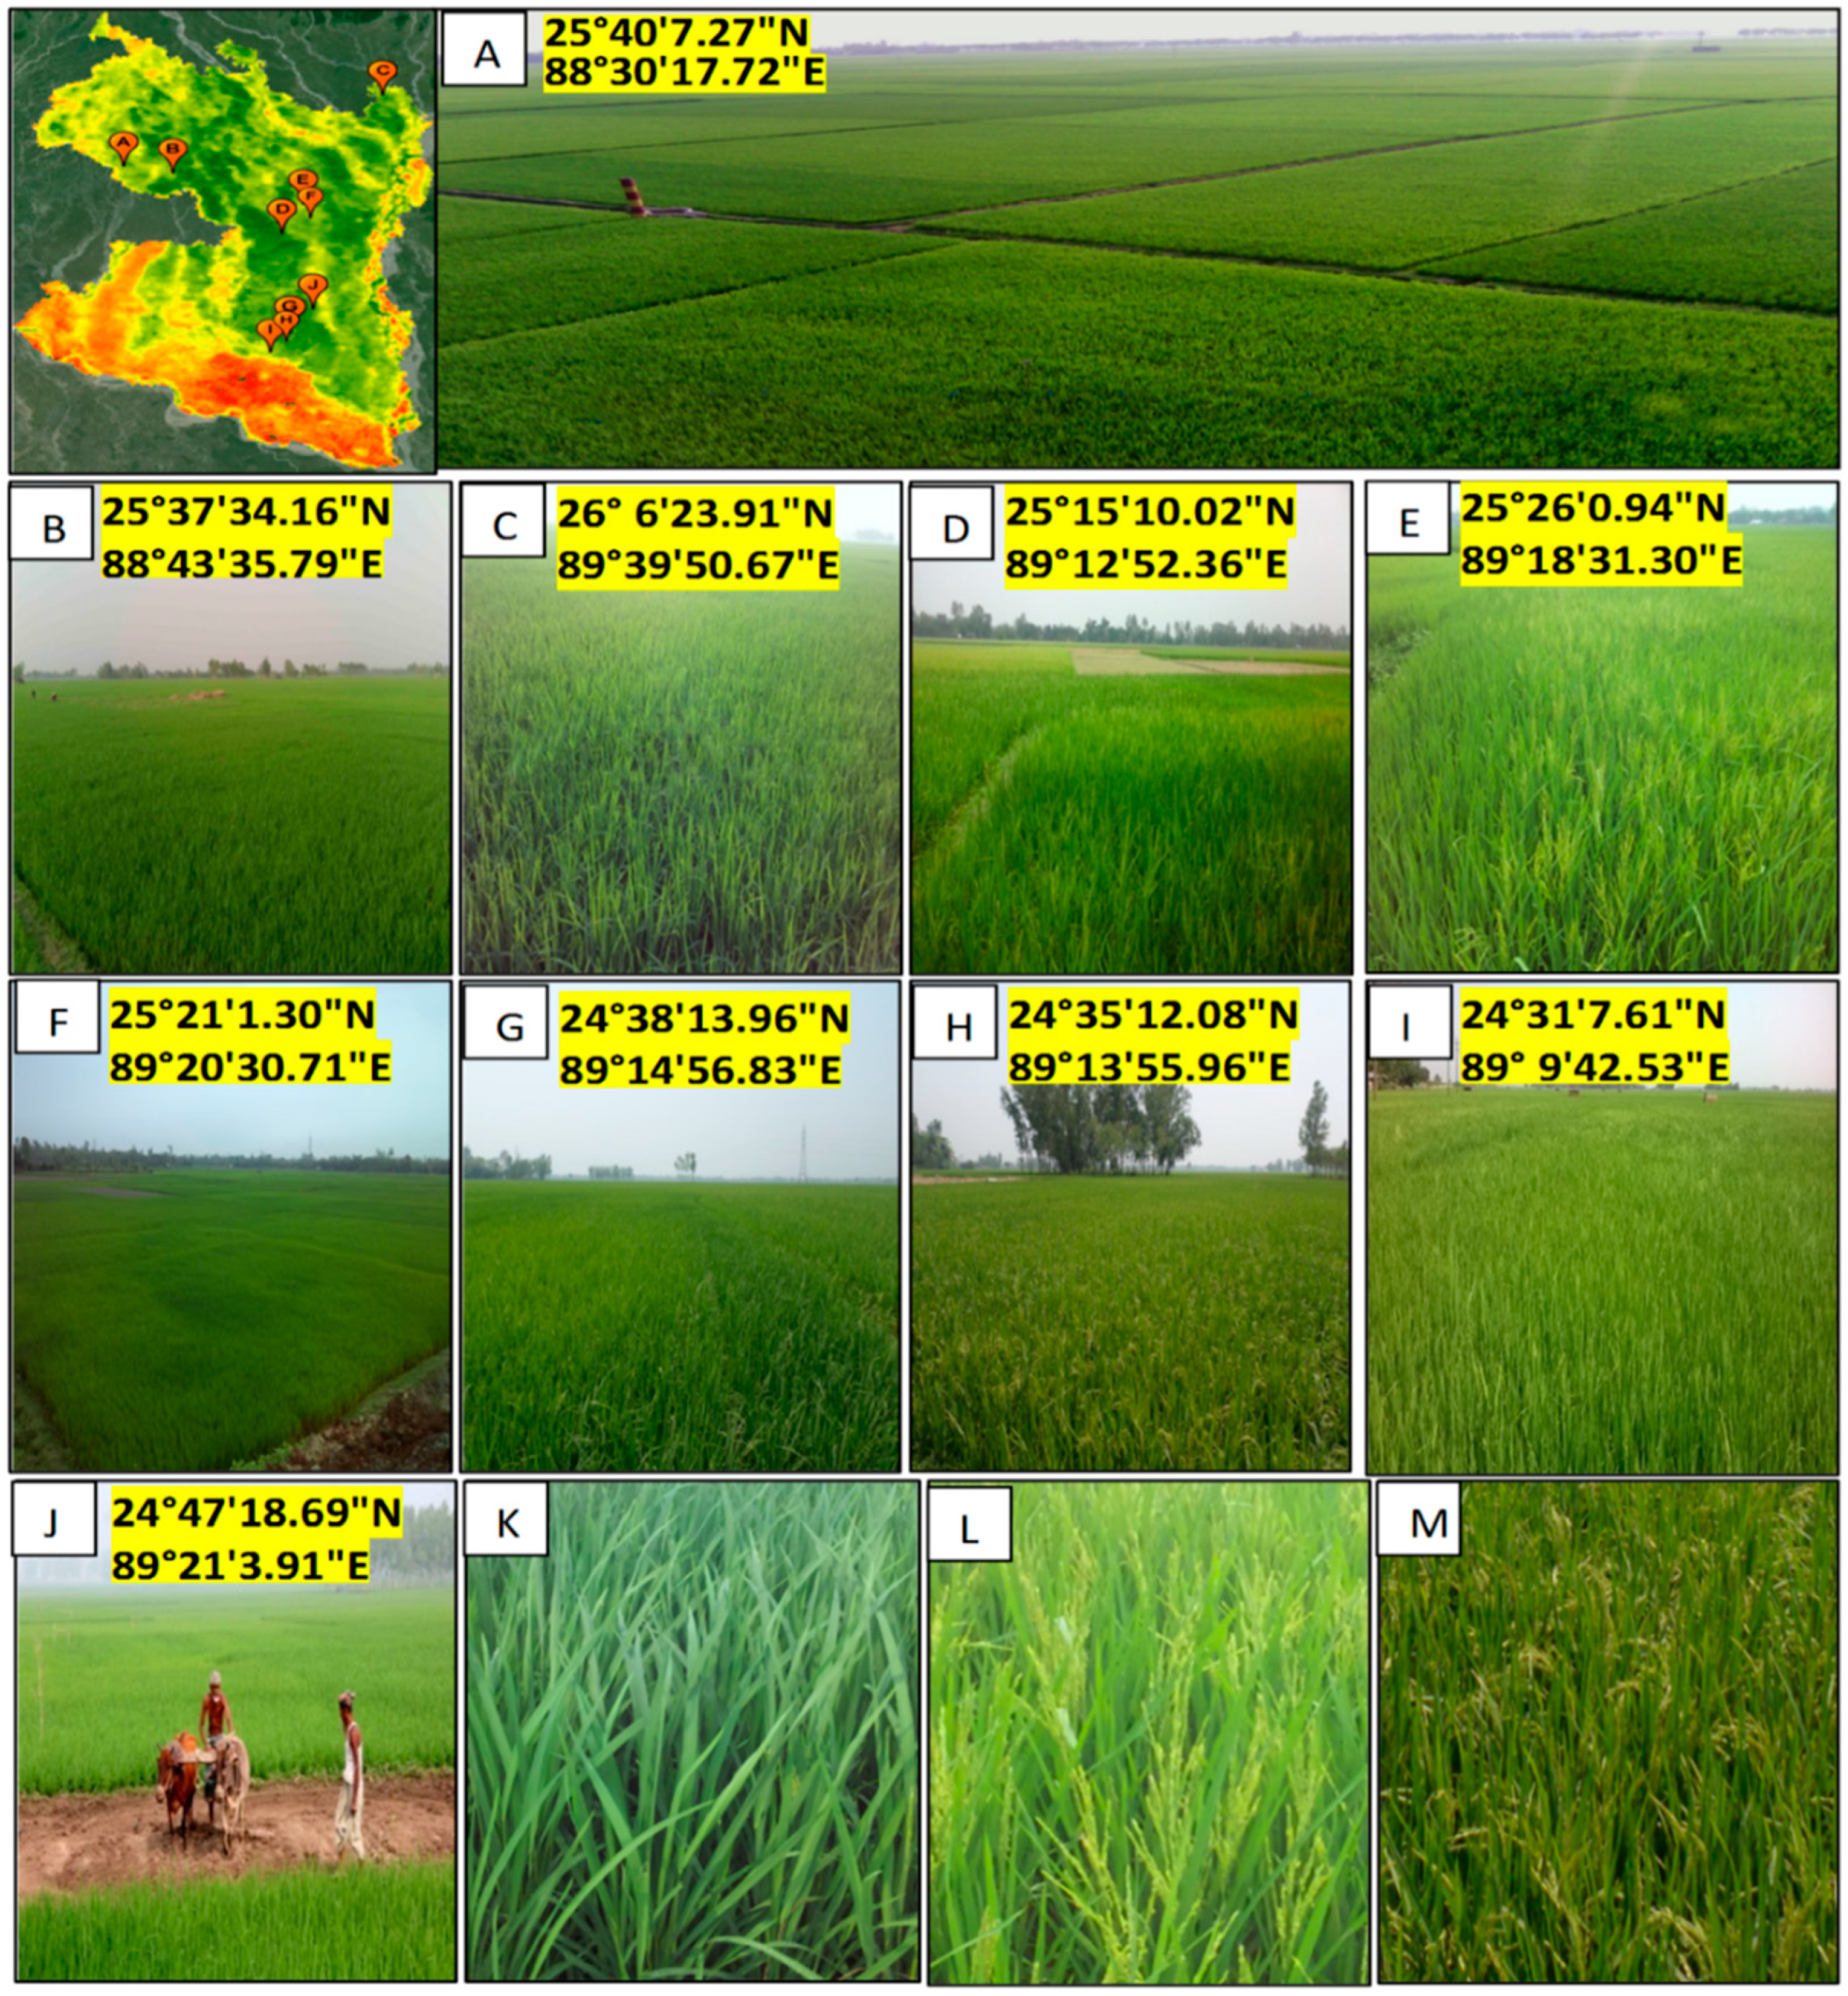
In lowTVDI areas, 10 sites were visited (
Figure 7A–J) to understand the field conditions. Field data clearly revealed that the ground surface was largely covered by green HYV boro rice in different growing stages, namely (i) the booting/heading stage (
Figure 7A–C,K) (ii) the flowering and milk stage (
Figure 7D,E,L), and (iii) the dough stage (
Figure 7H,M). Apart from the boro rice fields, homestead areas with vegetation cover are normally found throughout the investigated area, which can be seen at the edges of every picture (
Figure 7B–K).
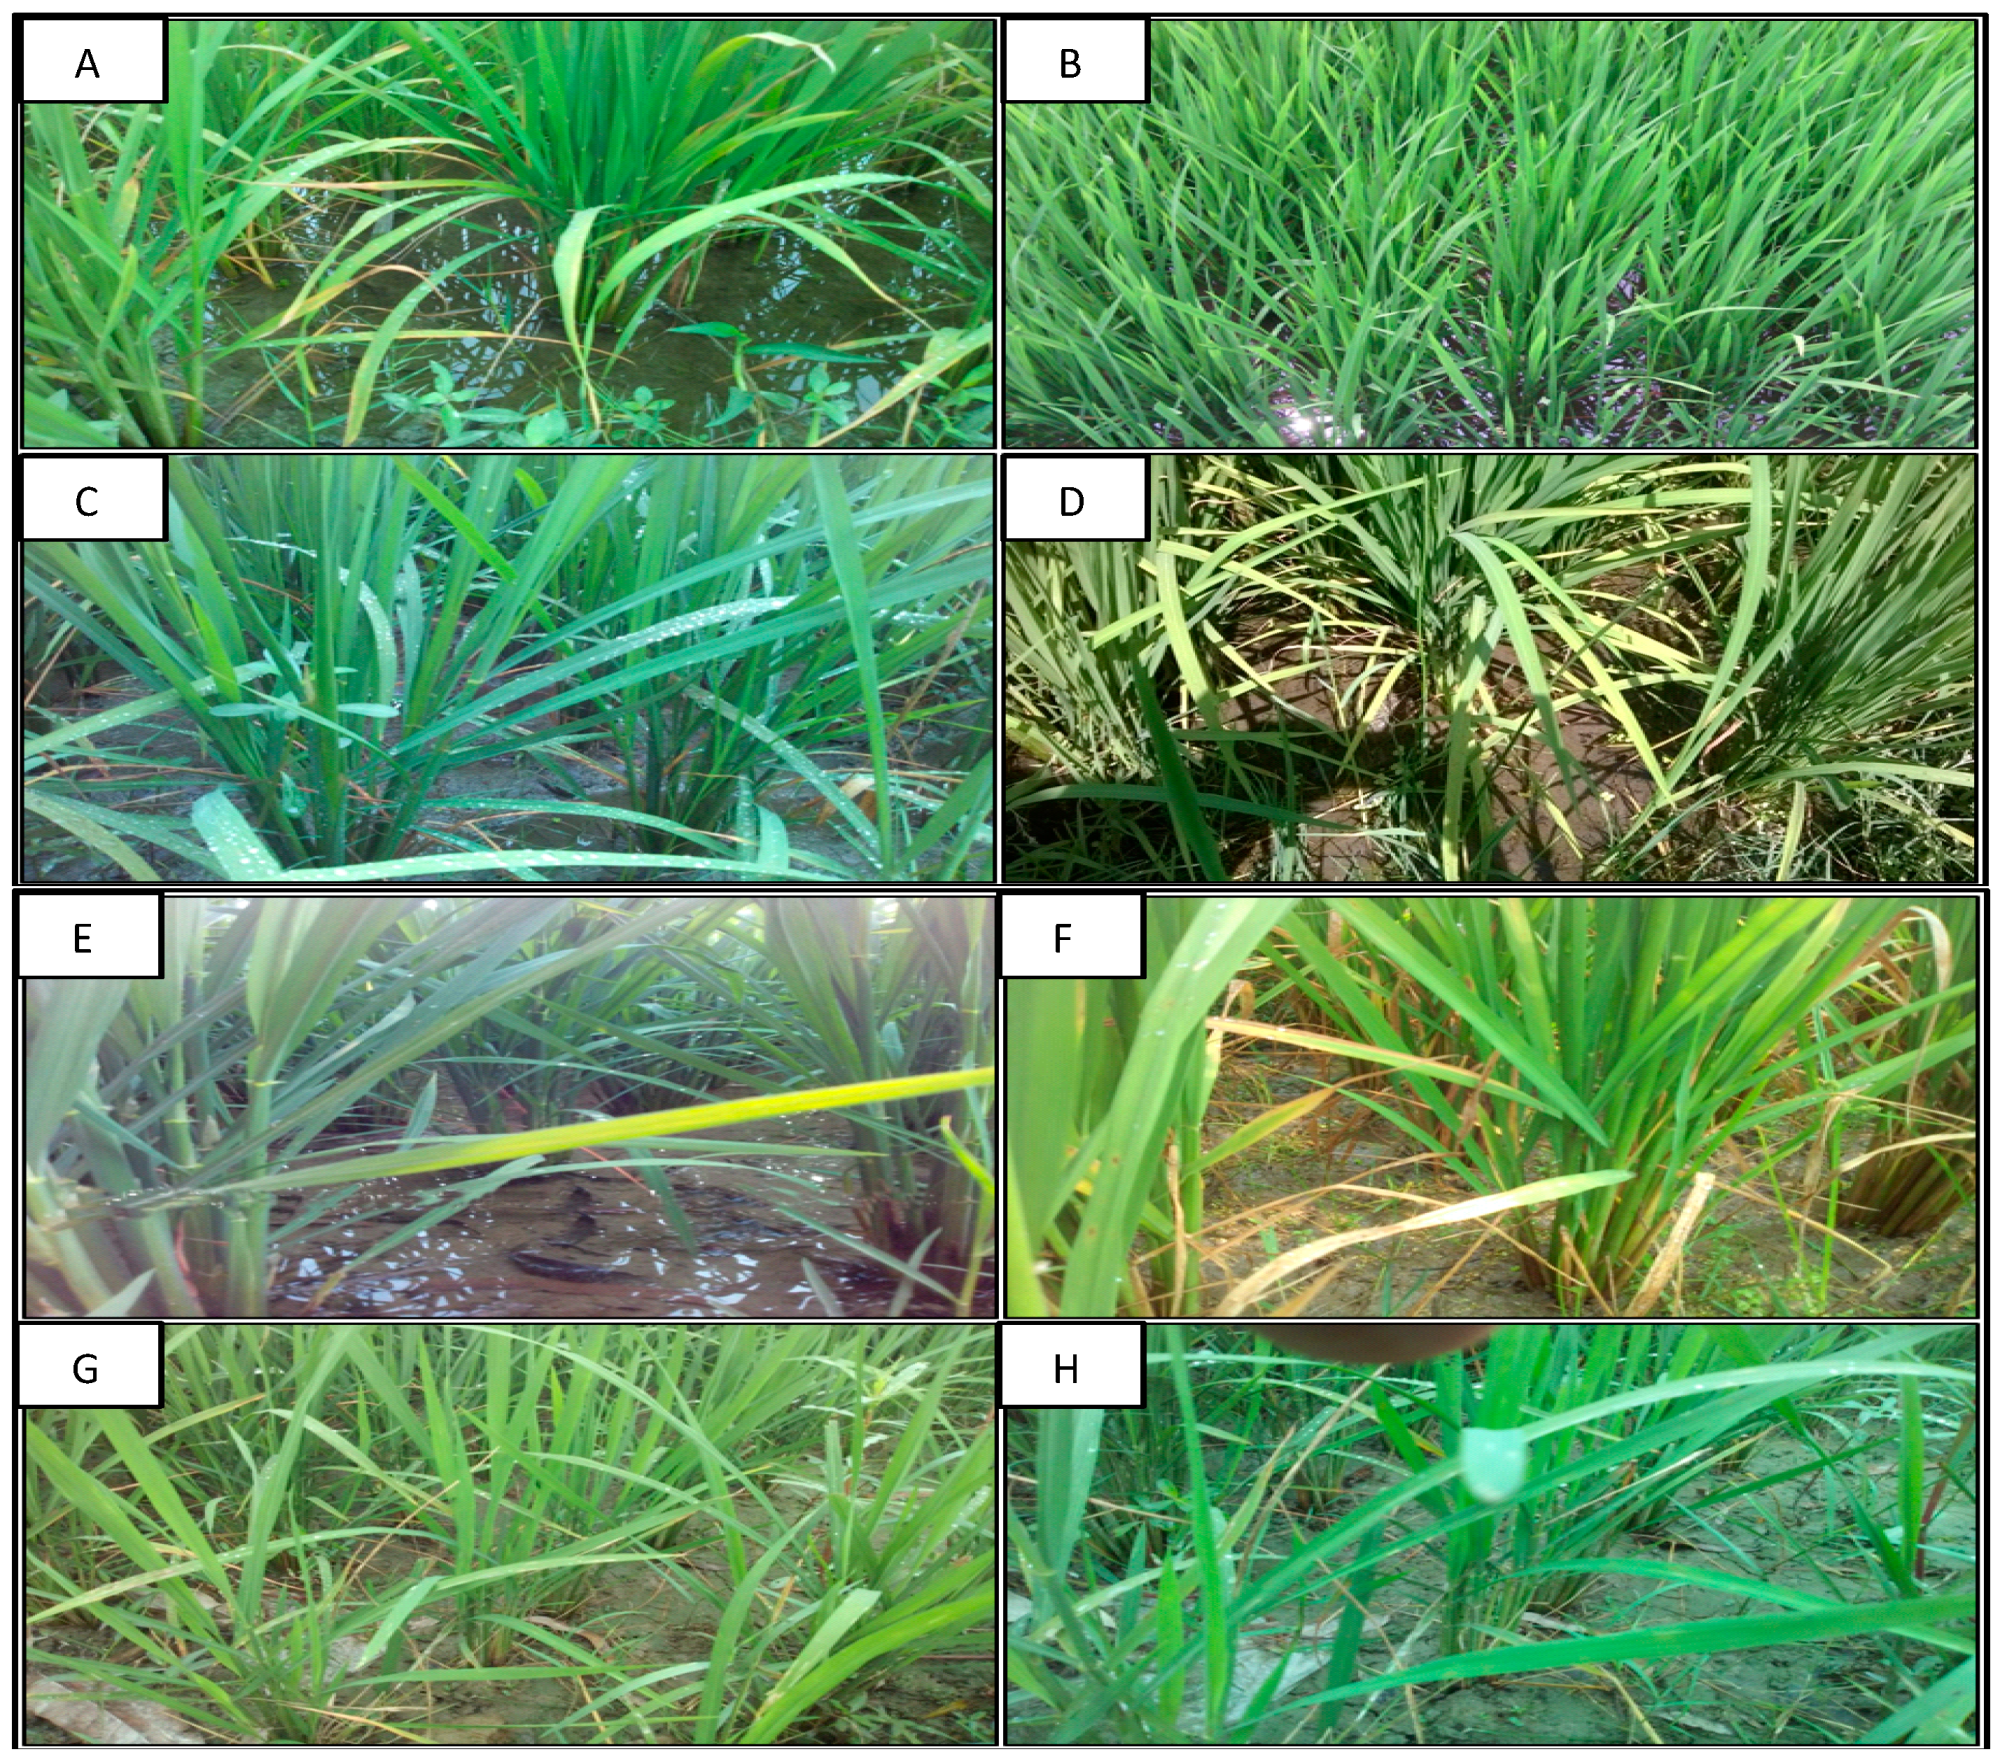
Besides the overall field conditions, we found that the level of soil moisture was not the same for all irrigated fields (
Figure 8). Some fields were completely saturated with stagnant water (
Figure 8A,B), while wet (
Figure 8C) and moist (
Figure 8D) ground conditions were also observed in some fields. In addition, irrigated fields with different levels of soil moisture deficit were also found (
Figure 8E–H). This is probably due to several reasons, such as weeding practices, the temporary mechanical failure of irrigation equipment, negligence, or lack of financial ability to irrigate the fields. However, hardly any fields were found to be completely dry or suffering from severe drought conditions during the field campaign.
The findings listed above indicate that the TVDI results appear to be in good agreement with field conditions. There were no major soil moisture deficits where the TVDI < 0.70. Indeed, our results indicate that in the lowTVDI areas, irrigation played a major role in reducing the effect of temperature during the dry season. Furthermore, the field observations suggest that the variation of TVDI values within the lowTVDI area is attributable to several other factors: (i) spatial variation in rainfall, (ii) variation in boro rice planting times, and thus different growing stages of rice, (iii) weeding practices, (v) boro rice fields with other fragmented land use/cover within the 1 km pixel, and (vi) possible small calibration errors associated with the two satellite products.
4.3.2. Field Observations in HighTVDI Areas
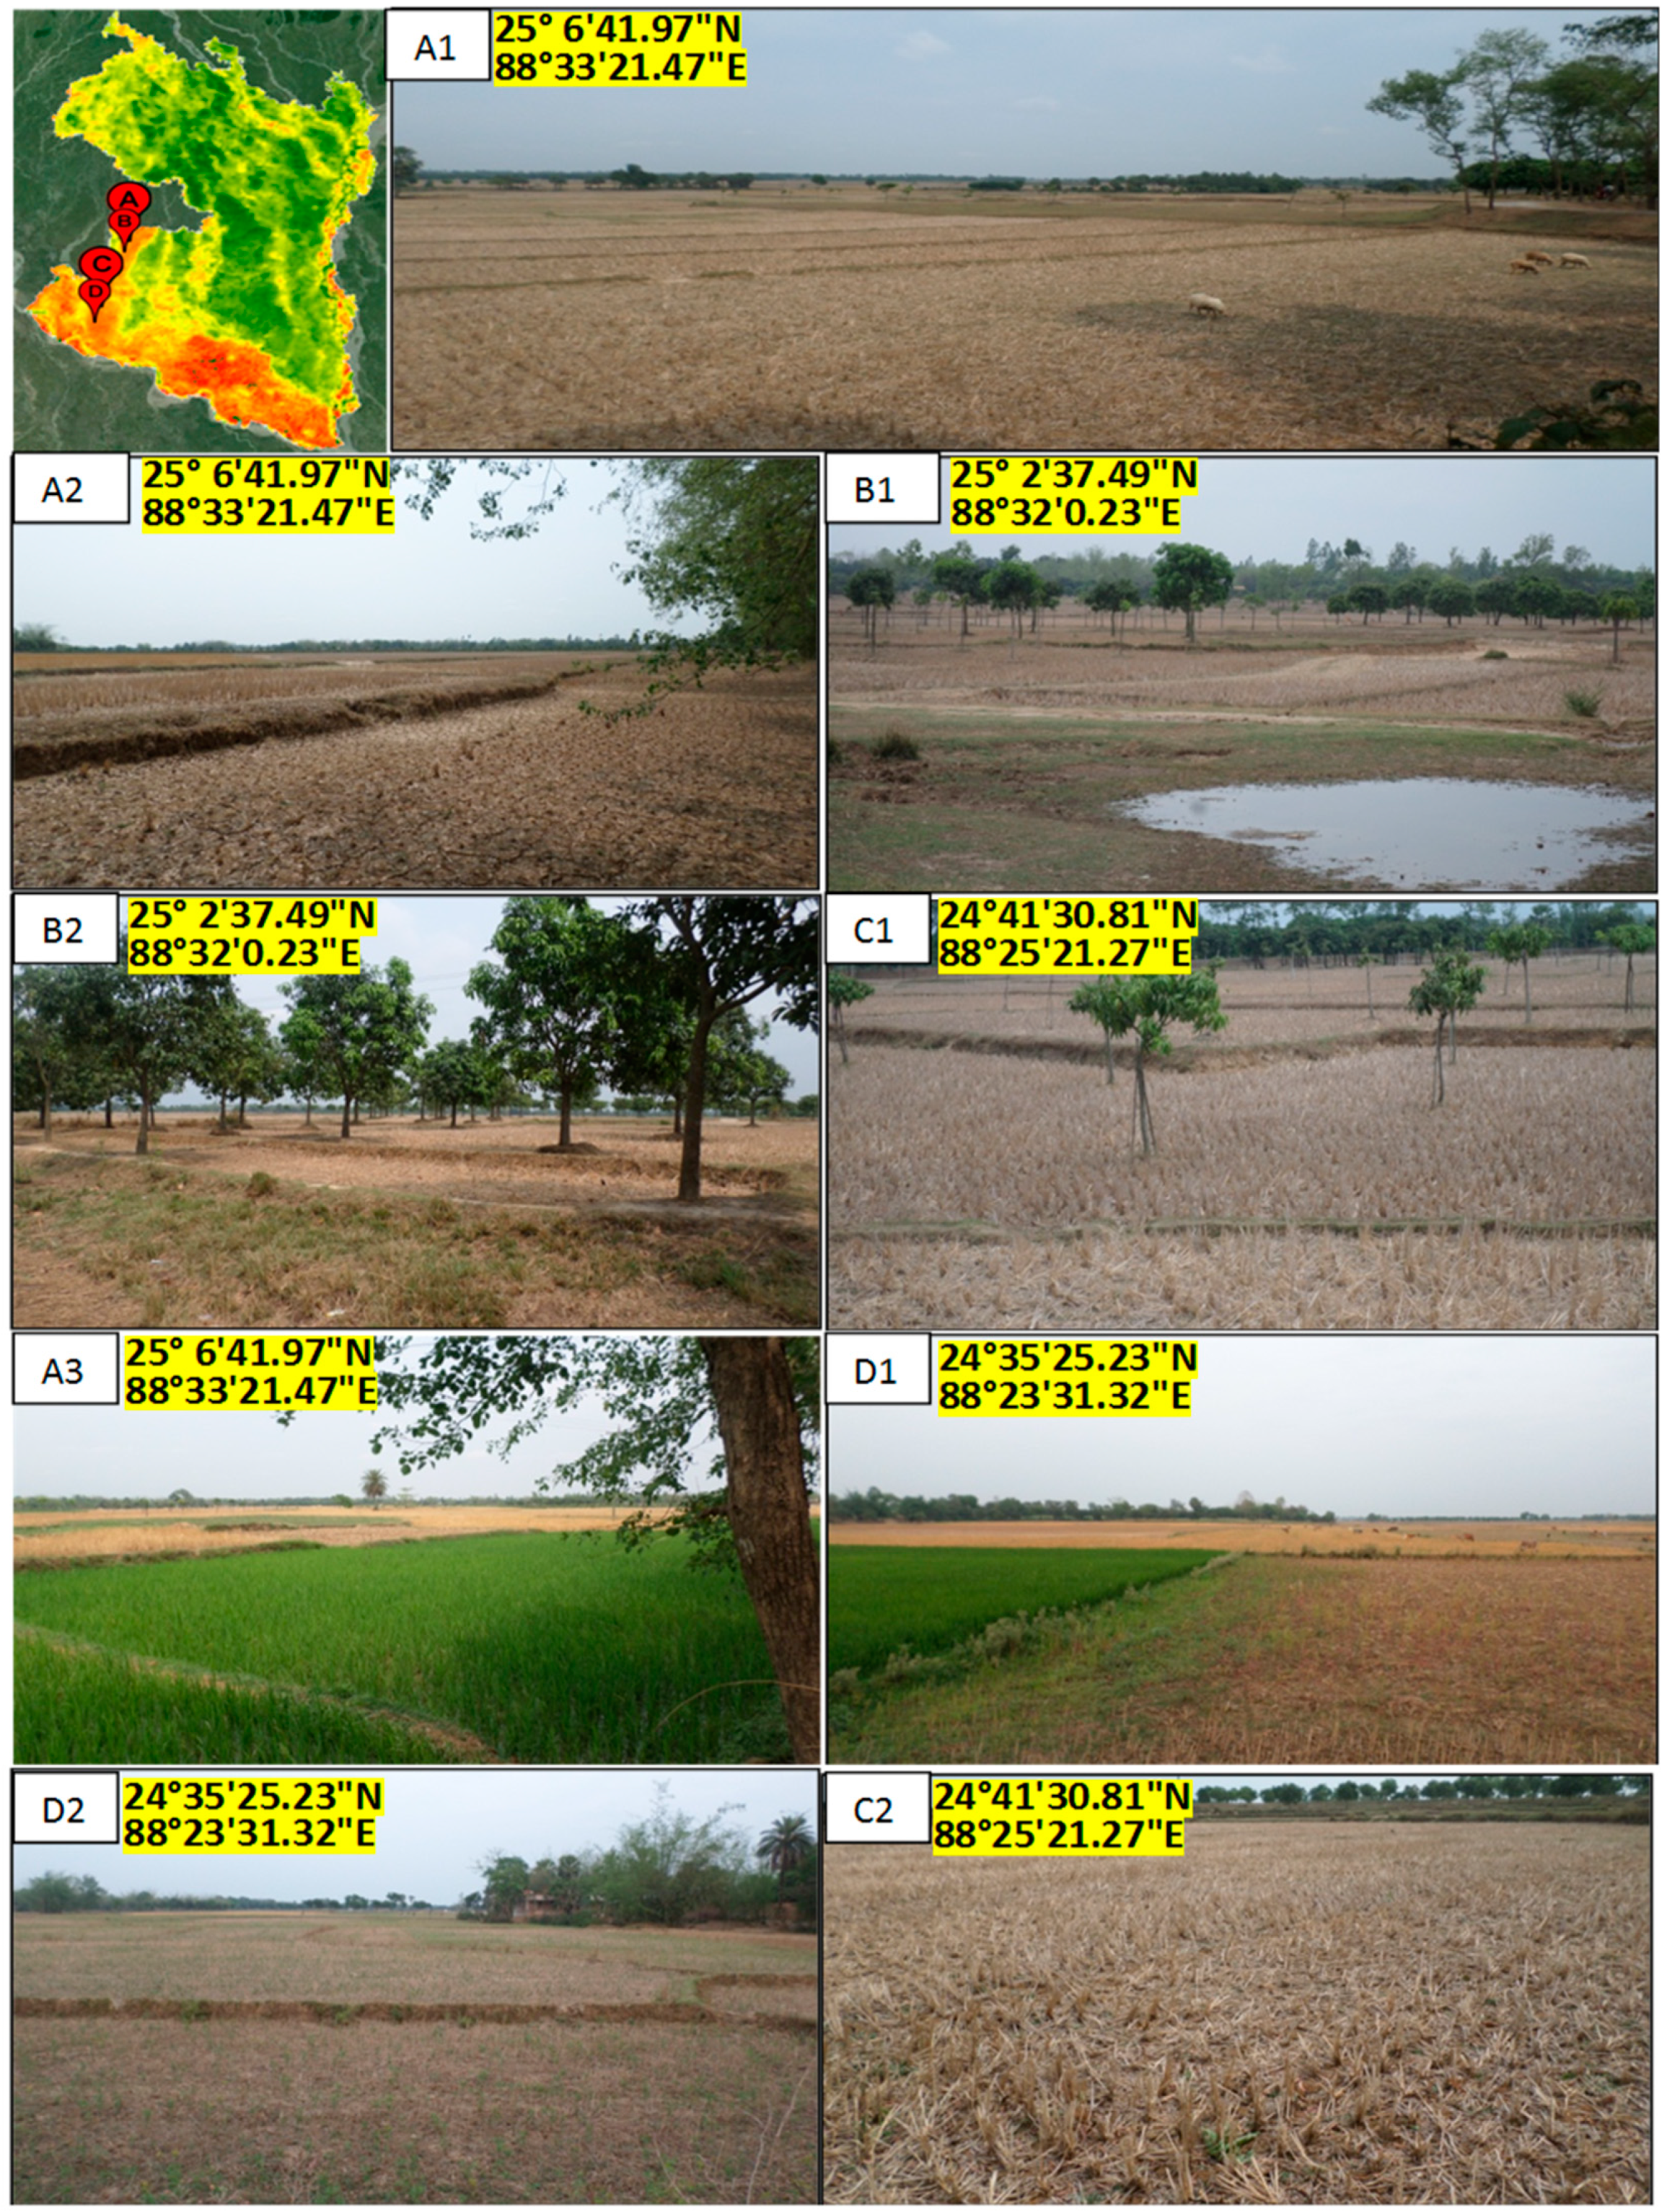
The field observations of highTVDI areas were carried out in the two regions where highTVDI areas are concentrated: (i) the High Barind Tract (HBT) and (ii) the Ganges River Floodplain (GRFP).
Field Observations in the HBT HighTVDI Area
Completely different ground conditions were observed in the highTVDI HBT region (
Figure 9) compared to the lowTVDI areas (
Figure 7). In this region, few green fields were observed, and most land parcels were fallow (
Figure 9A1) due to the inadequate soil moisture associated with low rainfall and high temperatures. The severity of dryness can be seen from the cracking of surface soil (
Figure 9A2), although a few days before the field investigation, there was a sudden rainfall event throughout the area, which moistened the soil and caused water logging in low-lying areas (
Figure 9B1). In this area, fallow land with dry bare soil was dominant, along with some HYV boro rice where water supply from a deep tube well was available (
Figure 9A3,D1). In addition, another type of land cover, i.e., plantations were observed (
Figure 9B2,C1,A3).
Field investigation indicates that a higher degree of soil moisture deficit prevails in this region during the late dry season (March and April) than in the lowTVDI areas (
Figure 7), unless there is water from irrigation or sudden rainfall. This field condition of severe soil moisture deficit or dryness is clearly in agreement with the obtained TVDI results (TVDI > 0.70) and indicates that the TVDI can effectively identify the drought-prone areas. The field observations confirmed that the main factors behind this dryness are the low rainfall and high temperature. The influence of irrigation can be seen in
Figure 9A3,D1, in which some parts of the field are irrigated (no dryness), while others are mostly dry and fallow. However, there is still a variation of TVDI values in the highTVDI area, which is probably attributed due to several minor factors observed during the field investigations, such as (i) different stages of plantation growth (
Figure 9B1,B2,C1), (ii) different grazing conditions (
Figure 9C2,D2), and (iii) occasional rainfall (
Figure 9B1).
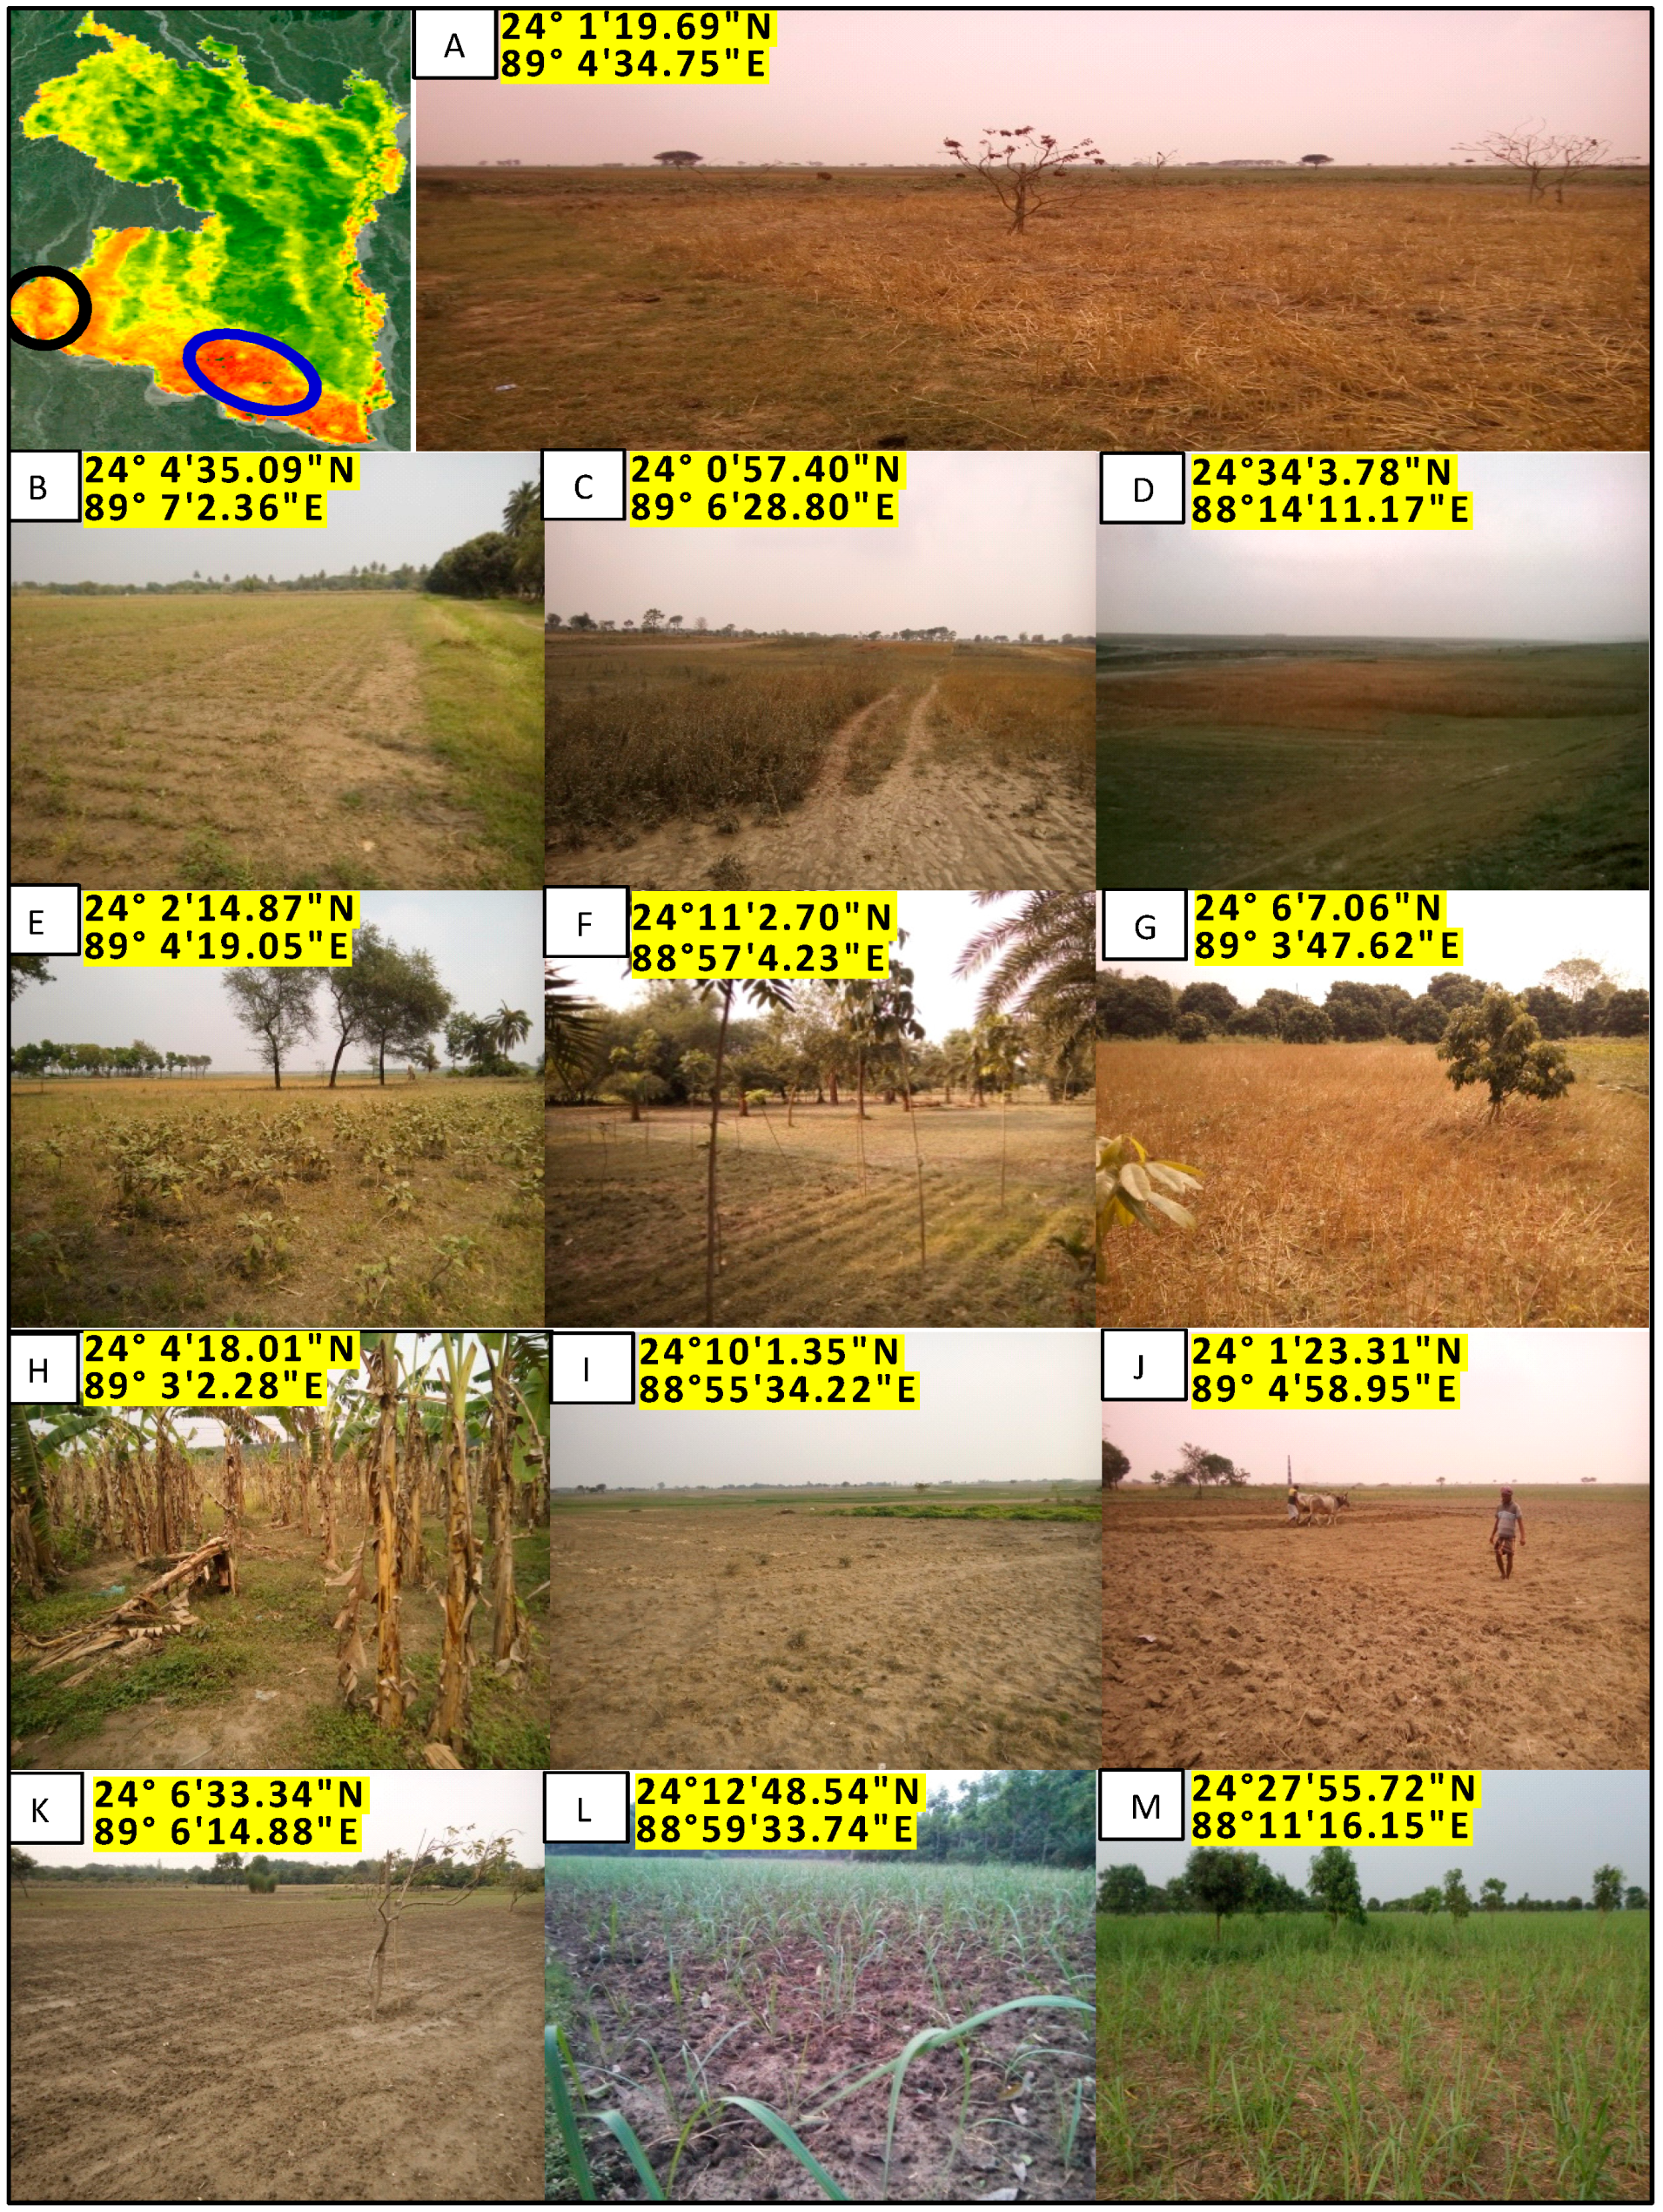
Field Observations in the GRFP HighTVDI Area
Several locations were visited during the field campaign in the highTVDI area of GRFP (marked with circles on
Figure 10). A large part of the area was fallow after harvesting of the previous crop (
Figure 10A), and it was covered by dry wheat straw, as well as different kinds of grass, weeds, small crops, and plantations (
Figure 10A–H). Completely empty parcels of ploughed land were also found in many parts of this region (
Figure 10I,J). The only significant field crop observed was sugarcane at different stages of growth (
Figure 10K–M), which was likely due to its lower water requirement and ability to obtain moisture from deeper soil compared to other crops. Overall, this field campaign found this area to be extremely dry and affected by different degrees of drought severity due to the lack of soil moisture caused by low rainfall and high temperatures.
The observable soil moisture deficit in the GRFP region of the study area is in agreement with the TVDI results, indicating a drought situation based on highTVDI values. Similar to the HBT region, the main factors underlying the severity of drought were the high temperatures and low rainfall in the absence of irrigation moisture. Indeed, there are several other factors such as plantations, cropping patterns, land use/cover, underground soil moisture, top soil conditions, etc., that play minor roles in the variation in drought conditions, resulting in the spatial and temporal variation in the TVDI results.
5. Discussion
This study investigated the future risk of drought across the northwestern part of Bangladesh by integrating remote sensing-based drought indices with climate variables and field observations. The results indicate that the remote sensing-based drought index, the TVDI, is very effective for identifying drought, as the TVDI results are comparable with and confirmed by field observations from both irrigated and non-irrigated surfaces. Our findings on the effectiveness of the TVDI agree with other studies that report that NDVI–LST-based drought indices; especially, the TVDI are effective for the investigation of soil moisture conditions across a range of land features and agro-ecological zones [
21,
49,
50,
55].
In addition to the effectiveness of the remote sensing-based drought index TVDI, we investigated the integrated use of the TVDI with the climate variables of temperature and rainfall by grouping the TVDI results into two groups: i.e., lowTVDI and highTVDI. In lowTVDI areas, we found a very large disagreement between the TVDI results and climate variables. For example, there are many areas where temperature is high and rainfall is low, but the TVDI result indicates no moisture deficit, even in the month of April (hottest month), and this is due to intensive irrigation practices. The field observations in lowTVDI areas confirm the TVDI results but do not correspond to the observed temperature and rainfall conditions. In contrast, we found that the TVDI results are in complete agreement with temperature and rainfall in highTVDI areas that are characterized by high temperature, low rainfall, and a lack of irrigation practices. Field observations from the highTVDI regions represent the TVDI outcomes and observable temperature and rainfall reasonably well. The TVDI results and climate variables suggest that the major factor behind the large lowTVDI area is groundwater-based irrigation, while temperature played a minor role. On the other hand, temperature and rainfall both played major roles in the highTVDI area, while irrigation had little or no impact.
The successful integrated use of TVDI, climate variables, and field observations in highTVDI areas indicate that this integration can effectively be used for the detection of the spatial and temporal variation in drought over the study area. However, the massive seasonal (
Figure 4a) long-term (
Figure 11) anomalies between lowTVDI areas and climate variables provided us with an indirect opportunity to understand/detect the potential risks of drought in this complex environmental setting where the lowTVDI and field observations tell us that there is no deficit of soil moisture due to intensive irrigation.
We observed from
Figure 11 that over the 14-year period, the average temperature is high (>32 °C) and the average rainfall is low (<35 mm/month), especially in the months of March and April, but 80% of the areas showed lowTVDI values. The percentage of lowTVDI areas (
Figure 11) indicated the actual ground conditions detected by the remote sensing-based TVDI index, and the field observations agreed with the TVDI outcomes. The indicated high temperature and low rainfall (
Figure 11) over the period would be expected to instigate meteorological drought as well as agricultural drought, and this is indeed observed in highTVDI regions, but not in the lowTVDI regions due to intensive irrigation.
Results suggest that the integrated use of the remote sensing-based TVDI index (which reveals ground conditions) and climate variables (which reveal climatic conditions), along with field observations (which provide in situ evidence), can reliably indicate the present state and future risk of drought in complex environmental settings. However, despite the current absence of agricultural drought,
Figure 11 clearly shows that meteorological drought exists in this region but did not trigger agricultural drought due to intensive irrigation by groundwater. Therefore, the future risk of severe agricultural drought cannot be neglected, since the current droughtless condition is completely dependent on anthropogenic factors (i.e., groundwater supply) rather than natural factors (i.e., rainfall and temperature).
Nevertheless, the future drought risk factor can be explained by the fact that in the past, several notable severe drought incidents were observed during this season in NWB due to low rainfall and high temperature. However, the drought scenario began to change after the introduction of irrigation activity in the mid-1980s, when the groundwater began to be used as a major source of water supply for rice cultivation [
36,
56].
It is obvious that at present, the groundwater based-irrigation systems, in NWB and throughout Bangladesh, not only significantly reduced the severity of drought, especially in the pre-monsoon season, but also helped meet the increasing food demands of the rapidly growing population in Bangladesh [
12,
56,
57]. However, there is a growing concern that the groundwater table in NWB as well as the other parts in Bangladesh is gradually declining in an unsustainable manner due to large abstraction by the irrigation projects [
58,
59,
60]. Prior to the widespread abstraction of groundwater for irrigation, water tables in the mostly unconfined aquifers of Bangladesh were generally shallow with a weak seasonal fluctuating trend [
56].
Study [
12] indicated that the groundwater table had a declining trend over the last 30 years (1981–2011), which implies that groundwater use is not sustainable in NWB and found that the magnitude of the decline in the groundwater table has been between −2.3 and −11.5 m during the pre-monsoon period. Studies indicated that this gradual declination is mainly due to the over exploitation of groundwater rather than recharging the aquifer, since about 95% of irrigation water for Boro rice cultivation comes from groundwater, which is extracted mainly by shallow tubewells (STW) and deep tubewells (DTW) [
56,
61]. Moreover, [
12] pointed out that in NWB, the most severely depleted areas are Rajshahi followed by Pabna, Bogra, Dinajpur, and Rangpur.
Therefore, considering the finding of this study that “there is meteorological drought in NWB” and the finding from existing literature [
12,
56,
59,
60] that the “underground water table is declining in an unsustainable manner due to large abstraction for irrigation”, it is highly likely that there will be an imbalance between the availability of underground water and requirement for irrigation. The probable scarcity of underground water in the future may transform the existing meteorological drought into severe agricultural drought, which is at present is observable in only a small part of the study area (NWB). As a result, we could say that there is a risk of drought in NWB as well as in Bangladesh if adequate measures are not going to be taken in advance to prevent the unwanted decline of underground water.
6. Conclusions
In this study, a simple approach for detecting drought and its potential risk in NWB is presented. Several statistical and causal relationships were utilized to compare the TVDI results with the climate variables (temperature and rainfall) and with field observations. Although Bangladesh has undergone several severe droughts in the past, massive irrigation practices have greatly changed the occurrence of severe drought in recent years. Therefore, at present, we can only easily observe meteorological drought, especially in the months of March and April. However, agricultural drought is observable in only a small part of the study area (NWB) at present, and it does not occur over the larger part of NWB, as the effect of meteorological drought is compensated by underground water-based irrigation.
However, the concern over the falling underground water table undoubtedly poses a potential risk of drought since not only the volume of underground water availability but also the exact amount of use of underground water are not well known. Moreover, the overwhelming population, food insecurity, and poor water management put unprecedented pressure on the groundwater, resulting in the gradual decline of the water level. Unfortunately, most of the farmers are still unaware of this situation, and no appropriate measures have been taken yet by the individual or respective authorities to minimize the risk of future underground water supply disruption. This implies that there is still a potential risk of drought in Bangladesh, and any disruption of the underground water supply for irrigation could trigger severe agricultural drought, with catastrophic impacts on food production in this densely populated country.
There were a few limitations of the integrated drought monitoring methodology presented in this study. These include, particularly, the limited amount of satellite data (from 2001–2014), the small number of field observations, as well as slight errors in the satellite product, which are inherent in long-term data processing. Despite these limitations, the study has achieved its objective of illustrating the current state and future risk of drought in this agriculture-based country. Further studies may need to incorporate remote sensing, climate data, and field observations to comprehend drought conditions not only in northwestern part of Bangladesh but also in a regional context. Indeed, there is a trend of rising temperatures and drought incidence in the south Asian region due to climate change, which is illustrated by the very recent severe drought in India.


 ,
, 


