Susceptibility Analysis of the Mt. Umyeon Landslide Area Using a Physical Slope Model and Probabilistic Method


Abstract
1. Introduction
2. Study Area
3. Spatial Datasets
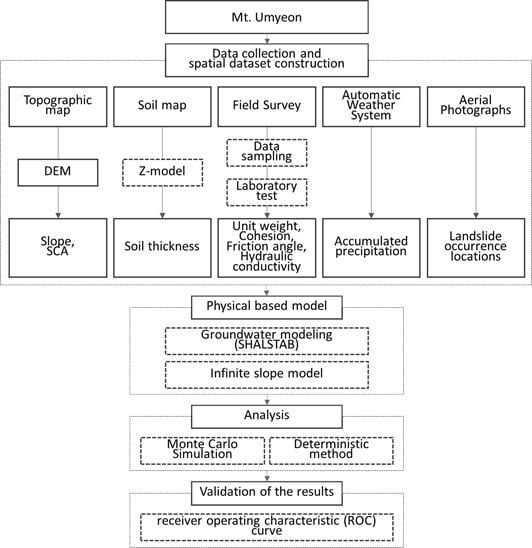
4. Methodology
4.1. Physically Based Model
4.2. Monte Carlo Simulation
4.3. Applications and Validation
5. Result
6. Discussion
7. Conclusions
Author Contributions
Funding
Conflicts of Interest
References
- Hong, H.; Shahabi, H.; Shirzadi, A.; Chen, W.; Chapi, K.; Ahmad, B.B.; Roodposhti, M.S.; Hesar, A.Y.; Tian, Y.; Bui, D.T. Landslide susceptibility assessment at the Wuning area, China: A comparison between multi-criteria decision making, bivariate statistical and machine learning methods. Nat. Hazards 2019, 96, 173–212. [Google Scholar] [CrossRef]
- Zhao, X.; Chen, W. Optimization of Computational Intelligence Models for Landslide Susceptibility Evaluation. Remote Sens. 2020, 12, 2180. [Google Scholar] [CrossRef]
- Lee, S.; Lee, M.-J.; Jung, H.-S.; Lee, S. Landslide susceptibility mapping using naïve bayes and bayesian network models in Umyeonsan, Korea. Geocarto Int. 2019, 1–15. [Google Scholar] [CrossRef]
- Pham, B.T.; Prakash, I.; Singh, S.K.; Shirzadi, A.; Shahabi, H.; Bui, D.T. Landslide susceptibility modeling using Reduced Error Pruning Trees and different ensemble techniques: Hybrid machine learning approaches. Catena 2019, 175, 203–218. [Google Scholar] [CrossRef]
- Son, J.; Suh, J.; Park, H.-D. GIS-based landslide susceptibility assessment in Seoul, South Korea, applying the radius of influence to frequency ratio analysis. Environ. Earth Sci. 2016, 75, 310. [Google Scholar] [CrossRef]
- Akgun, A.; Türk, N. Landslide susceptibility mapping for Ayvalik (Western Turkey) and its vicinity by multicriteria decision analysis. Environ. Earth Sci. 2010, 61, 595–611. [Google Scholar] [CrossRef]
- Lee, S.; Lee, M.-J.; Jung, H.-S. Data mining approaches for landslide susceptibility mapping in Umyeonsan, Seoul, South Korea. Appl. Sci. 2017, 7, 683. [Google Scholar] [CrossRef]
- Park, S.; Choi, C.; Kim, B.; Kim, J. Landslide susceptibility mapping using frequency ratio, analytic hierarchy process, logistic regression, and artificial neural network methods at the Inje area, Korea. Environ. Earth Sci. 2013, 68, 1443–1464. [Google Scholar] [CrossRef]
- Pradhan, A.M.S.; Kim, Y.-T. Spatial data analysis and application of evidential belief functions to shallow landslide susceptibility mapping at Mt. Umyeon, Seoul, Korea. Bull. Eng. Geol. Environ. 2017, 76, 1263–1279. [Google Scholar] [CrossRef]
- Bui, D.T.; Tsangaratos, P.; Nguyen, V.-T.; Van Liem, N.; Trinh, P.T. Comparing the prediction performance of a Deep Learning Neural Network model with conventional machine learning models in landslide susceptibility assessment. Catena 2020, 188, 104426. [Google Scholar] [CrossRef]
- Kavzoglu, T.; Colkesen, I.; Sahin, E.K. Machine Learning Techniques in Landslide Susceptibility Mapping: A Survey and a Case Study. In Landslides: Theory, Practice and Modelling; Springer: Berlin/Heidelberg, Germany, 2019; pp. 283–301. [Google Scholar]
- Dou, J.; Yunus, A.P.; Bui, D.T.; Merghadi, A.; Sahana, M.; Zhu, Z.; Chen, C.-W.; Khosravi, K.; Yang, Y.; Pham, B.T. Assessment of advanced random forest and decision tree algorithms for modeling rainfall-induced landslide susceptibility in the Izu-Oshima Volcanic Island, Japan. Sci. Total Environ. 2019, 662, 332–346. [Google Scholar] [CrossRef]
- Park, S.; Kim, J. Landslide susceptibility mapping based on random forest and boosted regression tree models, and a comparison of their performance. Appl. Sci. 2019, 9, 942. [Google Scholar] [CrossRef]
- Sevgen, E.; Kocaman, S.; Nefeslioglu, H.A.; Gokceoglu, C. A novel performance assessment approach using photogrammetric techniques for landslide susceptibility mapping with logistic regression, ANN and random forest. Sensors 2019, 19, 3940. [Google Scholar] [CrossRef]
- Abedini, M.; Ghasemian, B.; Shirzadi, A.; Bui, D.T. A comparative study of support vector machine and logistic model tree classifiers for shallow landslide susceptibility modeling. Environ. Earth Sci. 2019, 78, 560. [Google Scholar] [CrossRef]
- Shahri, A.A.; Spross, J.; Johansson, F.; Larsson, S. Landslide susceptibility hazard map in southwest Sweden using artificial neural network. Catena 2019, 183, 104225. [Google Scholar] [CrossRef]
- Tian, Y.; Xu, C.; Hong, H.; Zhou, Q.; Wang, D. Mapping earthquake-triggered landslide susceptibility by use of artificial neural network (ANN) models: An example of the 2013 Minxian (China) Mw 5.9 event. Geomat. Nat. Hazards Risk 2019, 10, 1–25. [Google Scholar] [CrossRef]
- Korea Forest Service. Detailed Strategy for Primary Policy; Korea Forest Service: Seoul, Korea, 2013.
- Burton, A.; Bathurst, J. Physically based modelling of shallow landslide sediment yield at a catchment scale. Environ. Geol. 1998, 35, 89–99. [Google Scholar] [CrossRef]
- Goetz, J.N.; Guthrie, R.H.; Brenning, A. Integrating physical and empirical landslide susceptibility models using generalized additive models. Geomorphology 2011, 129, 376–386. [Google Scholar] [CrossRef]
- Abbott, M.B.; Bathurst, J.C.; Cunge, J.A.; O’Connell, P.E.; Rasmussen, J. An introduction to the European Hydrological System—Systeme Hydrologique Europeen, “SHE”, 1: History and philosophy of a physically-based, distributed modelling system. J. Hydrol. 1986, 87, 45–59. [Google Scholar] [CrossRef]
- Flentje, P.N.; Miner, A.; Whitt, G.; Fell, R. Guidelines for landslide susceptibility, hazard and risk zoning for land use planning. Eng. Geol. 2007, 102, 3–4. [Google Scholar]
- Ho, J.-Y.; Lee, K.T.; Chang, T.-C.; Wang, Z.-Y.; Liao, Y.-H. Influences of spatial distribution of soil thickness on shallow landslide prediction. Eng. Geol. 2012, 124, 38–46. [Google Scholar] [CrossRef]
- Santoso, A.M.; Phoon, K.-K.; Quek, S.-T. Effects of soil spatial variability on rainfall-induced landslides. Comput. Struct. 2011, 89, 893–900. [Google Scholar] [CrossRef]
- Einstein, H.; Baecher, G. Probabilistic and Statistical Methods in Engineering Geology I. Problem Statement and Introduction to Solution. In Ingenieurgeologie und Geomechanik als Grundlagen des Felsbaues/Engineering Geology and Geomechanics as Fundamentals of Rock Engineering; Springer: Berlin/Heidelberg, Germany, 1982; pp. 47–61. [Google Scholar]
- El-Ramly, H.; Morgenstern, N.; Cruden, D. Probabilistic slope stability analysis for practice. Can. Geotech. J. 2002, 39, 665–683. [Google Scholar] [CrossRef]
- Hanss, M.; Turrin, S. A fuzzy-based approach to comprehensive modeling and analysis of systems with epistemic uncertainties. Struct. Saf. 2010, 32, 433–441. [Google Scholar] [CrossRef]
- Mostyn, G.; Li, K. Probabilistic Slope Analysis-State-of-Play. In Proceedings of the Conference on Probabilistic Methods in Geotechnical Engineering, Canberra, Australia, 10–12 February 1993; pp. 89–109. [Google Scholar]
- Mostyn, G.R.; Small, J. Methods of stability analysis. In Soil Slope Instability and Stabilization, 1st ed.; Walker, B.F., Fell, R., Eds.; Balkema: Rotterdam, The Netherlands, 1987; pp. 71–120. [Google Scholar]
- Nilsen, B. New trends in rock slope stability analyses. Bull. Eng. Geol. Environ. 2000, 58, 173–178. [Google Scholar] [CrossRef]
- Park, H.; West, T. Development of a probabilistic approach for rock wedge failure. Eng. Geol. 2001, 59, 233–251. [Google Scholar] [CrossRef]
- Park, H.-J.; West, T.R.; Woo, I. Probabilistic analysis of rock slope stability and random properties of discontinuity parameters, Interstate Highway 40, Western North Carolina, USA. Eng. Geol. 2005, 79, 230–250. [Google Scholar] [CrossRef]
- Pathak, S.; Nilsen, B. Probabilistic rock slope stability analysis for Himalayan conditions. Bull. Eng. Geol. Environ. 2004, 63, 25–32. [Google Scholar] [CrossRef]
- Lee, J.H.; Park, H.J. Assessment of landslide susceptibility using a coupled infinite slope model and hydrologic model in Jinbu area, Gangwon-do. Econ. Environ. Geol. 2012, 45, 697–707. [Google Scholar] [CrossRef][Green Version]
- Beven, K.J.; Kirkby, M.J. A physically based, variable contributing area model of basin hydrology/Un modèle à base physique de zone d’appel variable de l’hydrologie du bassin versant. Hydrol. Sci. J. 1979, 24, 43–69. [Google Scholar] [CrossRef]
- Montgomery, D.R.; Dietrich, W.E. A physically based model for the topographic control on shallow landsliding. Water Resour. Res. 1994, 30, 1153–1171. [Google Scholar] [CrossRef]
- Korean Society of Civil Engineers. Complementary Studies on the Cause of the Umyeonsan(Mt.); Korean Society of Civil Engineers: Seoul, Korea, 2012. [Google Scholar]
- Korean Geotechnical Society. Final Report on the Cause of Landslides in Umyeonsan(Mt.) Area and the Establishment of Restoration Measures; Korean Geotechnical Society: Seoul, Korea, 2012. [Google Scholar]
- All in Korea. What Are the Causes of Umyeonsan Landslide? Available online: http://www.allinkorea.net/22313 (accessed on 1 August 2020).
- MBC News. Causes of Umyeonsan Landslide, Other than ‘120 Years of Heavy Rain’. Availabe online: http://d.kbs.co.kr/news/view.do?ncd=2825925 (accessed on 1 August 2020).
- Jang, J.Y.; Park, H.J. Physically Based Landslide Susceptibility Analysis Using a Fuzzy Monte Carlo Simulation in Sangju Area, Gyeongsangbuk-Do. Econ. Environ. Geol. 2017, 50, 239–250. [Google Scholar]
- Jeong, S.; Kim, Y.; Lee, J.K.; Kim, J. The 27 July 2011 debris flows at Umyeonsan, Seoul, Korea. Landslides 2015, 12, 799–813. [Google Scholar] [CrossRef]
- Kim, S.; Paik, J.; Kim, K.S. Run-out modeling of debris flows in Mt. Umyeon using FLO-2D. J. Korean Soc. Civ. Eng. 2013, 33, 965–974. [Google Scholar] [CrossRef]
- Lee, G.-H.; Oh, S.-R.; Lee, D.-U.; Jung, K.-S. Analysis on Mt. Umyeon Landslide Using Infinite Slope Stability Model. In Proceedings of the Korea Water Resources Association Conference, Jeongseon, Gangwon, Korea, 17–18 May 2012; pp. 737–741. [Google Scholar]
- Lee, S.; Lee, M.-J. Susceptibility mapping of Umyeonsan using logistic regression (LR) model and post-validation through field investigation. Korean J. Remote Sens. 2017, 33, 1047–1060. [Google Scholar]
- Pradhan, A.M.S.; Kang, H.-S.; Lee, J.-S.; Kim, Y.-T. An ensemble landslide hazard model incorporating rainfall threshold for Mt. Umyeon, South Korea. Bull. Eng. Geol. Environ. 2019, 78, 131–146. [Google Scholar] [CrossRef]
- Kakaomap. Kakaomap. Available online: https://map.kakao.com/ (accessed on 1 July 2020).
- Saulnier, G.-M.; Beven, K.; Obled, C. Including spatially variable effective soil depths in TOPMODEL. J. Hydrol. 1997, 202, 158–172. [Google Scholar] [CrossRef]
- Crosta, G.B.; Frattini, P. Rainfall-induced landslides and debris flows. Hydrol. Process. Int. J. 2008, 22, 473–477. [Google Scholar] [CrossRef]
- Murphy, W.; Vita-Finzi, C. Landslides and seismicity-An application of remote sensing. In Proceedings of the Thematic Conference on Geologic Remote Sensing, Denver, CO, USA, 29 April–2 May 1991; pp. 771–784. [Google Scholar]
- Ward, T.J.; Li, R.-M.; Simons, D.B. Mapping landslide hazards in forest watersheds. J. Geotech. Geoenviron. Eng. 1982, 108, 319–324. [Google Scholar]
- Van Westen, C.; Terlien, M. An approach towards deterministic landslide hazard analysis in GIS. A case study from Manizales (Colombia). Earth Surf. Process. Landf. 1996, 21, 853–868. [Google Scholar] [CrossRef]
- Coduto, D.P. Geotechnical Engineering: Principles and Practices; Prentice Hall: Upper Saddle River, NJ, USA, 1999. [Google Scholar]
- O’loughlin, E. Prediction of surface saturation zones in natural catchments by topographic analysis. Water Resour. Res. 1986, 22, 794–804. [Google Scholar] [CrossRef]
- You, K.; Park, Y.; Lee, J.S.J.T.; Technology, U.S. Risk analysis for determination of a tunnel support pattern. Int. J. Adv. Struct. Eng. 2005, 20, 479–486. [Google Scholar] [CrossRef]
- Harr, M.E. Reliability-Based Design in Civil Engineering; Dover Publications: Mineola, NY, USA, 1984. [Google Scholar]
- Greco, V.R. Efficient Monte Carlo technique for locating critical slip surface. J. Geotech. Eng. 1996, 122, 517–525. [Google Scholar] [CrossRef]
- Park, H.-J. The Evaluation of Failure Probability for Rock Slope Based on Fuzzy Set Theory and Monte Carlo Simulation. J. Korean Geotech. Soc. 2007, 23, 109–117. [Google Scholar]
- Liu, C.-N.; Wu, C.-C. Mapping susceptibility of rainfall-triggered shallow landslides using a probabilistic approach. Environ. Geol. 2008, 55, 907–915. [Google Scholar] [CrossRef]
- Lumb, P. The variability of natural soils. Can. Geotech. J. 1966, 3, 74–97. [Google Scholar] [CrossRef]
- Oka, Y.; Wu, T.H. System reliability of slope stability. J. Geotech. Eng. 1990, 116, 1185–1189. [Google Scholar] [CrossRef]
- Luo, Z.; Atamturktur, S.; Juang, C.H.; Huang, H.; Lin, P.-S. Probability of serviceability failure in a braced excavation in a spatially random field: Fuzzy finite element approach. Comput. Geotech. 2011, 38, 1031–1040. [Google Scholar] [CrossRef]
- Phoon, K.-K.; Retief, J.V. Reliability of Geotechnical Structures in ISO2394; CRC Press: Boca Raton, FL, USA, 2016. [Google Scholar]
- Chowdhury, R.; Flentje, P.; Bhattacharya, G. Geotechnical Slope Analysis; CRC Press: Boca Raton, FL, USA, 2009. [Google Scholar]
- Fawcett, T. An introduction to ROC analysis. Pattern Recognit. Lett. 2006, 27, 861–874. [Google Scholar] [CrossRef]
- Lee, S.; Hyun, Y.; Lee, S.; Lee, M.-J. Groundwater Potential Mapping Using Remote Sensing and GIS-Based Machine Learning Techniques. Remote Sens. 2020, 12, 1200. [Google Scholar] [CrossRef]


| Data Source | Factors | Data Type | Scale |
|---|---|---|---|
| Aerial photograph a | Landslide location | Point | - |
| Topographical map b | Elevation [m] Slope gradient [°] Specific catchment area (SCA) | GRID | 1:5000 |
| Soil map c | Soil thickness [m] | Polygon | 1:25,000 |
| Field Investigation d | Unit weight [kN/m3] Cohesion [kPa] Friction angle [degree] Hydraulic conductivity [cm/s] | Point | - |
| Precipitation e | Rainfall intensity | Point | - |
| Name of Sampling Point | Unit Weight [kN/m3] | Cohesion [kPa] | Friction Angle [degree] | Hydraulic Conductivity [cm/s] |
|---|---|---|---|---|
| SP-1 | 13.770 | - | - | - |
| SP-2 | 13.530 | - | - | - |
| SP-3 | 11.405 | - | - | - |
| SP-4 | 12.405 | - | - | - |
| DP-1 | - | 7.45 | 22.34 | 4.67 × 10⁻⁴ |
| DP-2 | - | 6.86 | 25.11 | 8.08 × 10⁻⁴ |
| DP-3 | - | 11.89 | 27.01 | 7.92 × 10⁻⁴ |
| DP-4 | - | 8.36 | 24.78 | 8.08 × 10⁻⁴ |
| DP-5 | - | 9.73 | 25.75 | 3.54 × 10⁻⁴ |
| DP-6 | - | 7.51 | 24.70 | 4.45 × 10⁻⁴ |
| DP-7 | - | 11.24 | 27.14 | 2.08 × 10⁻⁴ |
| DP-8 | - | 20.06 | 29.42 | 1.80 × 10⁻⁴ |
| AWS Observatory Name | Number of Stations | Latitude | Longitude | Height above Sea Level (m) |
|---|---|---|---|---|
| Gwanak(ra) | 116 | 37.44526 | 126.96402 | 625 |
| Gangnam | 400 | 37.5134 | 127.04671 | 59 |
| Seocho | 401 | 37.48462 | 127.02601 | 33 |
| Yongsan | 415 | 37.52038 | 126.97611 | 31.73 |
| Namhyeon | 425 | 37.46336 | 126.9855 | 88 |
| Gwanak | 509 | 37.45284 | 126.95015 | 142 |
| Gwacheon | 590 | 37.44028 | 127.00249 | 47 |
| Method | Criteria for Establishing Unstable Area | Stable Area (%) | Unstable Area (%) | Landslide Prediction Rate (%) |
|---|---|---|---|---|
| Monte Carlo simulation | more than 1% | 42.25 | 57.75 | 95.15 |
| Monte Carlo simulation | more than 5% | 45.77 | 54.23 | 91.26 |
| Monte Carlo simulation | more than 10% | 47.98 | 52.02 | 90.29 |
| Deterministic analysis | less than 1 | 57.28 | 42.72 | 81.55 |
© 2020 by the authors. Licensee MDPI, Basel, Switzerland. This article is an open access article distributed under the terms and conditions of the Creative Commons Attribution (CC BY) license (http://creativecommons.org/licenses/by/4.0/).
Share and Cite
Lee, S.; Jang, J.; Kim, Y.; Cho, N.; Lee, M.-J. Susceptibility Analysis of the Mt. Umyeon Landslide Area Using a Physical Slope Model and Probabilistic Method. Remote Sens. 2020, 12, 2663. https://doi.org/10.3390/rs12162663
Lee S, Jang J, Kim Y, Cho N, Lee M-J. Susceptibility Analysis of the Mt. Umyeon Landslide Area Using a Physical Slope Model and Probabilistic Method. Remote Sensing. 2020; 12(16):2663. https://doi.org/10.3390/rs12162663
Chicago/Turabian StyleLee, Sunmin, Jungyoon Jang, Yunjee Kim, Namwook Cho, and Moung-Jin Lee. 2020. "Susceptibility Analysis of the Mt. Umyeon Landslide Area Using a Physical Slope Model and Probabilistic Method" Remote Sensing 12, no. 16: 2663. https://doi.org/10.3390/rs12162663
APA StyleLee, S., Jang, J., Kim, Y., Cho, N., & Lee, M.-J. (2020). Susceptibility Analysis of the Mt. Umyeon Landslide Area Using a Physical Slope Model and Probabilistic Method. Remote Sensing, 12(16), 2663. https://doi.org/10.3390/rs12162663