Evaluation Analysis of Landsat Level-1 and Level-2 Data Products Using In Situ Measurements


1
Imaging Center, Image Processing Laboratory, South Dakota State University, Brookings, SD 57007, USA
2
Cooperative Institute for Satellite Earth System Studies, Earth System Science Interdisciplinary Research Center, University of Maryland, College Park, MD 20740, USA
*
Author to whom correspondence should be addressed.
Remote Sens. 2020, 12(16), 2597; https://doi.org/10.3390/rs12162597
Submission received: 24 June 2020
/
Revised: 3 August 2020
/
Accepted: 6 August 2020
/
Published: 12 August 2020
Abstract
:Landsat Level-1 products are delivered as quantized and calibrated scaled Digital Numbers (DN). The Level-1 DN data can be rescaled to Top-of-Atmosphere (TOA) reflectance applying radiometric rescaling coefficients. Currently, the Level-1 product is the standard data product of the Landsat sensors. The more recent Level-2 data products contain surface reflectance values, i.e., reflectance as it would be measured at ground level in the absence of atmospheric effects; in the near future, these products are anticipated to become the standard products of the Landsat sensors. The purpose of this paper is to present a radiometric performance evaluation of Level-1 and Level-2 data products for the Landsat-7 Enhanced Thematic Mapper Plus (ETM+) and Landsat-8 Operational Land Imager (OLI) sensors. TOA reflectance and derived surface reflectance values from both data products were evaluated and compared to in situ measurements from eight test sites located in Turkey, Brazil, Chile, the United States, France, and Namibia. The results indicate an agreement between the ETM+ and OLI Level-1 TOA reflectance data and the in situ measurements of 3.9% to 6.5% and 3.9% to 6.0%, respectively, across all spectral bands. Agreement between the in situ measurements and both Level-2 surface reflectance data products were consistently decreased in the shorter wavelength bands, and slightly better in the longer wavelength bands. The mean percent absolute error for Level-2 surface reflectance data ranged from 3.3% to 10% for both Landsat sensors. The significant decay in agreement with the data collected in situ in the short wavelength spectral bands with Level-2 data suggests issues with retrieval of aerosol concentration at some sites. In contrast, the results indicate a reasonably accurate estimate of water vapor in the mid-infrared spectrum. Lastly, despite the less reliable performance of Level-2 data product in the visible spectral region (compared with Level-1 data) in both sensors, the Landsat-8 OLI Level-2 showed an improvement of surface reflectance product over all spectral bands in common with the Landsat-7 ETM+ Level-2 data.
1. Introduction
The Earth Observation (EO) sensors systems provide extensive information about the long-term patterns and changes in the Earth’s land, sea, and atmospheric systems in a relatively timely manner. An EO system digital image is a two-dimensional array of pixels with an intensity value known as its Digital Number (DN). The DN is commonly used to describe pixel values not yet converted into physically meaningful units (e.g., top-of-atmosphere (TOA) radiance or reflectance), which is the first step for using any remotely sensed data in quantitative investigations, through a process known as absolute radiometric calibration [1,2,3]. The next step is applying an atmospheric correction, i.e., removing scattering and absorption effects caused by the atmosphere [4,5]. Such correction is particularly significant in cases where multi-temporal sensor images are to be compared and analyzed. After these procedures, the image pixel values represent an estimate of the surface reflectance or Bottom-of-Atmosphere (BOA) reflectance level.
Historically, most EO images have been made available to various users in terms of calibrated DNs. Each community user would have to apply the radiometric calibration coefficients (often supplied by the sensor vendor or company/institution responsible for sensor operation) and perform atmospheric correction of the image to estimate the surface reflectance for their target(s) of interest. It is important to note that the surface reflectance estimated of the same target by different researchers could vary significantly due to the atmospheric correction techniques employed. Recently, however, surface reflectance products are increasingly becoming the standard product of EO sensors since these data are used to generate most global land products. In general, land-based sensors are designed to minimize atmospheric effects. Nevertheless, atmospheric effects are still difficult to correct reliably, especially the strong influence of aerosols in the visible region of the electromagnetic spectrum [6].
An example of this transition in the availability of data levels (DN versus surface reflectance) can be observed for the Landsat series sensors. The joint National Aeronautics and Space Administration (NASA) and the United States Geological Survey (USGS) Landsat program provides the longest continuous space-based record of Earth’s land surfaces in existence [7,8,9,10,11]. Landsat Level-1 data products consist of quantized and calibrated scaled DN values representing multispectral image data. These data can be rescaled to TOA reflectance and/or radiance using radiometric rescaling coefficients provided in a metadata file delivered with the Level-1 product. More recently, however, the USGS also offers users on-demand production of Level-2 data, consisting of pixel values estimating spectral reflectance as measured at the Earth’s surface, in the absence of atmospheric scattering or absorption effects [6,12,13,14,15]. According to Reference [11], the Level-2 data product is progressively understood as a minimum standard for analysis-ready data because of the increasing number of analyses relying on surface reflectance as input. As a result, Level-2 data is anticipated to become the standard product of the Landsat sensors. The motivation for this work is precisely related to this transition of data availability. The Landsat Level-1 data are very well understood—their calibration is well documented in the literature and, consequently, they are recognized worldwide for their quality of radiometric calibration. On the other hand, the quality of the level-2 data (surface reflectance) recently has started to be evaluated and understood.
In this context, this work aims to evaluate the radiometric performance of Level-1 and Level-2 data products obtained from the sensor Enhanced Thematic Mapper Plus (ETM+) on-board the Landsat-7 and the sensor Operational Land Imager (OLI) on-board the Landsat-8. Most of the previous evaluations works relied on an indirect comparison of TOA or BOA reflectance values to corresponding data simultaneously acquired by an independent, well-calibrated sensor such as the Moderate Resolution Imaging Spectroradiometer (MODIS) on-board TERRA satellite [16,17]; comparisons with these data, however, are challenging because the cross-analysis is limited by its much lower spatial resolution (250 m to 1 km vs. 30 m for the Landsat sensors). For the Landsat’s sensors, TOA or BOA reflectance data have also been evaluated with measurements obtained from the Aerosol Robotic Network (AERONET) [18,19,20] global sun-photometer network, which provides spectral aerosol optical depth, inversion aerosol products, and precipitable water vapor [21,22]. However, AERONET does not provide estimates of surface reflectance values. Hence, it is important to emphasize that traditional ground measurement in the field is the best approach to measure the true surface reflectance of the target (direct approach). Therefore, in this work, Landsat Level-1 and Level-2 product data were compared to the corresponding reflectance values derived from in-situ measurements at eight test sites, obtained during previous field campaigns for radiometric calibration purposes.
The paper is structured as follows. Section 2 reviews the relevant characteristics of the Level-1 and Level-2 data of the ETM+ and OLI sensors. Section 3 describes the location and features of the eight test sites whose measurements were used in this study (Tuz Gölü in Turkey; Crop Region in Brazil; Atacama Desert in Chile; Algodones Dunes in the United States; South Dakota State University Image Processing Laboratory (SDSU IP Lab) vegetative calibration site in the United States; Railroad Valley Playa in the United States; La Crau in France; and Gobabeb Desert in Namibia). Section 4 presents the analysis methodology applied to evaluate and compare the Level-1 and Level-2 data with the in situ measurements. Finally, Section 5 and Section 6, respectively, present and discuss the results, followed by concluding remarks.
2. Landsat-7 ETM+ and Landsat-8 OLI Product Levels (Level-1 and Level-2 Data)
The Landsat program is a series of EO satellites, co-managed by the USGS and NASA. The program offers the longest continuous space-based image record of the Earth’s land surfaces [7,8,9,10,11]. The first satellite in the series, Landsat-1, was launched on 23 July 1972. The latest satellite (Landsat-8) was launched on 11 February 2013. Landsat-9, scheduled for a December 2021 launch [11], will continue the Landsat program’s key role in monitoring, understanding, and managing land resources.
In 2016, the USGS began restructuring the multi-sensor Landsat image archive into a formal Collection structure [23]. According to the USGS, the new structure guarantees that Landsat products provide a consistent archive of known data quality to support individual and cross-sensor time-series analyses and data layer “stacking”. The new structure also ensures a continuous improvement of the Landsat archive and access to all data as they are acquired. In 2017, the resulting dataset, Landsat Collection 1, was released. The data products are freely available to download through the USGS’ EarthExplorer site [24].
Collection 2 represents the second major reprocessing effort applied to the Landsat archive. Among its features, updates to sensor radiometric calibration and geometric accuracy are expected, and product absolute geodetic accuracy will be significantly improved over Collection 1 through the use of improved ground control points based on a global digital elevation model source in geometric processing. Release of Collection 2 products is currently anticipated for 2020 [25,26]; however, Collection 1 products will remain available for at least one year after public release of Collection 2 data. Additional details describing the Landsat Collections processing/archiving efforts can be found on the USGS website.
2.1. Landsat Level-1 Data: Top of Atmosphere (TOA) Reflectance
Landsat Collections Level-1 products contain radiometrically and geometrically corrected image data for each spectral band, represented as calibrated and quantized scaled Digital Numbers (DN). The Landsat-7 ETM+ and Landsat-8 OLI data are formatted as 8-bit and 16-bit unsigned integers, respectively. Landsat Level-1 DN data can be rescaled to TOA radiance Equation (1) or TOA reflectance Equation (2) using radiometric rescaling coefficients provided in the metadata file presented with the image product [27,28].
where is the TOA spectral radiance (Watts/m2.srad.μm); and are the band-specific multiplicative and additive radiance rescaling factor, respectively, from the metadata; and is the calibrated and quantized standard product pixel values (Digital Numbers).
where is the TOA spectral reflectance; and are the band-specific multiplicative and additive reflectance rescaling factor, respectively, from the metadata; and is the calibrated and quantized standard product pixel values (Digital Numbers).
The quantity does not include a correction for the solar elevation angle. This correction factor is left out of the Level 1 scaling. The correction may be applied to utilize the scene-center solar elevation angle provided in the metadata or per-pixel solar elevation angle across the scene through the angle coefficient file, which allows users to generate sensor viewing angles (elevation and azimuth) and solar illumination angles (elevation and azimuth). The conversion to corrected TOA reflectance is as follows:
where is TOA planetary reflectance; is the local sun elevation angle; and is the local solar zenith angle, with = 90°.
2.2. Landsat Level-2 Data: Bottom of Atmosphere (BOA) Reflectance (Surface Reflectance)
The atmosphere between the satellite sensor and a target on the Earth’s surface is composed of different gases that potentially absorb and/or scatter the incident electromagnetic radiation (sunlight). Landsat Level-2 products are derived from the corresponding Level-1 products, with additional correction(s) applied to remove these temporally, spatially, and spectrally varying atmospheric effects. The Level-2 product pixel values then provide estimates of target surface reflectance as measured in-situ, in the absence of atmospheric scattering or absorption effects. To derive the Level-2 product, the Level-1 data must meet the following criteria: (a) the solar zenith angle during image acquisition should be less than 76°; and (b) the required auxiliary data inputs to generate a scientifically viable product must be readily available. At a minimum, the set of inputs should include atmospheric aerosol, ozone, and water vapor concentrations [29,30].
The Level-2 data products used in this study were generated by the USGS Earth Resources Observation and Science (EROS) on-demand processing system. The USGS EROS Science Processing Architecture (ESPA) on-demand corrects satellite images for atmospheric effects to create Level-2 data products from Level-1 data. Landsat-8 OLI and Landsat-7 ETM+ Level-2 surface reflectance data products are generated, respectively, using the Land surface reflectance Code (LaSRC) and the Landsat Ecosystem Disturbance Adaptive Processing System (LEDAPS) algorithms [29,30]. The LEDAPS and LaSRC surface reflectance algorithms correct for the temporally, spatially, and spectrally varying scattering and absorbing effects of atmospheric gases and aerosols, which is essential to derive the Earth’s reflectance surface values.
LEDAPS was formerly developed through a National Aeronautics and Space Administration (NASA) Making Earth System Data Records for Use in Research Environments (MEaSUREs) grant by the NASA Goddard Space Flight Center (GSFC) and the University of Maryland [13]. In 2010, the USGS incorporated the LEDAPS algorithms into an initial operating capability for generating and distributing atmospherically adjusted Landsat surface reflectance data products. The LEDAPS algorithm applies MODIS sensor on-board TERRA satellite atmospheric correction routines [31]. In summary, the processing involves conversion of the ETM+ Level-1 data to TOA reflectance, then application of the Second Simulation of a Satellite Signal in the Solar Spectrum (6S) radiative transfer code to generate BOA reflectance [12,31,32,33]. The atmospheric correction LEDAPS code relies heavily on independent auxiliary data sources inputs for pressure, temperature, water vapor, ozone, and topography and uses a scene-dependent dense dark vegetation (DDV) approach for aerosol retrieval [13,29,34]. For LEDAPS, ancillary data are gathered either from other satellite-based observations or aggregation of ground and satellite data [13,29,34]. For example, water vapor and ozone quantity information are derived, respectively, from NCEP (National Centers for Environmental Prediction) and TOMS (Total Ozone Mapping Spectrometer). One of the LEDAPS limitations is the aerosol retrieval since some scenes lacked DDV for optimal aerosol estimation. As previously mentioned, aerosol is one of the key atmospheric parameters to perform atmospheric correction.
The LaSRC algorithm was also developed by NASA and GSFC. The LaSRC correction code depends on the inversion of the relative equation in the Lambertian case, which accounts for a simplified coupling of absorption by atmospheric gases and scattering by molecules and aerosols as implemented in the 6S code [6,12,15]. Atmospheric correction routines are then applied to Landsat-8 Level-1 TOA reflectance data, using auxiliary input data. For LaSRC, auxiliary input data, such as water vapor, ozone, and aerosol optical depth are assimilated from both TERRA and AQUA MODIS observations. Spatial and temporal interpolations are performed to resample the auxiliary data inputs to correspond to the target area imaged during the Landsat overpass. The resulting image is delivered as the Landsat-8 Level-2 surface reflectance product. Additional details about the LaSRC algorithms and Landsat-8 surface reflectance data products can be found in the Land Surface Reflectance Product Guide [30].
3. In Situ Measurements
The Landsat Level-1 and Level-2 data products were evaluated and compared using the in situ measurements. This section presents the locations and relevant characteristics of the eight test sites from which the measurements used in this study were obtained, such as land cover, average weather conditions, and typical TOA and BOA reflectance values.
Measurements from five of the sites were collected by on-site personnel using a traditional field campaign methodology. These sites were (1) Tuz Gölü in Turkey; (2) Crop Region in Brazil; (3) Atacama Desert in Chile; (4) Algodones Dunes in the United States; and (5) South Dakota State University Image Processing Laboratory (SDSU IP Lab) vegetative calibration site in the United States. Three additional sites that are part of the automated Radiometric Calibration Network (RadCalNet) were also used in this study: (6) the Railroad Valley Playa in the United States; (7) La Crau in France; and (8) the Gobabeb Desert in Namibia. It is important to note that these test sites represent a variety of land cover (vegetation, saline lake, sand, etc.), which effectively allows coverage across a wider portion of the ETM+ and OLI dynamic ranges. Summary information on the eight sites is presented in Table 1.
3.1. Tuz Gölü—Turkey
An international remote sensing calibration expert’s team, representing space agencies from ten different countries, conducted a field campaign at Tuz Gölü, Turkey from 13 to 27 August 2010. This field campaign was sponsored by the Committee on Earth Observation Satellites (CEOS) Working Group on Calibration and Validation (WGCV) and the European Space Agency (ESA), and it was hosted by Tubitak Uzay, the national space agency in Turkey [35,36]. The campaign focused on surface reflectance factor measurement.
Tuz Gölü is a saline lake exhibiting seasonally dependent water level variation. During the summer, the lake dries out through evaporation and forms a wide marsh covered with a salt layer approximately 30 cm thick [37]. As a result, the site has a short period during the year where radiometric calibration measurements can be acquired in an area with a sufficiently dry surface. For this study, the reflectance values of the ground measurements were obtained over a 100 m by 300 m size area. The ground reflectance coefficient of variation (related to the spatial uniformity of the site), defined as the ratio of the reflectance standard deviation and the mean, is approximately 2.5% at wavelengths between 350 nm and 1500 nm, and approximately 4.0% at wavelengths between 1500 nm and 2500 nm. The Tuz Gölü test site represents a site exhibiting a high degree of atmospheric aerosol loading (aerosol optical depth at 550 nm was around 0.2 during the August 2010 campaign).
The BOA and TOA reflectance at the Tuz Gölü Site is presented in Figure 1. At visible wavelengths, the site is quite bright—up to 50% reflectance. At longer wavelengths, the site has lower reflectance—down to less than 10% reflectance. The gaps around 1400 nm and 1800 nm are due to strong water vapor absorption near those wavelengths, and the 2400 nm–2500 nm spectral region shows larger variability primarily due to decreasing signal level. Response gaps in these three spectral regions (around 1400 nm, 1900 nm, and 2400 nm) can be observed at almost all the sites used in this work as will be presented in the next subsections.
3.2. Crop Region Site—Brazil
From 23 to 26 July 2014, a field campaign was conducted by the Brazilian National Institute for Space Research (INPE) institution team at the Marechal Rondon farm, near the city of Luís Eduardo Magalhães, in the west of the Brazilian state of Bahia. The city is known as a major agribusiness center in Brazil. The selected surface at the farm is located at an altitude of 850 m and consists primarily of bare soil quartz sand with small pieces of cotton residues. The site area typically exhibits low atmospheric aerosol loading: the aerosol optical depth at 550 nm ranged from 0.027 to 0.062 during the July 2014 campaign.
The reflectance values of the ground measurements were obtained over a 300 m by 300 m size area. The overall spatial coefficient of variation at the test site varied between approximately 6.0% to 9.0% over the wavelengths. Figure 2 shows the observed BOA and TOA reflectance profiles measured at the site. The average surface reflectance was up to 40%, and it was consistent with a typical spectral reflectance curve for bare soil.
3.3. Atacama Desert—Chile
The third test site used in this work is an area in the Atacama Desert, located in the San Pedro de Atacama region of northern Chile. From 19 to 22 August 2014, a joint field campaign was conducted at the Atacama Desert site, involving three different institutions: the Universidad de Chile, the Chilean Servicio Aerofotogramétrico (SAF), and the National Institute for Space Research (INPE) from Brazil. This was the first time the Atacama Desert was explored for calibration purposes [38,39].
The Atacama Desert theoretically exhibits characteristics favorable for use in absolute radiometric calibration test site. It is known as the driest place on Earth [40]; as observed in Reference [41], the Atacama region presents low precipitation levels: the weather station situated at Peine city recorded an average precipitation level of approximately 23.1 mm between 1977 and 1991. Its average elevation is approximately 2400 m above mean sea level and stretches approximately 600 miles (1000 km). The test site itself is located approximately 28 km south of San Pedro de Atacama city and is easily accessible by road [38,39]. The area region typically exhibits low atmospheric aerosol loading: the aerosol optical depth at 550 nm ranged from 0.077 to 0.114 during the August 2014 campaign.
The reflectance values of the ground measurements were obtained over a 300 m by 300 m size area. The BOA and TOA reflectance profiles measured at the site are presented in Figure 3. The average reference surface reflectance factor in the spectral region from 350 to 2500 nm ranged from 10% to 30% and its spatial uniformity (coefficient of variation) was within 2–4%. As can be seen in Figure 3, the site has high spectral uniformity. Since the Atacama region is considerably dry, this is the only site where there is no gap in the 1400 nm and 1900 nm spectral regions due to water vapor absorption. As mentioned earlier, the Atacama Desert is recognized as the driest place on Earth.
3.4. Algodones Dunes Site—USA
On 9–13 March 2015, a joint field campaign was conducted at Algodones Dunes (Imperial Sand Dunes Recreation Area) and involved five different teams: the Arizona Remote Sensing Group (RSG), South Dakota State University (SDSU), the Rochester Institute of Technology (RIT), the University of Lethbridge, and NASA Goddard Space Flight Center (GSFC) [2,42]. Algodones Dunes is located in the southwestern portion of the United States of America, in the state of California. The Algodones Dunes test site region exhibited a low aerosol loading: the aerosol optical depth at 550 nm was less than 0.07 during the March 2015 campaign.
For this study, the reflectance values from ground measurements were obtained over a 160 m by 300 m area. The average spatial coefficient of variation of the spectral measurements ranged from 2.5% to 5.0%, indicating that the test site exhibits a spatial uniformity better than 5%. The BOA and TOA reflectance of the Algodones Dunes site is presented in Figure 4. The reference surface in Brazil has a typical spectral reflectance curve for soil. The average surface reflectance varied from around 10% to 50% from 350 nm to 2500 nm wavelength.
3.5. SDSU Vegetative Site—USA
The South Dakota State University Image Processing Laboratory (SDSU IPLAB) was founded in 1988 to conduct research in satellite image processing. The SDSU IPLAB has become widely recognized for its contributions to the field of satellite sensor radiometric calibration. Many groups performing vicarious reflectance-based calibration use bright desert or other arid sites as the target, with relatively dry, low-aerosol atmospheres that can be more straightforwardly modeled. The SDSU IPLAB, however, is the only group that consistently perform the same calibration at a vegetative site (the SDSU Vegetative Site). This approach is more challenging due to the lower signal and/or higher noise levels produced by a darker target, and atmospheric conditions that require more complex modeling. However, the results may be considered more valuable, as the national and international remote sensing communities have expressed great interest in analysis based on vegetative targets.
The SDSU Vegetative site is located in Brookings, South Dakota, USA. It is a predominantly grass-covered surface, located at an altitude of 505 m above mean sea level. Ground measurements were acquired over an area of approximately 200 m by 180 m. The test site exhibits a high variety of aerosol loading through the year: the aerosol optical depth at 550 nm ranged from approximately 0.05 to 0.3 during the 2019 field campaign. The average coefficient of variation in the 350 nm to 2500 nm spectral region was within approximately 3% to 9%. The grass at the site is routinely maintained during the spring, summer, and fall months so that changes in the bidirectional reflectance distribution function (BRDF) due to the structure of the grass are minimized [43,44].
The typical BOA and TOA reflectance profiles of the SDSU Vegetative Site are presented in Figure 5. The SDSU IPLAB site exhibit characteristic behavior for a reflectance profile obtained from a vegetated site: lower reflectance (less than 10%) in the visible region and higher reflectance (up to 40%) in the near-infrared region between 800 nm and 1300 nm.
3.6. RVUS RadCalNet Site—USA
The Radiometric Calibration Network (RadCalNet) is an initiative of the Committee on Earth Observation Satellites (CEOS) Working Group on Calibration and Validation (WGCV). RadCalNet was created in 2013 to support post-launch radiometric calibration and validation of Earth Observation sensors [45,46]. It is a free and open access service, currently consisting of four international test sites providing automated in-situ reflectance measurements (BOA and TOA reflectance values). This section and the next sections describe three of the RadCalNet sites used in this work: the Railroad Valley Playa (US), La Crau (France), and Gobabeb (Namibia).
The Railroad Valley Playa, in the state of Nevada, US (RVUS) is a dry lakebed site, consisting of compacted clay-rich lacustrine deposits [45,46,47]. The site is in a remote area with limited public access; it is maintained and operated by the University of Arizona (UoA) Remote Sensing Group (RSG). Ground measurements at the RVUS are representative of a square area of approximately 1 km by 1 km. During 2019 campaign, an average aerosol optical depth at 550 nm of approximately 0.045 was observed. The average surface reflectance coefficient of variation in the 350 nm to 2500 nm spectral region was within approximately 3–7%. The typical BOA and TOA reflectance values of the site are presented in Figure 6; they are consistent with typical profiles obtained from clay-based playas.
3.7. LCFR RadCalNet Site—France
The RadCalNet site at La Crau in southeastern France (LCFR) is located within the Réserve Naturelle Nationale Des Coussouls de Crau. Currently, the Centre National d’Etudes Spatiales (CNES) maintains and operates the site. It is accessible via a ~6 km gravel road off a nearby paved road, however, access to the gravel road is restricted by the reserve [45,46,48]. The site itself consists of sparse vegetation cover in a primarily pebbled/gravel base. The La Crau region has a typically dry and sunny Mediterranean climate; consequently, the test site exhibits significant variation in atmospheric aerosol loading throughout the year: aerosol optical depth at 550 nm typically varies between approximately 0.05 and 0.5.
Ground reflectance measurements at the site are representative within area of approximately 500 m by 500 m. The average spatial coefficient of variation of the test site was 3% to 8% across all wavelengths. The LCFR site BOA and TOA reflectance values estimated on 9 September 2019 are presented in Figure 7. The average surface reflectance ranged from approximately 5% to 30% at wavelengths between 350 nm to 1000 nm, and from approximately 25% to 50% at wavelengths between 1000 nm to 2500 nm.
3.8. GONA RadCalNet Site—Namibia
The last test site employed in this study is the RadCalNet Gobabeb (GONA) site. GONA is located near the Gobabeb Research and Training Centre in Namibia, within the Namib-Naukluft National Park. Surface cover at the site consists mainly of sand and gravel. The site is operated jointly by the European Space Agency (ESA), the National Physical Laboratory of the United Kingdom, and CNES [45,46,49]. GONA has been providing data since July 2017. During 2019, the aerosol optical depth at 550 nm at the site averaged approximately 0.1. The GONA ground reflectance spectra are representative of 1 km by 1 km area. The GONA site BOA and TOA reflectance on 10 October 2019 are presented in Figure 8. The GONA site has spatial uniformity within approximately 3–5.5%.
4. Data Evaluation and Comparison Methodology
The Landsat Level-1 and Level-2 data products were evaluated using in-situ radiometric measurements acquired from in-situ ground field measurements at the sites described in Section 3. The ground campaigns can be grouped in two different approaches. The first approach employed the traditional method of field collection. Traditional manned field campaigns require personnel must be present particularly for surface reflectance measurement. The second approach employed the data from the RadCalNet. The RadCalNet provides an automated surface and atmosphere data as part of a network, including multiple sites for the goal of EO sensor radiometric calibration in the visible to shortwave infrared spectral range [45,46].
The in situ radiometric measurements involve primarily two distinct types of measurements: (a) surface radiance/reflectance retrieval; and (b) atmospheric parameters. Surface reflectance is the ratio of the total electromagnetic radiation reflected by a surface to the total incident electromagnetic radiation on it. To acquire the surface reflectance, an Analytical Spectral Devices (ASD) spectroradiometer and a Spectralon Lambertian panel were utilized. The only exception is the RadCalNet Railroad Valley Playa site, which relies on a suite of four ground-viewing radiometers (GVRs) [45].
The surface reflectance factor is determined from the ratio of the target surface radiance () to the radiance of the Spectralon panel ():
where k is the panel correction factor estimated in the laboratory. For simplification purposes, spectral and angular dependencies of the target and panel radiances were omitted.
Atmospheric data were collected simultaneously with the surface reflectance measurements using a sun-photometer. A sun-photometer consists of a narrow field of view equipment that is pointed at the sun. The sun-photometer output signal is proportional to the solar irradiance, which can be modeled according to Beer-Lambert-Bouguer attenuation [38]. Through application of the Langley plot method, various optical properties of the local atmosphere at the site can be estimated.
Lastly, the data products derived from the in situ measurements (atmospheric and surface reflectance data) and geometries of the sensor/satellite and sun during the sensor overpass over the test surface were used as inputs to a radiative transfer code model that predicts the corresponding TOA radiance/reflectance. The objective is to consider the interference of the atmosphere to radiometric values collected in the field. In this work, the MODerate resolution atmospheric TRANsmission (MODTRAN) radiative transfer code was applied [50]. The general flowchart for Landsat Level-1 and Level-2 data product evaluation are presented in Figure 9 and Figure 10, respectively.
The in situ measurements are hyperspectral reflectance data (see Figure 1, Figure 2, Figure 3, Figure 4, Figure 5, Figure 6, Figure 7 and Figure 8). In order to be able to compare this ground data with the data generated by the sensor, the hyperspectral in situ data (surface and TOA reflectance) were weighted according to the Spectral Response Function (SRF) of the respective sensor (Landsat-7 ETM+ and Landsat-8 OLI), according to the equation:
where is the weighted reflectance for each spectral band of the sensor; is the hyperspectral reflectance profile (in situ surface or TOA reflectance); and SRF is the Spectral Response Function [unitless]. The SRF of the Landsat-7 ETM+ and Landsat-8 OLI can be found at USGS website [51].
The degree of correspondence between the in situ measurement and the Landsat data Level-1 and Level-2 data product was examined by a linear regression using the Method of Least Squares (MLS) analysis of data. The MLS is probably the most popular technique to determine the best-fit to data. In this method, the unknown parameters are estimated by minimizing the square of the difference between the experimental data and the fitting function, considering the uncertainty:
where: E is the error; (xi, yi, σyi) is experimental data set; xi is the independent variable; yi is the dependent variable, usually obtained experimentally; σyi is the uncertainty of yi; and the f(xi) is the best-fit function.
In the MLS, the parameters of the function f(xi) must be such as to minimize the error, E. Candidates for minimum point are those for which the partial derivatives of E with respect to each of the parameters equal zero. The standard MLS method works with uncertainties in the y-axis, and the independent variable xi is considered free of uncertainty. However, in practice xi may also have associated uncertainties; when significant, must be modified to account for their propagation [52,53].
The Root Mean Square Deviation (RMSD) between the ground measurements and the corresponding Level-1/Level-2 data products were also estimated Equation (7). The RMSD is the standard deviation of the residuals (prediction errors) and is a commonly used measure of the difference between two sets of values.
where is the TOA or BOA reflectance from the Level-1 or Level-2 data product; is the TOA or BOA reflectance derived from in-situ measurement; and n is the number of observations.
In addition, the Mean Percent Error (MPE) and the Mean Percent Absolute Error (MPAE) between the in situ measurement and the Level-1/Level-2 data product was calculated as follows, in order to detect directionality in the differences:
where is the TOA or BOA reflectance from the Level-1 or Level-2 data product, is the TOA or BOA reflectance derived from in situ measurement; and n is the number of observations.
The Percent Error is just the difference between the sensor-predicted values and ground measurement divided by the sensor predicted values, multiplied by 100 Equation (8). In some cases, however, it is useful to evaluate error magnitudes; the absolute value is the key tool for this purpose. The Percent Absolute Error Equation (9) allows understanding of the absolute difference (magnitude) between the sensor predicted values and ground measurement. It is important to note, however, that percent changes (percent errors) on small numbers can appear to be more significant than they are; this is because a small absolute change in the number can result in a large percentage change. In contrast, percent changes on larger numbers can appear to be less significant because any absolute change in the number needs to be large to show a significant relative change.
5. Results and Discussion
5.1. Landsat-7 and Landsat-8 Level-1 Data Product Evaluation Results
Figure 11 shows scatter plots of the Landsat-7 ETM+ Level-1 data product (TOA Reflectance) and the TOA reflectance values derived from ground measurement at each of the test sites. At Tuz Gölü site, saturation effects in the Blue, Green, and Red bands are apparent. This means the Tuz Gölü is “too bright” for these spectral bands, i.e., the detectors recorded a flat value of 255 in the 8-bit data. Saturation can occur when the sensor images areas such as active fires, volcanoes, bright city lights, or more rarely, highly reflective surfaces oriented to reflect the Sun toward the sensor. Saturation may affect all bands or selectively affect some spectral bands (as was the case in this study).
A 1:1 line is also plotted in Figure 11 for reference. The MLS slopes ranged from approximately 0.960 to 1.016. Within the uncertainty range, however, the slope cannot be statistically distinguished from 1. Figure 11 clearly shows a strong linear relationship between the TOA reflectance predicted from in situ measurement and the TOA reflectance estimated for the ETM+ sensor. The RMSD values for all test sites are quite small (<0.018) for all reflective spectral bands. The largest differences were found in the longer wavelength Short-Wave Infrared SWIR-1 band (1.547–1749 μm, RMSD = 0.0170) and SWIR-2 band (2.064–2.345 μm, RMSD = 0.0178).
Figure 12 shows the residuals plot (prediction errors) between the Level-1 ETM+ TOA reflectance data and in situ derived TOA reflectance predicted from measurements acquired between 2002 and 2019. Using residual plots, it is possible to assess whether the observed error (residuals) is consistent with stochastic error (random error). Here, the errors in all spectral bands tend to be normally distributed around ±0.05. For all of the test sites as a group, the mean errors in the ETM+ Blue, Green, Red, Near Infrared (NIR), SWIR-1, SWIR-2, and Panchromatic (PAN) bands were, respectively, −0.0054, −0.0025, 0.0012, −0.0019, 0.0045, 0.0002, and −0.0012. A positive mean error indicates that the TOA reflectance recorded by the ETM+ sensor is larger, on average, than the TOA reflectance from in situ measurement. On the other hand, negative mean error indicates that the ETM+ sensor predicted values are less than the ground measurement. In short, the residuals plot suggests a linear model does not indicate the presence of a significant systematic error.
In Table 2, a summary results comparison is presented between TOA reflectance predicted from in situ measurement and the Landsat-7 ETM+ data Level-1 TOA reflectance data. The results are presented for each test site used for ETM+ sensor: Railroad Valley Playa (RVUS), La Crau (LCFR), Gobabeb (GONA), South Dakota State University site (SDSU), Algodones Dunes, and Tuz Gölü. It also presented the overall results considering all test sites as a group and the corresponding estimated slope, Root Mean Square Deviation (RMSD), Mean Error, the Mean Percent Error (MPE), and the Mean Percent Absolute Error (MPAE) metrics. The SWIR-2 band at Tuz Gölü shows the largest percent error, approximately 35%, even though the mean error is approximately 0.0184. The slope at Tuz Gölü is also the largest for the SWIR-2 band (1.544). One of the reasons is that the TOA reflectance value in SWIR-2 is very low for this site: less than 0.04 according to ground measurement (see Figure 1 and Figure 11). As mentioned earlier, small absolute changes in the absolute error can result in a large percentage change. However, the Mean Percent Absolute Error ranged from 3.9% to 6.4% for all sites as a group. This result indicates that the magnitude agreement between TOA reflectance data from the ETM+ and in situ measurements is better than 6.5% across all spectral bands.
Figure 13 shows scatterplots of the Landsat-8 OLI Level-1 data product (TOA Reflectance) and the TOA reflectance values derived from in situ ground measurement. The MLS slopes ranged from approximately 0.973 to 1.002. For all spectral bands except the OLI SWIR-1 (1.566–1.651 μm), the MLS slopes are less than unity, i.e., overall, the OLI tended to systematically underestimate the TOA reflectance (except in the SWIR-1 band). The estimated RMSD results are very similar in magnitude to the corresponding ETM+ results discussed above. The RMSD values are also quite small (<0.018) for all the reflective spectral bands for all sites as a group. The largest difference is in the SWIR-2 band (2.107–2.294 μm, RMSD = 0.0177).
Figure 14 shows the residual plots (prediction errors) between the Landsat-8 OLI Level-1 OLI TOA reflectance data and TOA reflectance predicted from in situ measurements acquired between 2013 and 2019. The errors in all spectral bands tend to be normally distributed around ±0.05. Considering all the test sites as a group, the mean error in all spectral bands except for SWIR-1 are negative, i.e., the OLI sensor tends to underestimate the TOA reflectance.
Table 3 presents a summary results comparison between TOA reflectance predicted from in situ measurement and the Landsat-8 OLI data Level-1 TOA reflectance data. The results are presented for each test site used for OLI sensor: Railroad Valley Playa (RVUS), La Crau (LCFR), Gobabeb (GONA), South Dakota State University site (SDSU), Crop Region in Brazil (Brazil), and Atacama Desert. The largest difference values between the OLI sensor and the ground measurement are observed for RadCalNet La Crau in France (up to 10% for the SWIR-2 Band). Although vegetative test sites are considered non-ideal for calibration due to greater seasonal variability, the SDSU site shows that it is possible to achieve reasonable agreement: better than 5.2% in all OLI sensor spectral bands. In addition, the slope at SDSU site ranged from 0.960 to 1.052 in all spectral bands. This result is very encouraging since the SDSU site has a unique capability to use a darker, vegetative target that is much more representative of targets often used in applications using remote sensing data. The Mean Percent Absolute Error ranged from approximately 3.9% to 5.8%, considering all test sites as a group. This result suggests that the magnitude agreement between TOA reflectance data from the Landsat-8 OLI and in situ measurements is better than 6% across all spectral bands—a slight improvement over the 6.5% agreement observed for the ETM+ (as discussed above).
5.2. Landsat-7 and Landsat-8 Level-2 Data Product Evaluation Results
Figure 15 shows, for each site, scatterplots of the Landsat-7 ETM+ Level-2 data product (surface reflectance) versus the surface reflectance values derived from in situ ground measurements. As mentioned earlier, the ETM+ Blue, Green, and Red spectral bands saturated for the Tuz Gölü test site. It should be noted that panchromatic bands are not processed to Level-2 data, hence this spectral band was not considered in this study for surface reflectance evaluation. The MLS slopes ranged from 0.972 to 1.014. Given the range of uncertainties in the data, the slope cannot be statistically distinguished from 1. Again, the largest difference is seen in the SWIR-2 band (2.064–2.345 μm, RMSD = 0.0213).
Figure 16 shows the residual plot (prediction errors) of the Landsat-7 ETM+ Level-2 product data and the corresponding surface reflectance predicted from in situ measurements acquired between 2002 and 2019. The errors in all spectral bands tend to be random, following a normal distribution centered around ±0.05. Considering all the test sites together, the mean errors for the Level-2 Blue, Green, Red, NIR, SWIR-1, and SWIR-2 bands were, respectively, 8.18 × 10⁻⁷, −0.0015, 0.0028, −0.0050, 0.0001, and 0.0033.
Table 4 presents a summary comparison between surface reflectance predicted from in situ measurement and the Landsat-7 ETM+ Level-2 surface reflectance data. The Mean Percent Absolute Error for surface reflectance (Level-2) is greater than the corresponding error observed in the TOA reflectance, ranging from approximately 3.5% to 10%. The result indicates that the magnitude agreement between surface reflectance data from ETM+ and in situ measurements is better than 10%, 6.2%, 5.1%, 3.7%, 3.5%, and 5.8%, for the ETM+ Blue, Green, Red, NIR, SWIR-1, and SWIR-2 bands, respectively. Compared to the agreement in the Level-1 data, the agreement of the Level-2 data worsened at shorter wavelengths (440 nm to 700 nm); for the Blue band, the disagreement almost doubled: from approximately 5.2% (Level-1) to approximately 10% (Level-2). At longer wavelengths (NIR, SWIR-1, and SWIR-2 bands), there was a slight improvement in data agreement (less than 0.5%) in the Level-2 data compared with the Level-1 data.
The primary components responsible for most atmospheric perturbations are aerosols, water vapor, carbon dioxide, and ozone. It is well known that first-order atmospheric effects are dominated by aerosols at shorter wavelengths (visible region of the electromagnetic spectrum) and by water vapor absorption at longer wavelengths (longwave infrared and shortwave microwave). To estimate the impact of Aerosol Optical Depth (AOD) and water vapor variation at TOA reflectance (Level-2 data), simulations were performed using the radiative transfer code MODerate resolution atmospheric TRANsmission (MODTRAN). Changing the AOD at 550 nm from 0.05 to 0.5 (dimensionless) for a typical vegetation target (similar to SDSU site—see Figure 5) increased the TOA reflectance from 0.055 to 0.093 for ETM+ Blue band; from 0.050 to 0.077 for ETM+ Green band; and from 0.040 to 0.061 for ETM+ Red band. The TOA Reflectance difference between the AOD variation at longer ETM+ wavelengths spectral bands (NIR, SWIR-1, and SWIR-2) was less than 0.007 (the TOA Reflectance increased from 0.053 to 0.060 at SWIR-2). The results were similar for OLI spectral bands. The greatest TOA Reflectance difference of AOD variation was at Coastal Aerosol band: the TOA Reflectance increased from 0.065 to 0.108. The TOA reflectance increased from 0.054 to 0.092 for OLI Blue band, from 0.051 to 0.077 for OLI Green band, and from 0.040 to 0.062 for OLI Red band. The TOA Reflectance difference between the AOD variation at OLI longer wavelengths spectral bands (NIR, SWIR-1, and SWIR-2) was also less than 0.007. On the other hand, altering the water vapor column from 0.1 to 6 (g/cm2) has no significant effect on the visible bands of both sensors (Coastal Aerosol, Blue, Green, and Red). In fact, the greatest difference in TOA reflectance values was 0.001 at Red band (the TOA Reflectance decreased from 0.040 to 0.039 at red band in both sensors). The TOA reflectance decreased from 0.188 to 0.167 for ETM+ NIR band, from 0.130 to 0.119 for ETM+ SWIR-1 band, and from 0.055 to 0.048 for ETM+ SWIR-2 band. The impact of water is less at OLI longer wavelengths spectral bands compared to ETM+ since the bandwidths of OLI are narrower than the corresponding bandwidths of ETM+ (the TOA Reflectance difference between the water variation at OLI longer spectral bands was up to 0.006).
As previously described, the Landsat-7 ETM+ Level-2 surface reflectance data products are generated using the Landsat Ecosystem Disturbance Adaptive Processing System (LEDAPS) algorithm. LEDAPS processing code uses the scene-dependent dense dark vegetation (or dark target) approach for aerosol optical depth retrieval. The results achieved in this work, specifically the increased discrepancy between Level-1 TOA reflectance data and Level-2 surface reflectance data products compared to ground measurements in the visible spectral bands (Blue, Greed, and Red bands), suggest unreliable aerosol retrieval for locations lacking sufficient dark target information; complicating efforts at accurate aerosol retrieval are (a) significant variation in aerosol concentration over relatively small distances and/or small intervals of time is possible; and (b) scattering and absorption by aerosols depends critically on the aerosol particle size, composition, distribution, and spectral characteristics. It is also possible that the assumptions behind the dark target approach (i.e., sufficiently “dark” vegetation and constant ratios between surface reflectance values between bands) are not valid for some sites.
The two test sites exhibiting the largest decrease in agreement from Level-1 to Level-2 agreement for the Blue and Green bands were the SDSU vegetative site and La Crau. It is interesting to note that both sites contain vegetative cover (more sparsely distributed at La Crau as compared to the SDSU site); consequently, low reflectance values in the visible region are observed. The average surface reflectance in the Blue and Green spectral bands was, respectively, 0.05 and 0.08 at the SDSU site, and approximately 0.07 and 0.10 at La Crau (see Figure 15). In comparison, the RVUS test site exhibited an average surface reflectance of approximately 0.25 and 0.33, respectively, in these bands. The low reflectance values of the target, therefore, may be a factor making atmospheric correction in these bands less reliable. In addition, both sites exhibit significant high variability in aerosol loading throughout the year; this wide variability of aerosol loading may also affect the atmospheric correction accuracy since the uncertainties in aerosol optical depth retrievals depend on atmospheric conditions [5].
It is important to highlight that the influence of aerosols in the visible spectral range can be challenging to correct. Firstly, because the aerosols can be discrete in space and time, i.e., the aerosols concentration can rapidly change significantly over time and location. Secondly, because of the complex scattering and absorbing properties of aerosols (in the atmosphere, there is a mixture of scattering and absorbing aerosols) that vary with aerosol size, shape, density, and spectrally [6]. Lastly, the slight improvement from Level-1 to Level-2 in data agreement, when compared to in situ measurements, for the near-infrared and short infrared spectra bands indicates that the ETM+ LEDAPS algorithm is appropriately accounting for water vapor absorption.
Figure 17 shows scatterplots of the Landsat-8 OLI Level-2 data product (surface reflectance) and the surface reflectance values derived from in situ measurement. In all spectral bands, the MLS slopes are less than unity (ranging from approximately 0.921 to 0.997); overall, the OLI sensor tends to systematically underestimate surface reflectance. The RMSD estimated results are slightly less than the results of the ETM + sensor discussed above. The RMSD values ranged from 0.014 to 0.020 for all the reflective spectral bands when considered all the test sites together. The largest difference is observed in the SWIR-2 band (2.107–2.294 μm, RMSD = 0.0202).
Figure 18 shows a residuals plot (prediction errors) between Landsat-8 OLI Level-2 surface reflectance data and surface reflectance predicted from in situ measurements acquired between 2013 and 2019. Once again, the errors in all spectral bands tend to be normally distributed around ±0.05. Considering all test sites as a group, the mean errors for all OLI spectral bands are negative: the highest mean error is observed in the Blue band (−0.0097) and the lowest mean error in the NIR band (−0.0011), further supporting the observation that the OLI tends to underestimate the surface reflectance values in all spectral bands.
Table 5 presents a summary results comparison between surface reflectance predicted from in situ measurement and the Landsat-8 OLI Level-2 surface reflectance data. The results are presented for each test site used to evaluate the OLI sensor, as well for all test sites together. As in the Level-1 data evaluation, the RadCalNet La Crau site exhibits the largest difference in reflectance magnitudes values between the OLI sensor and ground measurement, varying from approximately 4.5% to 11.6%. For all of the test sites as a group, the result indicates that the magnitude agreement between surface reflectance data from the OLI and in situ measurements is around 10.2% at Coastal Aerosol band, 7.3% at Blue band, and better than 5.7% for the remaining spectral bands.
As with the ETM+, comparison of agreement between the Level-2 and Level-1 products to the corresponding ground measurement estimates was worse at shorter wavelengths and slightly improved at longer wavelengths. Disagreement between the Level-2 data and ground measurements is especially significant in the Coastal Aerosol band; in this case, the level of disagreement increased from approximately 4.5% in the Level-1 product to approximately 10.2% in the Level-2 product. In contrast, a 0.6%, 0.7%, and 0.1% improvement in agreement was observed for the NIR, SWIR-1, and SWIR-2 bands, respectively. As mentioned earlier, the Landsat surface reflectance Code (LaSRC) algorithm is used to generated Landsat-8 OLI Level-2 surface reflectance data products. LaSRC uses auxiliary climate data acquired by MODIS. The significant decreases in agreement in the Coastal Aerosol and Blue bands again suggest that aerosol retrieval at some sites may not be reliable.
The observed decrease in agreement in the OLI Blue and Green bands, however, was less than the corresponding decrease observed in the ETM+ Blue and Green bands. For the OLI Blue and Green bands, the agreement decreased from approximately 4.4% (Level-1) to 7.3% (Level-2), and from 4.0% (Level-1) to 5.4% (Level-2), respectively, compared to the changes from approximately 5.2% (Level-1) to 10% (Level-2) in the ETM+ Blue band and from approximately 4.6% (Level-1) to 6.2% (Level-2) in the ETM+ Green band. In fact, there was an improvement in the agreement of the OLI Level-2 surface reflectance data with the data collected in the field in all spectral bands in common with ETM+ sensor. These results suggest that in their common band ranges, the OLI Level-2 product tends to more closely estimate surface reflectance than the corresponding ETM+ product. In summary, despite the less reliable performance of Level-2 data product in the visible spectral region (compared with Level-1 data) in both sensors, the Landsat-8 OLI LaSRC showed an improvement surface reflectance product over the Landsat-7 ETM+ LEDAPS product.
6. Conclusions
Landsat Level-1 data are distributed as quantized and calibrated scaled digital numbers, convertible to TOA reflectance by applying the radiometric rescaling coefficients provided with the Landsat product metadata. Currently, Level-1 data are the standard product of the Landsat sensors. In contrast, the Landsat Level-2 data products include surface reflectance values, with scattering and absorption effects due to aerosols and various gases in the atmosphere removed (data with absence of atmospheric effects). With heightened interest in use of surface reflectance for an increasing number of remote sensing applications, Level-2 data is expected to become the standard product of the Landsat sensors within the near future.
This work presents an evaluation and comparison of the radiometric performance of the Level-1 and Level-2 data products generated from the sensor ETM+ onboard Landsat-7 and the sensor OLI onboard Landsat-8 to the corresponding TOA/BOA reflectance values estimated from in situ ground measurements. For this evaluation, eight radiometric calibration test sites were selected: (a) Tuz Gölü (Turkey); (b) the Crop Region (Brazil); (c) the Atacama Desert (Chile); (d) Algodones Dunes (United States); (e) the South Dakota State University Image Processing Laboratory (SDSU IP Lab) vegetative calibration site (United States); (f) the Railroad Valley Playa (United States); (g) La Crau (France); and (g) the Gobabeb Desert (Namibia).
The results of this study indicate that the magnitude agreement between Landsat-7 ETM+ and Landsat-8 OLI Level-1 TOA reflectance data and the in situ measurements ranged, respectively, from approximately 3.9% to 6.5% and from 3.9% to 6.0%, across all spectral bands. The magnitude agreement between in situ measurements and both Landsat sensors Level-2 surface reflectance data product deteriorated at shorter spectral bands (Coastal Aerosol, Blue, Green, and Red bands) and slightly improved for longer spectral bands (NIR and SWIR bands). For instance, in the OLI Coastal Aerosol band the mean absolute error more than doubled, from approximately 4.5% (Level-1) to 10.2% (Level-2); for the OLI Blue band, the mean absolute error increased from approximately 4.4% (Level-1) to approximately 7.3% (Level-2). The mean percent absolute error for Level-2 surface reflectance data ranged from approximately 3.5% to 10% for the ETM+ sensor, and from approximately 3.3% to 7.3% for the OLI; except for Coastal Aerosol band, which showed an absolute error of approximately 10.2%.
It is well known that in the solar reflective spectral domain, aerosol scattering is strongest in the visible region of the electromagnetic spectrum. In addition, water vapor absorption is strongest in the near-infrared and shortwave infrared. The significant decline in agreement between the data collected in situ and the Level-2 data product from both sensors at shorter wavelengths spectral bands indicates issues with accurate retrieval of aerosol concentrations at some sites. It is important to note that aerosol effects in the visible spectral range can be challenging to correct since aerosols (a) can be discretely distributed spatially and temporally; and (b) because of the complex scattering and absorption properties of aerosols that vary with aerosol size, shape, density, and spectral characteristics. Contrarily, the slight improvement observed from Level-1 to Level-2 in data agreement, when compared to the corresponding in situ measurements, for the near-infrared and short-infrared bands indicates reasonably accurate estimation of water vapor quantity.
Finally, an improvement was observed in the agreement of the OLI Level-2 surface reflectance data with in situ data in all spectral bands in common with ETM+Level-2 data. This result indicates that, despite the less reliable performance of the Level-2 data product in the visible spectral region (compared with Level-1 data) in both sensors, the Landsat-8 OLI showed an improvement of Landsat-8 OLI LaSRC surface reflectance product over the Landsat-7 ETM+ LEDAPS product.
Author Contributions
Conceptualization, C.T.P., X.J., and L.L.; data curation, C.T.P.; formal analysis, C.T.P. and X.J.; funding acquisition, L.L.; investigation, C.T.P. and X.J.; methodology, C.T.P.; project administration, L.L.; resources, C.T.P., X.J., and L.L.; software, C.T.P. and X.J.; supervision, C.T.P. and L.L.; validation, C.T.P., X.J., and L.L.; visualization, C.T.P.; writing—original draft, C.T.P.; writing—review and editing, C.T.P. and X.J. All authors have read and agreed to the published version of the manuscript.
Funding
This research was funded by the National Aeronautics and Space Administration (NASA), grant number NNX15AP36A, and U.S. Geological Survey (USGS) Earth Resources Observation and Science (EROS), grant number G19AS0001.
Acknowledgments
Authors would like to express their gratitude to Timothy Ruggles who provided his support and invaluable suggestions in grammatical correction in the manuscript.
Conflicts of Interest
The authors declare no conflict of interest.
References
- Lamquin, N.; Woolliams, E.; Bruniquel, V.; Gascon, F.; Gorroño, J.; Govaerts, Y.; Leroy, V.; Lonjou, V.; AlHammoud, B.; Barsi, J.A.; et al. An inter-comparison exercise of Sentinel-2 radiometric validations assessed by independent expert groups. Remote Sens. Environ. 2019, 233, 111369. [Google Scholar] [CrossRef]
- Pinto, C.T.; Ponzoni, F.J.; Castro, R.; Leigh, L.; Mishra, N.; Aaron, D.; Helder, D. First in-flight radiometric calibration of MUX and WFI on-board CBERS-4. Remote Sens. 2016, 8, 405. [Google Scholar] [CrossRef] [Green Version]
- Biggar, S.; Slater, P.; Gellman, D. Uncertainties in the in-flight calibration of sensors with reference to measured ground sites in the 0.4–1.1 μm range. Remote Sens. Environ. 1994, 48, 245–252. [Google Scholar] [CrossRef]
- Hagolle, O.; Huc, M.; Pascual, D.V.; Dedieu, G. A Multi-temporal and multi-spectral method to estimate aerosol optical thickness over land, for the atmospheric correction of Formosat-2, LandSat, VENμS and Sentinel-2 images. Remote Sens. 2015, 7, 2668–2691. [Google Scholar] [CrossRef] [Green Version]
- Vermote, E.F.; Kotchenova, S. Atmospheric correction for the monitoring of land surfaces. J. Geophys. Res. Space Phys. 2008, 113. [Google Scholar] [CrossRef]
- Vermote, E.F.; Justice, C.; Claverie, M.; Franch, B. Preliminary analysis of the performance of the Landsat 8/OLI land surface reflectance product. Remote Sens. Environ. 2016, 185, 46–56. [Google Scholar] [CrossRef]
- Markham, B.; Storey, J.; Williams, D.; Irons, J. Landsat sensor performance: History and current status. IEEE Trans. Geosci. Remote Sens. 2004, 42, 2691–2694. [Google Scholar] [CrossRef]
- Markham, B.; Helder, D. Forty-year calibrated record of earth-reflected radiance from Landsat: A review. Remote Sens. Environ. 2012, 122, 30–40. [Google Scholar] [CrossRef] [Green Version]
- Roy, D.P.; Wulder, M.A.; Loveland, T.R.; Woodcock, C.E.; Allen, R.G.; Anderson, M.C.; Helder, D.; Irons, J.R.; Johnson, D.M.; Kennedy, R.; et al. Landsat-8: Science and product vision for terrestrial global change research. Remote Sens. Environ. 2014, 145, 154–172. [Google Scholar] [CrossRef] [Green Version]
- Loveland, T.R.; Irons, J.R. Landsat 8: The plans, the reality, and the legacy. Remote Sens. Environ. 2016, 185, 1–6. [Google Scholar] [CrossRef] [Green Version]
- Wulder, M.A.; Loveland, T.R.; Roy, D.P.; Crawford, C.J.; Masek, J.G.; Woodcock, C.E.; Allen, R.G.; Anderson, M.C.; Belward, A.S.; Cohen, W.B.; et al. Current status of Landsat program, science, and applications. Remote Sens. Environ. 2019, 225, 127–147. [Google Scholar] [CrossRef]
- Vermote, E.; Tanre, D.; Deuze, J.; Herman, M.; Morcette, J.J. Second simulation of the satellite signal in the solar spectrum, 6S: An overview. IEEE Trans. Geosci. Remote Sens. 1997, 35, 675–686. [Google Scholar] [CrossRef] [Green Version]
- Masek, J.G.; Vermote, E.F.; Saleous, N.E.; Wolfe, R.; Hall, F.G.; Huemmrich, F.; Gao, F.; Kutler, J.; Lim, T.K. A Landsat surface reflectance data set for North America, 1990–2000. IEEE Geosci. Remote Sens. Lett. 2006, 3, 68–72. [Google Scholar] [CrossRef]
- Masek, J.G.; Vermote, E.F.; Saleous, N.; Wolfe, R.; Hall, F.G.; Huemmrich, F.; Gao, F.; Kutler, J.; Lim., T.K. LEDAPS Calibration, Reflectance, Atmospheric Correction Preprocessing Code. 2013. Available online: https://daac.ornl.gov/MODELS/guides/LEDAPS_V2.html (accessed on 5 May 2020).
- Vermote, E.; Roger, J.C.; Franch, B.; Skakun, S. LaSRC (Land Surface Reflectance Code): Overview, application and validation using MODIS, VIIRS, LANDSAT and Sentinel 2 data’s. In Proceedings of the IGARSS—IEEE International Geoscience and Remote Sensing Symposium, Valencia, Spain, 23–27 July 2018; pp. 8173–8176. [Google Scholar]
- Feng, M.; Sexton, J.O.; Huang, C.; Masek, J.; Vermote, E.F.; Gao, F.; Narasimhan, R.; Channan, S.; Wolfe, R.E.; Townshend, J.R. Global surface reflectance products from Landsat: Assessment using coincident MODIS observations. Remote Sens. Environ. 2013, 134, 276–293. [Google Scholar] [CrossRef]
- Wang, Y.; Liu, L.; Hu, Y.; Li, N.; Li, Z. Development and validation of the Landsat-8 surface reflectance products using a MODIS-based per-pixel atmospheric correction method. Int. J. Remote Sens. 2016, 37, 1291–1314. [Google Scholar] [CrossRef]
- Wang, Y.; Lyapustin, A.; Privette, J.; Morisette, J.; Holben, B. Atmospheric correction at AERONET locations: A new science and validation data set. IEEE Trans. Geosci. Remote Sens. 2009, 47, 2450–2466. [Google Scholar] [CrossRef]
- Franch, B.; Vermote, E.; Claverie, M. Intercomparison of Landsat albedo retrieval techniques and evaluation against in situ measurements across the US SURFRAD network. Remote Sens. Environ. 2014, 152, 627–637. [Google Scholar] [CrossRef]
- Claverie, M.; Vermote, E.; Franch, B.; Masek, J.G. Evaluation of the Landsat-5 TM and Landsat-7 ETM+ surface reflectance products. Remote Sens. Environ. 2015, 169, 390–403. [Google Scholar] [CrossRef]
- Holben, B.; Eck, T.; Slutsker, I.; Tanre, D.; Buis, J.; Setzer, A.; Vermote, E.; Reagan, J.; Kaufman, Y.; Nakajima, T.; et al. AERONET—A federated instrument network and data archive for aerosol characterization. Remote Sens. Environ. 1998, 66, 1–16. [Google Scholar] [CrossRef]
- Dubovik, O.; Holben, B.; Eck, T.F.; Smirnov, A.; Kaufman, Y.J.; King, M.D.; Tanré, D.; Slutsker, I. Variability of absorption and optical properties of key aerosol types observed in worldwide locations. J. Atmospheric Sci. 2002, 59, 590–608. [Google Scholar] [CrossRef]
- U.S. Geological Survey (USGS). Landsat Collections. Available online: https://pubs.usgs.gov/fs/2018/3049/fs20183049.pdf (accessed on 7 May 2020).
- U.S. Geological Survey (USGS). Landsat 8 Collection 1. Data Available. Available online: https://www.usgs.gov/land-resources/nli/landsat/march-6-2017-landsat-8-collection-1-data-available (accessed on 7 May 2020).
- U.S. Geological Survey (USGS). Landsat Collection 2 Level-2 Science Products. Available online: https://www.usgs.gov/land-resources/nli/landsat/landsat-collection-2-level-2-science-products (accessed on 7 May 2020).
- U.S. Geological Survey (USGS). Landsat Collection 1 vs. Collection 2 Summary. 2020. Available online: https://prd-wret.s3.us-west-2.amazonaws.com/assets/palladium/production/atoms/files/Landsat-C1vsC2-20200210-lmws.pdf (accessed on 7 May 2020).
- Ihlen, V.; Zanter, K.; Department of the Interior, U.S. Geological Survey. Landsat 8 (L8) Data Users Handbook. Version 5.0. 2019, EROS, Sioux Falls, South Dakota. Available online: https://www.usgs.gov/media/files/landsat-8-data-users-handbook (accessed on 7 May 2020).
- Ihlen, V.; Zanter, K.; Department of the Interior, U.S. Geological Survey. Landsat 7 (L7) Data Users Handbook. Version 2.0. 2019, EROS, Sioux Falls, South Dakota. Available online: https://www.usgs.gov/media/files/landsat-7-data-users-handbook (accessed on 7 May 2020).
- Zanter, K.; Department of the Interior, U.S. Geological Survey. Landsat 4-7 Surface Reflectance (LEDAPS) Product Guide. Version 2.0. 2019, EROS, Sioux Falls, South Dakota. Available online: https://www.usgs.gov/media/files/landsat-4-7-surface-reflectance-code-ledaps-product-guide (accessed on 7 May 2020).
- Zanter, K.; Department of the Interior, U.S. Geological Survey. Landsat 8 Surface Reflectance Code (LASRC) Product Guide. Version 2.0. 2019, EROS, Sioux Falls, South Dakota. Available online: https://www.usgs.gov/media/files/land-surface-reflectance-code-lasrc-product-guide (accessed on 7 May 2020).
- Vermote, E.F.; Saleous, N.; Justice, C.O.; Kaufman, Y.J.; Privette, J.L.; Remer, L.; Roger, J.C.; Tanre, D. Atmospheric correction of visible to middle-infrared EOS-MODIS data over land surfaces: Background, operational algorithm and validation. J. Geophys. Res. Space Phys. 1997, 102, 17131–17141. [Google Scholar] [CrossRef] [Green Version]
- Kotchenova, S.Y.; Vermote, E.F.; Matarrese, R.; Klemm, J.F.J. Validation of a vector version of the 6S radiative transfer code for atmospheric correction of satellite data Part I: Path radiance. Appl. Opt. 2006, 45, 6762–6774. [Google Scholar] [CrossRef] [PubMed] [Green Version]
- Kotchenova, S.Y.; Vermote, E.F. Validation of a vector version of the 6S radiative transfer code for atmospheric correction of satellite data. Part II. Homogeneous Lambertian and anisotropic surfaces. Appl. Opt. 2007, 46, 4455–4464. [Google Scholar] [CrossRef] [PubMed] [Green Version]
- Kaufman, Y.J.; Wald, A.E.; Remer, L.A.; Gao, B.C.; Li, R.R.; Flynn, L. The MODIS 2.1 μm Channel—Correlation with visible reflectance for use in remote sensing of aerosol. IEEE Trans. Geosci. Remote Sens. 1997, 35, 1286–1298. [Google Scholar] [CrossRef]
- Helder, D.; Thome, K.; Aaron, D.; Leigh, L.; Czapla-Myers, J.; Leisso, N.; Biggar, S.; Anderson, N. Recent surface reflectance measurement campaigns with emphasis on best practices, SI traceability and uncertainty estimation. Metrologia 2012, 49, S21–S28. [Google Scholar] [CrossRef] [Green Version]
- Ozen, H.; Fox, N.; Gürbüz, S.Z.; Deadman, A.; Behnert, I.; Harris, P.; Yua, L.; Griffith, D.; Kaewmanee, M.; Prakobya, A.; et al. Preliminary Results of the Comparison of Satellite Imagers Using Tuz Gölü as a Reference Standard; International Archives of the Photogrammetry, Remote Sensing and Spatial Information Sciences: Melbourne, Australia, 2012; pp. 145–148. [Google Scholar]
- Committee on Earth Observation Satellites (CEOS) Cal/Val Portal. Lake Tüz Golu. Available online: http://calvalportal.ceos.org/tuz-golu (accessed on 8 May 2020).
- Pinto, C.T.; Ponzoni, F.J.; Barrientos, C.; Mattar, C.; Artigas, A.S.; Castro, R. Spectral and atmospheric characterization of a site at atacama desert for earth observation sensor calibration. IEEE Geosci. Remote Sens. Lett. 2015, 12, 2227–2231. [Google Scholar] [CrossRef]
- Martins, V.S.; Soares, J.V.; Novo, E.M.; Barbosa, C.C.; Pinto, C.T.; Arcanjo, J.S.; Kaleita, A.L. Continental-scale surface reflectance product from CBERS-4 MUX data: Assessment of atmospheric correction method using coincident Landsat observations. Remote Sens. Environ. 2018, 218, 55–68. [Google Scholar] [CrossRef]
- Vesilind, P.J. The driest place on Earth. Natl. Geogr. 2003, 204, 46–71. [Google Scholar]
- Houston, J.; Hartley, A.J. The central Andean west-slope rainshadow and its potential contribution to the origin of hyper-aridity in the Atacama Desert. Int. J. Clim. 2003, 23, 1453–1464. [Google Scholar] [CrossRef]
- McCorkel, J.; Bachmann, C.M.; Coburn, C.; Gerace, A.; Leigh, L.; Czapla-Myers, J.S.; Helder, D.; Cook, B. Overview of the 2015 Algodones Sand Dunes field campaign to support sensor intercalibration. J. Appl. Remote Sens. 2017, 12, 1. [Google Scholar] [CrossRef]
- Czapla-Myers, J.; McCorkel, J.; Anderson, N.; Thome, K.; Biggar, S.; Helder, D.; Aaron, D.; Leigh, L.; Mishra, N. The ground-based absolute radiometric calibration of Landsat 8 OLI. Remote. Sens. 2015, 7, 600–626. [Google Scholar] [CrossRef] [Green Version]
- Pinto, C.T.; Leigh, L.; Helder, D. SDSU Vegetative Site Analysis from 2013 to 2017 for Radiometric Calibration of Earth Observation Sensors. In Proceedings of the Brazilian Symposium on Remote Sensing, 19 (SBSR), Santos, Brazil, 14–17 April 2019; pp. 1–4. [Google Scholar]
- Bouvet, M.; Thome, K.; Berthelot, B.; Bialek, A.; Czapla-Myers, J.S.; Fox, N.P.; Goryl, P.; Henry, P.; Ma, L.; Marcq, S.; et al. RadCalNet: A radiometric calibration network for Earth observing imagers operating in the visible to shortwave infrared spectral range. Remote Sens. 2019, 11, 2401. [Google Scholar] [CrossRef] [Green Version]
- Jing, X.; Leigh, L.; Pinto, C.T.; Helder, D. Evaluation of RadCalNet output data using Landsat 7, Landsat 8, Sentinel 2A, and Sentinel 2B Sensors. Remote Sens. 2019, 11, 541. [Google Scholar] [CrossRef] [Green Version]
- Czapla-Myers, J. RadCalNet site description. In CEOS Reference: QA4EO-WGCV-IVO-CSP-002_RVUS; University of Arizona: Railroad Valley, NV, USA, 2018; p. 19. [Google Scholar]
- Meygret, A. RadCalNet site description. In CEOS Reference: QA4EO-WGCV-IVO-CSP-002_LC. Name of site: La Crau; Centre National d’Études Spatiales (CNES), Physics for Optical Measurement Service: Toulouse, France, 2018; 24p. [Google Scholar]
- Greenwell, C. RadCalNet site description. In CEOS Reference: QA4EO-WGCV-IVO-CSP-002_GONA. Name of site: Gobabeb; National Physical Laboratory: Namibia, South Africa, 2018; 23p. [Google Scholar]
- Berk, A.; Anderson, G.P.; Acharya, P.K.; Shettle, E.P. MODTRAN 5.2.1 User’s Manual; Spectral Sciences Inc., Air Force Research Laboratory: Burlington, MA, USA, 2011; p. 69. [Google Scholar]
- U.S. Geological Survey (USGS). Spectral Characteristics Viewer. 2020. Available online: https://landsat.usgs.gov/spectral-characteristics-viewer (accessed on 15 July 2020).
- Tellinghuisen, J. Least squares in calibration: Dealing with uncertainty in x. Analyst 2010, 135, 1961–1969. [Google Scholar] [CrossRef]
- Helene, O.A.M.; Vanin, V.R. Tratamento Estatístico de Dados: Em Física Experimental; Edgard Blücher: São Paulo, Brazil, 1981; p. 105. [Google Scholar]
Figure 1.
In the y-axis left and right side of the graph is presented, respectively, the Bottom-of-Atmosphere (BOA) and Top-of-Atmosphere (TOA) reflectance of Tuz Gölü measured in situ in August 2010.
Figure 1.
In the y-axis left and right side of the graph is presented, respectively, the Bottom-of-Atmosphere (BOA) and Top-of-Atmosphere (TOA) reflectance of Tuz Gölü measured in situ in August 2010.
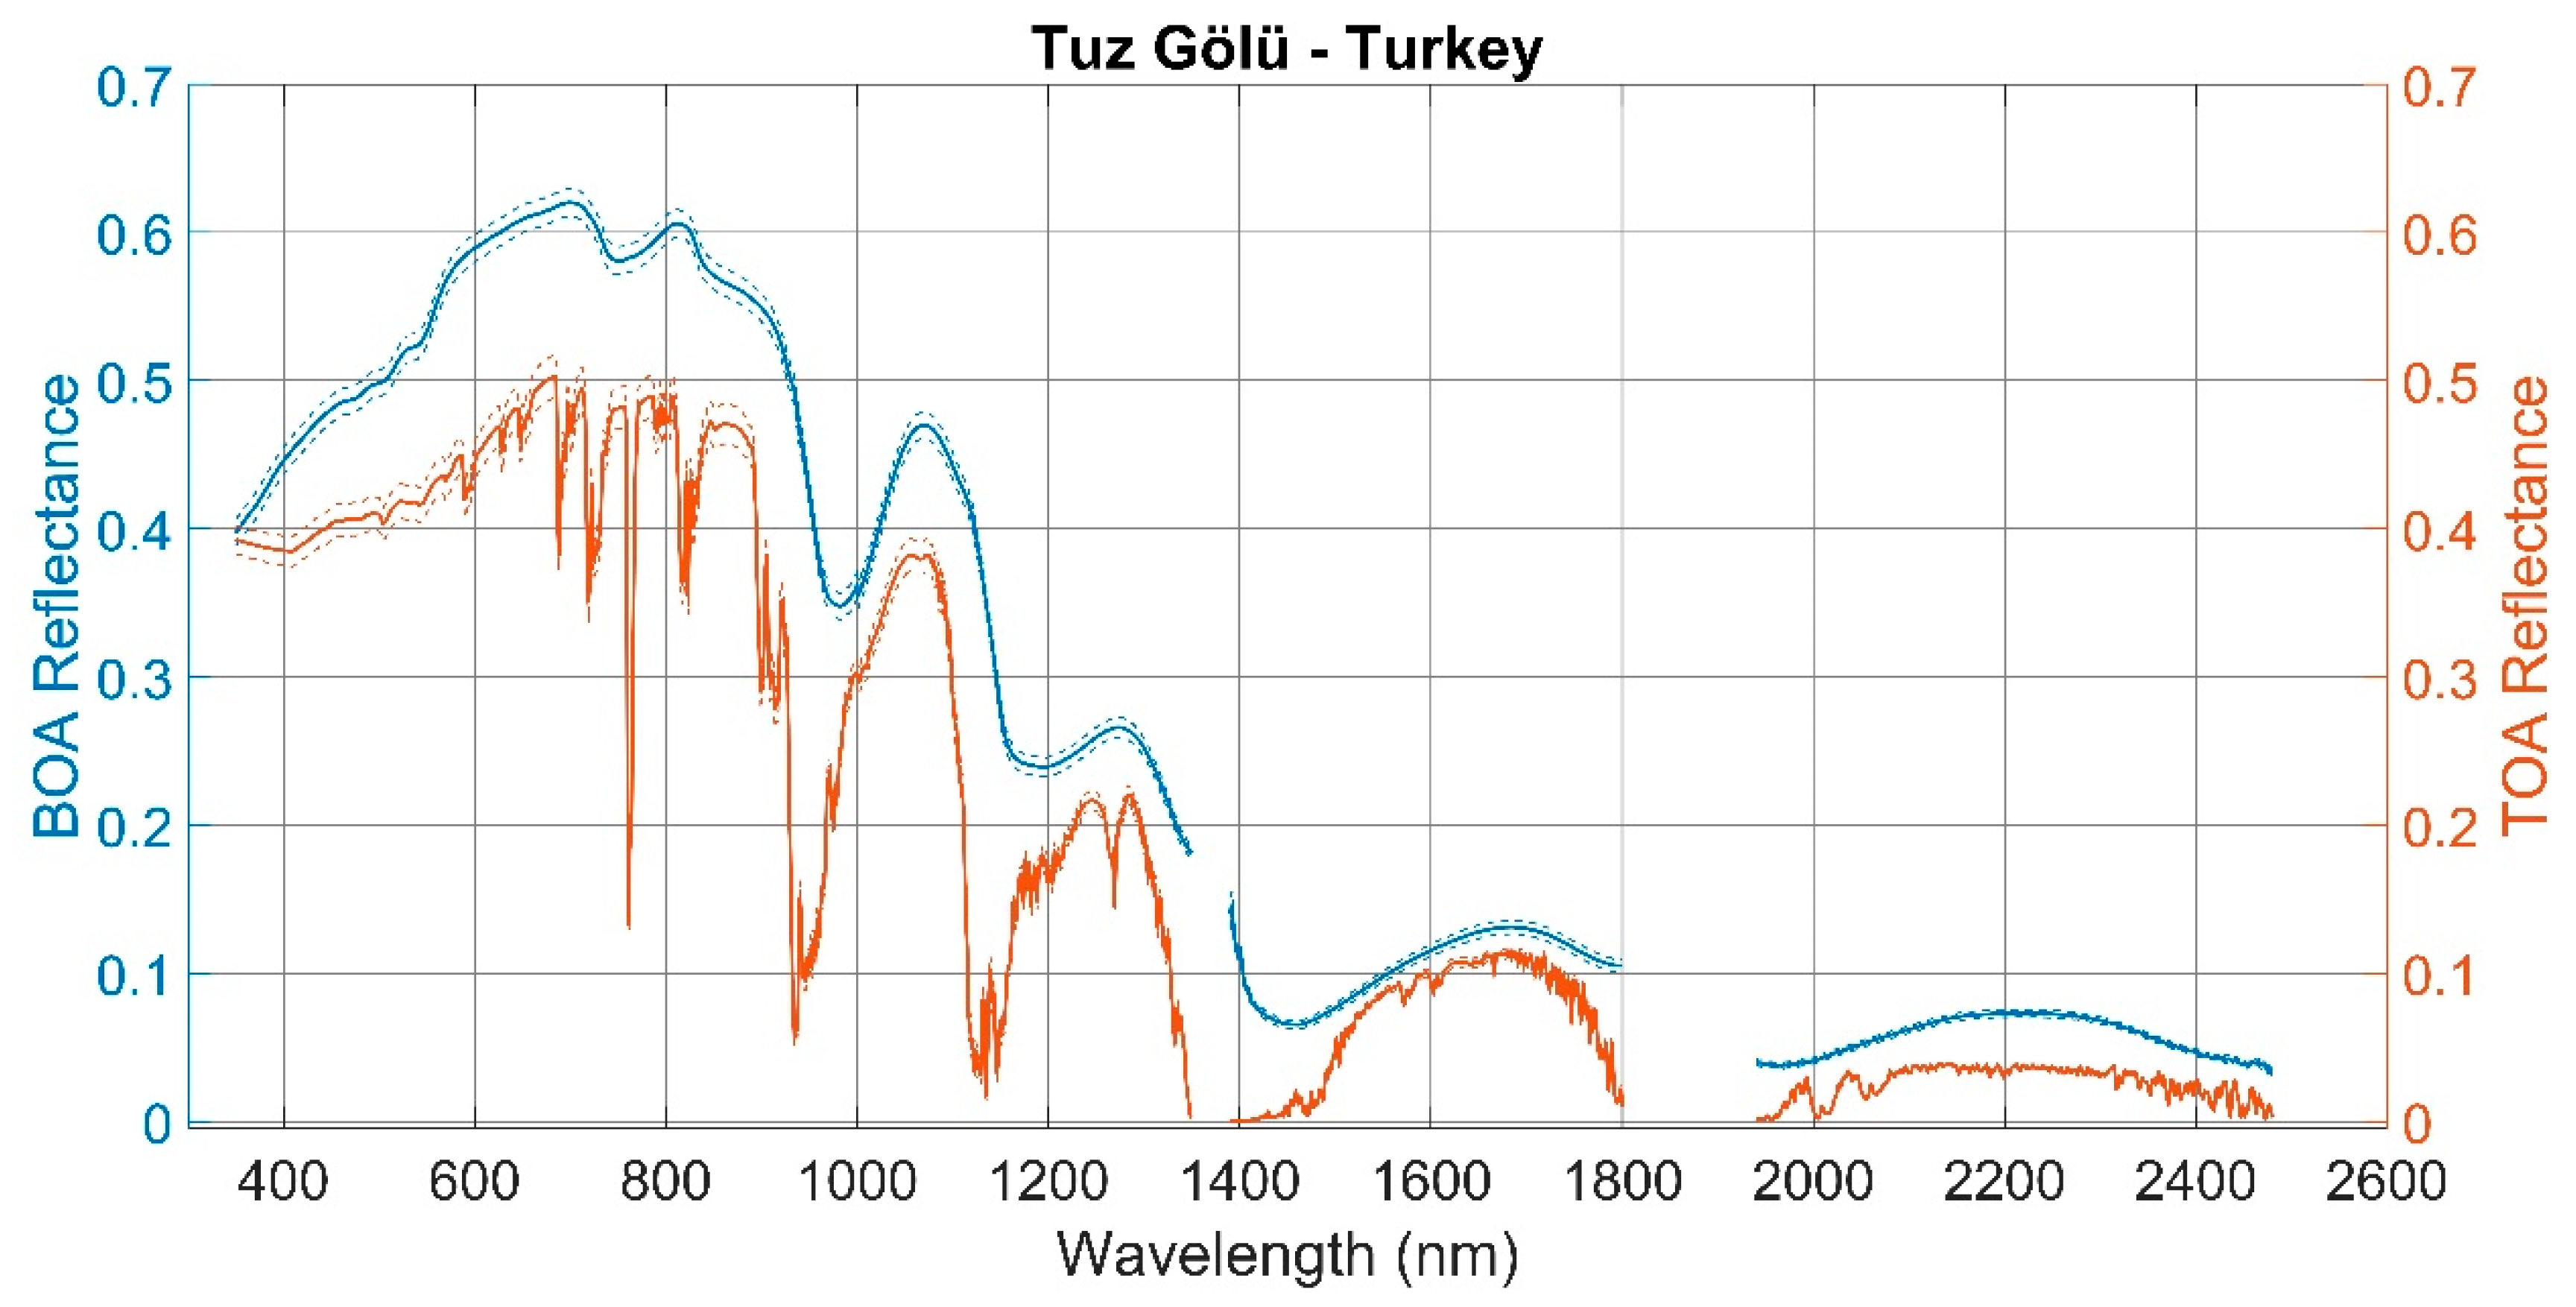
Figure 2.
In the y-axis left and right side of the graph is presented, respectively, the BOA and TOA reflectance of Brazil site measured in-situ in July 2014.
Figure 2.
In the y-axis left and right side of the graph is presented, respectively, the BOA and TOA reflectance of Brazil site measured in-situ in July 2014.

Figure 3.
In the y-axis left and right side of the graph is presented, respectively, the BOA and TOA reflectance of Atacama Desert measured in situ in August 2014.
Figure 3.
In the y-axis left and right side of the graph is presented, respectively, the BOA and TOA reflectance of Atacama Desert measured in situ in August 2014.
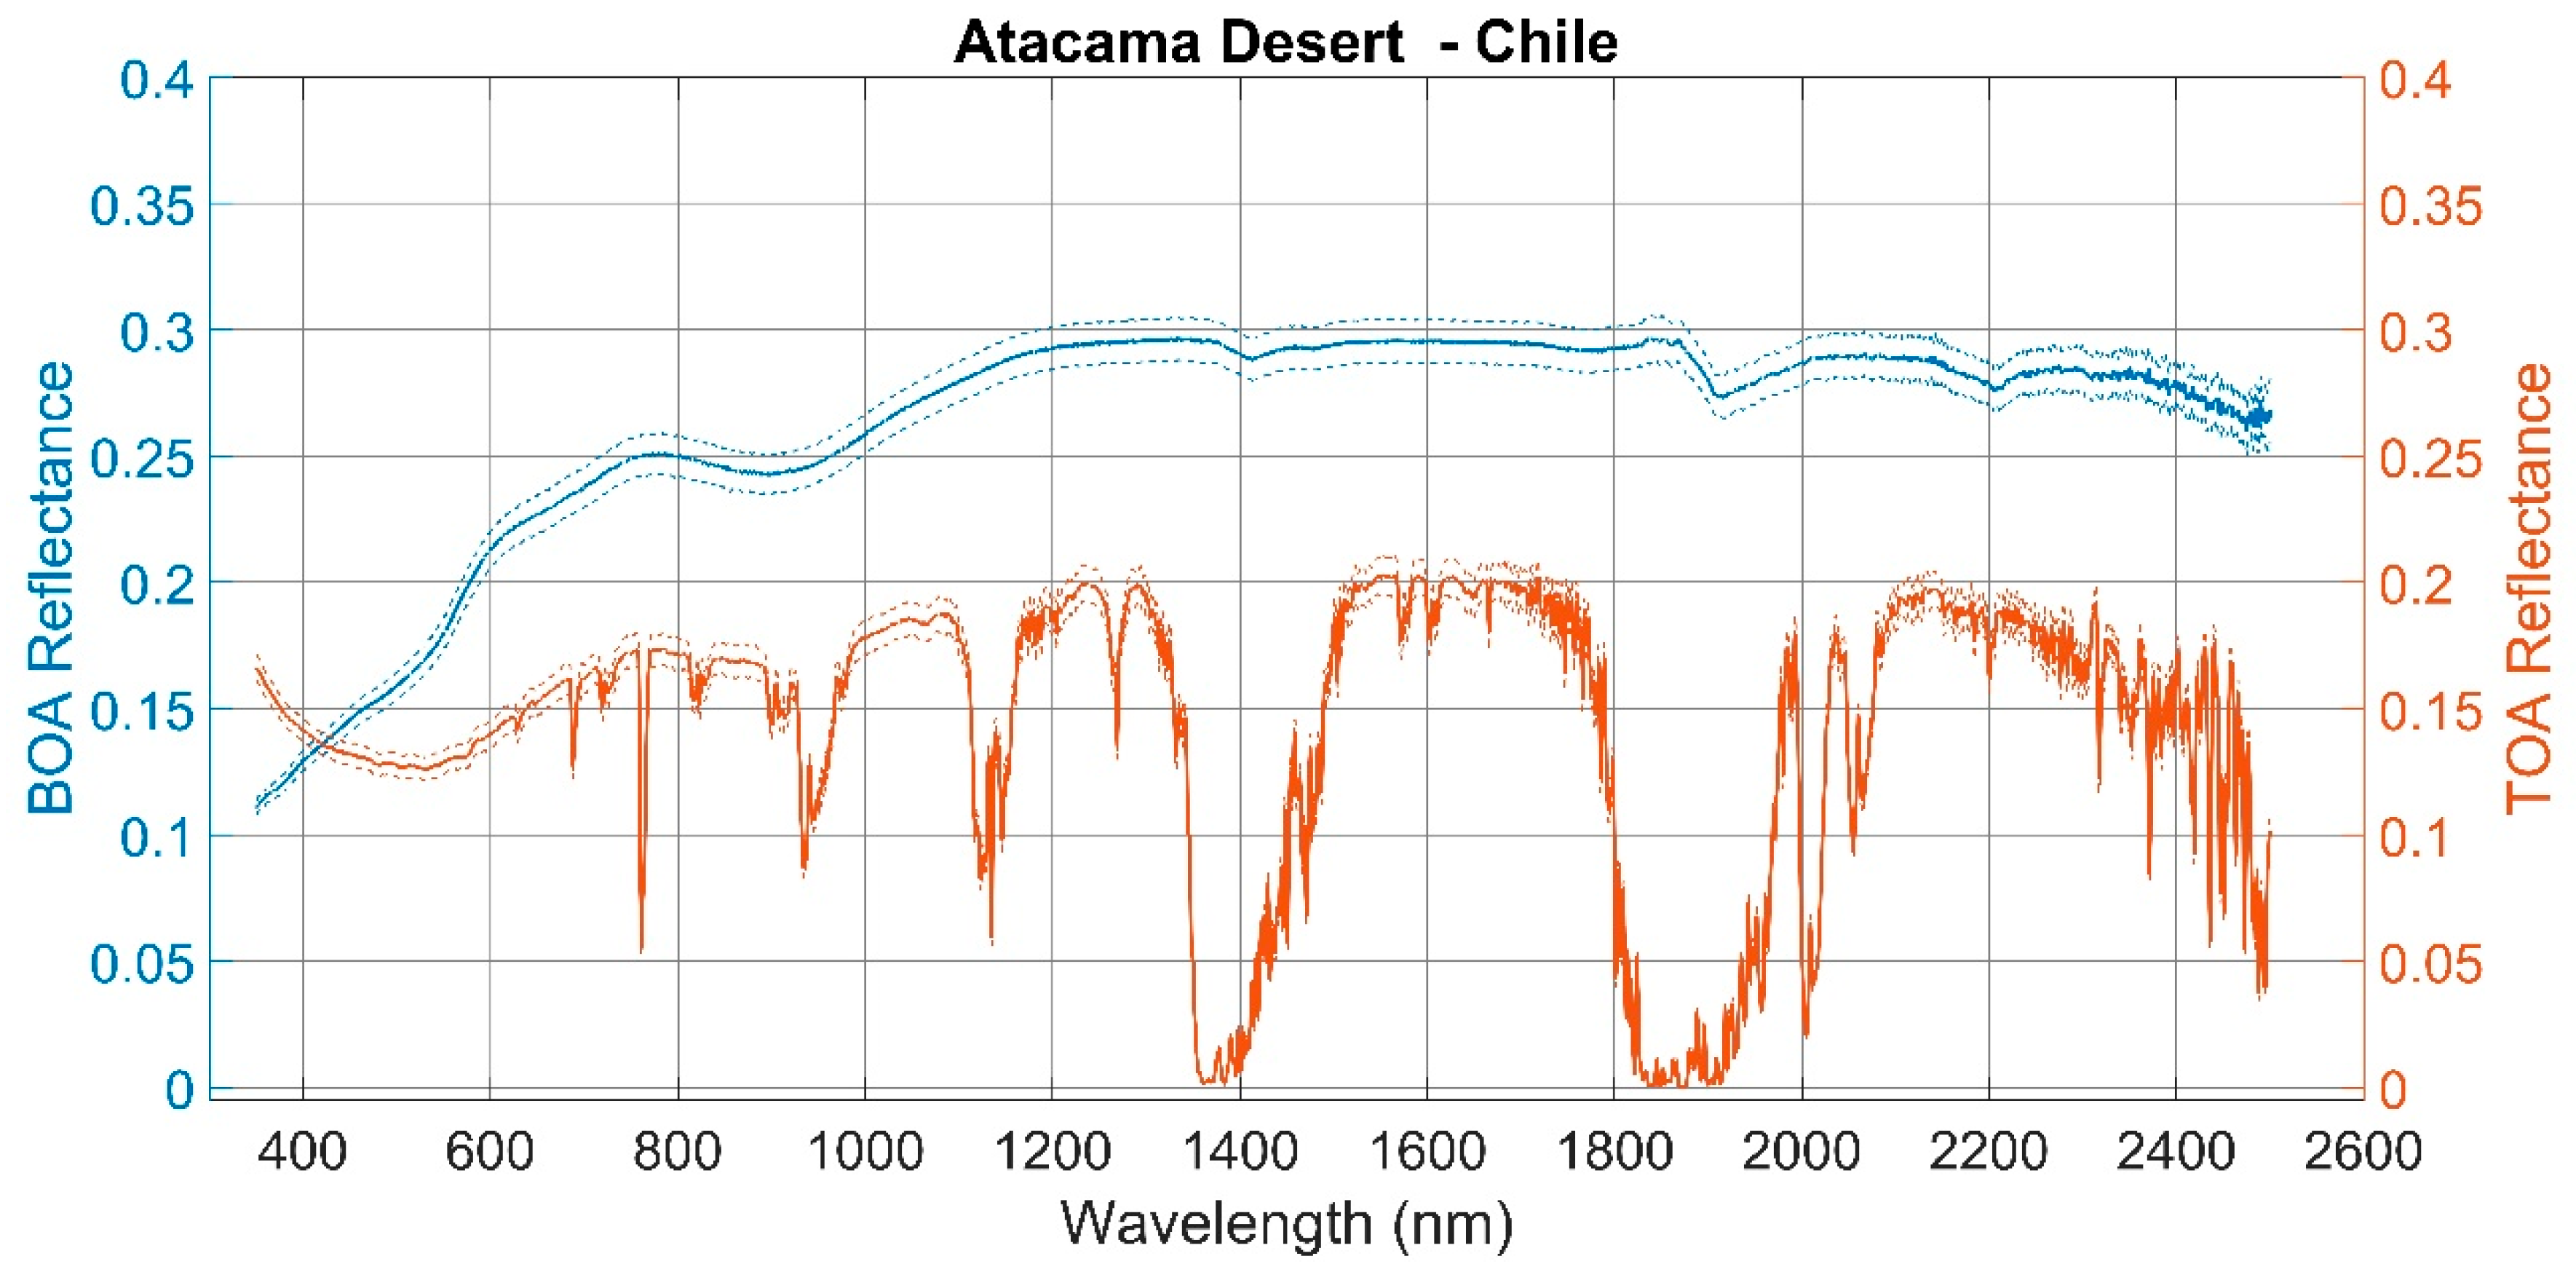
Figure 4.
In the y-axis left and right side of the graph is presented, respectively, the BOA and TOA reflectance of Algodones Dunes measured in situ in March 2015.
Figure 4.
In the y-axis left and right side of the graph is presented, respectively, the BOA and TOA reflectance of Algodones Dunes measured in situ in March 2015.
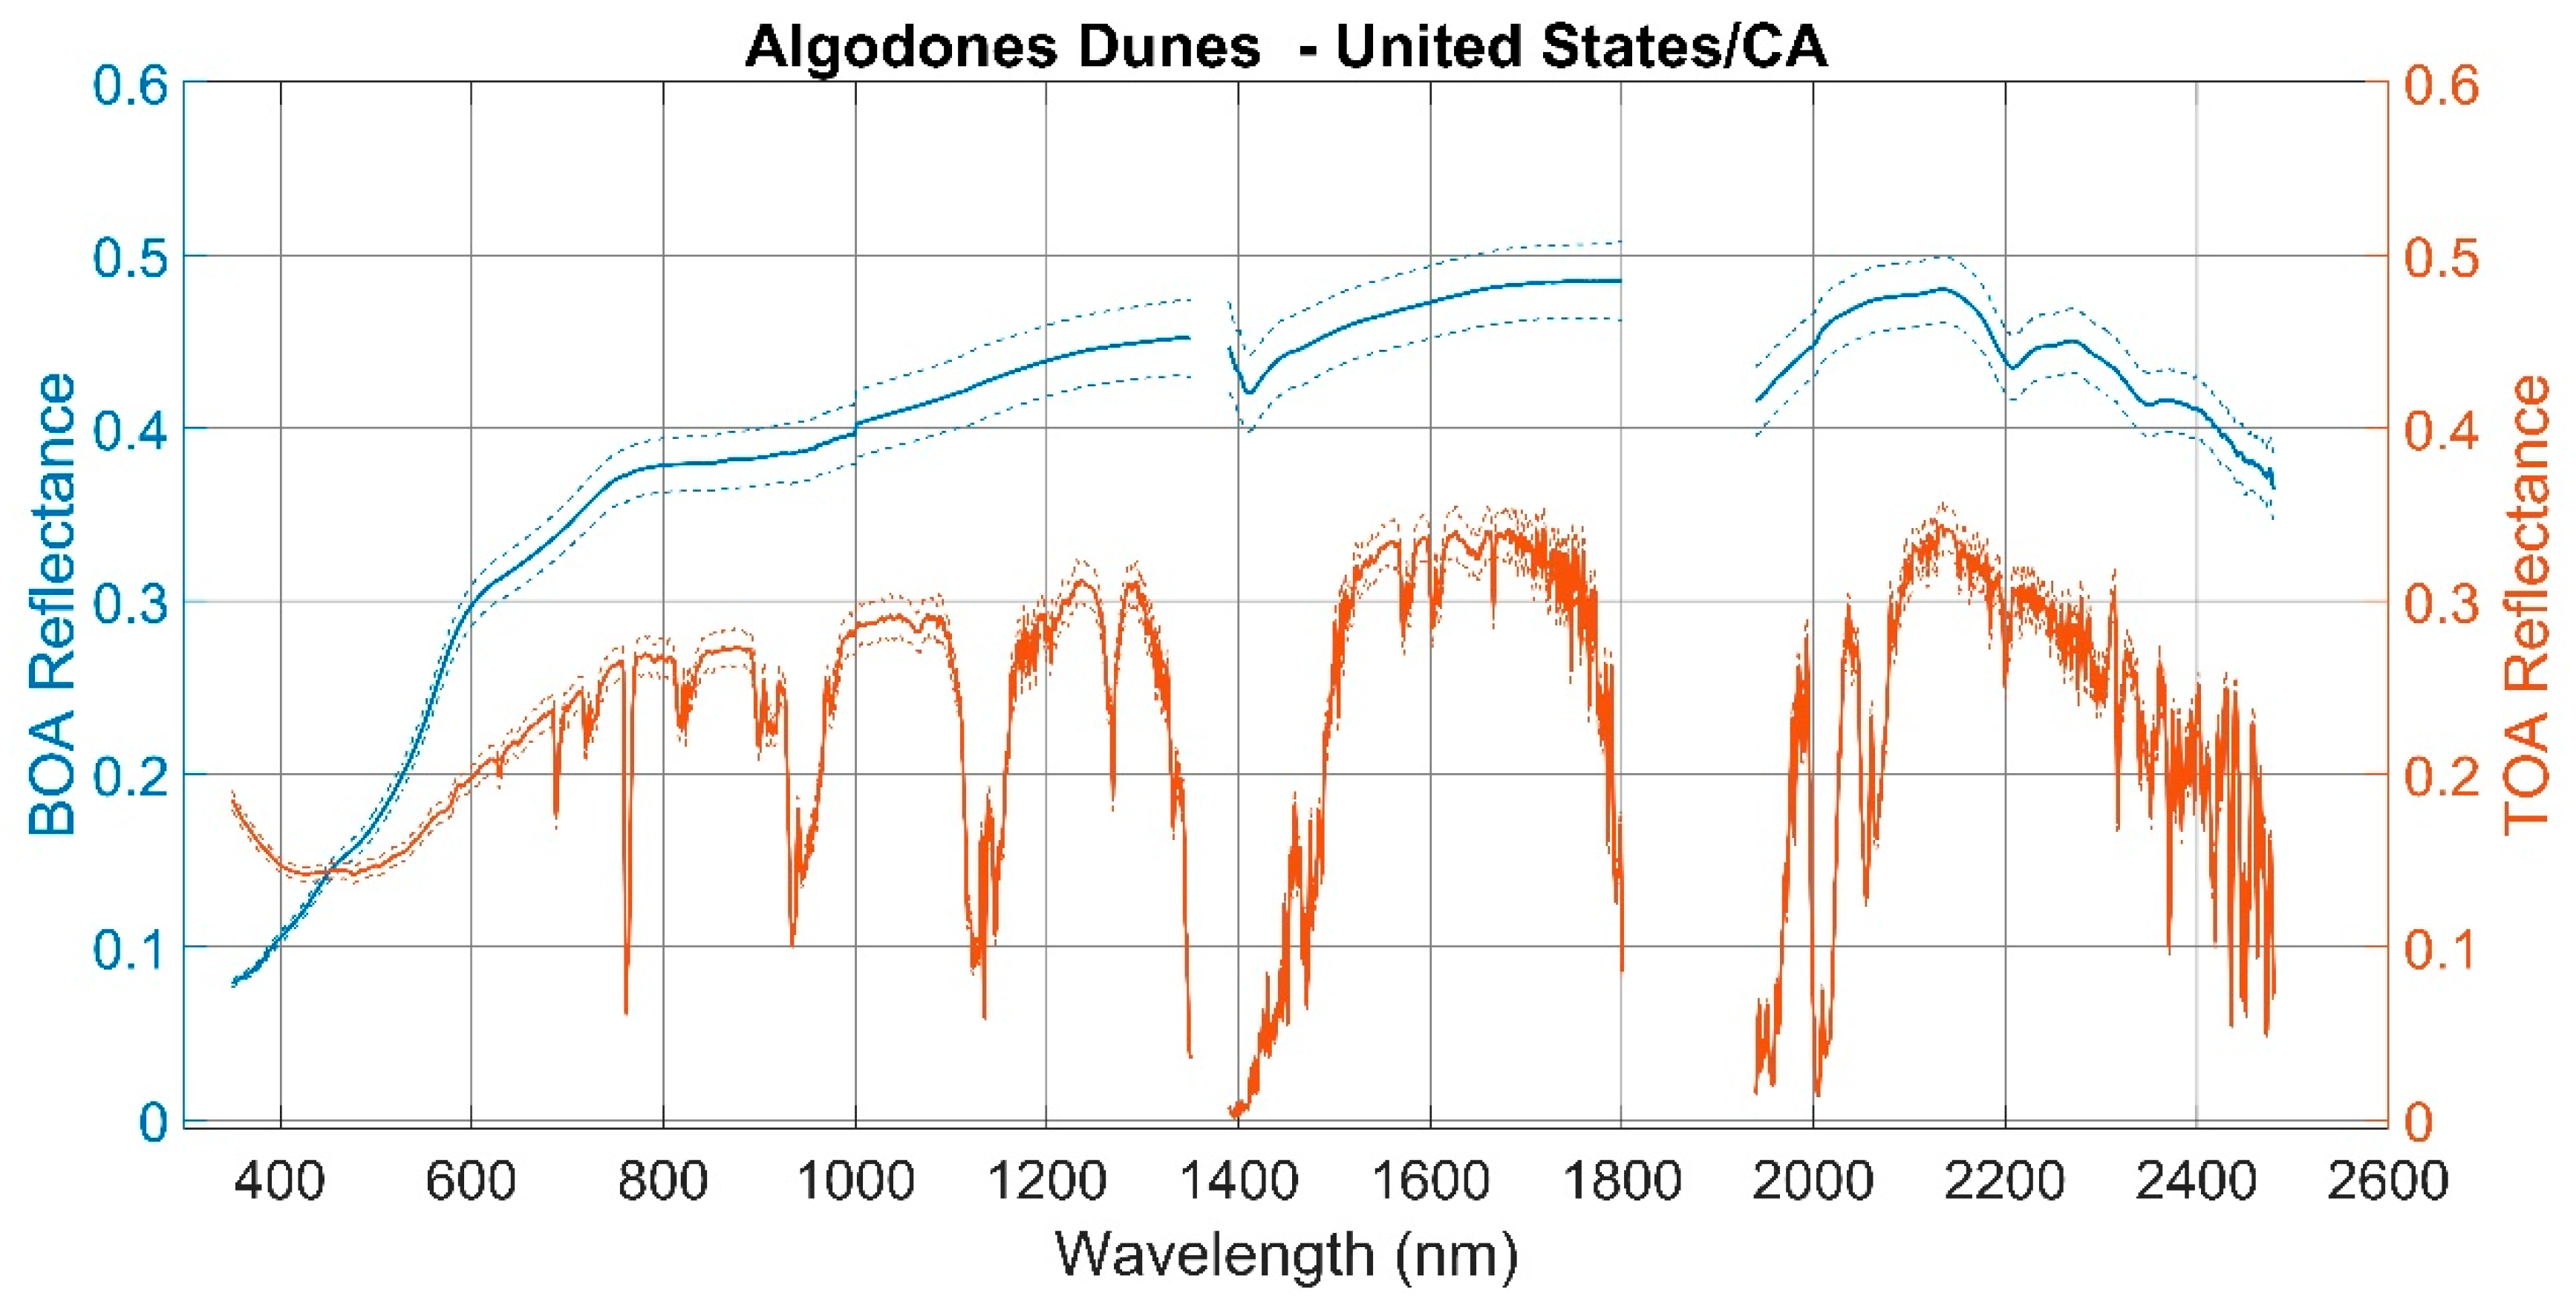
Figure 5.
In the y-axis left and right side of the graph is presented, respectively, the BOA and TOA reflectance of South Dakota State University (SDSU) Vegetative site measured in-situ on 9 October 2019.
Figure 5.
In the y-axis left and right side of the graph is presented, respectively, the BOA and TOA reflectance of South Dakota State University (SDSU) Vegetative site measured in-situ on 9 October 2019.
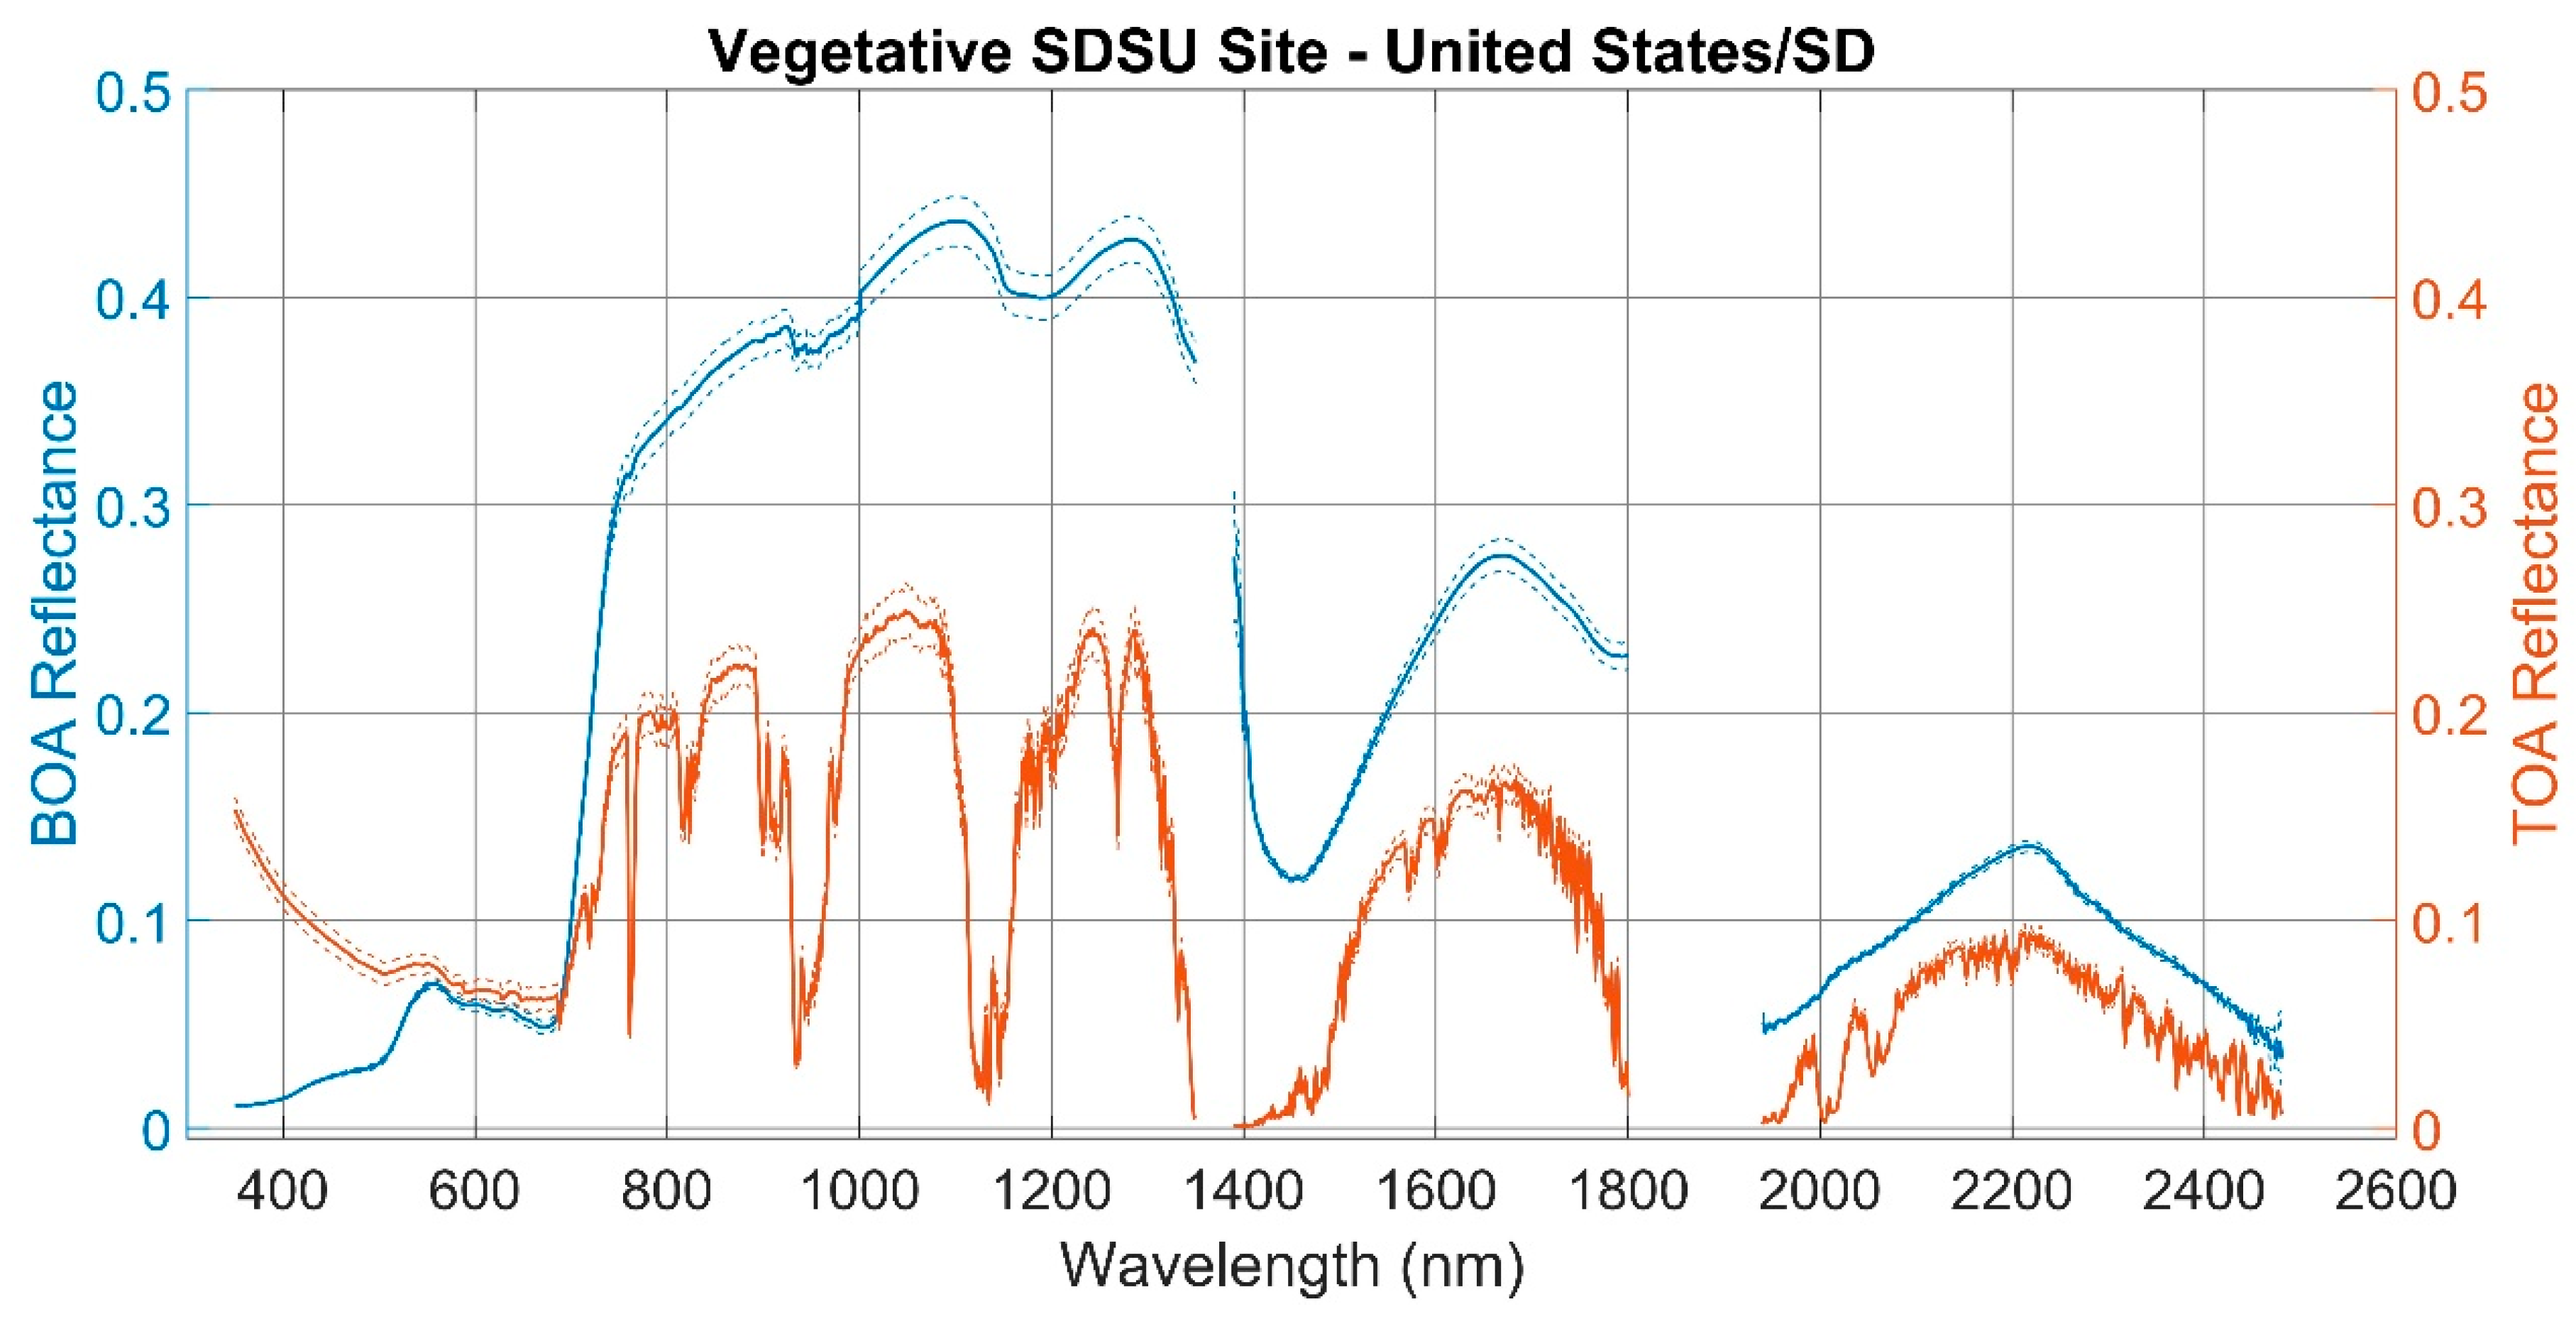
Figure 6.
In the y-axis left and right side of the graph is presented, respectively, the BOA and TOA reflectance of Railroad Valley Playa (RVUS) measured in-situ on 2 January 2020.
Figure 6.
In the y-axis left and right side of the graph is presented, respectively, the BOA and TOA reflectance of Railroad Valley Playa (RVUS) measured in-situ on 2 January 2020.
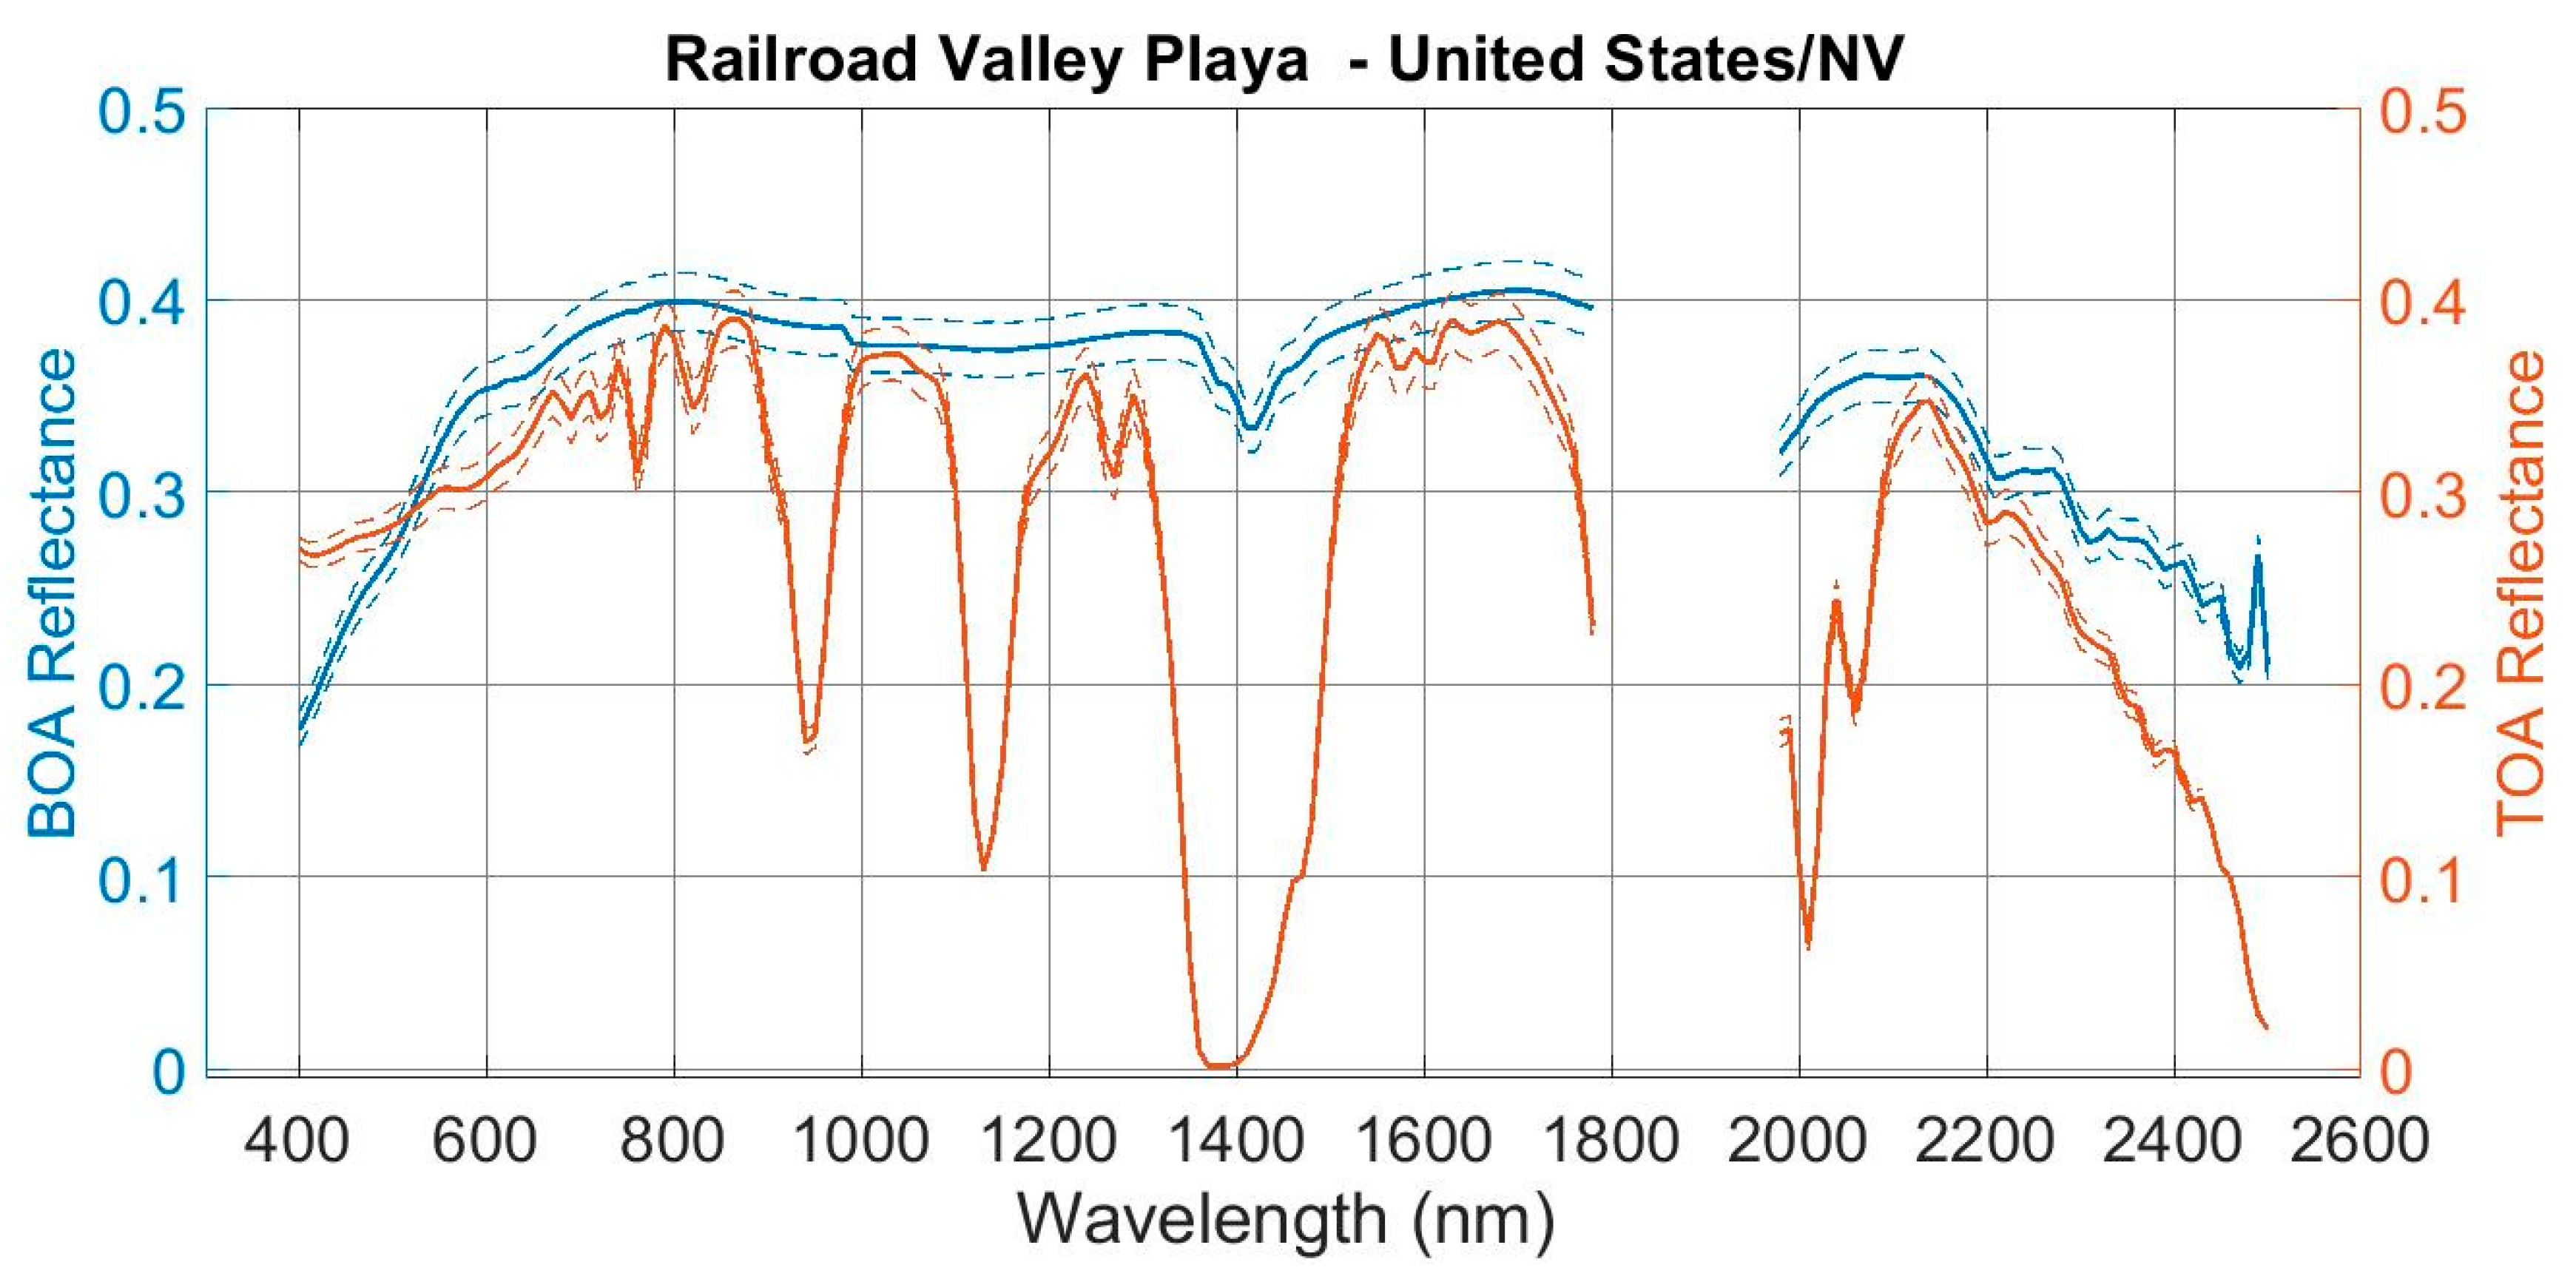
Figure 7.
In the y-axis left and right side of the graph is presented, respectively, the BOA and TOA reflectance of La Crau (LCFR) measured in-situ on 9 September 2019.
Figure 7.
In the y-axis left and right side of the graph is presented, respectively, the BOA and TOA reflectance of La Crau (LCFR) measured in-situ on 9 September 2019.
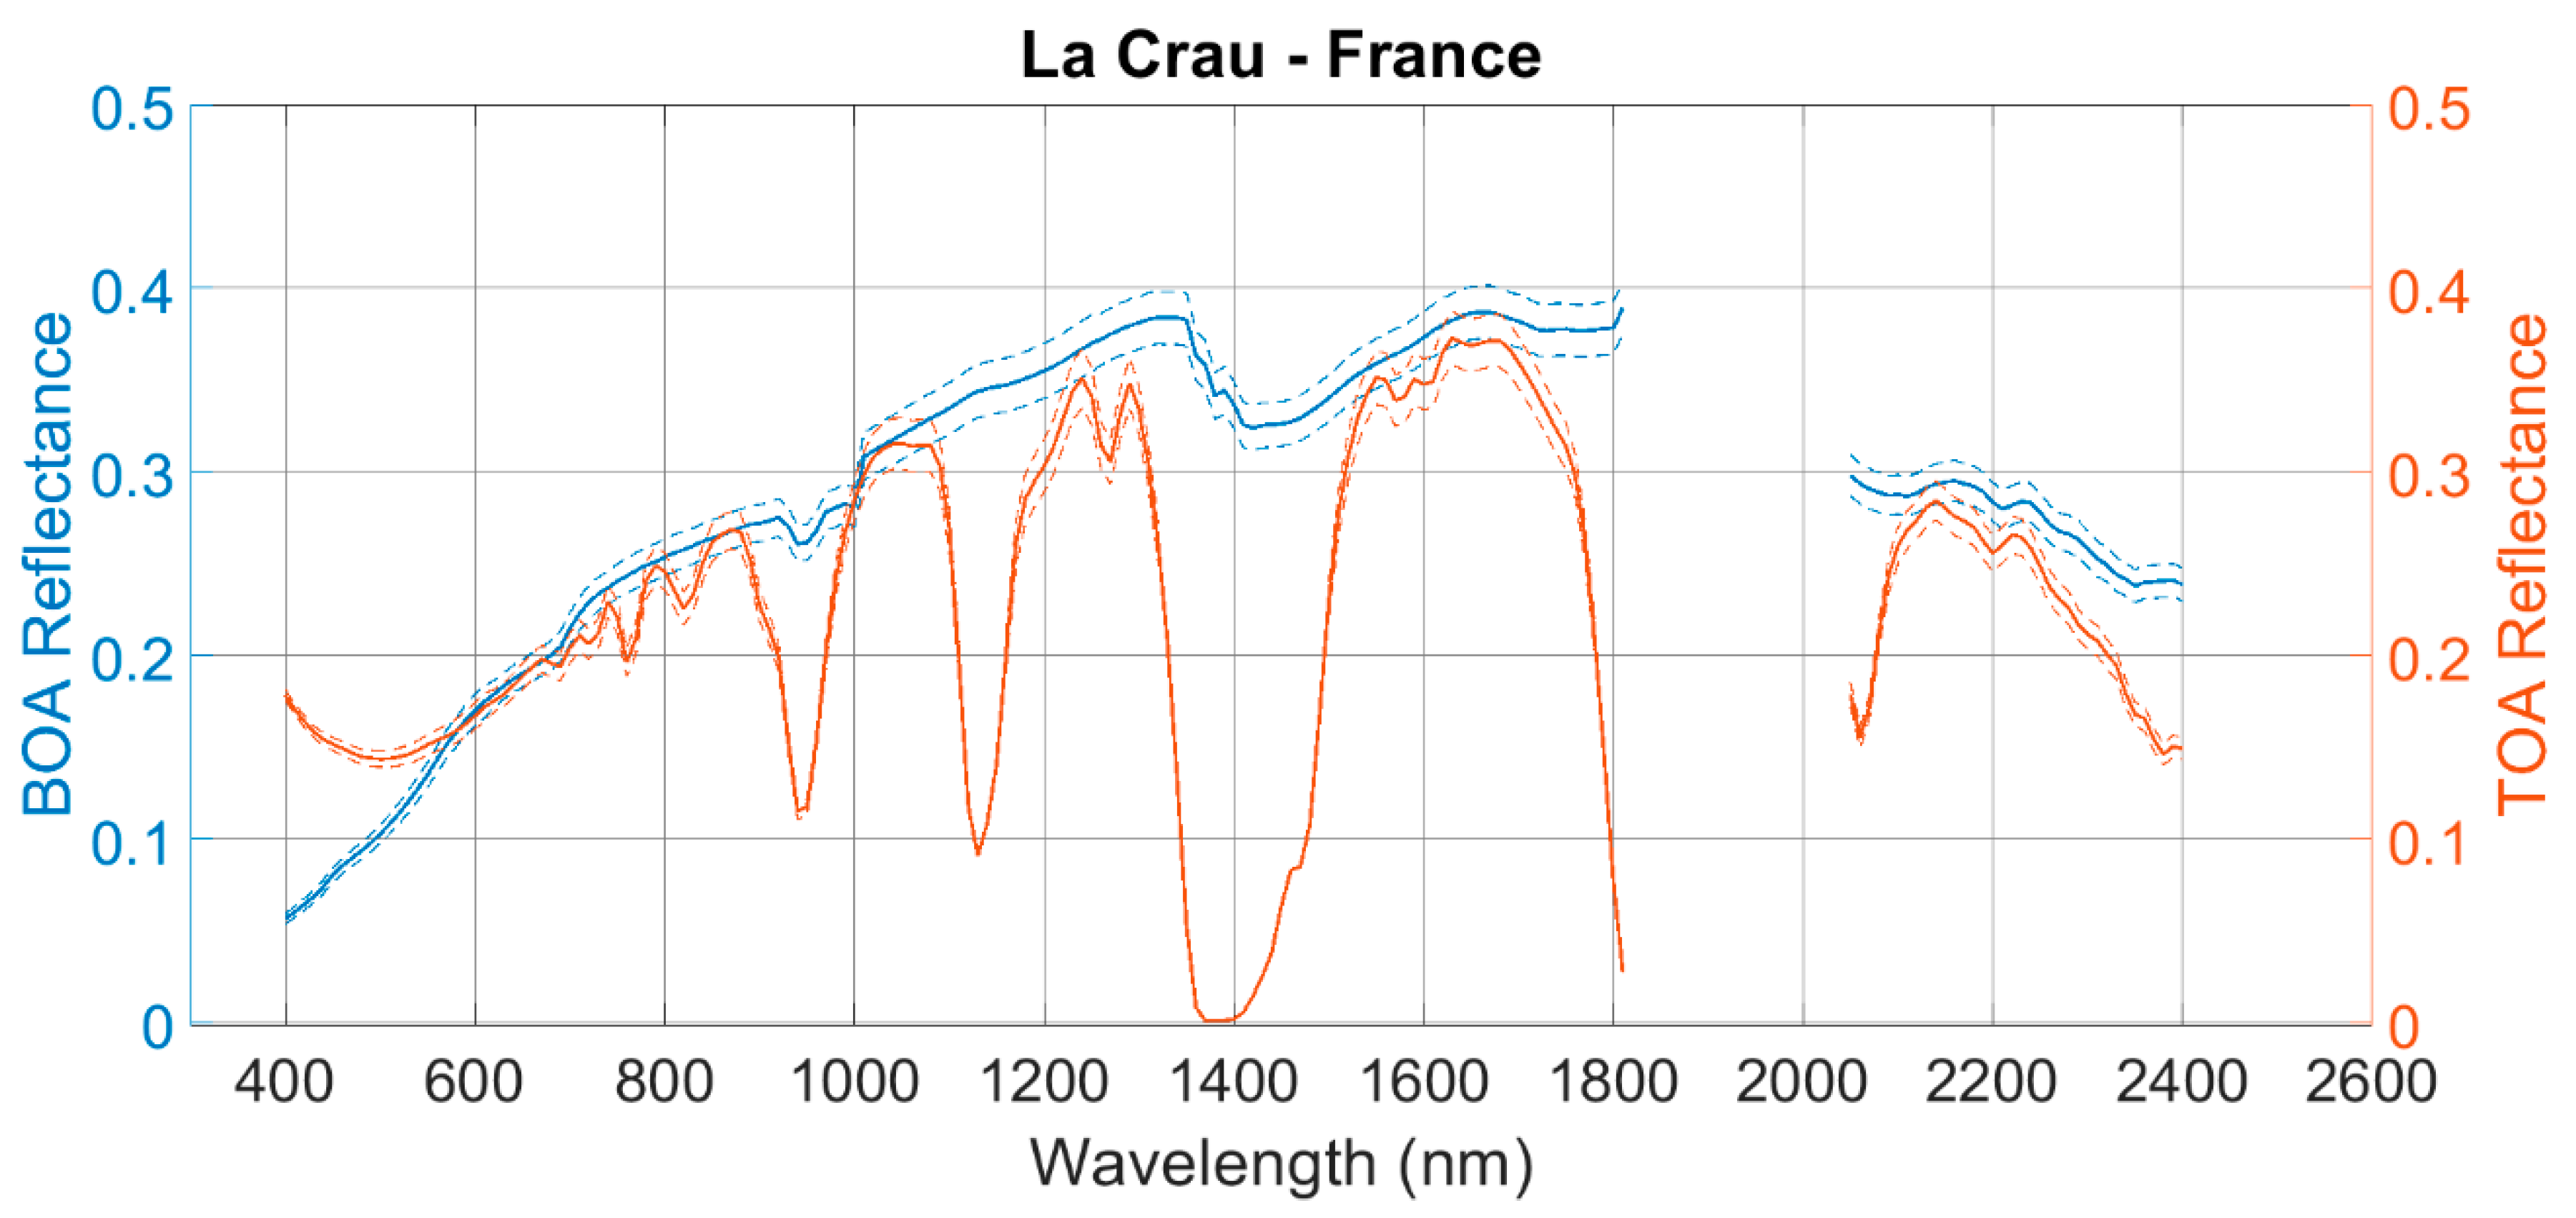
Figure 8.
In the y-axis left and right side of the graph is presented, respectively, the BOA and TOA reflectance of the Gobabeb (GONA) measured in situ on 10 October 2019.
Figure 8.
In the y-axis left and right side of the graph is presented, respectively, the BOA and TOA reflectance of the Gobabeb (GONA) measured in situ on 10 October 2019.
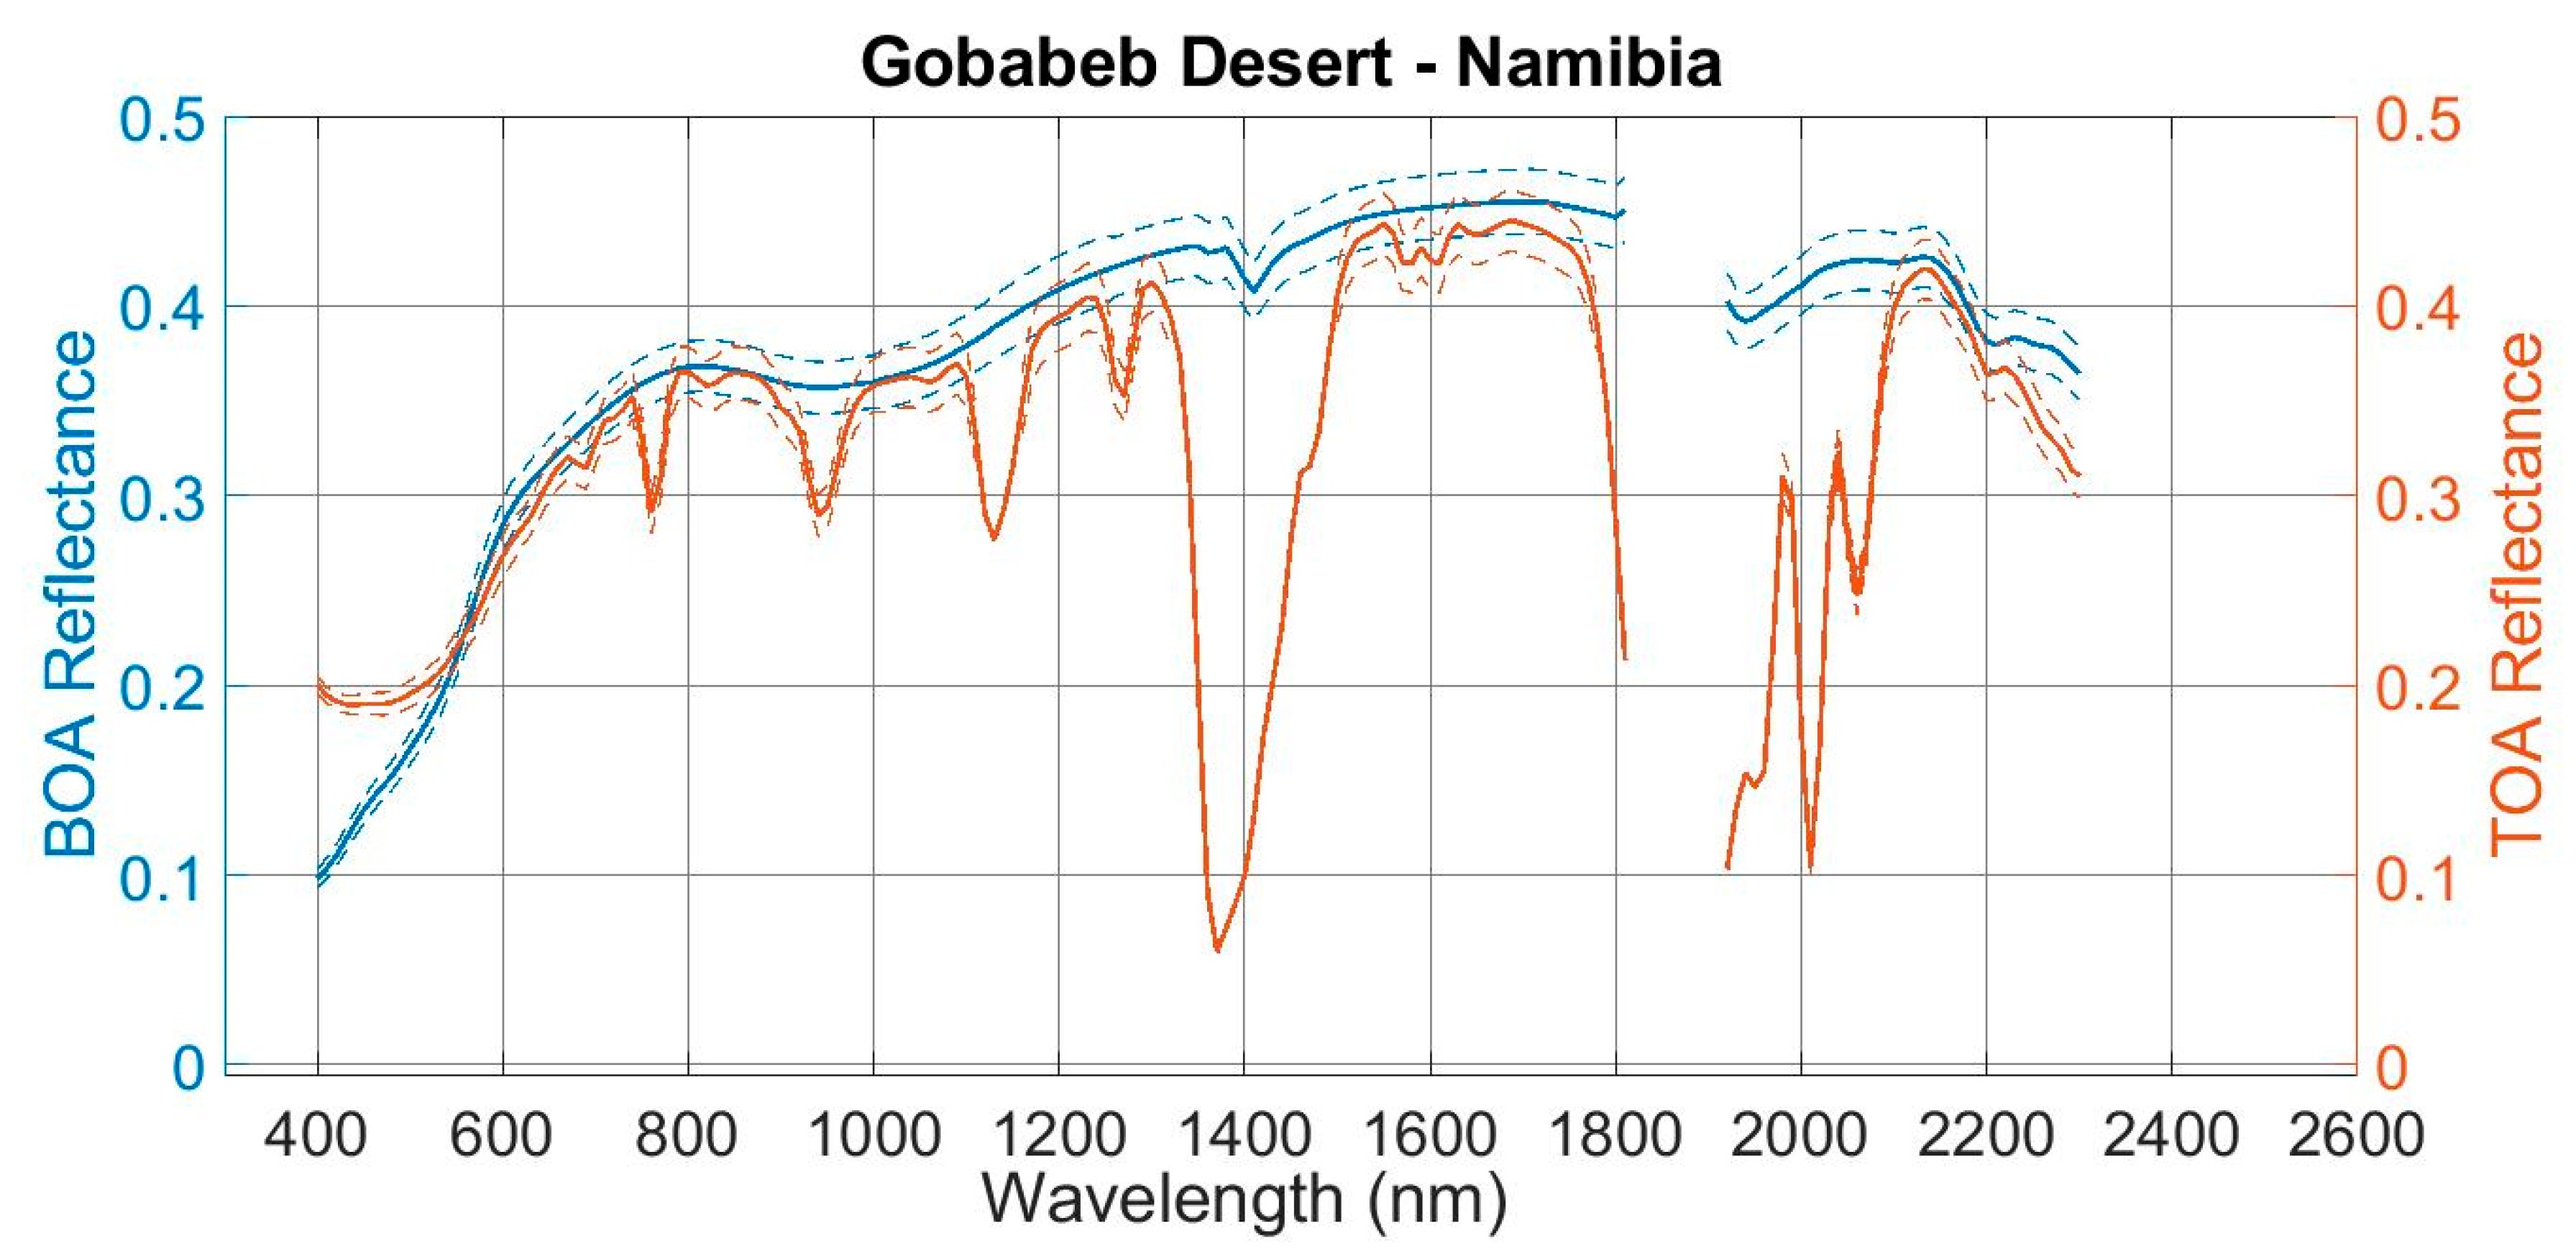
Figure 9.
General flowchart for Landsat Level-1 data product evaluation. During the Landsat overpass, hyperspectral ground surface reflectance and sun-photometer measurements are acquired. The data derived from the ground measurements are used as inputs to a radiative transfer code to predict the TOA radiance/reflectance values. The in situ derived TOA reflectance is compared to the Level-1 reflectance data product.
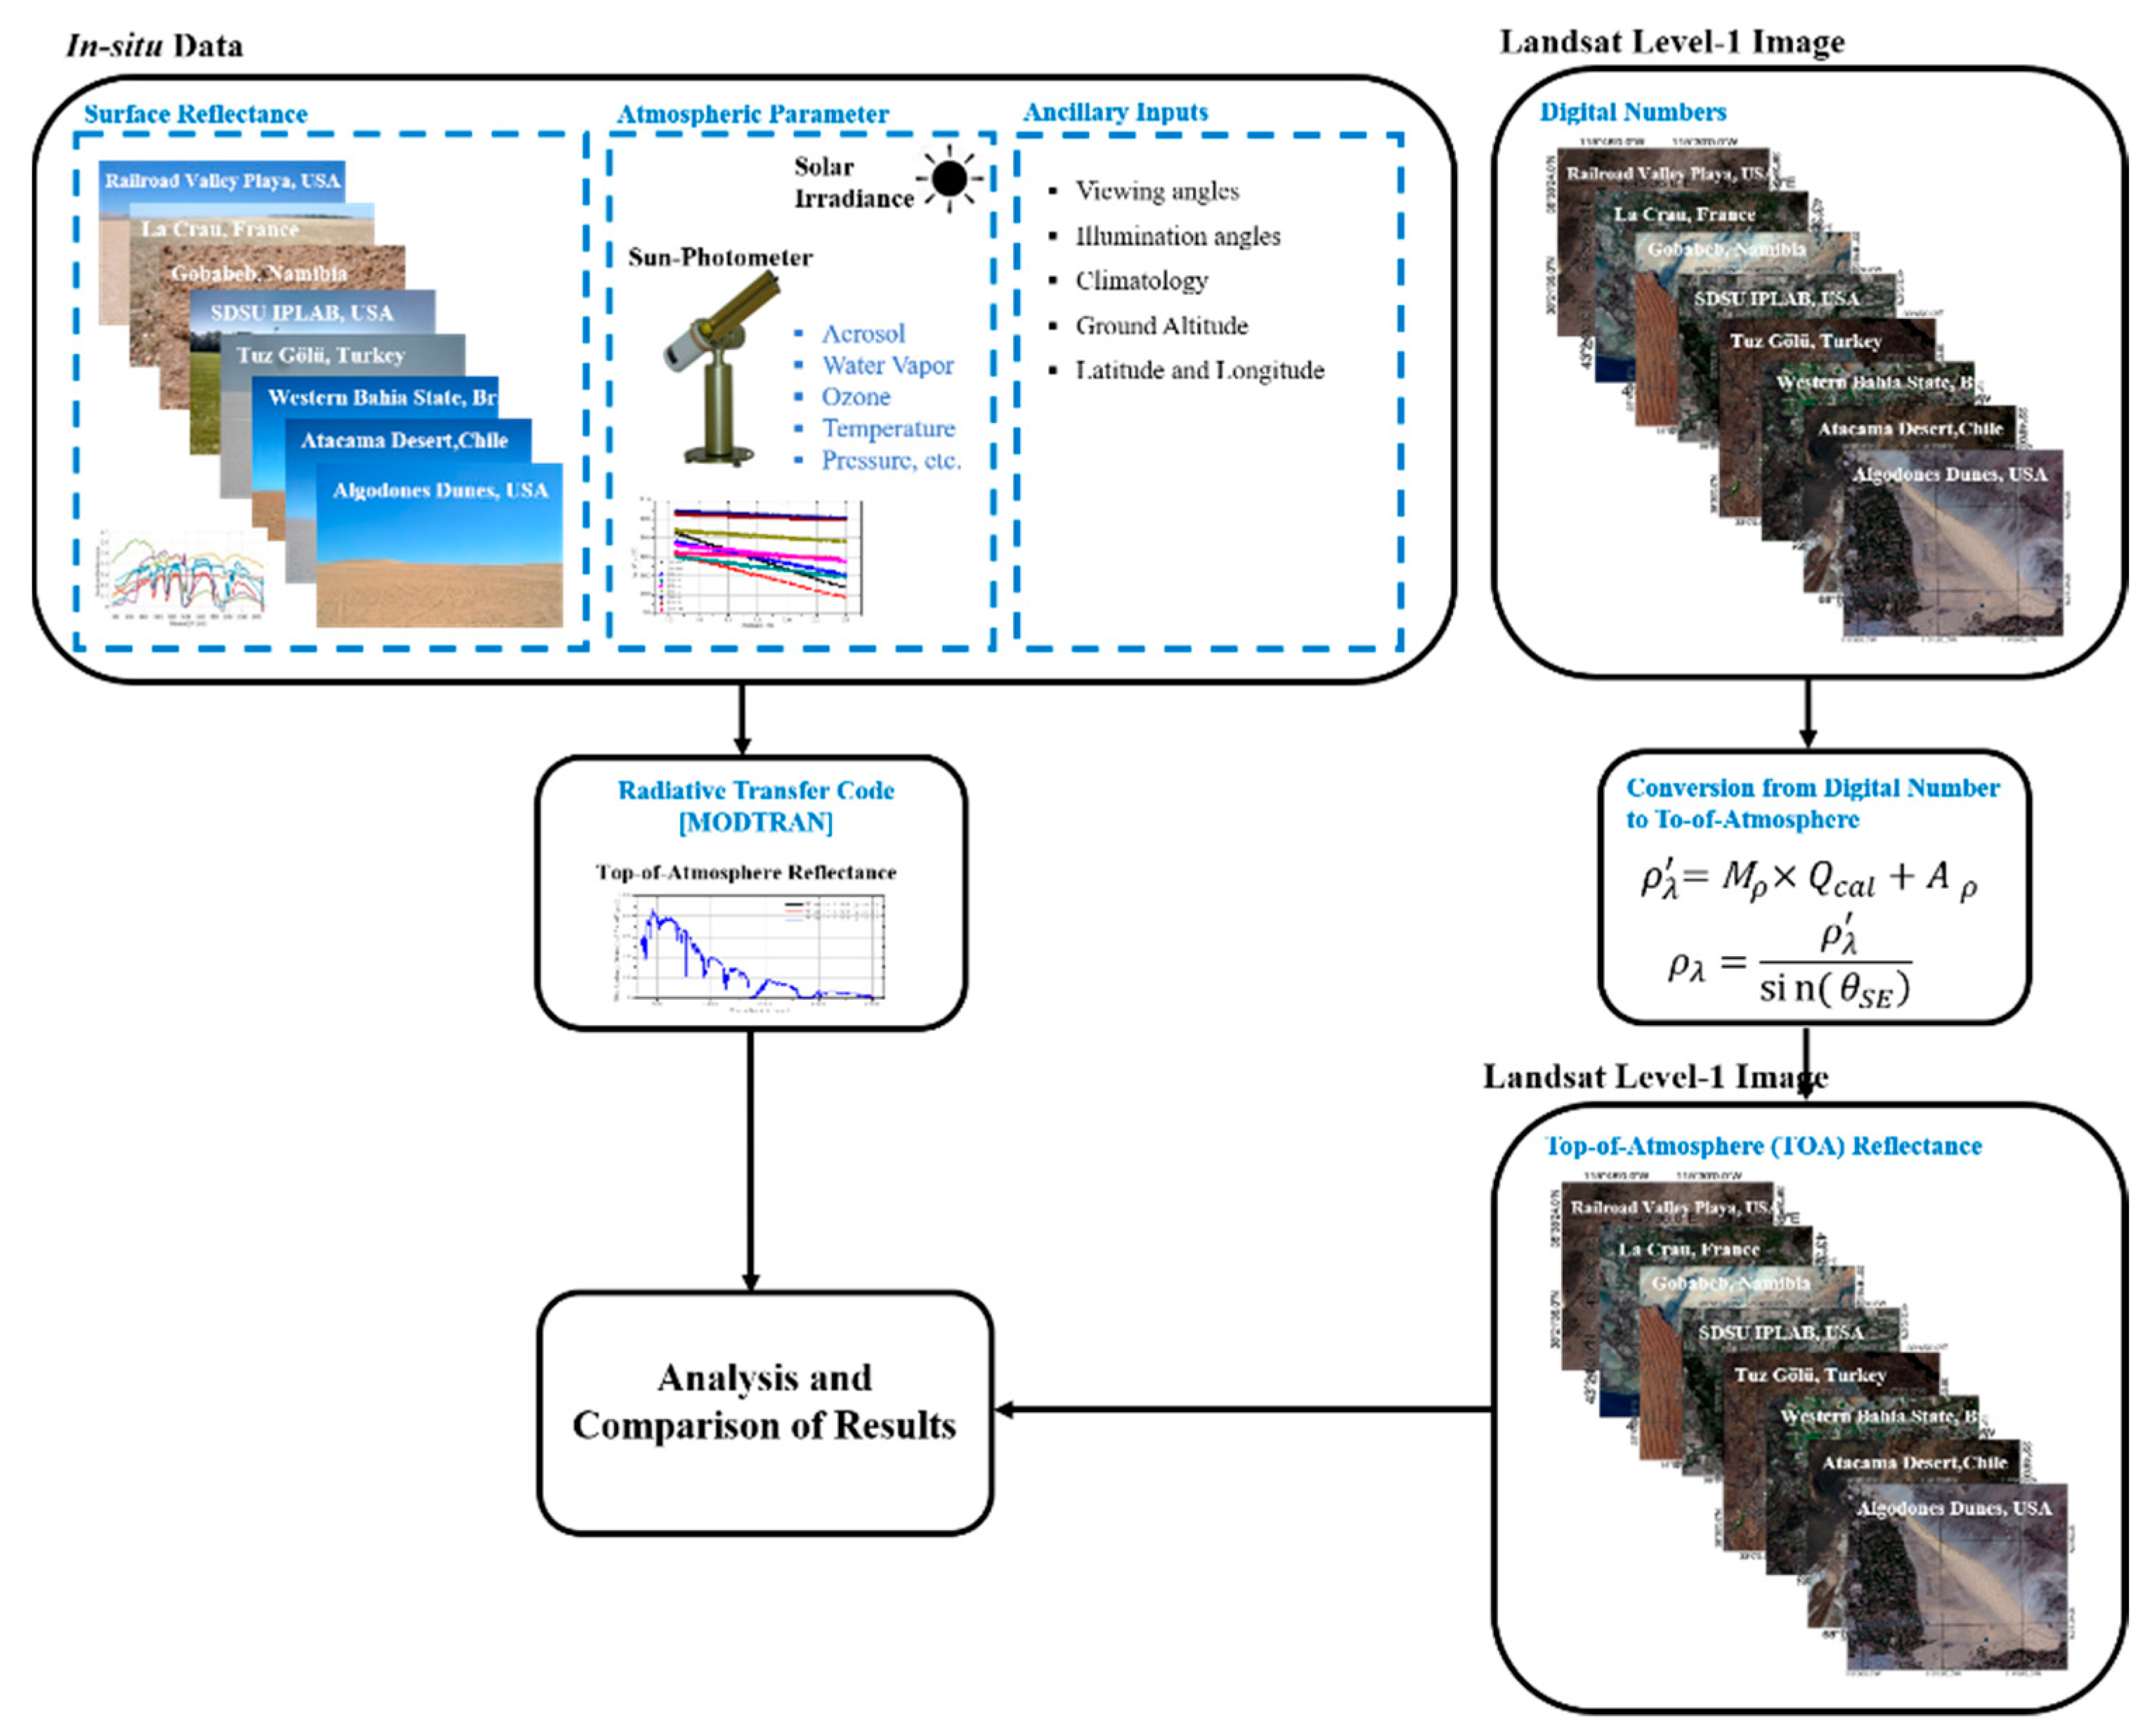
Figure 10.
General flowchart for Landsat Level-2 data product evaluation. Landsat-8 Operational Land Imager (OLI) and Landsat-7 Enhanced Thematic Mapper Plus (ETM+) Level-2 surface reflectance data products are generated from the Level 1 products using, respectively, the Land Surface Reflectance Code (LaSRC) and Landsat Ecosystem Disturbance Adaptive Processing System (LEDAPS) algorithms. During the Landsat overpass, hyperspectral ground surface reflectance measurements are acquired. The in situ measured surface reflectance is then compared to the Level-2 surface reflectance data product.
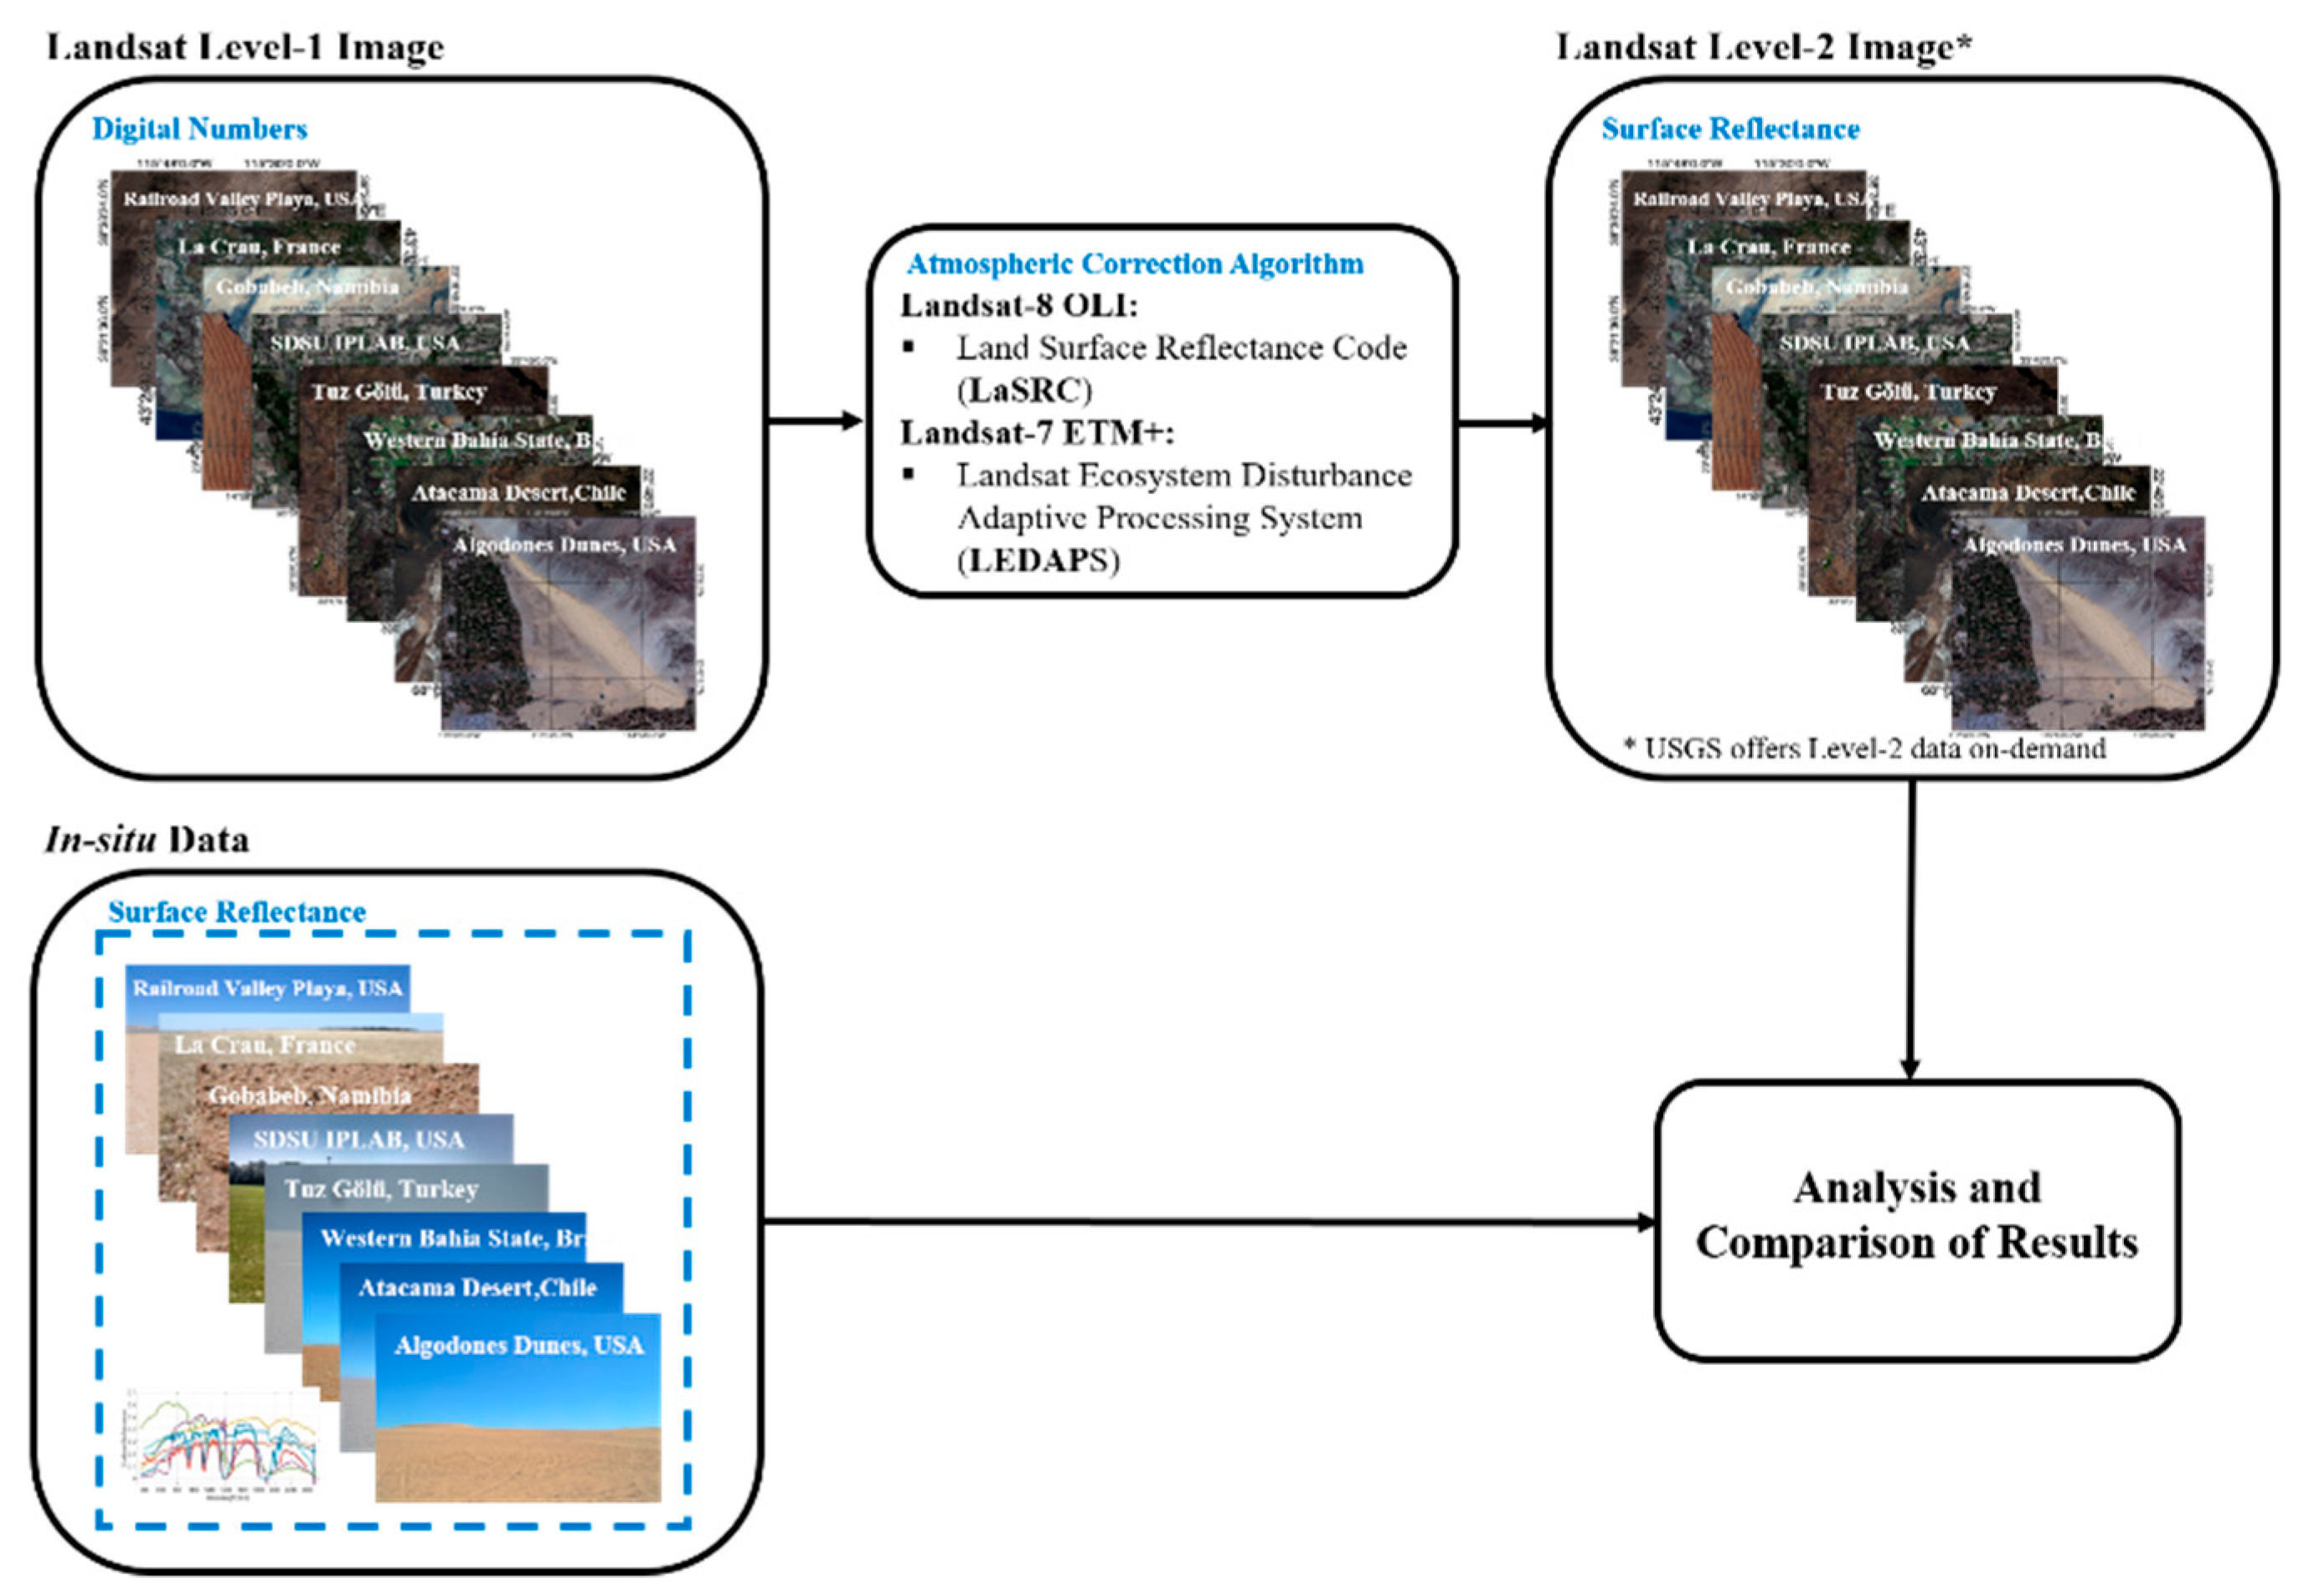
Figure 11.
Scatterplots by band of Landsat-7 ETM+ Level-1 TOA reflectance data versus TOA reflectance derived from in situ measurements.
Figure 11.
Scatterplots by band of Landsat-7 ETM+ Level-1 TOA reflectance data versus TOA reflectance derived from in situ measurements.
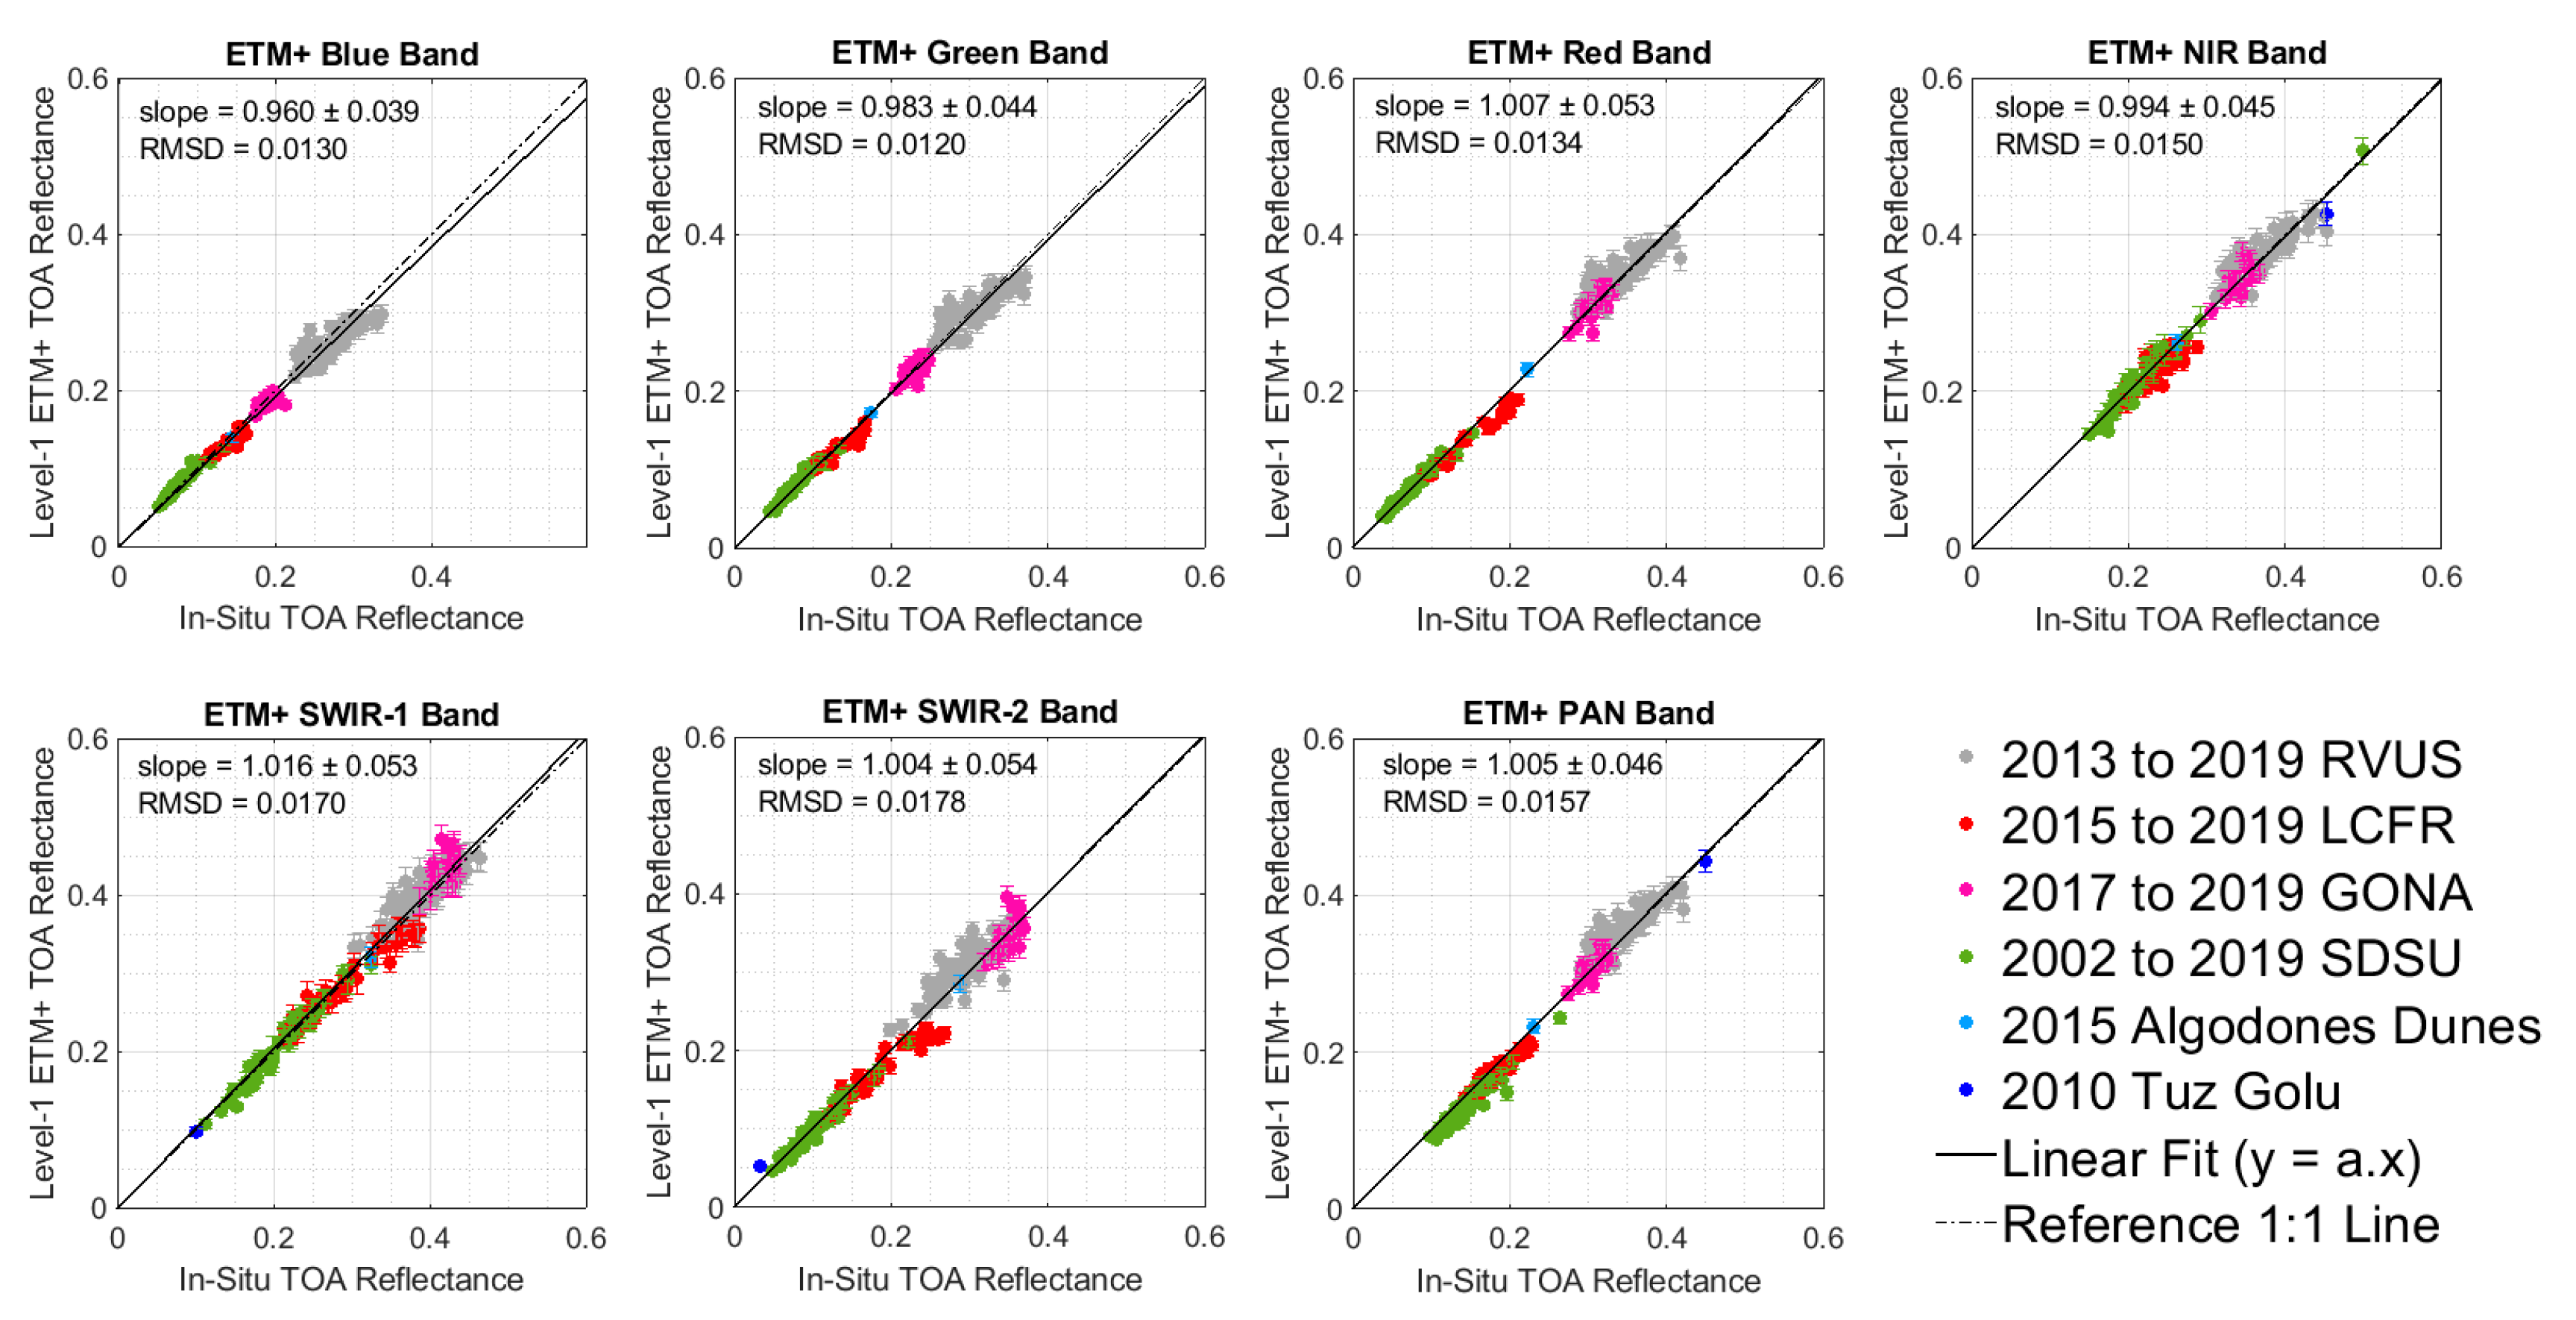
Figure 12.
Temporal trends, by band, of residuals errors in TOA reflectance predicted from in situ measurement and Landsat-7 ETM+ Level-1 TOA reflectance data.
Figure 12.
Temporal trends, by band, of residuals errors in TOA reflectance predicted from in situ measurement and Landsat-7 ETM+ Level-1 TOA reflectance data.
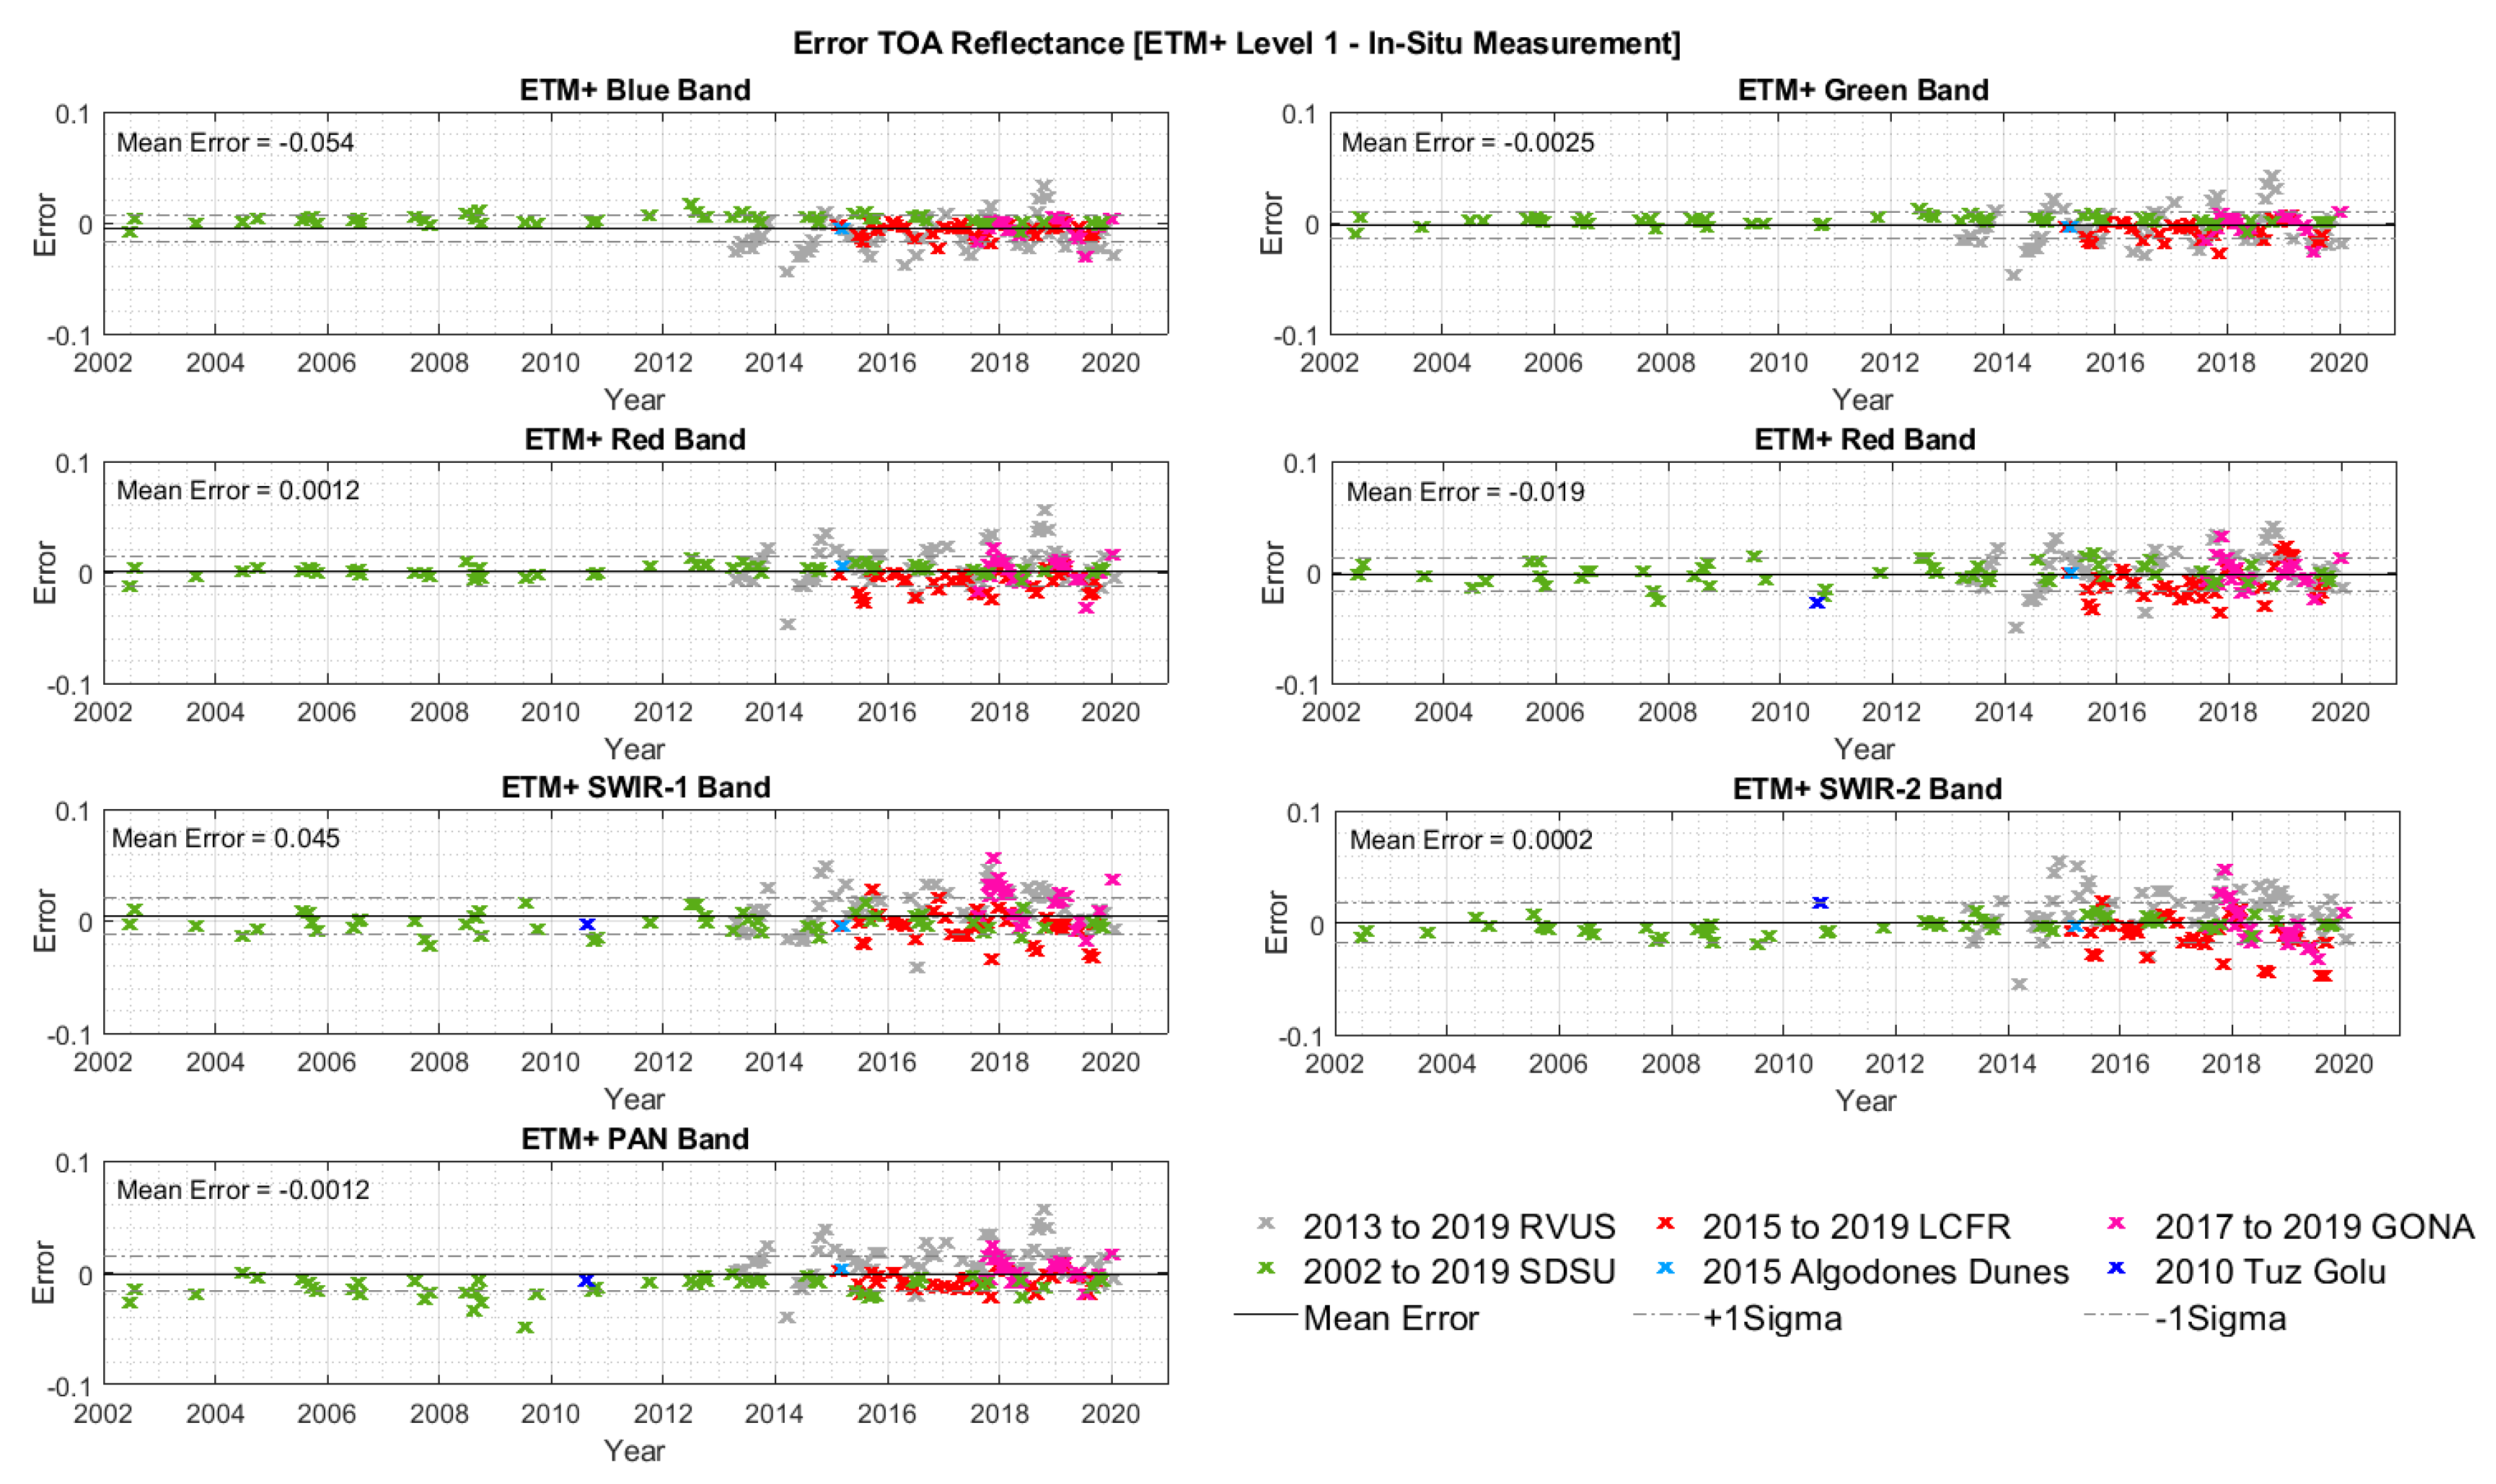
Figure 13.
Scatterplots by band of Landsat-8 OLI Level-1 TOA reflectance data versus TOA reflectance values derived from in situ measurement.
Figure 13.
Scatterplots by band of Landsat-8 OLI Level-1 TOA reflectance data versus TOA reflectance values derived from in situ measurement.
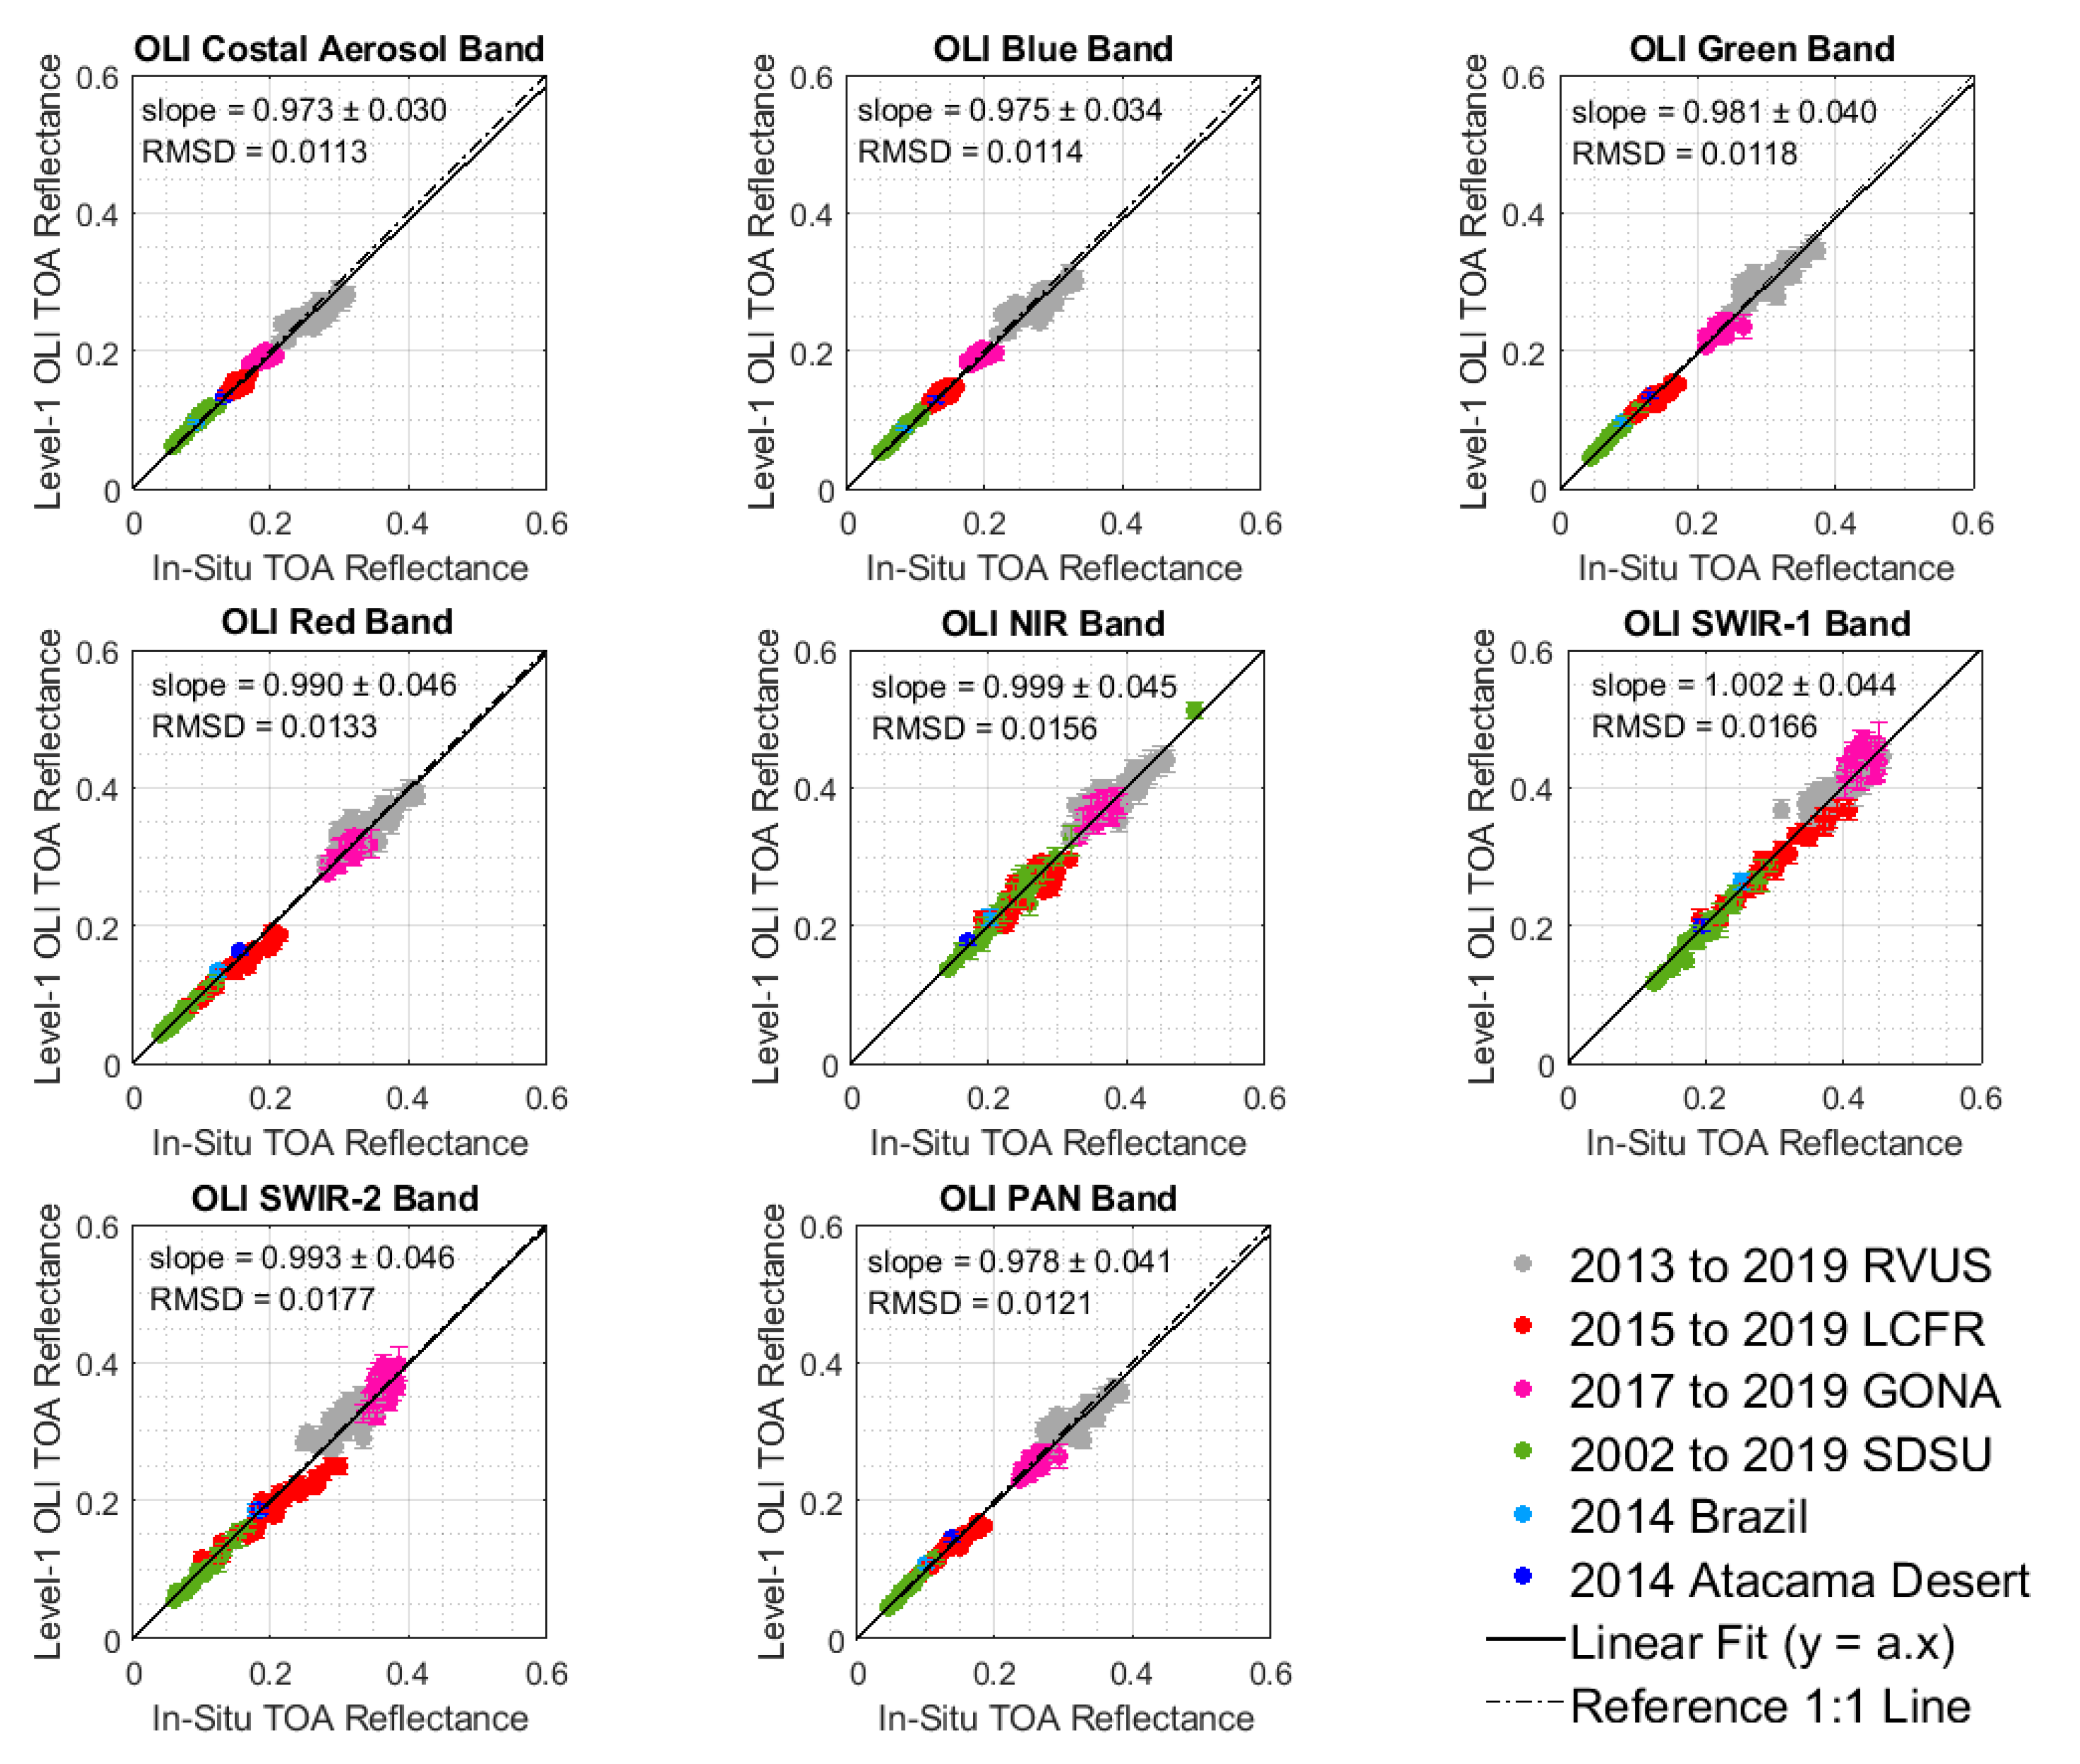
Figure 14.
Temporal trends, by band, of residuals errors in TOA reflectance predicted from in situ measurement and Landsat-8 OLI Level-1 TOA reflectance data.
Figure 14.
Temporal trends, by band, of residuals errors in TOA reflectance predicted from in situ measurement and Landsat-8 OLI Level-1 TOA reflectance data.
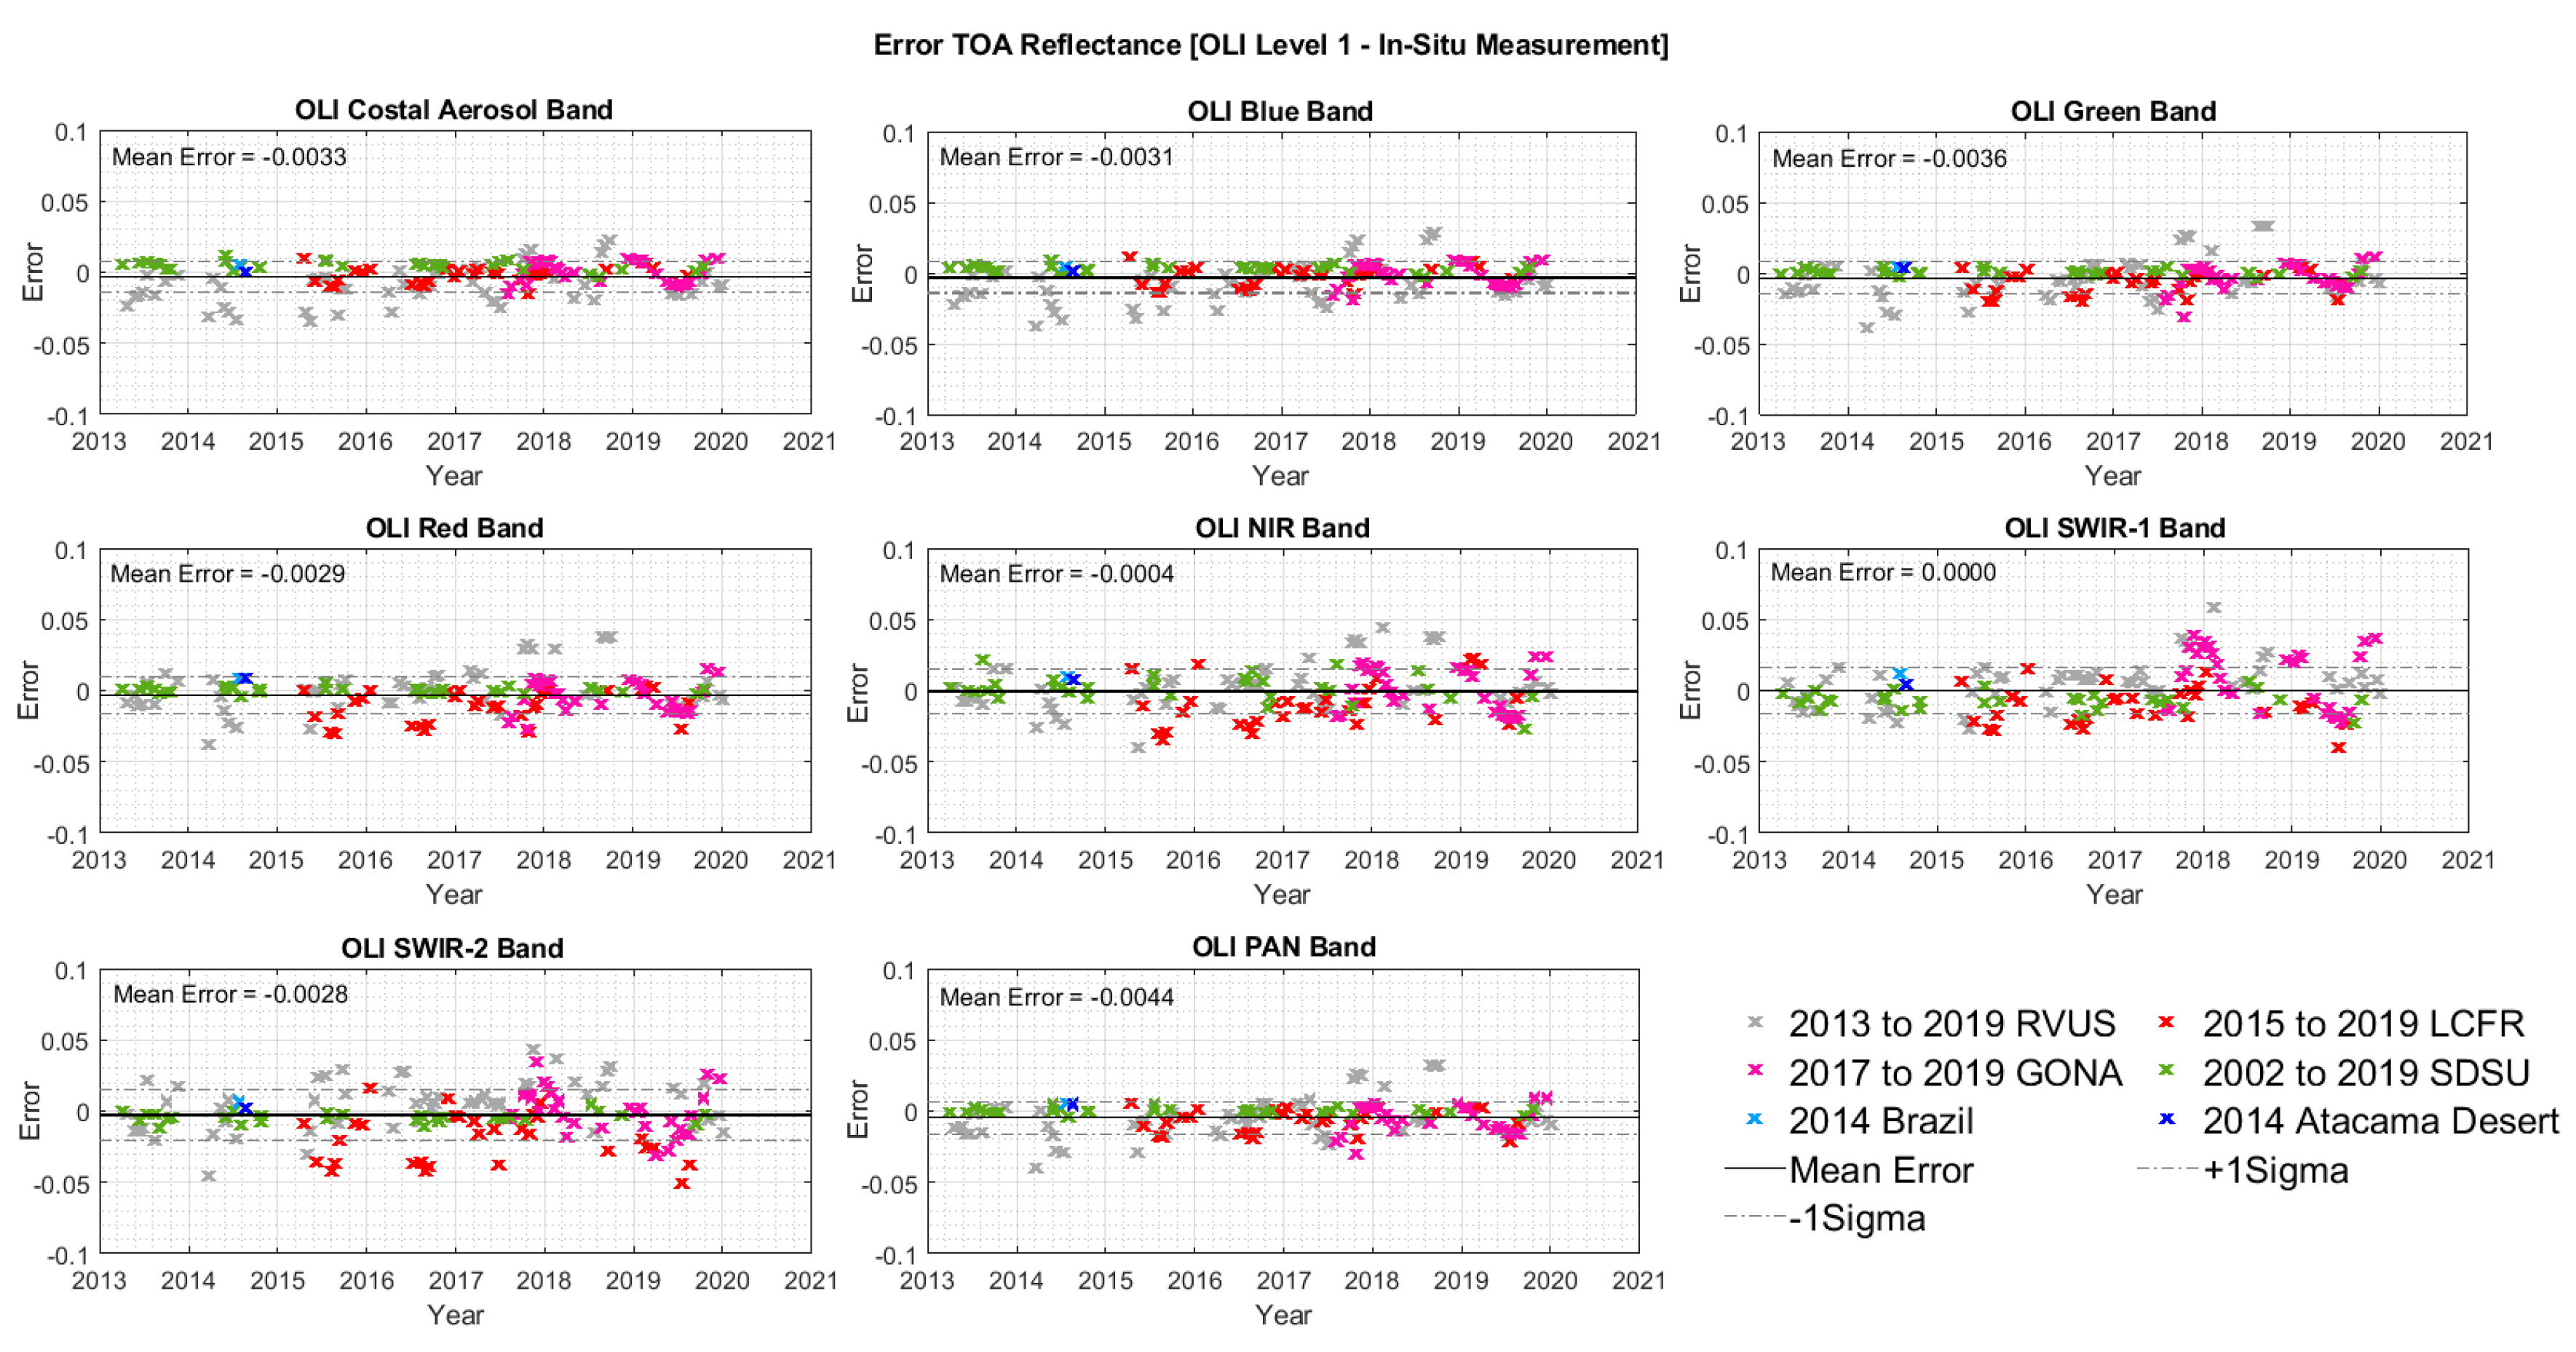
Figure 15.
Scatterplots by band of Landsat-7 ETM+ Level-2 surface reflectance data product versus surface reflectance values derived from in situ measurement.
Figure 15.
Scatterplots by band of Landsat-7 ETM+ Level-2 surface reflectance data product versus surface reflectance values derived from in situ measurement.
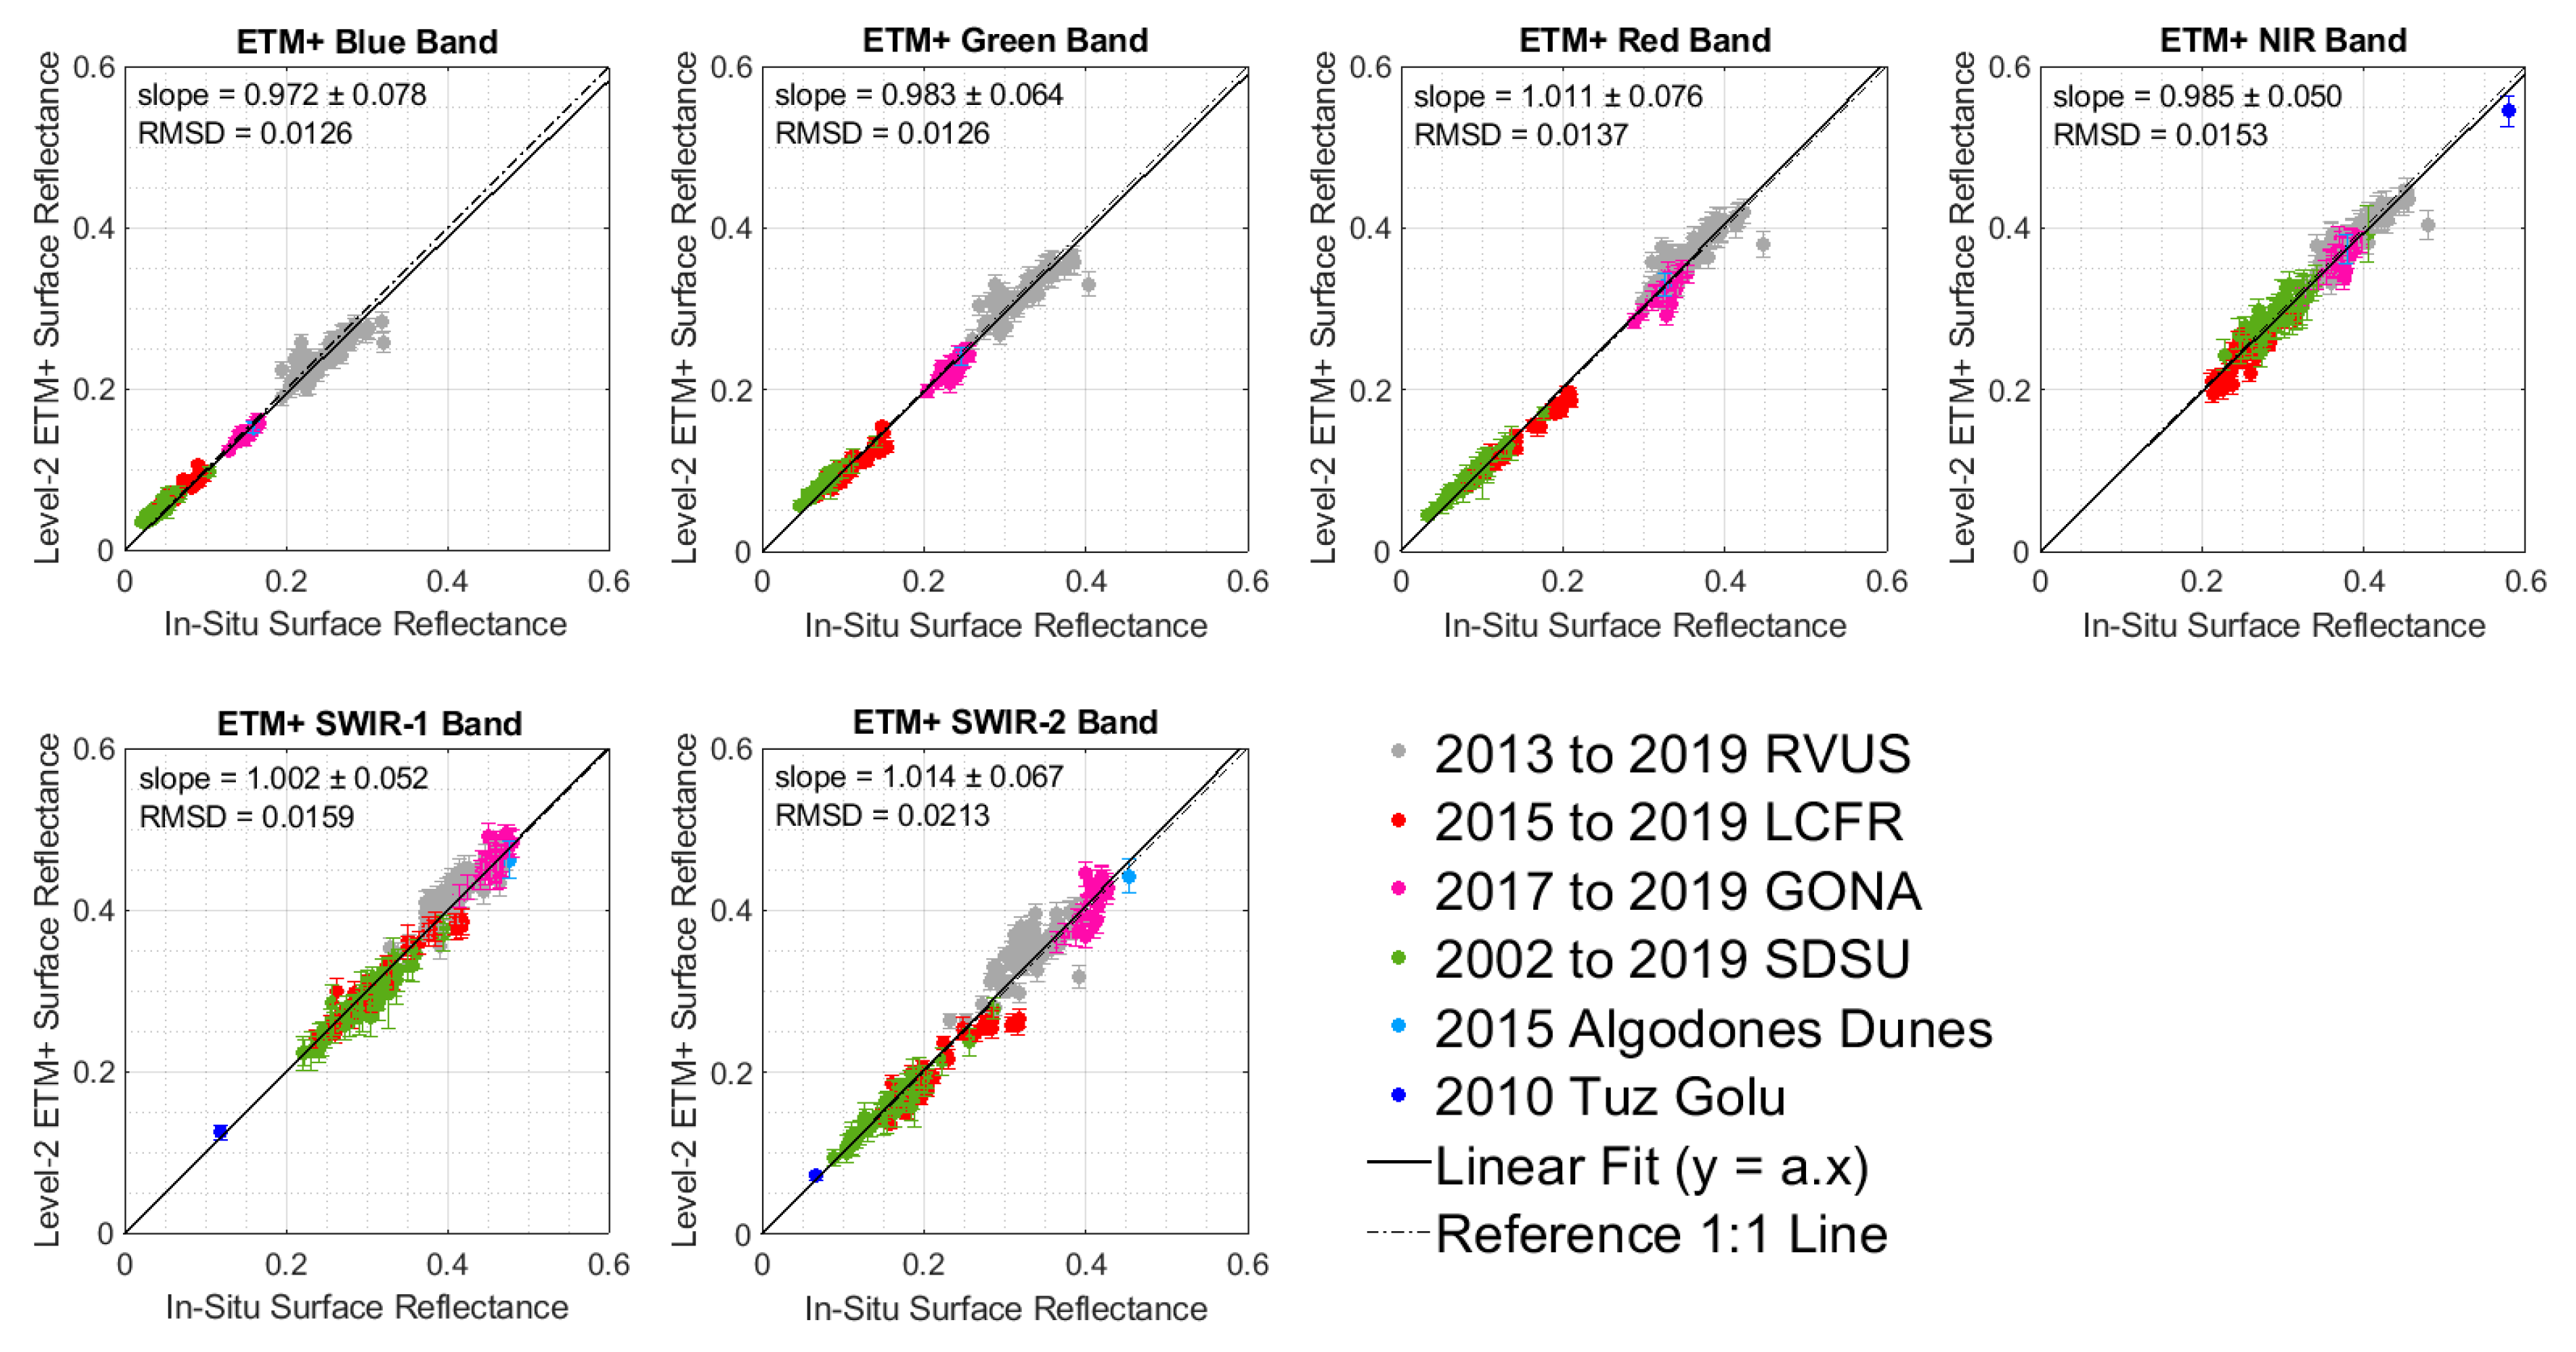
Figure 16.
Temporal trends, by band, of residuals errors in surface reflectance predicted from in situ measurement and Landsat-7 ETM+ Level-2 surface reflectance data.
Figure 16.
Temporal trends, by band, of residuals errors in surface reflectance predicted from in situ measurement and Landsat-7 ETM+ Level-2 surface reflectance data.
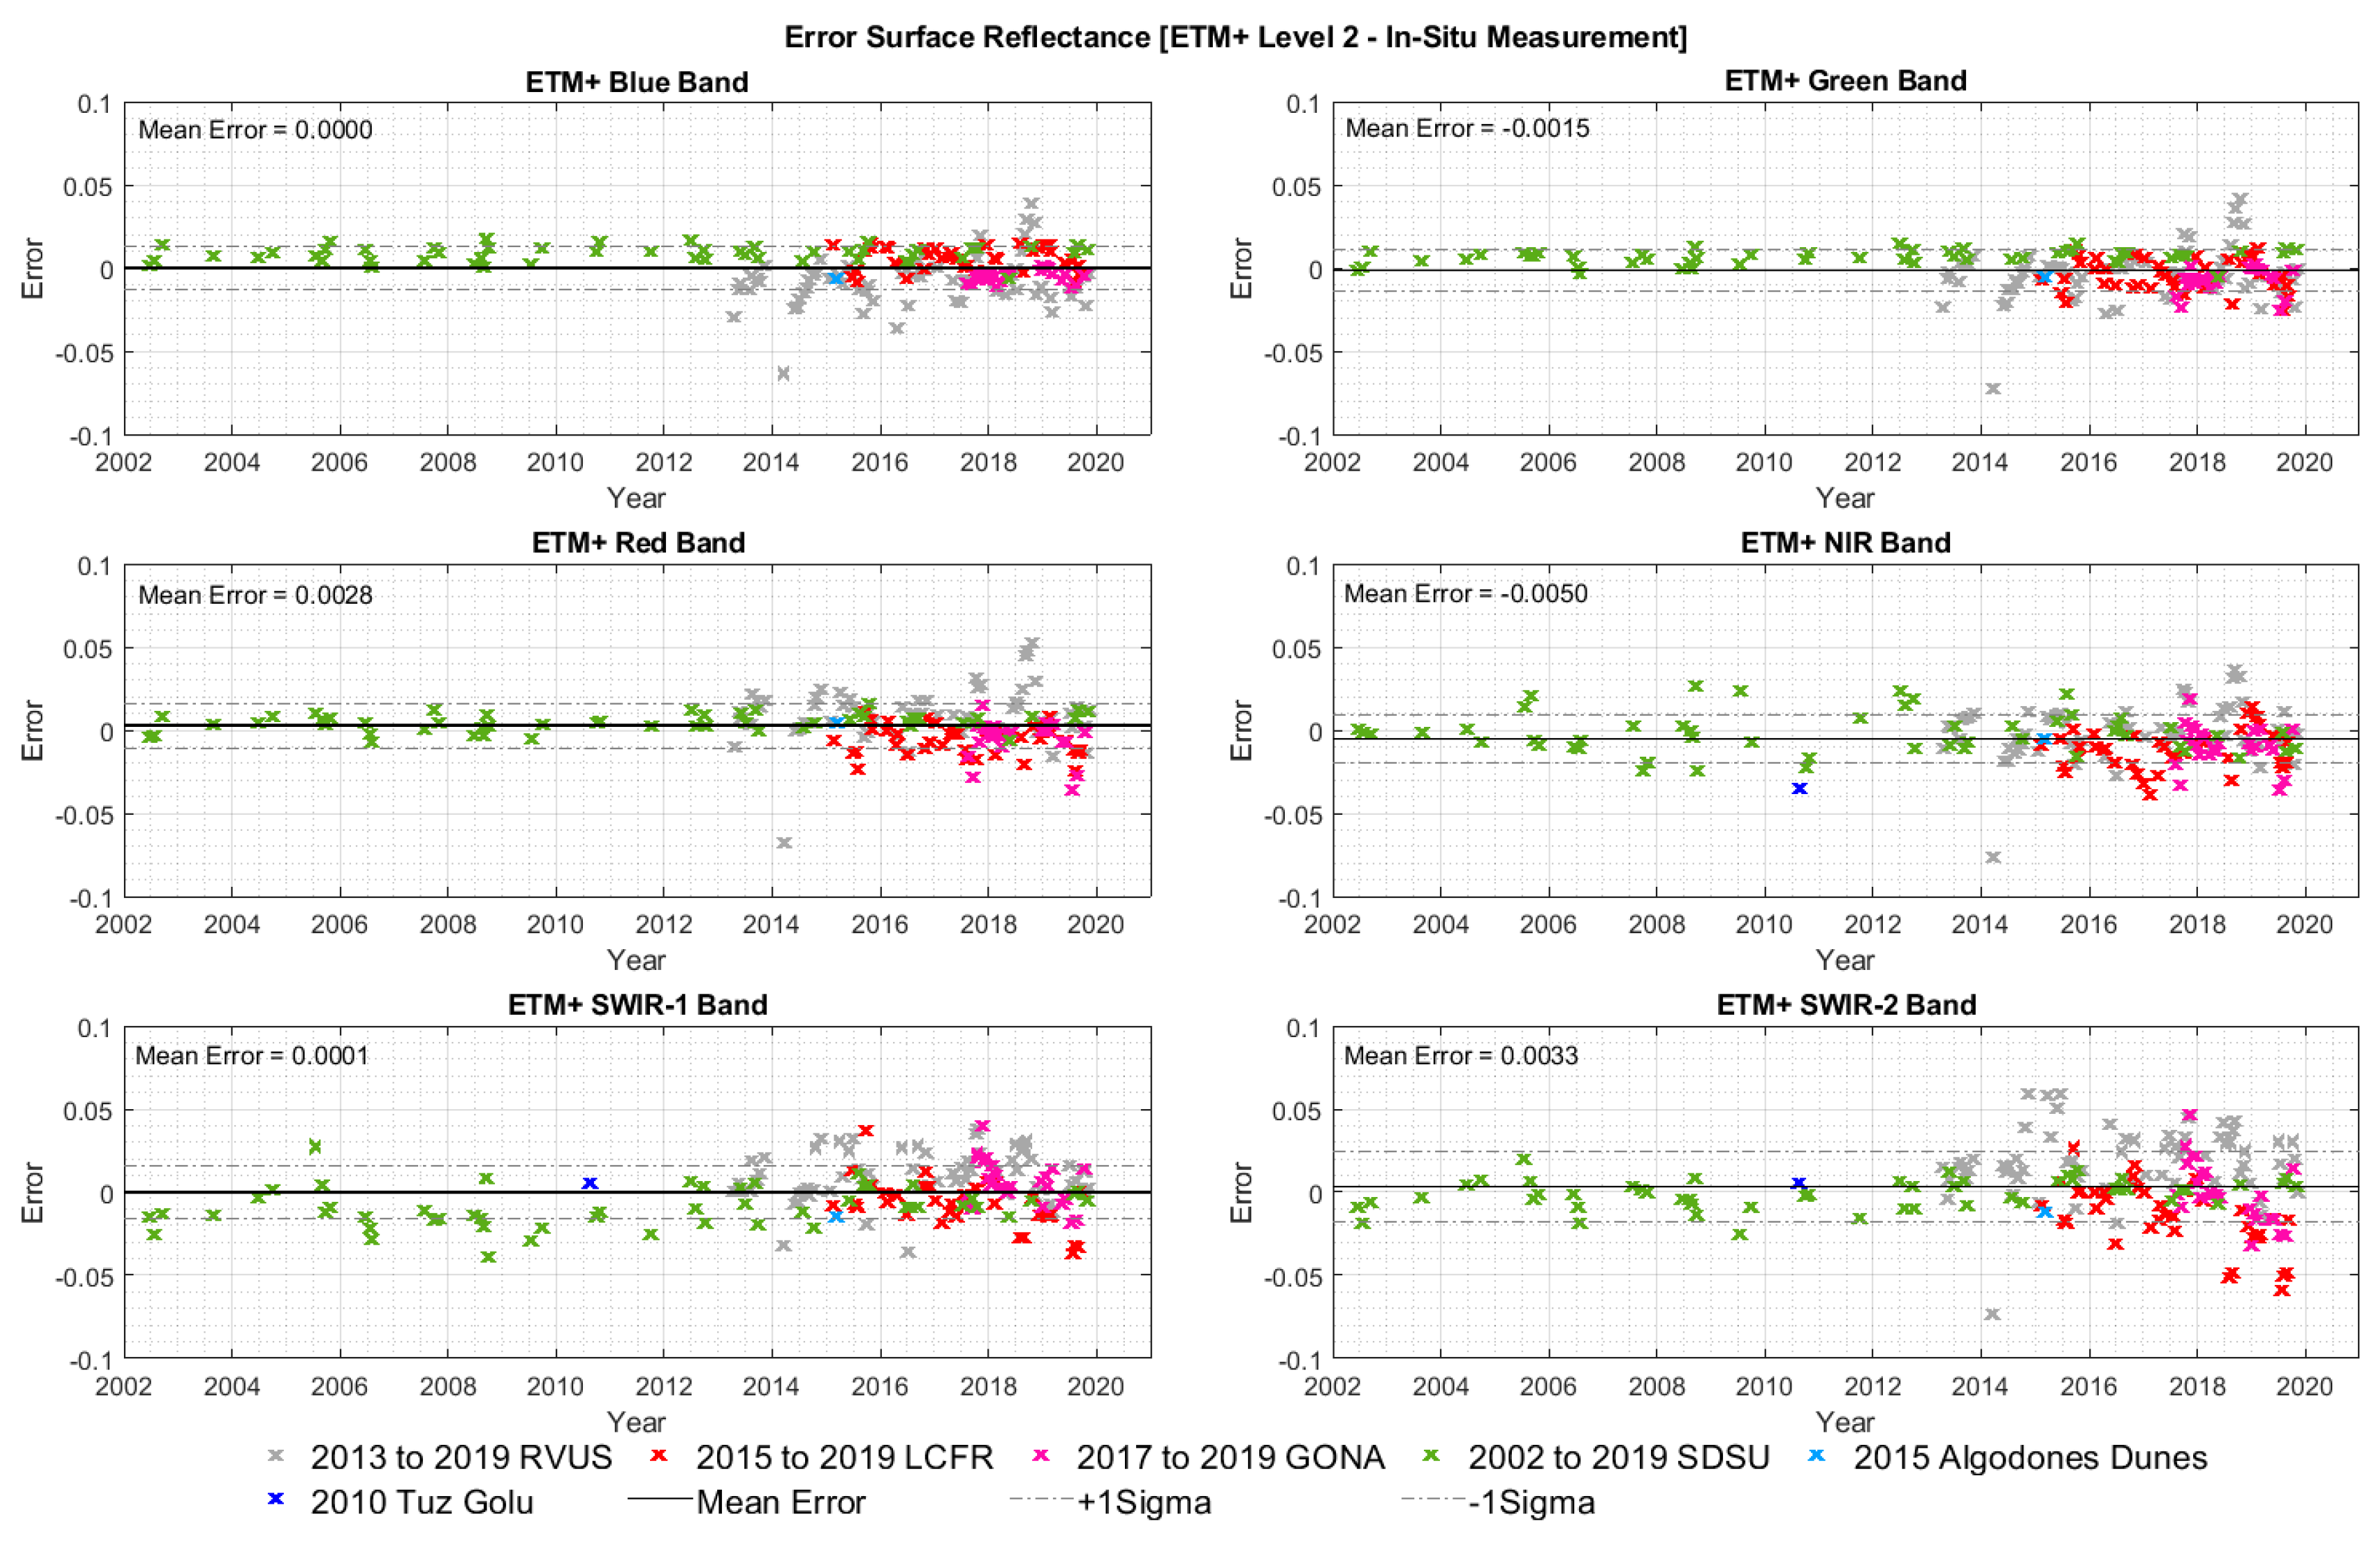
Figure 17.
Scatterplots by band of Landsat-8 OLI Level-2 surface reflectance data product versus surface reflectance values derived from in-situmeasurement.
Figure 17.
Scatterplots by band of Landsat-8 OLI Level-2 surface reflectance data product versus surface reflectance values derived from in-situmeasurement.
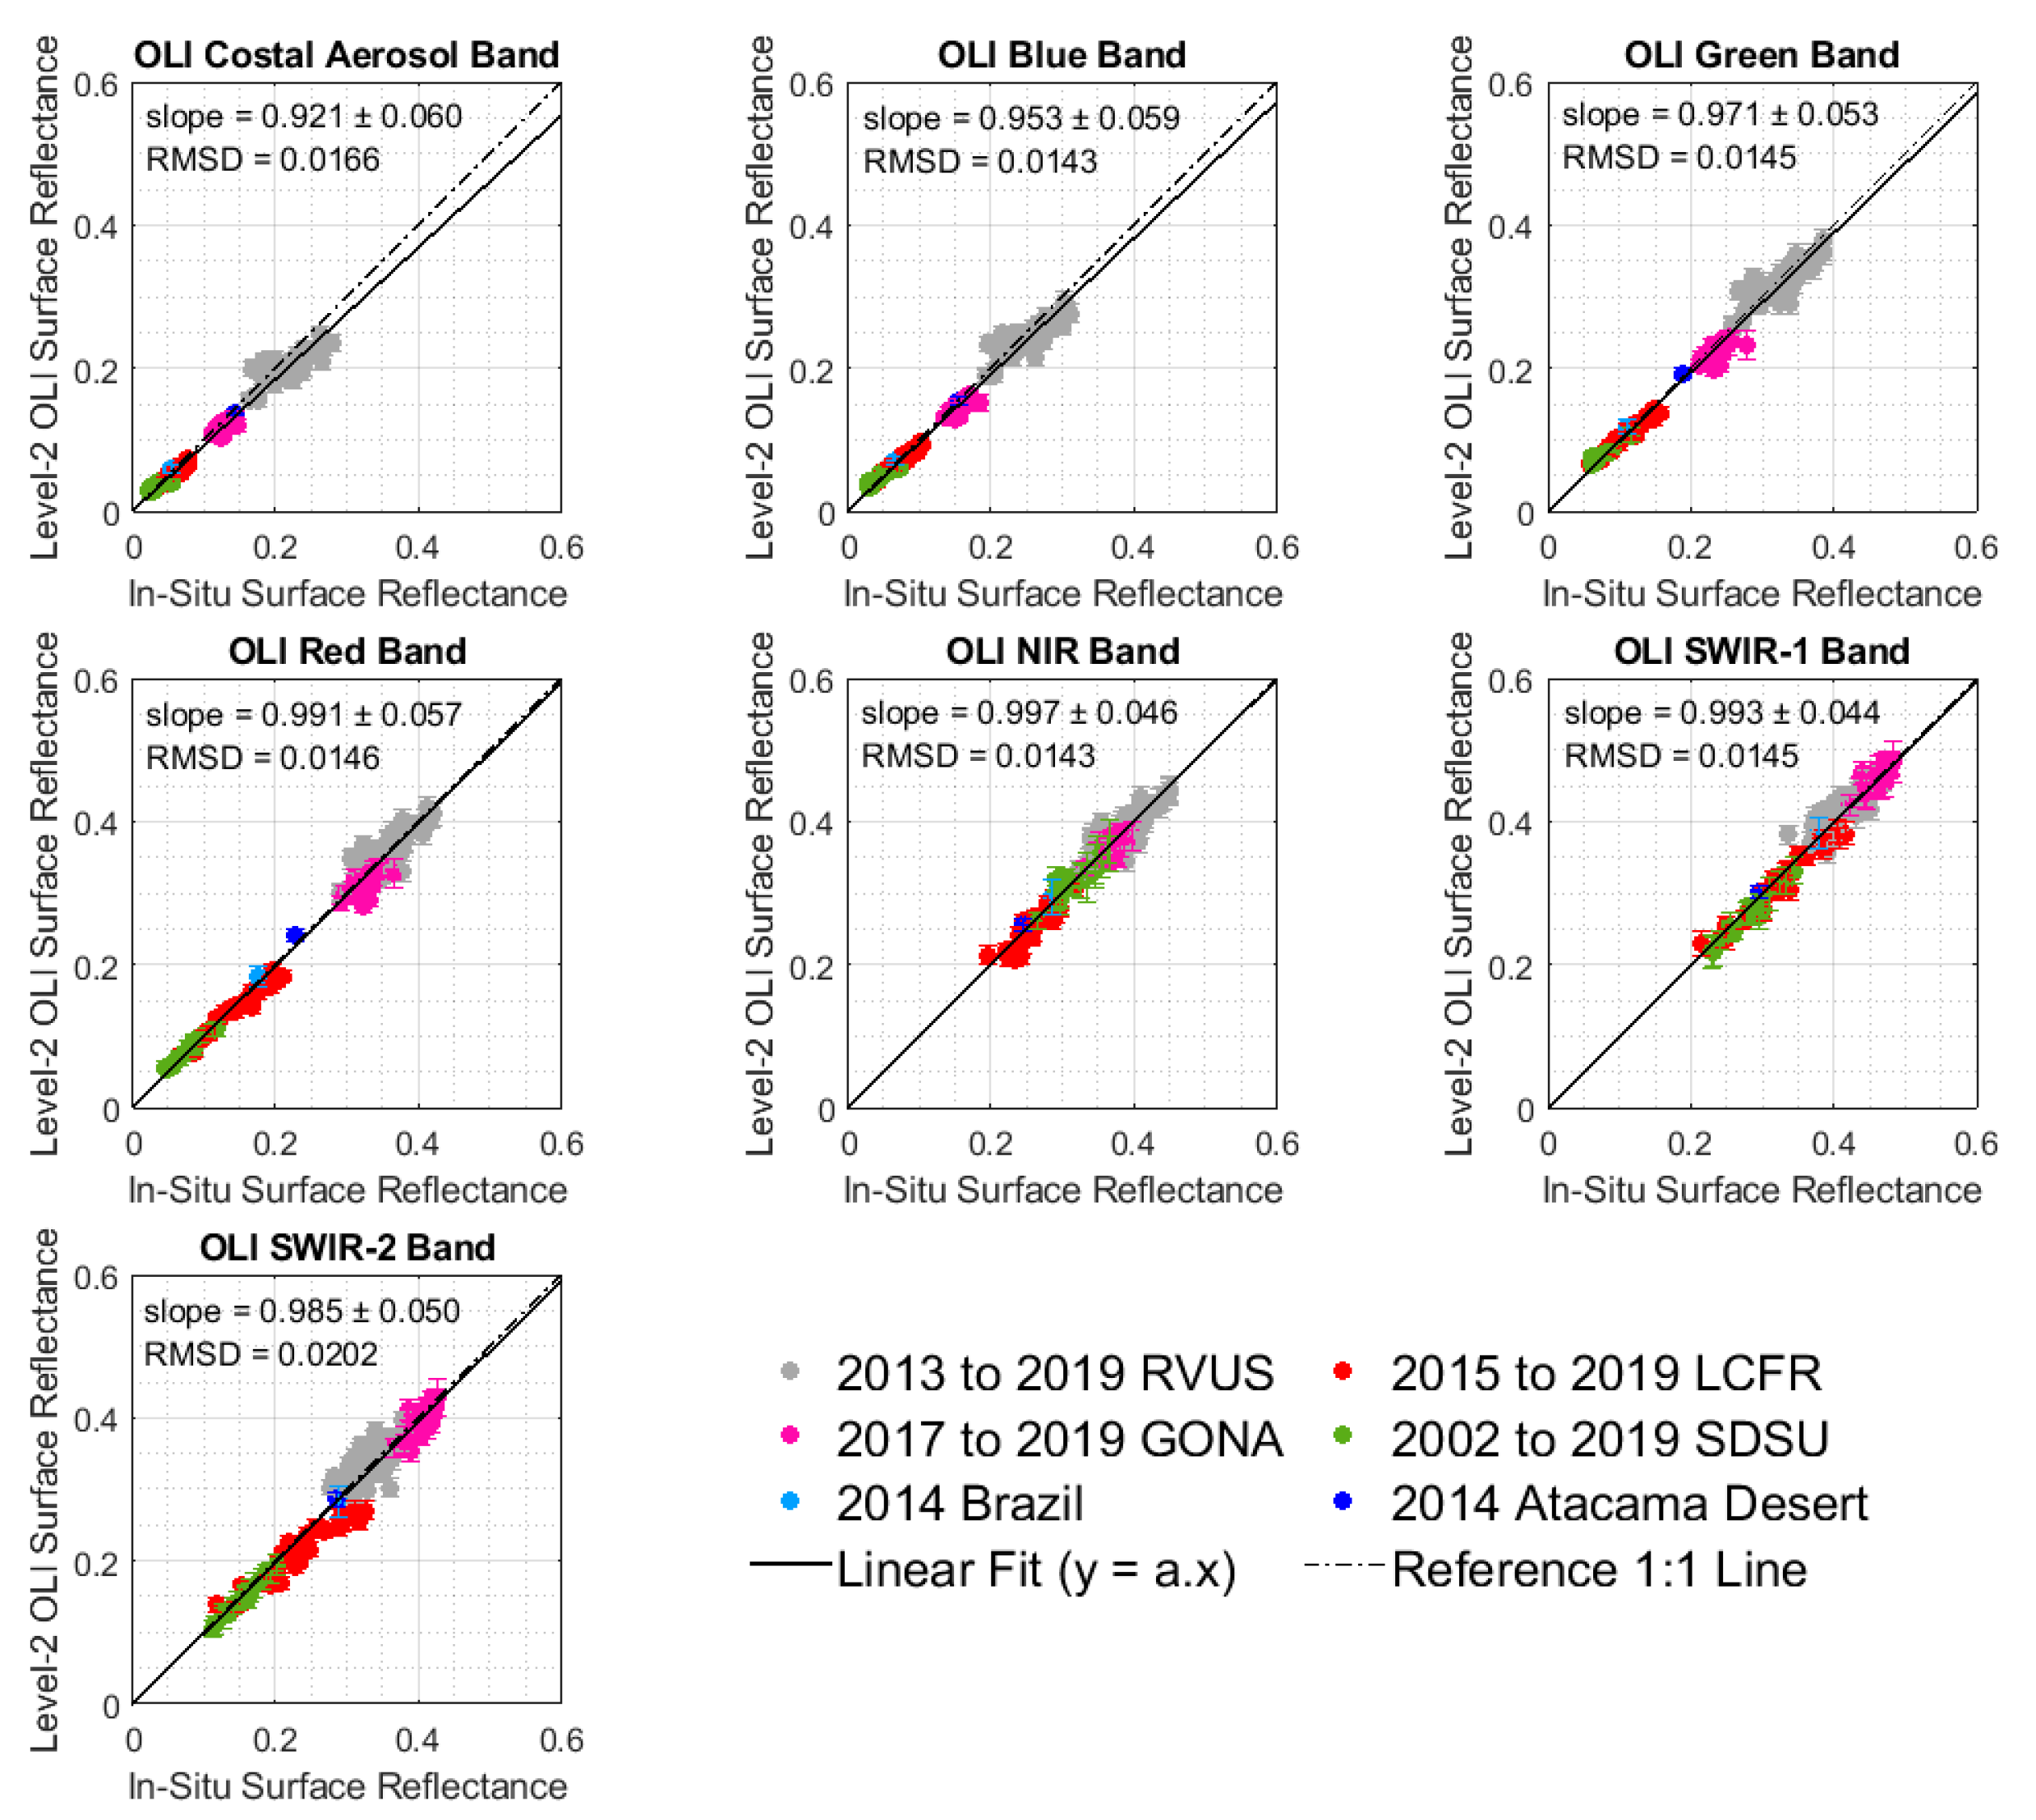
Figure 18.
Temporal trends, by band, of residuals (errors) in surface reflectance predicted from in situ measurement and Landsat-8 OLI Level-2 surface reflectance data.
Figure 18.
Temporal trends, by band, of residuals (errors) in surface reflectance predicted from in situ measurement and Landsat-8 OLI Level-2 surface reflectance data.
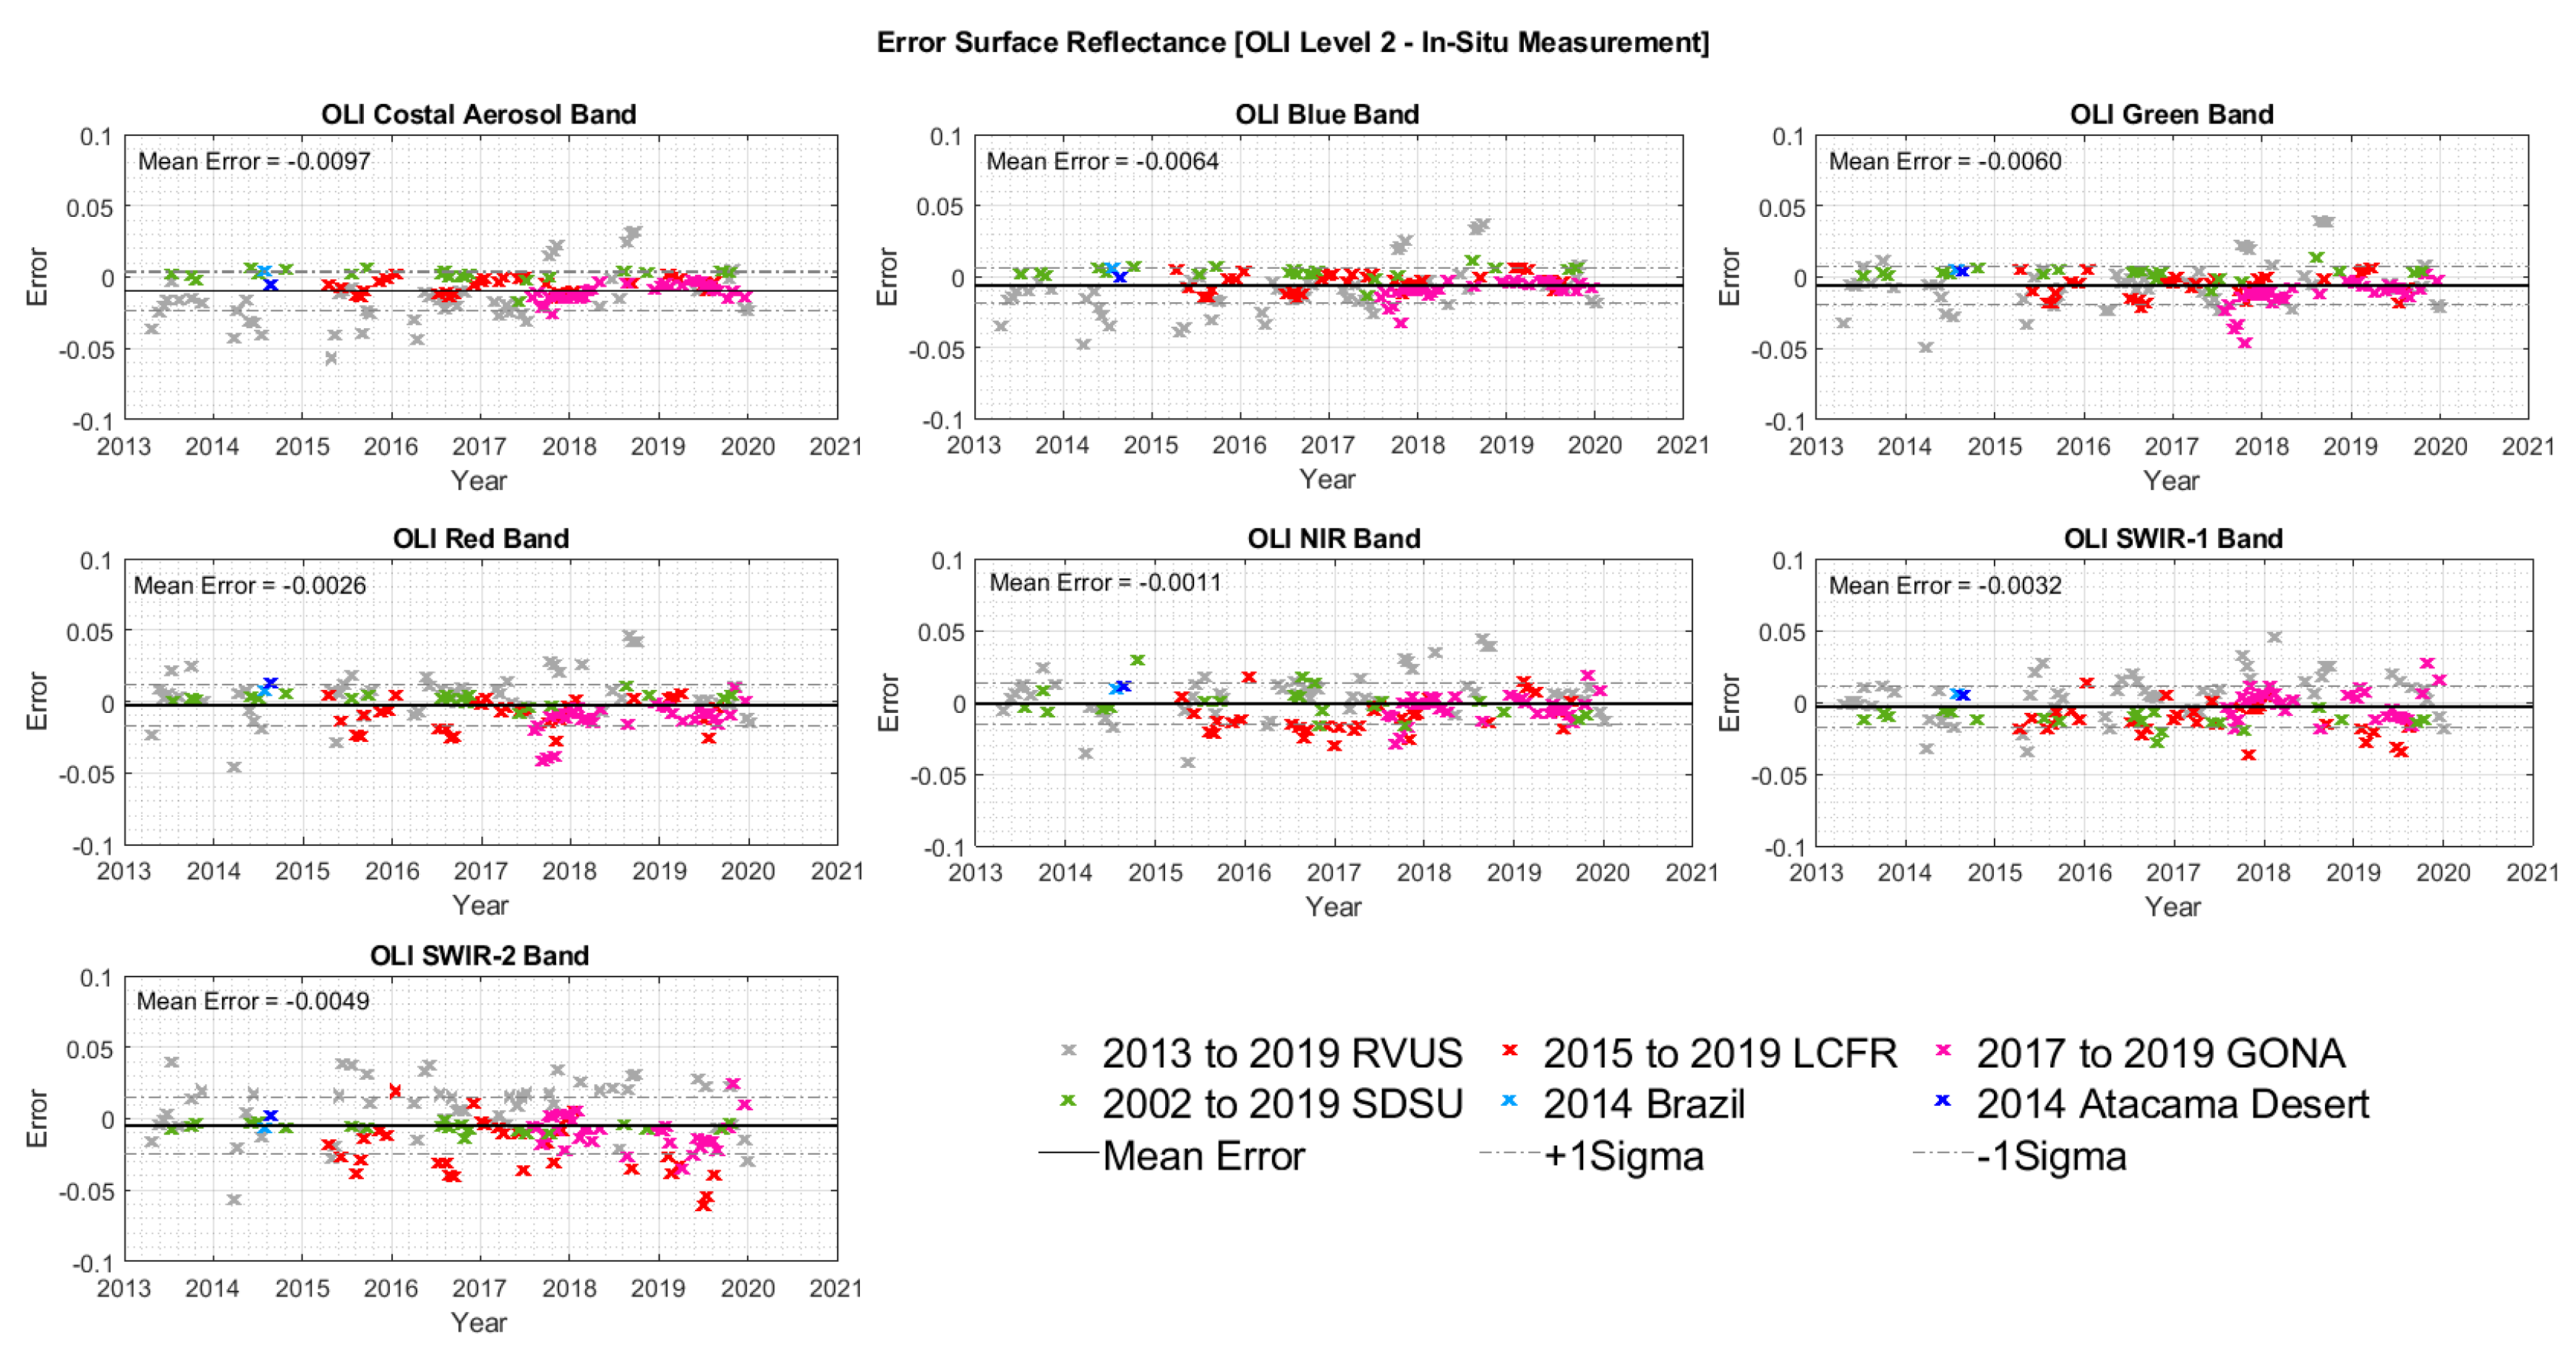

Table 1.
Ground campaigns data used in this study.
| Site Name | Country | Path/Row | Coordinate | Date | Land Cover | Satellites | Cases | In situ Technique |
|---|---|---|---|---|---|---|---|---|
| Tuz Gölü | Turkey | 176/33 | 38°47′20.83″ N 33°24′25.36″ E | 08/19/2010 | Saline Lake | Landsat 7 | 1 | On-site Personnel |
| Bahia | Brazil | 220/69 | 12°23′23.00″ S 46°5′25.00″ W | 07/25/2014 | Soil/Spare Vegetation | Landsat 8 | 1 | On-site Personnel |
| Atacama Desert | Chile | 233/76 | 23°8′11.00″ S 68°4′5.00″ W | 08/21/2014 | Sand Dunes | Landsat 8 | 1 | On-site Personnel |
| Algodones Dunes | USA | 39/37 | 32°54′40.00″ N 115°7′5.00″ W | 03/10/2015 | Sand Dunes | Landsat 7 | 1 | On-site Personnel |
| SDSU | USA | 29/29 | 44°17′29.41″ N 96°45′53.15″ W | 2002 to 2019 | Vegetation | Landsat 7 Landsat 8 | 54 30 | On-site Personnel |
| RVUS | USA | 40/33 | 38°29′49.20″ N 115°41′24.00″ W | 2013 to 2019 | Dry Lakebed | Landsat 7 Landsat 8 | 66 56 | RadCalNet |
| LCFR | France | 196/30 | 43°33′32.00″ N 4°51′51.00″ E | 2015 to 2019 | Pebbly Soil/Spare Vegetation | Landsat 7 Landsat 8 | 37 31 | RadCalNet |
| GONA | Namibia | 179/76 | 23°36′0.72′ S 15°70′10.56′ E | 2017 to 2019 | Gravel Plains | Landsat 7 Landsat 8 | 24 31 | RadCalNet |
Table 2.
Comparison between TOA reflectance predicted from in situ measurement and Landsat-7 ETM+ data Level-1 TOA reflectance data (Slope, Root Mean Square Deviation—RMSD, Mean Error—ME, Mean Percent Error—MPE; Mean Percent Absolute Error—MPAE).
Table 2.
Comparison between TOA reflectance predicted from in situ measurement and Landsat-7 ETM+ data Level-1 TOA reflectance data (Slope, Root Mean Square Deviation—RMSD, Mean Error—ME, Mean Percent Error—MPE; Mean Percent Absolute Error—MPAE).
| Spectral Band | Statistics | RVUS | LCFR | GONA | SDSU | AD | Tuz Gölü | All Sites Together |
|---|---|---|---|---|---|---|---|---|
| Blue Band | Slope | 0.953 | 0.948 | 0.978 | 1.037 | 0.960 | Satured | 0.960 |
| RMSD | 0.0191 | 0.0090 | 0.0092 | 0.0054 | 0.0058 | Satured | 0.0130 | |
| ME | −0.0121 | −0.0067 | −0.0040 | 0.0031 | −0.0058 | Satured | −0.0054 | |
| MPAE | 6.17% | 5.33% | 3.47% | 4.79% | 4.18% | Satured | 5.22% | |
| MPE | −4.54% | −5.05% | −2.15% | 3.73% | −4.18% | Satured | −1.87% | |
| Green Band | Slope | 0.983 | 0.939 | 0.995 | 1.024 | 0.982 | Satured | 0.983 |
| RMSD | 0.0173 | 0.0106 | 0.0080 | 0.0044 | 0.0031 | Satured | 0.0120 | |
| ME | −0.0042 | −0.0069 | −0.0011 | 0.0020 | −0.0031 | Satured | −0.0025 | |
| MPAE | 4.63% | 6.09% | 2.64% | 4.38% | 1.80% | Satured | 4.57% | |
| MPE | −1.29% | −5.20% | −0.55% | 2.53% | −1.80% | Satured | −0.86% | |
| Red Band | Slope | 1.015 | 0.927 | 1.007 | 1.018 | 1.022 | Satured | 1.007 |
| RMSD | 0.0182 | 0.0129 | 0.0117 | 0.0050 | 0.0050 | Satured | 0.0134 | |
| ME | 0.0064 | −0.0093 | 0.0021 | 0.0017 | 0.0050 | Satured | 0.0012 | |
| MPAE | 3.94% | 6.81% | 3.11% | 5.18% | 2.19% | Satured | 4.77% | |
| MPE | 1.89% | −6.19% | 0.55% | 2.27% | 2.19% | Satured | 0.18% | |
| NIR Band | Slope | 1.003 | 0.955 | 0.999 | 0.996 | 0.997 | 0.940 | 0.994 |
| RMSD | 0.0178 | 0.0173 | 0.0122 | 0.0095 | 0.0008 | 0.0273 | 0.0150 | |
| ME | 0.0021 | −0.0100 | −0.0003 | −0.0014 | −0.0008 | −0.0273 | −0.0019 | |
| MPAE | 3.71% | 6.37% | 2.72% | 3.97% | 0.30% | 6.41% | 4.19% | |
| MPE | 0.64% | −4.51% | −0.20% | −1.23% | −0.30% | −6.41% | −1.11% | |
| SWIR-1 Band | Slope | 1.025 | 0.977 | 1.041 | 0.995 | 0.986 | 0.976 | 1.016 |
| RMSD | 0.0200 | 0.0148 | 0.0242 | 0.0091 | 0.0046 | 0.0024 | 0.0170 | |
| ME | 0.0106 | −0.0055 | 0.0172 | −0.0016 | −0.0046 | −0.0024 | 0.0045 | |
| MPAE | 3.92% | 3.68% | 4.50% | 3.93% | 1.43% | 2.42% | 3.93% | |
| MPE | 2.70% | −1.55% | 3.81% | −1.38% | −1.43% | −2.42% | 0.74% | |
| SWIR-2 Band | Slope | 1.034 | 0.916 | 0.997 | 0.968 | 0.989 | 1.544 | 1.004 |
| RMSD | 0.0214 | 0.0211 | 0.0183 | 0.0074 | 0.0031 | 0.0184 | 0.0178 | |
| ME | 0.0110 | −0.0137 | −0.0011 | −0.0032 | −0.0031 | 0.0184 | 0.0002 | |
| MPAE | 5.48% | 8.89% | 4.13% | 6.24% | 1.09% | 35.23% | 6.36% | |
| MPE | 3.60% | −7.16% | −0.61% | −3.45% | −1.09% | 35.23% | −1.06% | |
| PAN Band | Slope | 1.025 | 0.956 | 1.012 | 0.912 | 1.013 | 0.984 | 1.005 |
| RMSD | 0.0192 | 0.0111 | 0.0105 | 0.0156 | 0.0030 | 0.0072 | 0.0157 | |
| ME | 0.0100 | −0.0076 | 0.0037 | −0.0128 | 0.0030 | −0.0072 | −0.0012 | |
| MPAE | 4.15% | 5.14% | 2.79% | 9.88% | 1.29% | 1.63% | 5.81% | |
| MPE | 2.85% | −4.13% | 1.11% | −9.88% | 1.29% | −1.63% | −2.54% |
Table 3.
Comparison between TOA reflectance predicted from in situ measurement and the Landsat-8 OLI data Level-1 TOA reflectance data (Slope, Root Mean Square Deviation—RMSD, Mean Error—ME, Mean Percent Error—MPE; Mean Percent Absolute Error—MPAE).
Table 3.
Comparison between TOA reflectance predicted from in situ measurement and the Landsat-8 OLI data Level-1 TOA reflectance data (Slope, Root Mean Square Deviation—RMSD, Mean Error—ME, Mean Percent Error—MPE; Mean Percent Absolute Error—MPAE).
| Spectral Band | Statistics | RVUS | LCFR | GONA | SDSU | Brazil | Chile | All Sites Together |
|---|---|---|---|---|---|---|---|---|
| CA Band | Slope | 0.958 | 0.985 | 0.997 | 1.052 | 1.055 | 1.001 | 0.973 |
| RMSD | 0.0166 | 0.0059 | 0.0075 | 0.0056 | 0.0051 | 0.0002 | 0.0113 | |
| ME | −0.0101 | −0.0022 | −0.0002 | 0.0047 | 0.0051 | 0.0002 | −0.0033 | |
| MPAE | 5.43% | 3.07% | 3.47% | 5.22% | 5.23% | 0.14% | 4.46% | |
| MPE | −3.92% | −1.50% | −0.09% | 4.94% | 5.23% | 0.14% | −0.73% | |
| Blue Band | Slope | 0.967 | 0.981 | 0.991 | 1.041 | 1.055 | 1.011 | 0.975 |
| RMSD | 0.0167 | 0.0073 | 0.0080 | 0.0040 | 0.0046 | 0.0014 | 0.0114 | |
| ME | −0.0082 | −0.0023 | −0.0014 | 0.0033 | 0.0046 | 0.0014 | −0.0031 | |
| MPAE | 5.08% | 4.23% | 3.51% | 4.22% | 5.23% | 1.04% | 4.38% | |
| MPE | −2.96% | −1.66% | −0.74% | 4.02% | 5.23% | 1.04% | −0.72% | |
| Green Band | Slope | 0.982 | 0.942 | 0.985 | 1.009 | 1.057 | 1.030 | 0.981 |
| RMSD | 0.0162 | 0.0106 | 0.0095 | 0.0022 | 0.0052 | 0.0039 | 0.0118 | |
| ME | −0.0046 | −0.0068 | −0.0034 | 0.0007 | 0.0052 | 0.0039 | −0.0036 | |
| MPAE | 4.28% | 6.17% | 3.17% | 2.03% | 5.41% | 2.87% | 3.97% | |
| MPE | −1.39% | −4.97% | −1.48% | 0.74% | 5.41% | 2.87% | −1.63% | |
| Red Band | Slope | 0.999 | 0.914 | 0.984 | 1.003 | 1.065 | 1.054 | 0.990 |
| RMSD | 0.0160 | 0.0159 | 0.0117 | 0.0020 | 0.0081 | 0.0083 | 0.0133 | |
| ME | 0.0008 | −0.0115 | −0.0047 | 0.0002 | 0.0081 | 0.0083 | −0.0029 | |
| MPAE | 3.49% | 7.87% | 3.24% | 2.48% | 6.11% | 5.08% | 4.16% | |
| MPE | 0.28% | −7.44% | −1.57% | 0.15% | 6.11% | 5.08% | −1.64% | |
| NIR Band | Slope | 1.004 | 0.958 | 1.002 | 1.009 | 1.049 | 1.048 | 0.999 |
| RMSD | 0.0171 | 0.0187 | 0.0148 | 0.0094 | 0.0099 | 0.0081 | 0.0156 | |
| ME | 0.0027 | −0.0100 | 0.0011 | 0.0016 | 0.0099 | 0.0081 | −0.0004 | |
| MPAE | 3.19% | 6.69% | 3.71% | 2.93% | 4.64% | 4.57% | 3.98% | |
| MPE | 0.76% | −4.04% | 0.24% | 0.23% | 4.64% | 4.57% | −0.39% | |
| SWIR-1 Band | Slope | 1.010 | 0.959 | 1.020 | 0.967 | 1.048 | 1.023 | 1.002 |
| RMSD | 0.0160 | 0.0169 | 0.0225 | 0.0092 | 0.0121 | 0.0045 | 0.0166 | |
| ME | 0.0048 | −0.0112 | 0.0091 | −0.0070 | 0.0121 | 0.0045 | 1.860 × 10⁻⁵ | |
| MPAE | 3.05% | 4.58% | 4.56% | 4.46% | 4.57% | 2.24% | 3.97% | |
| MPE | 1.28% | −3.40% | 1.94% | −4.04% | 4.57% | 2.24% | −0.61% | |
| SWIR-2 Band | Slope | 1.014 | 0.900 | 0.999 | 0.960 | 1.036 | 1.011 | 0.993 |
| RMSD | 0.0181 | 0.0256 | 0.0155 | 0.0057 | 0.0065 | 0.0021 | 0.0177 | |
| ME | 0.0052 | −0.0186 | -0.0004 | −0.0045 | 0.0065 | 0.0021 | −0.0028 | |
| MPAE | 4.79% | 10.74% | 3.42% | 5.11% | 3.47% | 1.10% | 5.76% | |
| MPE | 1.61% | −8.84% | −0.28% | −4.67% | 3.47% | 1.10% | −2.20 | |
| PAN Band | Slope | 0.981 | 0.948 | 0.975 | 0.998 | 1.052 | 1.034 | 0.978 |
| RMSD | 0.0162 | 0.0102 | 0.0114 | 0.0019 | 0.0053 | 0.0047 | 0.0121 | |
| ME | −0.0050 | −0.0064 | −0.0063 | −0.0002 | 0.0053 | 0.0047 | −0.0044 | |
| MPAE | 4.11% | 5.41% | 3.64% | 2.18% | 4.91% | 3.26% | 3.88% | |
| MPE | −1.50% | −4.26% | −2.51% | −0.40% | 4.91% | 3.26% | −1.97% |
Table 4.
Comparison between surface reflectance predicted from in situ measurement and the Landsat-7 ETM+ data Level-2 surface reflectance data product (Slope, Root Mean Square Deviation—RMSD, Mean Error—ME, Mean Percent Error—MPE, Mean Percent Absolute Error—MPAE).
Table 4.
Comparison between surface reflectance predicted from in situ measurement and the Landsat-7 ETM+ data Level-2 surface reflectance data product (Slope, Root Mean Square Deviation—RMSD, Mean Error—ME, Mean Percent Error—MPE, Mean Percent Absolute Error—MPAE).
| Spectral Band | Statistics | RVUS | LCFR | GONA | SDSU | AD | Tuz Gölü | All Sites Together |
|---|---|---|---|---|---|---|---|---|
| Blue Band | Slope | 0.964 | 1.058 | 0.965 | 1.155 | 0.959 | Satured | 0.972 |
| RMSD | 0.0173 | 0.0090 | 0.0063 | 0.0097 | 0.0066 | Satured | 0.0126 | |
| ME | −0.0080 | 0.0057 | −0.0052 | 0.0085 | −0.0066 | Satured | 8.18 × 10⁻⁷ | |
| MPAE | 5.51% | 11.36% | 3.63% | 17.73% | 4.31% | Satured | 9.98% | |
| MPE | −3.23% | 9.03% | −3.55% | 17.49% | −4.31% | Satured | 5.25% | |
| Green Band | Slope | 0.985 | 0.949 | 0.968 | 1.075 | 0.978 | Satured | 0.983 |
| RMSD | 0.0168 | 0.0106 | 0.0104 | 0.0079 | 0.0055 | Satured | 0.0126 | |
| ME | −0.0040 | −0.0042 | −0.0075 | 0.0066 | −0.0055 | Satured | −0.0015 | |
| MPAE | 3.60% | 8.48% | 3.50% | 9.00% | 2.27% | Satured | 6.15% | |
| MPE | −1.21% | −3.41% | −3.36% | 8.60% | −2.27% | Satured | 0.84% | |
| Red Band | Slope | 1.024 | 0.946 | 0.984 | 1.038 | 1.012 | Satured | 1.011 |
| RMSD | 0.0188 | 0.0109 | 0.0121 | 0.0069 | 0.0041 | Satured | 0.0137 | |
| ME | 0.0096 | −0.0062 | −0.0053 | 0.0046 | 0.0041 | Satured | 0.0028 | |
| MPAE | 3.73% | 6.04% | 2.43% | 7.44% | 1.23% | Satured | 5.09% | |
| MPE | 2.61% | −3.75% | −1.73% | 6.21% | 1.23% | Satured | 1.70% | |
| NIR Band | Slope | 0.995 | 0.951 | 0.975 | 0.992 | 0.985 | 0.940 | 0.985 |
| RMSD | 0.0161 | 0.0168 | 0.0150 | 0.0125 | 0.0057 | 0.0347 | 0.0153 | |
| ME | −0.0011 | −0.0121 | −0.0092 | −0.0019 | −0.0057 | −0.0347 | −0.0050 | |
| MPAE | 2.92% | 5.87% | 3.19% | 3.40% | 1.51% | 6.37% | 3.72% | |
| MPE | −0.28% | −5.12% | −2.63% | −0.67% | −1.51% | −6.37% | −1.77% | |
| SWIR-1 Band | Slope | 1.022 | 0.976 | 1.013 | 0.967 | 0.968 | 1.044 | 1.002 |
| RMSD | 0.0175 | 0.0153 | 0.0144 | 0.0150 | 0.0151 | 0.0053 | 0.0159 | |
| ME | 0.0096 | −0.0067 | 0.0059 | −0.0093 | −0.0151 | 0.0053 | 0.0001 | |
| MPAE | 3.24% | 3.53% | 2.43% | 4.27% | 3.25% | 4.20% | 3.49% | |
| MPE | 2.25% | −1.93% | 1.19% | −3.17% | −3.25% | 4.20% | −0.34% | |
| SWIR-2 Band | Slope | 1.053 | 0.928 | 1.000 | 0.986 | 0.974 | 1.074 | 1.014 |
| RMSD | 0.0274 | 0.0238 | 0.0181 | 0.0088 | 0.0119 | 0.0050 | 0.0213 | |
| ME | 0.0183 | −0.0136 | −0.0001 | −0.0011 | −0.0119 | 0.0050 | 0.0033 | |
| MPAE | 6.44% | 8.21% | 3.49% | 4.45% | 2.70% | 6.91% | 5.82% | |
| MPE | 5.15% | −6.10% | −0.25% | −0.27% | −2.70% | 6.91% | 0.48% |
Table 5.
Comparison between surface reflectance predicted from in situ measurement and the Landsat-8 OLI data Level-2 surface reflectance data (Root Mean Square Deviation—RMSD, Mean Error—ME, Mean Percent Error—MPE; Mean Percent Absolute Error—MPAE).
Table 5.
Comparison between surface reflectance predicted from in situ measurement and the Landsat-8 OLI data Level-2 surface reflectance data (Root Mean Square Deviation—RMSD, Mean Error—ME, Mean Percent Error—MPE; Mean Percent Absolute Error—MPAE).
| Spectral Band | Statistics | RVUS | LCFR | GONA | SDSU | Brazil | Chile | All Sites Together |
|---|---|---|---|---|---|---|---|---|
| CA Band | Slope | 0.922 | 0.887 | 0.917 | 1.016 | 1.080 | 0.961 | 0.921 |
| RMSD | 0.0239 | 0.0081 | 0.0121 | 0.0049 | 0.0044 | 0.0056 | 0.0166 | |
| ME | −0.0157 | −0.0062 | −0.0107 | 0.0014 | 0.0044 | −0.0056 | −0.0097 | |
| MPAE | 10.28% | 11.61% | 9.00% | 10.04% | 7.40% | 4.05% | 10.18% | |
| MPE | −7.67% | −10.84% | −9.00% | 4.64% | 7.40% | −4.05% | −6.75% | |
| Blue Band | Slope | 0.956 | 0.933 | 0.940 | 1.043 | 1.095 | 0.999 | 0.953 |
| RMSD | 0.0201 | 0.0075 | 0.0112 | 0.0054 | 0.0062 | 0.0001 | 0.0143 | |
| ME | −0.0099 | −0.0040 | −0.0093 | 0.0028 | 0.0062 | −0.0001 | −0.0064 | |
| MPAE | 6.75% | 8.00% | 6.32% | 9.65% | 8.69% | 0.07% | 7.32% | |
| MPE | −4.04% | −4.68% | −6.32% | 7.18% | 8.69% | −0.07% | −2.95% | |
| Green Band | Slope | 0.981 | 0.934 | 0.945 | 1.028 | 1.050 | 1.021 | 0.971 |
| RMSD | 0.0177 | 0.0102 | 0.0162 | 0.0050 | 0.0057 | 0.0040 | 0.0145 | |
| ME | −0.0052 | −0.0066 | −0.0129 | 0.0027 | 0.0057 | 0.0040 | −0.0060 | |
| MPAE | 4.22% | 7.23% | 5.78% | 5.24% | 4.81% | 2.09% | 5.38% | |
| MPE | −1.60% | −5.38% | −5.73% | 3.83% | 4.81% | 2.09% | −2.53% | |
| Red Band | Slope | 1.010 | 0.929 | 0.963 | 1.015 | 1.043 | 1.056 | 0.991 |
| RMSD | 0.0169 | 0.0136 | 0.0159 | 0.0043 | 0.0076 | 0.0127 | 0.0146 | |
| ME | 0.0044 | −0.0090 | −0.0119 | 0.0019 | 0.0076 | 0.0127 | −0.0026 | |
| MPAE | 3.46% | 7.08% | 4.00% | 4.66% | 4.14% | 5.26% | 4.58% | |
| MPE | 1.23% | −5.71% | −3.82% | 3.05% | 4.14% | 5.26% | −1.16% | |
| NIR Band | Slope | 1.011 | 0.962 | 0.988 | 0.997 | 1.033 | 1.047 | 0.997 |
| RMSD | 0.0169 | 0.0153 | 0.0099 | 0.0107 | 0.0093 | 0.0114 | 0.0143 | |
| ME | 0.0051 | −0.0099 | −0.0041 | −0.0005 | 0.0093 | 0.0114 | −0.0011 | |
| MPAE | 3.26% | 5.46% | 1.96% | 2.49% | 3.16% | 4.46% | 3.35% | |
| MPE | 1.31% | −4.02% | −1.15% | −0.16% | 3.16% | 4.46% | −0.62% | |
| SWIR-1 Band | Slope | 1.009 | 0.959 | 0.998 | 0.956 | 1.016 | 1.018 | 0.993 |
| RMSD | 0.0157 | 0.0168 | 0.0104 | 0.0136 | 0.0062 | 0.0052 | 0.0145 | |
| ME | 0.0042 | −0.0129 | −0.0010 | −0.0124 | 0.0062 | 0.0052 | −0.0032 | |
| MPAE | 3.01% | 4.46% | 1.87% | 4.59% | 1.61% | 1.74% | 3.29% | |
| MPE | 1.01% | −3.91% | −0.24% | −4.59% | 1.61% | 1.74% | −1.18% | |
| SWIR-2 Band | Slope | 1.020 | 0.902 | 0.976 | 0.960 | 0.979 | 1.008 | 0.985 |
| RMSD | 0.0212 | 0.0281 | 0.0151 | 0.0068 | 0.0061 | 0.0022 | 0.0202 | |
| ME | 0.0076 | −0.0212 | −0.0096 | −0.0061 | −0.0061 | 0.0022 | −0.0049 | |
| MPAE | 5.14% | 10.55% | 3.25% | 4.08% | 2.16% | 0.76% | 5.70% | |
| MPE | 2.11% | −9.09% | −2.53% | −4.08% | −2.16% | 0.76% | −2.38% |
© 2020 by the authors. Licensee MDPI, Basel, Switzerland. This article is an open access article distributed under the terms and conditions of the Creative Commons Attribution (CC BY) license (http://creativecommons.org/licenses/by/4.0/).
Share and Cite
MDPI and ACS Style
Teixeira Pinto, C.; Jing, X.; Leigh, L. Evaluation Analysis of Landsat Level-1 and Level-2 Data Products Using In Situ Measurements. Remote Sens. 2020, 12, 2597. https://doi.org/10.3390/rs12162597
AMA Style
Teixeira Pinto C, Jing X, Leigh L. Evaluation Analysis of Landsat Level-1 and Level-2 Data Products Using In Situ Measurements. Remote Sensing. 2020; 12(16):2597. https://doi.org/10.3390/rs12162597
Chicago/Turabian StyleTeixeira Pinto, Cibele, Xin Jing, and Larry Leigh. 2020. "Evaluation Analysis of Landsat Level-1 and Level-2 Data Products Using In Situ Measurements" Remote Sensing 12, no. 16: 2597. https://doi.org/10.3390/rs12162597
Note that from the first issue of 2016, this journal uses article numbers instead of page numbers. See further details here.