1. Introduction
The use of unmanned aircraft systems (UASs) for geophysical survey and environmental monitoring applications has been increasing in use over the past decade. UASs allow for increased versatility in remote sensing systems, especially when compared to traditional fixed-wing manned airborne surveys and satellite data [
1]. For this reason, many ground-based survey methods are being altered for integration with UASs. One of these methods is magnetic surveying, which is used widely for geophysical surveys investigating minerals, geologic features, unexploded ordinances (UXOs), or other magnetic subsurface features [
2,
3]. By integrating with UASs, the benefits from airborne surveys, such as ease of flight and increased spatial accessibility, are combined with very high-resolution data collection that can be produced at a lower altitude and slower flight speed.
Magnetic methods are used to measure magnetic anomalies produced by magnetic materials in the earth’s crust. Magnetic surveys all measure the same quantity, the variation of the earth’s magnetic field due to subsurface materials exhibiting their own magnetization [
4]. There are many different types of sensors that can measure the earth’s magnetic field, including fluxgate magnetometers, proton precession magnetometers, and optical absorption magnetometers [
5]. Especially, fluxgate magnetometers are commonly used for magnetic surveys due to their high precision, low noise level, small size, and low power consumption [
3,
4]. The core of a fluxgate magnetometer is composed of a detector inside of a toroid. When current is applied to the coils, the feedback control necessary to balance the field to zero is proportional to the external field strength. For a triaxial fluxgate magnetometer, a coil is aligned in the x, y, and z directions to measure the three components of a magnetic field intensity as a vector [
6]. One drawback to the fluxgate magnetometer is their orientation dependence. For this reason, the direction of the sensors must be known to use all three magnetic components effectively [
4].
Since UASs can fly close to ground level at slow speeds, they are ideal for high-resolution magnetic mapping [
7]. The resolution of magnetic maps can also be enhanced further using a magnetic gradiometer on a UAS [
2]. Magnetic gradiometers are composed of two magnetometers oriented in the same direction at a vertical or horizontal offset. The offset distance between the magnetometers allows for the directional derivative of a magnetic field to be measured [
8]. Magnetic gradiometer data improve the accuracy and resolution of total field magnetic data [
9], making them ideal for magnetic surveys aiming to produce high-resolution maps with a strong delineation of edge features and small magnetic signals [
10]. Integrating a magnetic gradiometer with a UAS produces a highly precise and versatile application for magnetic remote sensing.
Many airborne magnetic surveys conducted in the past were done with magnetometers onboard manned aircrafts, which produce aeromagnetic maps of large areas. Aeromagnetic surveys can collect magnetic data related to the earth’s subsurface features for very large areas due to the fast flight speed and large coverage that can be achieved with manned aircrafts [
10]. However, there are several drawbacks to manned aeromagnetic surveys. A major limitation to traditional aeromagnetic surveying is the limited resolution that can be achieved from an aircraft. Factors affecting the spatial resolution include sample frequency, flight line spacing, flight altitude, and overall cost. Since flight altitude is often limited by terrain restraints, pilot safety, and the safety of inhabitants of the survey area, it takes delicate work to optimize the sample frequency and flight line spacing in order to achieve the spatial resolution sought for the survey [
10]. Small UASs allow for a reduction in above-ground flight level, slow and stable flight velocities, and close line spacing [
11]. However, UASs have a much slower speed and shorter flight time, which limits the survey area that can be covered. Integrating magnetic sensors with small UASs can greatly improve the achievable resolution for small, focused survey areas.
Integrating sensors with UASs for geophysical exploration has been an increasingly popular topic over the years [
12]. With the increasing production of UASs in the world, the cost of adding a UAS to a geophysical exploration or environmental remediation project is steadily declining. Using UASs is, therefore, extremely cost effective, since UAS technology is growing more secure and affordable and sensors are more miniaturized and lightweight [
7]. There are also challenges faced when moving magnetic surveys to the UAS platform. One of these challenges is the limited payload offered by the small UAS. All components used for data collection and storage must be lightweight to ensure the UAS can safely perform the survey [
3]. Additionally, system components for a magnetic gradiometer must also limit any metallic components which can cause significant noise magnetic readings.
With the popularity of UASs, there have been many UAS magnetic surveys completed. There have been several surveys using UAS-based magnetometers to locate geologic features or UXOs [
1]. Although there are several commercially available options for UAS-based magnetic gradiometers, the main benefit to the magnetic gradiometer design in this paper are the low cost of production for our magnetic gradiometer along with the ability to adjust the system to the user’s specifications. The open-source microcontroller and software used for controlling the sensors and data logging on the magnetic gradiometer allows for the system to be adjusted to a range of data collecting variations and allows for integration with other compatible sensors or devices.
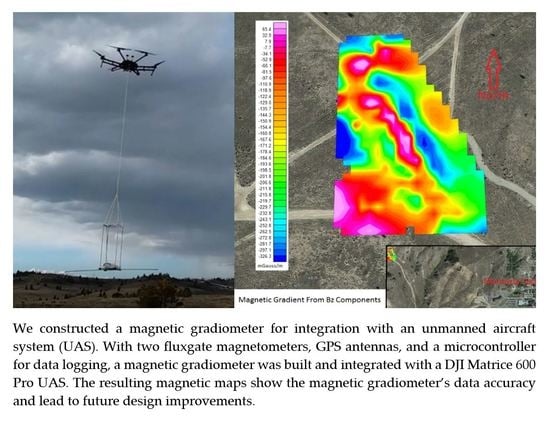
This paper shows the design process, initial survey results, and a data validation for a magnetic gradiometer integrated with a UAS. The magnetic gradiometer is composed of a microcontroller-based data logging unit, two fluxgate magnetometers, and two GPS antennas. With these components, a field test of the magnetic gradiometer was conducted using a UAS. The magnetic data produced from this field test produced magnetic gradient maps for the survey area. The data validation of the collected magnetic values was performed with a comparison with aeromagnetic survey data of the area. With the results of the initial design and tests flights, design improvements are suggested to improve the magnetic gradiometer for future magnetic surveying.
2. Materials and Methods
2.1. Instrument Design
The magnetic gradiometer is composed of two fluxgate magnetometers, two GPS antennas, and a microcontroller-based controlling and data logging unit. The two fluxgate magnetometers are Watson Industries FGM-301 units with X, Y, and Z magnetic outputs. The two magnetometers are aligned vertically with a separation distance of 1 m, which allows for the magnetic gradient to be calculated between two sensors. The two GCM-360 GPS units allow for both the location and the orientation of the instrument to be recorded with each magnetic reading. The two GPS antennas are horizontally aligned at the bottom of the instrument at a separation distance of 2 m. The microcontroller-based data logging unit was designed for collecting and storing the data from these magnetometers and GPS antennas.
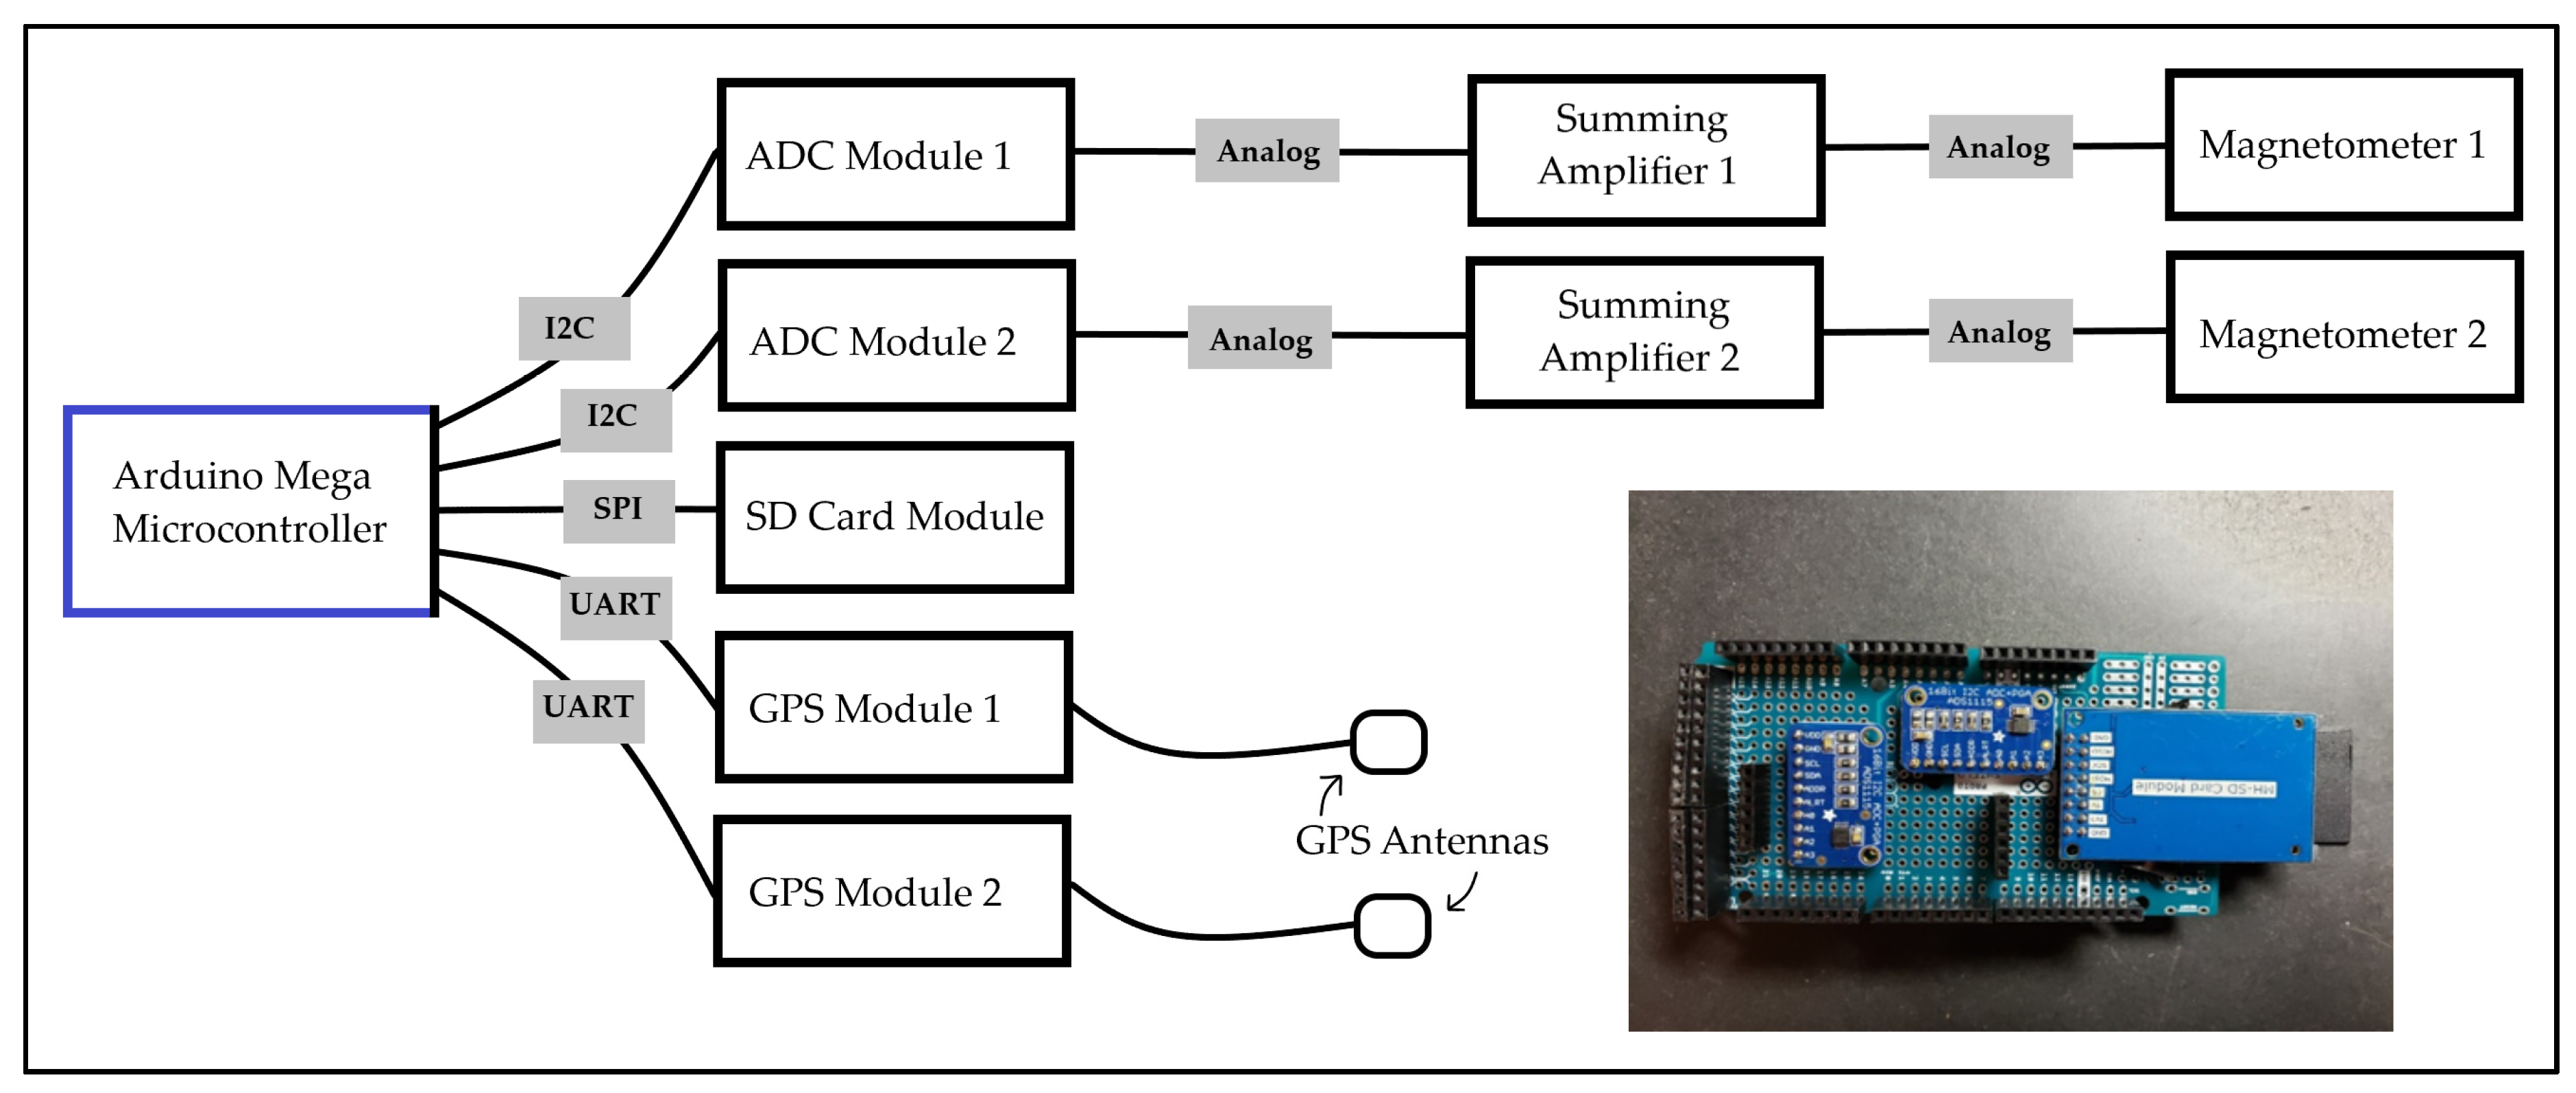
The data-collecting portion of the instrument is controlled by an Arduino Mega microcontroller. Arduino is an open-source electronics platform with very flexible and accessible software and components. The Arduino Mega was chosen for this project because of its many digital pins and high processing power. For the data collection process, the microcontroller initiates transmission from each sensor and stores the data in a microSD card. Along with the Arduino microcontroller, additional components for the data collecting unit include GPS modules, an SD card module, two bipolar to polar converters (summing amplifiers), and two analog-to-digital converter (ADC) modules.
Figure 1 summarizes the communication types and major components that make up the microcontroller-based collecting and data logging unit.
The GPS modules are the Adafruit Ultimate GPS Breakouts that communicate with UART (universal asynchronous receiver/transmitter) communication. The modules were set to output latitude, longitude, elevation, and coordinated universal time (UTC). Each GPS module is connected to a GCM-360 GPS antenna to further improve the accuracy of measurement.
The bipolar to polar converters were designed to read the magnetometer output values with the microcontroller. The magnetometers output a voltage range from −3.5 to +3.5 V, which corresponds to −700 and +700 mGauss, respectively. The microcontroller can only read between 0 and 5 V on its analog pins. The values must therefore be scaled from −3.5~+3.5 V range to a 0~5 V total range. A bipolar to polar converter converts these voltages into the microcontroller’s readable range. Each bipolar to polar converter is composed of three summing amplifiers with resistors and power supplies that shift these voltages from −3.5~+3.5 V to 0~5 V exactly [
13]. The bipolar to polar converters were put into printed circuit boards (PCBs), to allow for easy connection with the magnetometers and the microcontroller board.
Figure 2 shows the bipolar to polar converter design schematic and the final PCB with soldered components.
With the voltage shift from the bipolar to polar conversion, the resolution of the collected data is decreased, since a smaller voltage range is being recorded with the same number of bits. To improve the resolution an ADC was added. The ADC module converts analog voltages to digital values at a resolution of 15 bits. This is a great improvement over the Arduino Mega’s analog pins, which converts voltages to digital values at a maximum radiometric resolution of 10 bits (Equation (1)). This ADC module also adds some additional gain and shifts the upper value from 5 to 6.144 V, giving a greater range of values and therefore a better radiometric resolution. As seen in Equations (1) and (2), the ADC modules give a much better voltage to bit ratio than the microcontroller’s analog pins.
An SD card module was used to store the data from the magnetometers and GPS antennas. The microcontroller board transmits data from each magnetometer and GPS antenna to the SD card module for storage, and continuously repeats the process while power is maintained. Other necessary components for the data collection unit include several power supplies and an Arduino Proto shield with associated wires and solder. The DC power supplies required included: +8 V for the microcontroller board, +12 V for each fluxgate magnetometer, along with +15, −15 V, and +5 V for the summing amplifiers. The Arduino Proto shield is a prototyping shield that allows for all components to be permanently soldered together for a more secure connection.
2.2. Housing Design
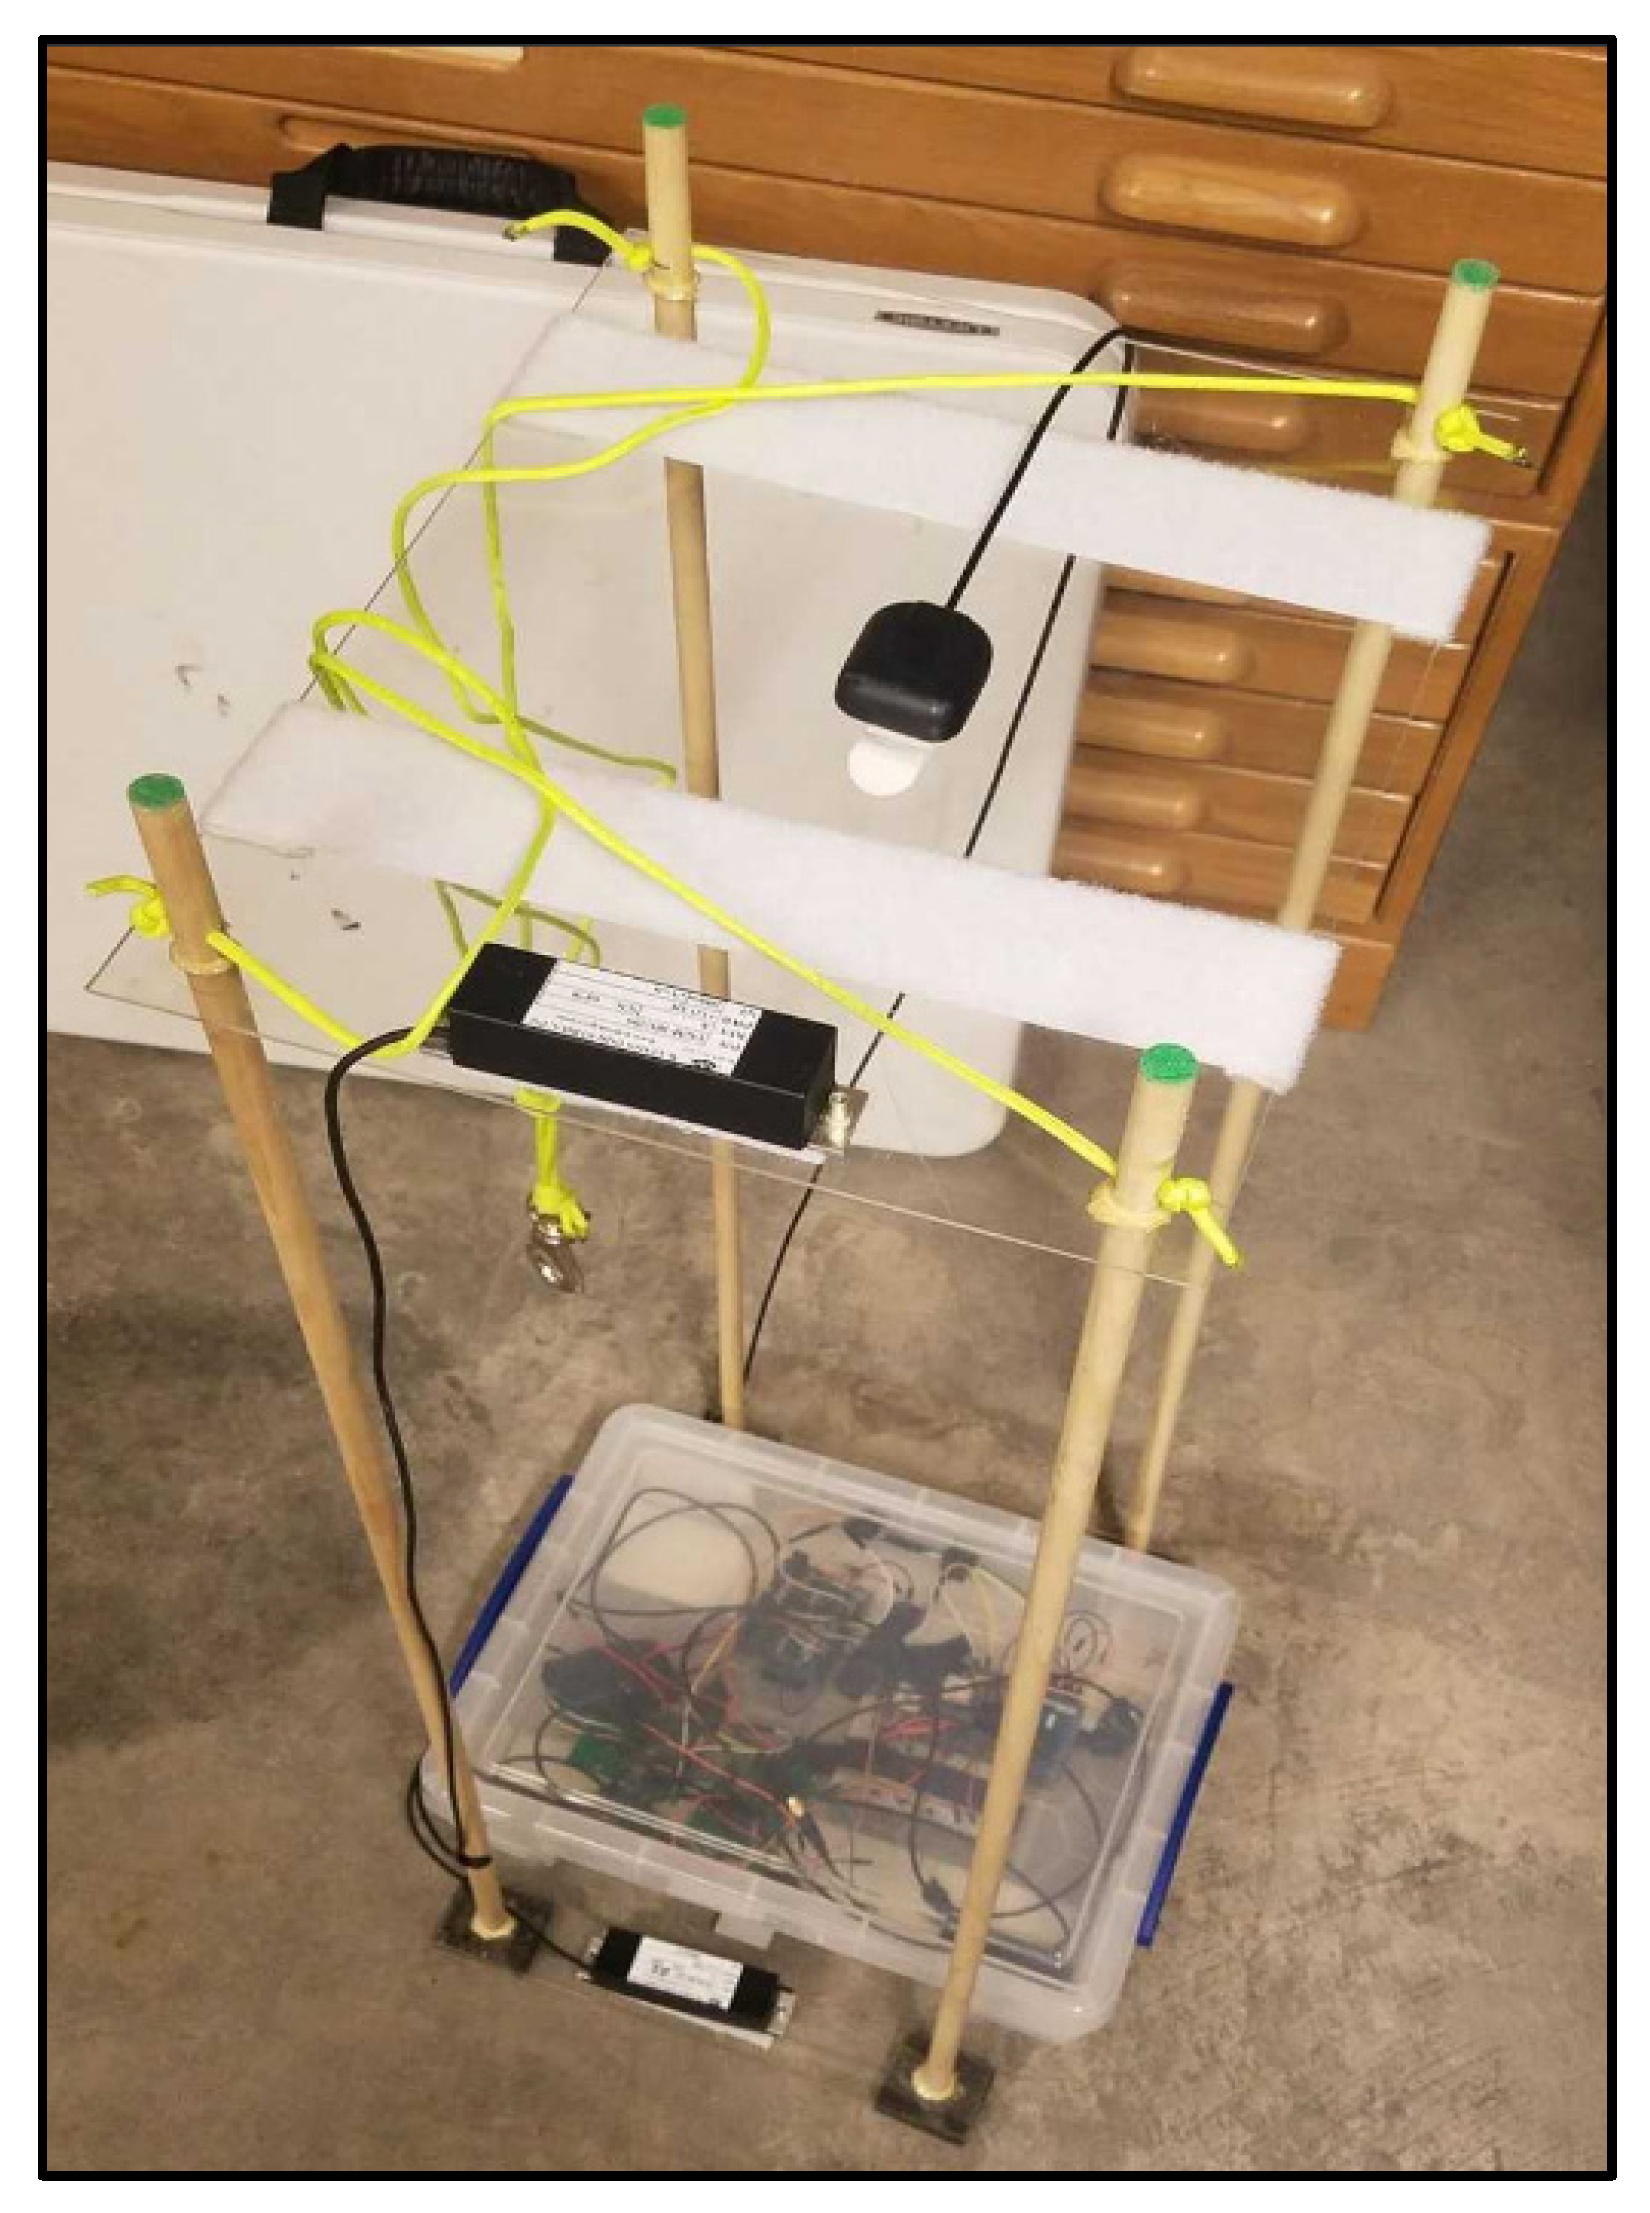
The housing design has had several versions. Through all iterations, it was important to use materials that were lightweight and small enough to be ideal for using in UAS applications. Additionally, the materials had to be non-metallic to reduce magnetic impact from magnetized metals. The initial housing design (
Figure 3) was composed of a frame made of wood and plastic, GPS antennas, and electronic components placed at the bottom of the frame, directly next to the bottom magnetometer.
The total weight for this design is 2 kg. This initial design allowed for a test of the system components to determine accuracy of this system. All figures shown in this report come from this initial design and reflect the successes and future improvements needed for this design.
2.3. Integration With a UAS
The UAS used in this project is the DJI Matrice 600 Pro hexacopter (
Figure 4). This UAS has a maximum payload of 5.5 kg, which can easily carry the 2-kg magnetic gradiometer components.
Figure 4 shows the Matrice 600 Pro with the magnetic gradiometer in tow.
To reduce the noise produced from the Matrice 600 Pro’s metallic components, the magnetic gradiometer is towed approximately two meters below the UAS. The tow distance reduces the effect of noise produced from the UAS [
14]. During airborne experimentation, a two-meter distance between the UAS and magnetic gradiometer provided sufficient distance for noise reduction without producing a significant swing of the magnetic gradiometer during flight. The sway of the magnetic gradiometer below the UAS can also be reduced by conducting flights under low wind conditions during the day time. In addition, the two-meter rope allows for the magnetic gradiometer to remain out of the way of the UAS during landing and takeoff. The horizontal level of the magnetic gradiometer is created with study rope before flight. The levelling is maintained during flight with slow UAS flight speeds.
2.4. Data Acquisition
The data logging unit initiates the data collection from the sensors. The data collection programs were created using the Arduino IDE (integrated development software), a software designed for programming Arduino microcontrollers. In the IDE, a sketch is used to instruct the microcontroller to perform sensor controlling and data transfer. A sketch was written to collect data from each sensor and immediately store the data onto an SD card. The rate for the data storage was conducted at a frequency of 1 Hz, which is a limit set by the transmission speed of the SD card module.
A survey site in the northeast of Butte of Montana, USA was chosen to test performance of the magnetic gradiometer. This site consists of a large, flat region within minimal magnetic feature nearby and provided an ideal area to test the instrument. The DJI Matrice 600 UAS was flown for approximately 15 min with manual controls of the UAS.
2.5. Validation
The first survey performed with the magnetic gradiometer and UAS aimed to successfully collect magnetic and GPS data during flights. With the successful data collection, the data validation was performed using two methods. The first method was examining the magnetic values for each magnetometer in the magnetic gradiometer. Since the magnetometers are placed one meter apart, the magnetic values should be very similar for each sensor. Large variation between sensor values indicates a source of noise or error occurring during data collection. The second method of data validation was a comparison with another magnetic survey in the area. Aeromagnetic data from the United States Geological Survey (USGS) [
15] was used to compare the magnetic gradiometer’s survey values with expected magnetic values in the survey area. With these methods for data validation of the magnetic gradiometer, the feasibility of the instrument can be determined. These validation methods also provide avenues for design improvements to reduce noise or fix survey problems.
4. Discussion
The aim of this study was to develop a magnetic gradiometer that can collect data from a UAS. The magnetic gradiometer had to be designed with components light and mobile enough to be used onboard a UAS. After creating an initial design for the magnetic gradiometer, a field test was performed to determine the accuracy of the system. From the results of this field test, data validation was determined by analyzing magnetic values from each sensor and from USGS aeromagnetic data of the survey area. With the results, design improvements were made to the magnetic gradiometer to create a better instrument for magnetic remote sensing.
The optimal UAS-based instrument design was met by using lightweight, non-metallic components for the magnetic gradiometer. The Arduino Mega microcontroller allows for the use of very small and lightweight electronic components and which provided an ideal data logging system for the magnetic gradiometer. The housing frame composed of wood and plastic material not only reduced the payload for the instrument, but also reduced the magnetic interference produced by otherwise metallic components. The initial housing design for the magnetic gradiometer successfully allowed for a field test of the instrument.
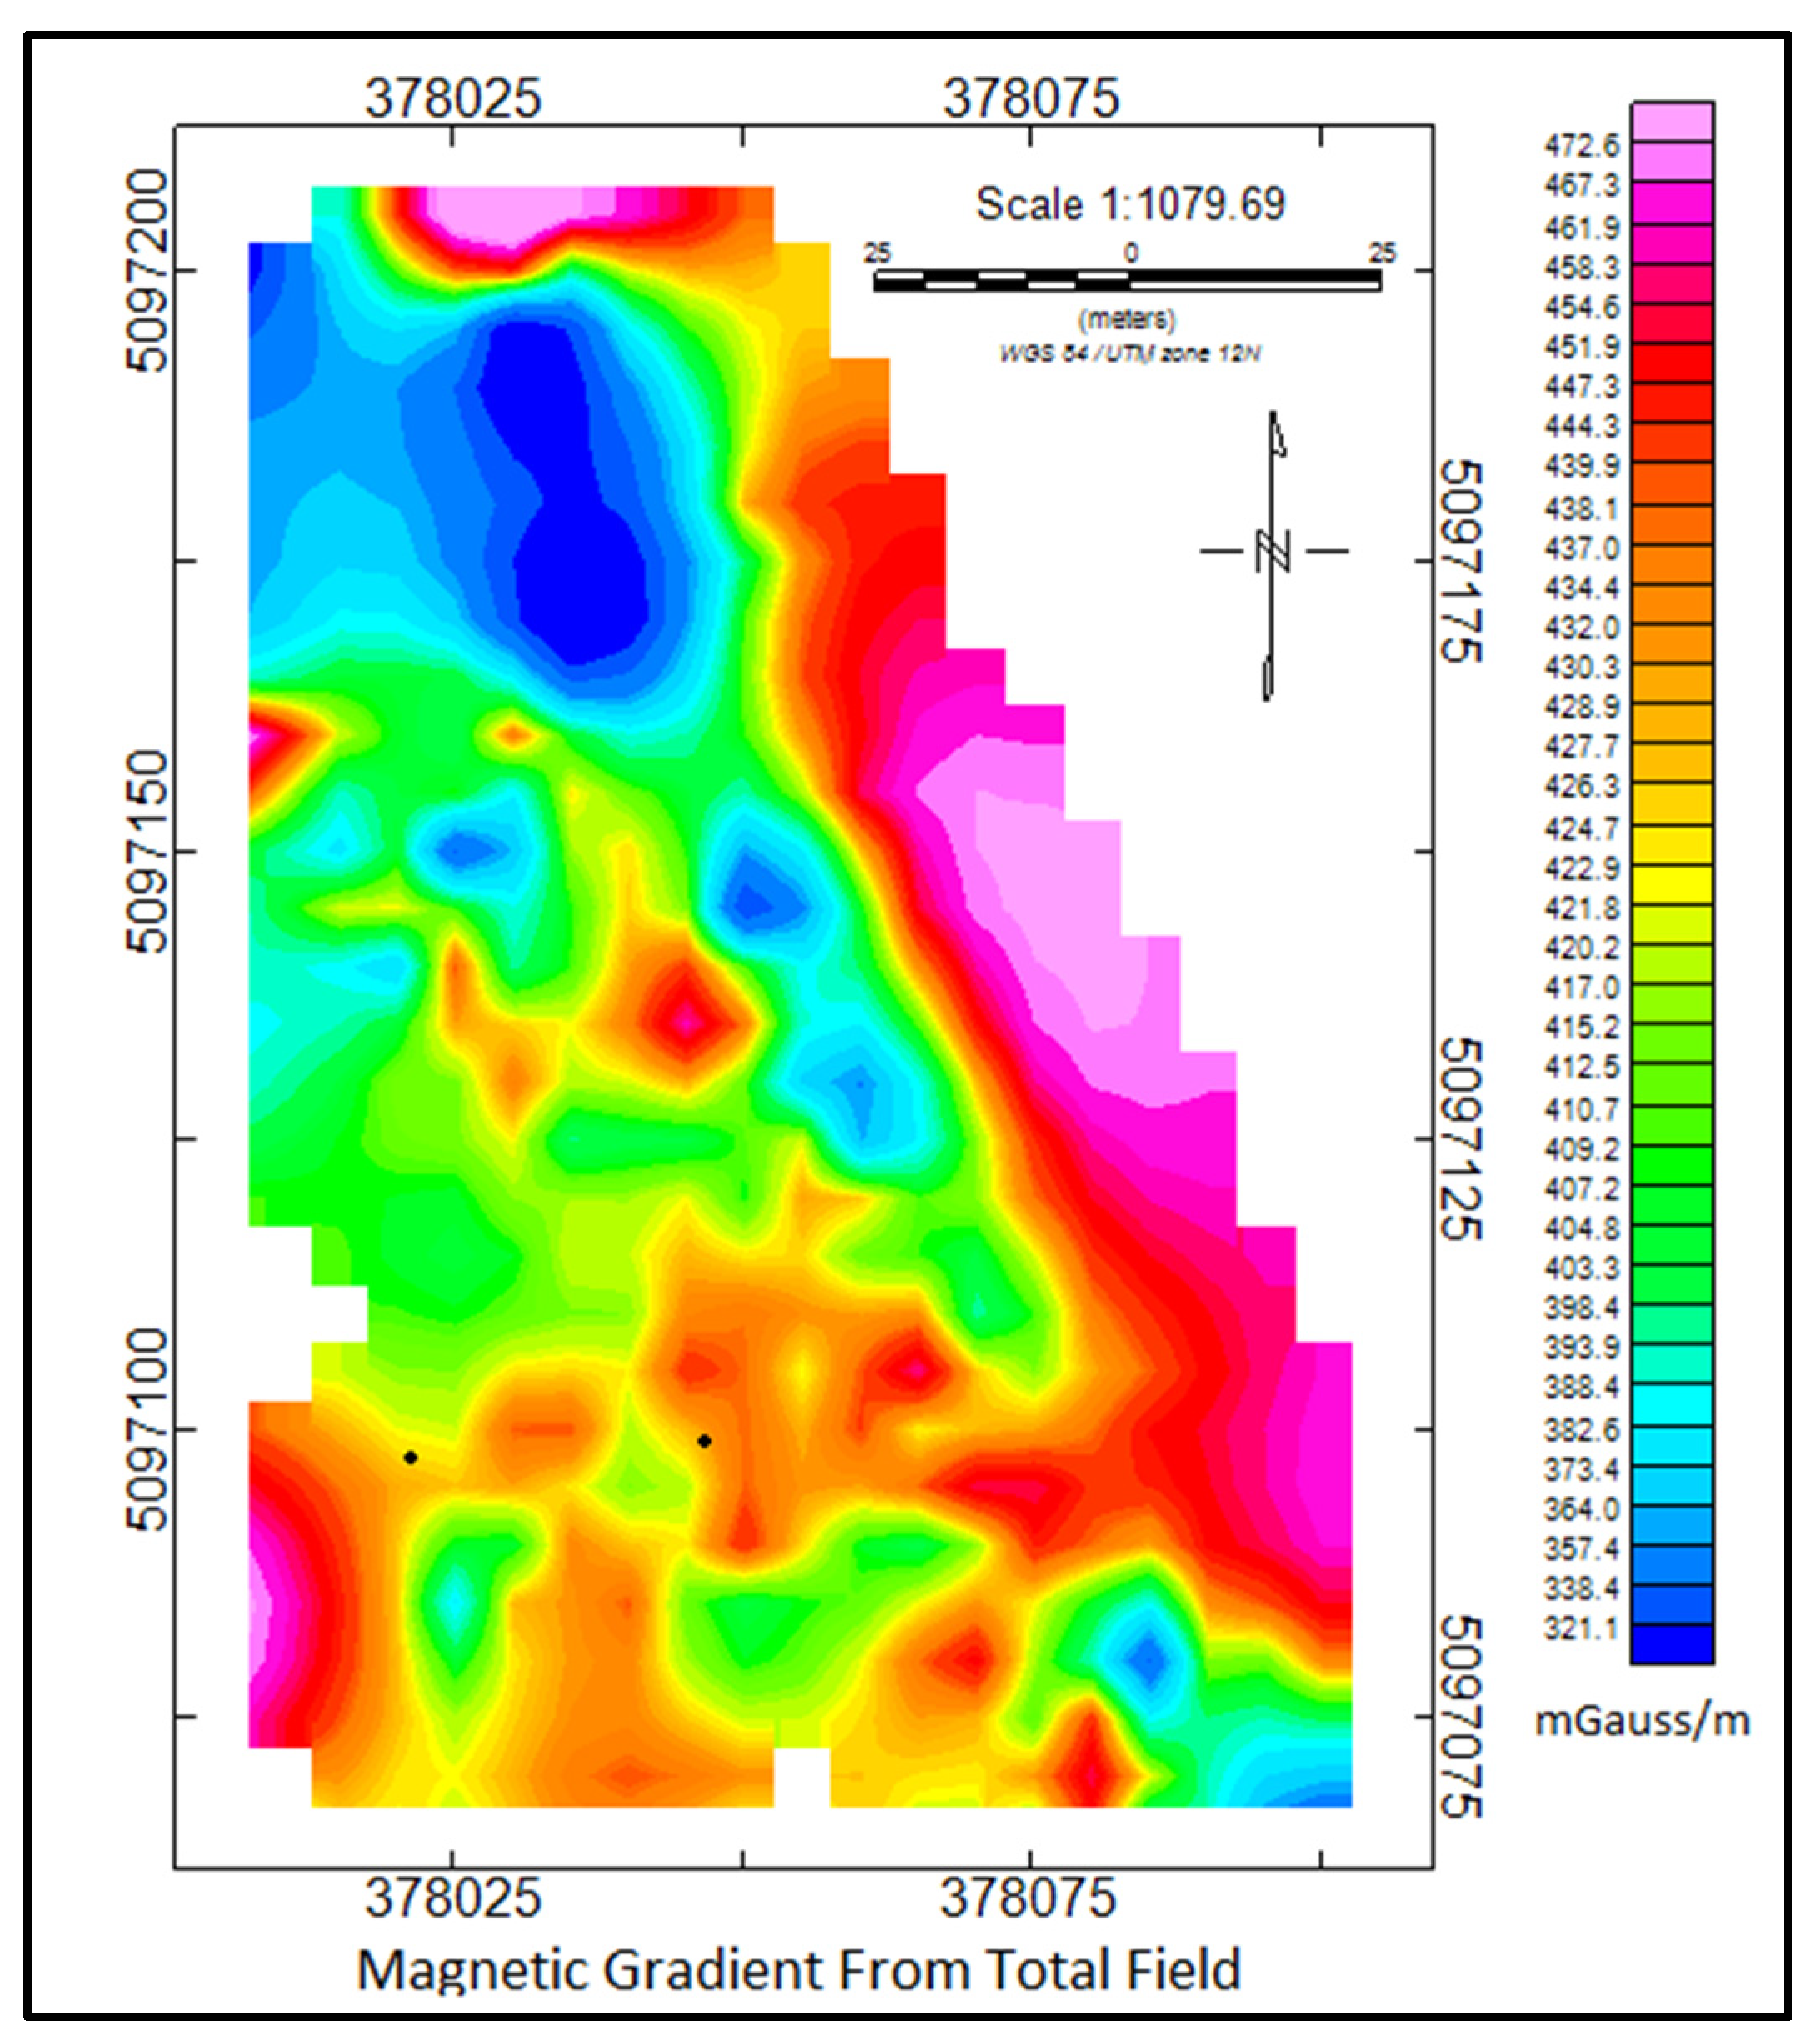
The two methods of data validation demonstrated the feasibility of integrating a magnetic gradiometer with a UAS after improving instrumentation errors. From the first method for data validation, we can see a correlation between the high and low areas for the top magnetometer and bottom magnetometer. However, the bottom magnetometer has magnetic values that are much lower than the top magnetometer. This variation in the bottom magnetometer’s data is likely from noise created by an error in instrument design. The proximity of the electronic components of the data collecting unit to the bottom magnetometer caused a shift in magnetic values from the flow of current and presence of metallic elements. Fixing this source of noise will allow for the magnetic gradient to more accurately reflect the rate of change for the magnetic field. The second method for data validation compared the average magnetic values for magnetometers to a pre-existing aeromagnetic survey. The average values for the top magnetometer are close to the USGS aeromagnetic data. This correlation to pre-existing magnetic values demonstrated the magnetic gradiometer data can be collected while in flight with a UAS. With design improvements, a more thorough analysis of the magnetic data can be performed.
The data validation of the magnetic data demonstrated future instrument designs were necessary to improve the magnetic gradiometer and allow for more easy data collection. The first issue encountered for the instrument was the significant source of noise on the bottom magnetometer, as mentioned above. To fix this issue, the electronic components will be placed exactly between the two magnetometers. Since each magnetometer will experience the same amount of interference from the electronic components, this source of noise should be canceled during the gradient calculation [
14]. The design will also be placed in a more secure plastic case, which will allow for more mobility of the system during landing and takeoff.
These results demonstrate the feasibility of the magnetic gradiometer for UAS application. However, there is a limitation that is the sample rate of the data, which is at a maximum of 1 Hz frequency. This will require flight lines, spacing, and flight speed to be pre-set if specific resolution requirements are to be made. Setting the speed of the UAS and flight lines before conducting the survey can produce magnetic maps of with a resolution set to exact specifications [
11]. With these improvements in instrument design, more thorough testing of the magnetic gradiometer can be conducted for high-resolution magnetic mapping.
5. Conclusions
A magnetic gradiometer designed for a UAS was designed and tested. With the fluxgate magnetometers, GPS antennas, and Arduino-based data logging system, the magnetic gradiometer was developed and proven to be feasible for magnetic data collection from a UAS. The resulting magnetic maps from the UAS surveys shows the coherency of magnetometer data and data alignment between magnetometer sensors. Design improvements will allow for the magnetic gradiometer to be tested on known magnetic targets to further quantify the feasibility of the instrument design. This study demonstrates the feasibility of collecting the total magnetic field, magnetic vector components, and gradients data from a UAS. The Arduino Mega data logging system, small magnetometers, and lightweight housing design are ideal for UAS surveying, and the results found in this study demonstrate the possibilities of application. It also demonstrated UAS magnetic surveys can be a great future resource for magnetic exploration, and system components can be created using accessible, affordable, open-source components such as Arduino. Future improvements to the instrument will allow for magnetic exploration for geologic features, UXOs, or other magnetic subsurface features.


