Individual Tree Crown Delineation from UAS Imagery Based on Region Growing and Growth Space Considerations


Abstract
1. Introduction
2. Methods
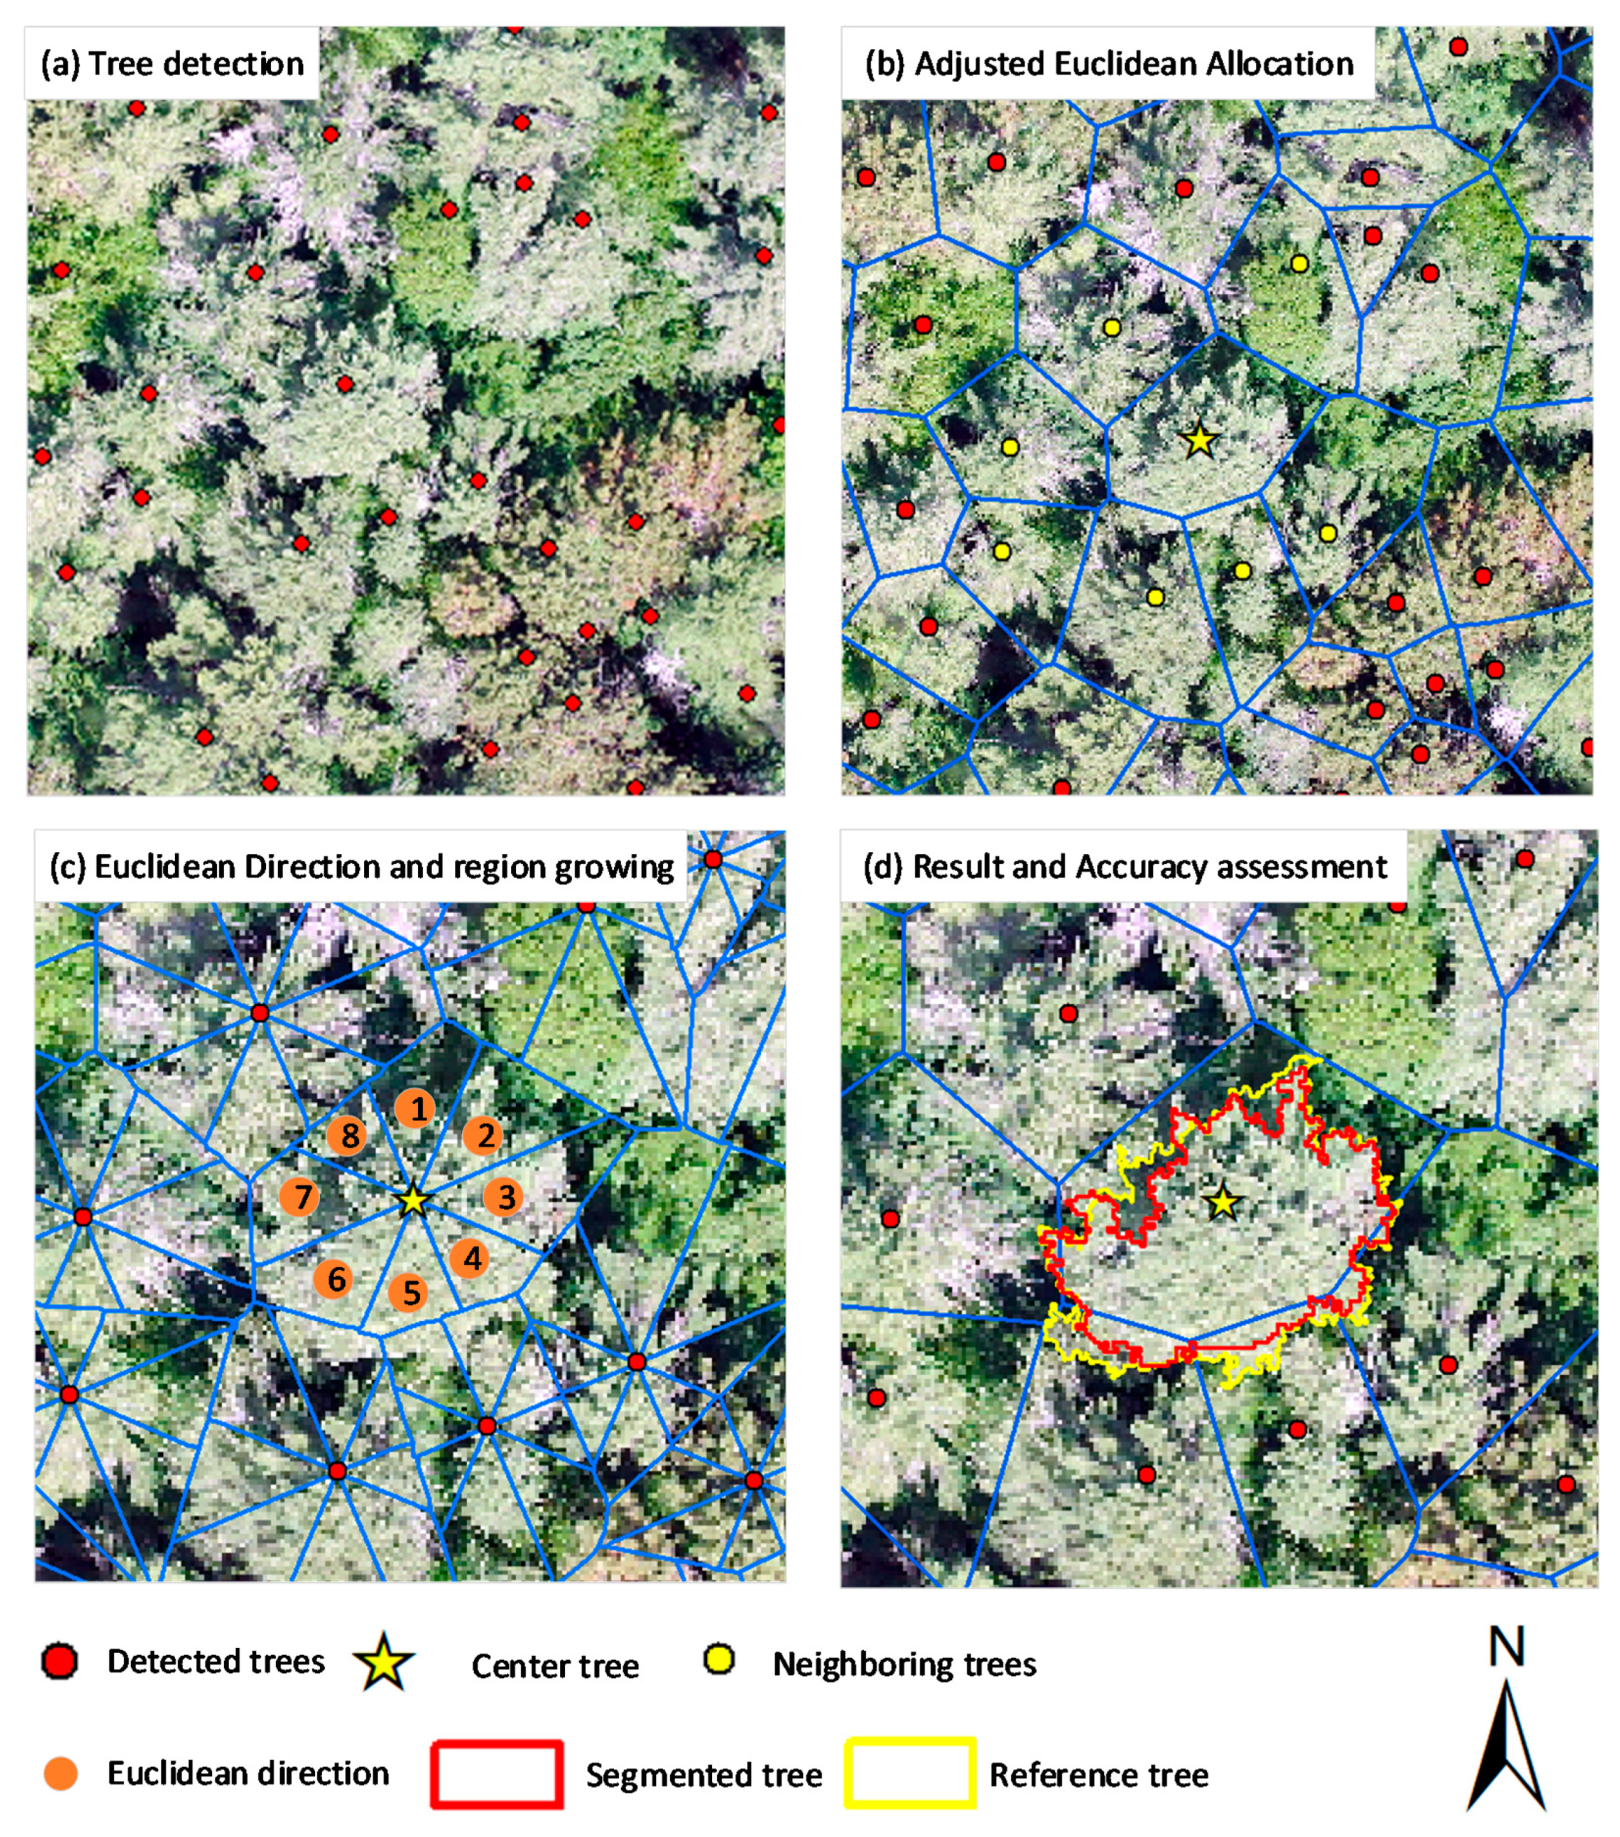
2.1. Workflow
2.2. Individual Treetop Detection
2.3. Adjusted Euclidean Allocation
2.4. Euclidean Direction and Region Growing
2.5. Hole Filling
2.6. Accuracy Assessment
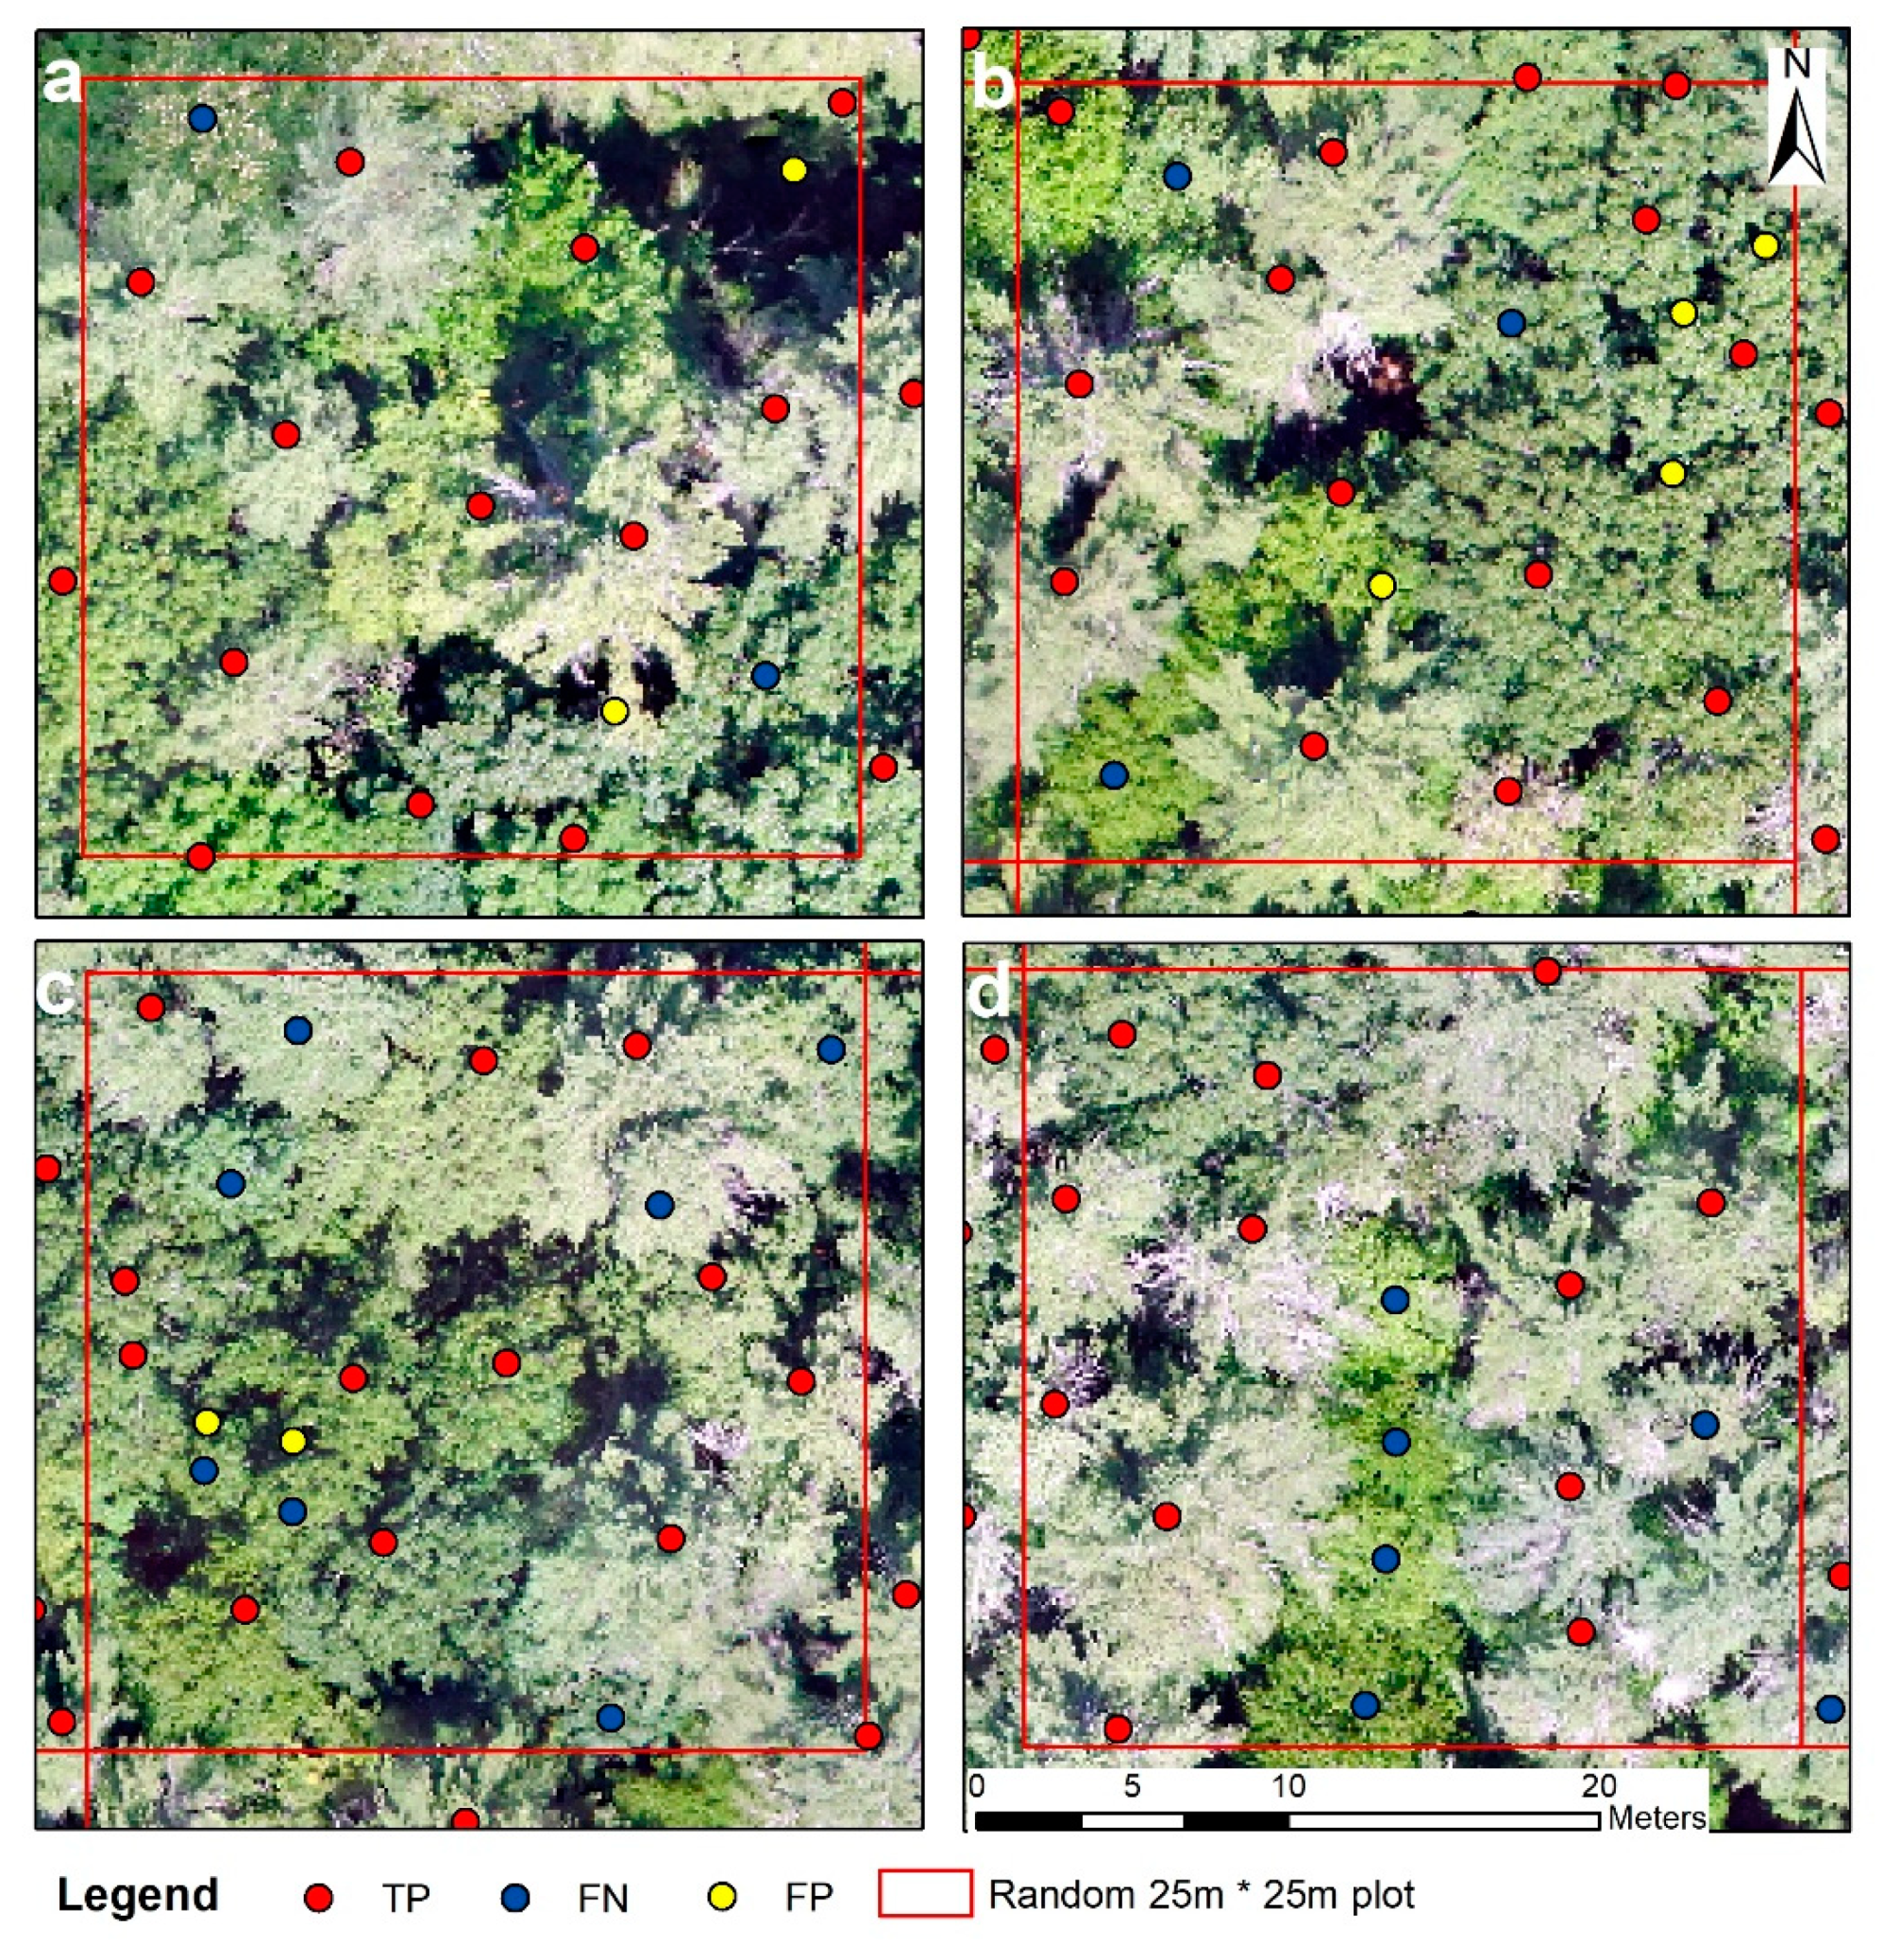
2.6.1. Individual Tree Detection Accuracy Assessment
2.6.2. Segmentation Accuracy Assessment
3. Experiments and Analysis
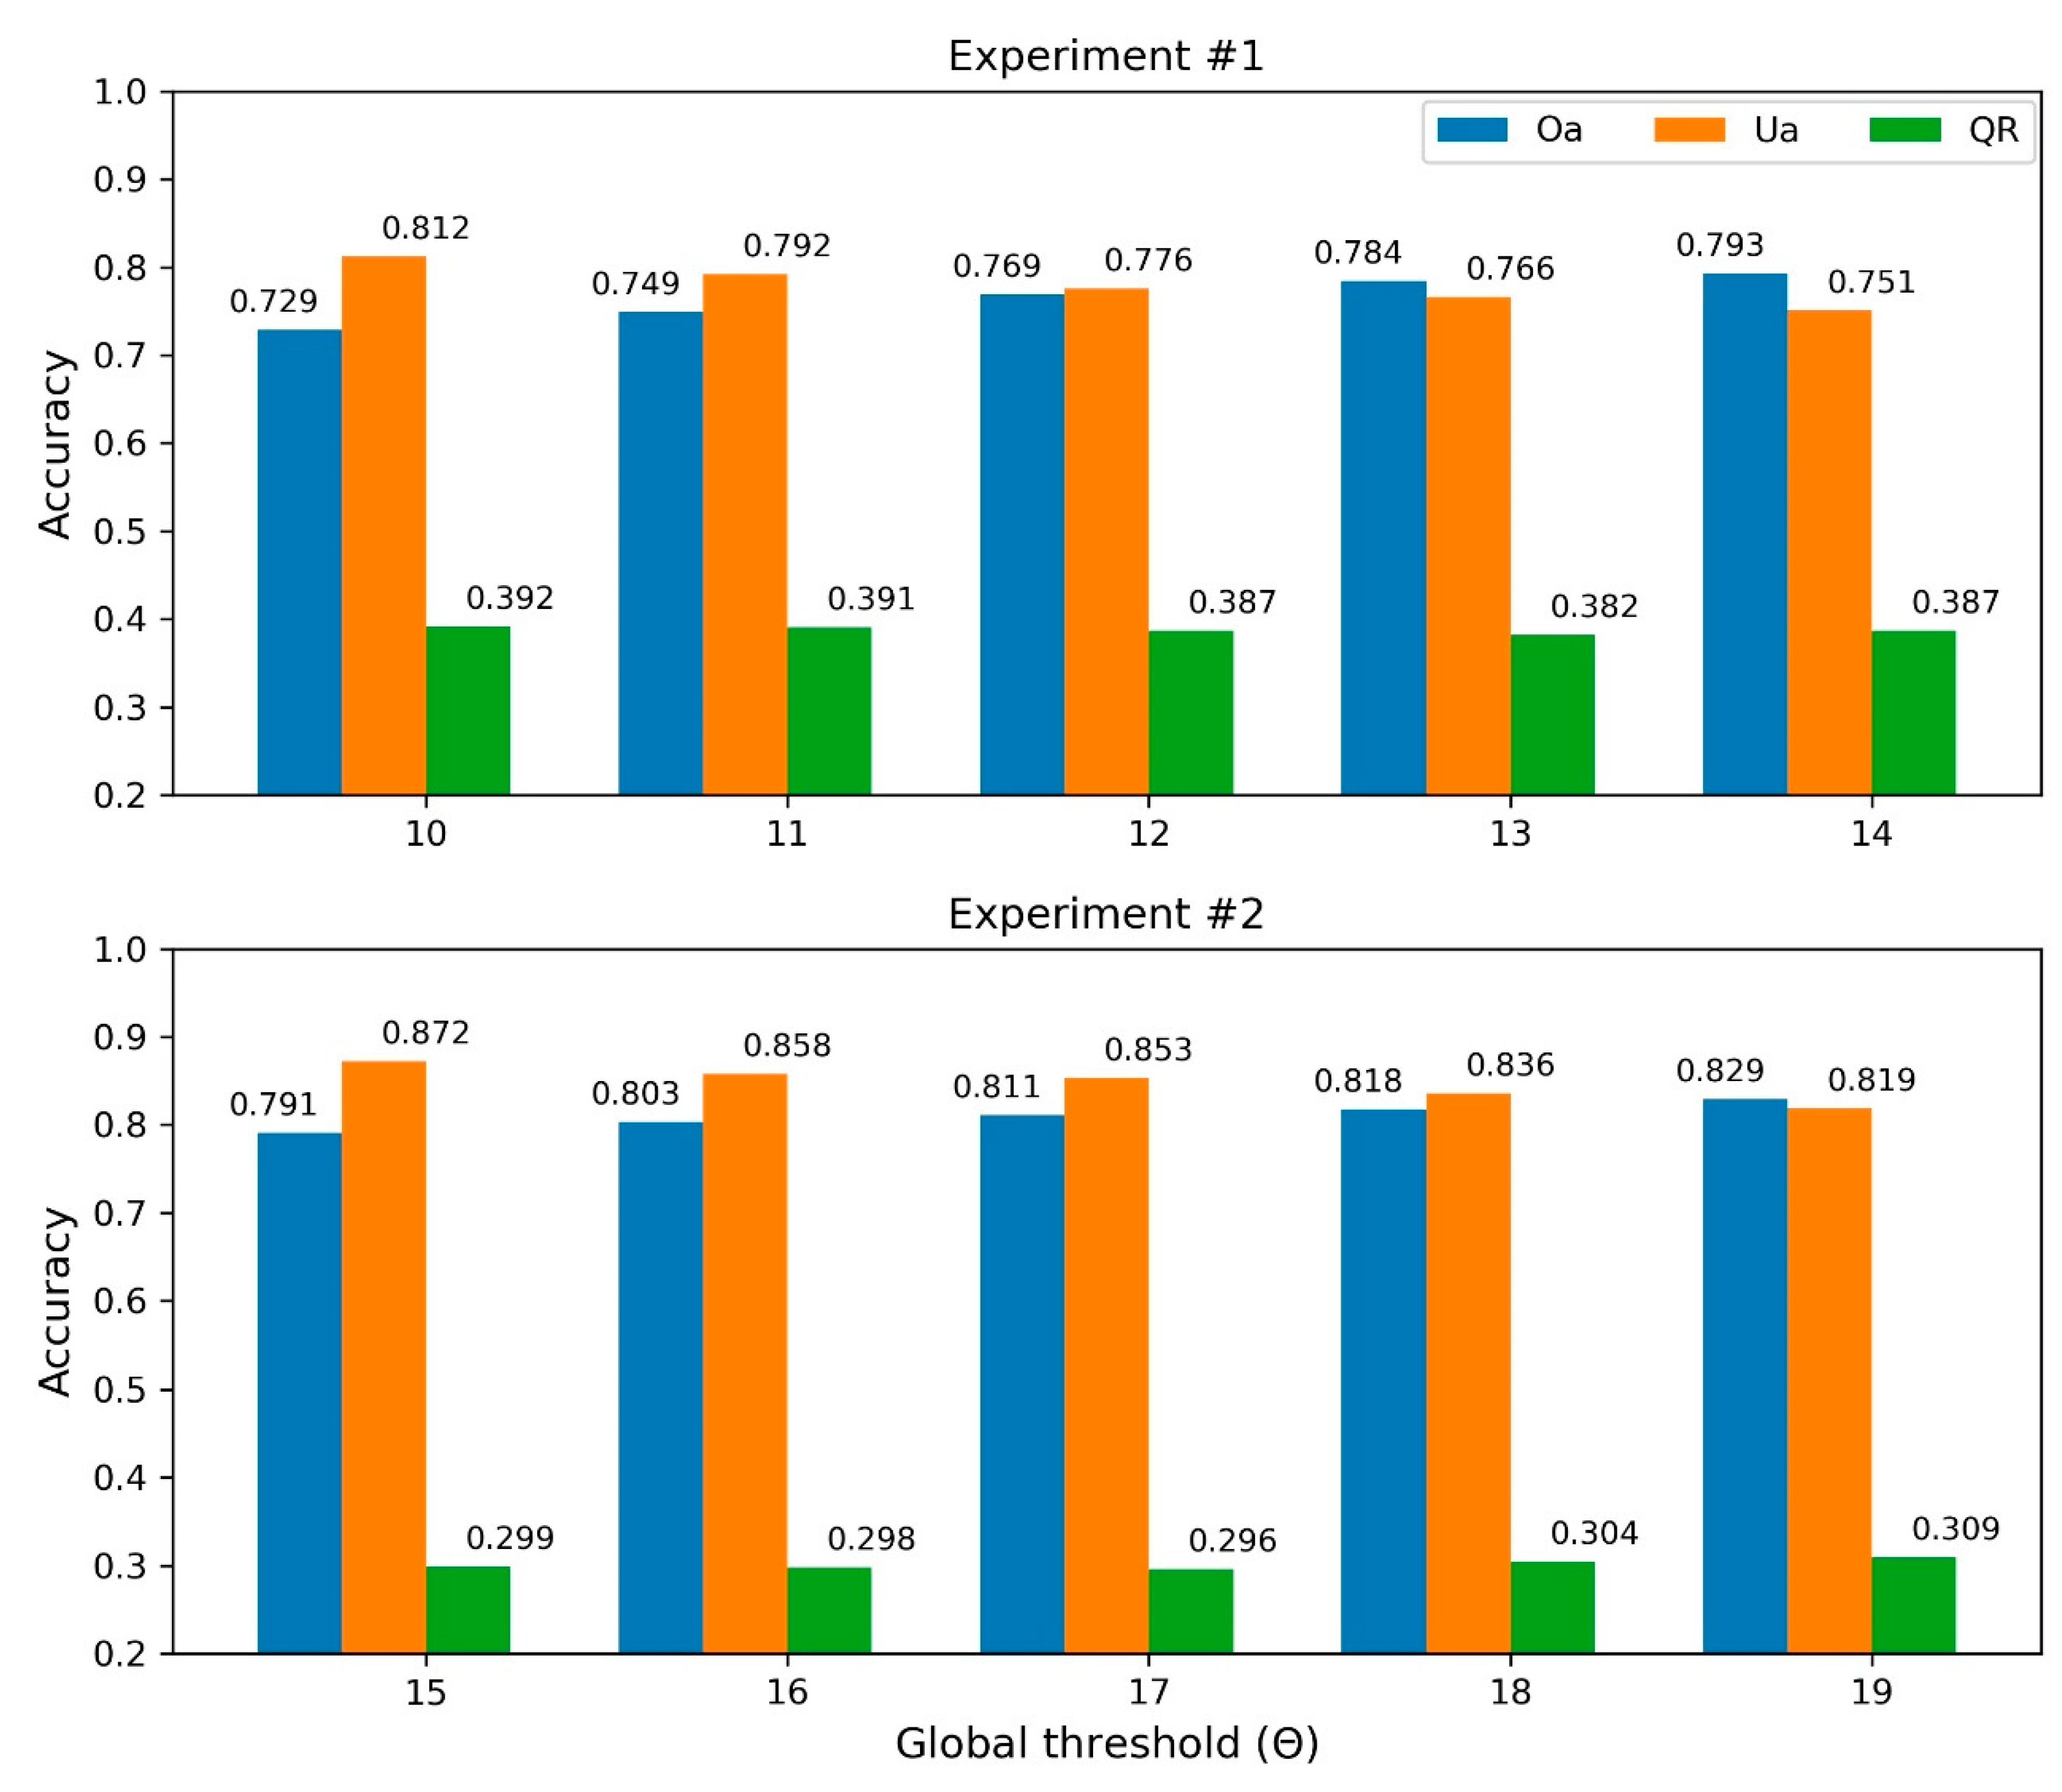
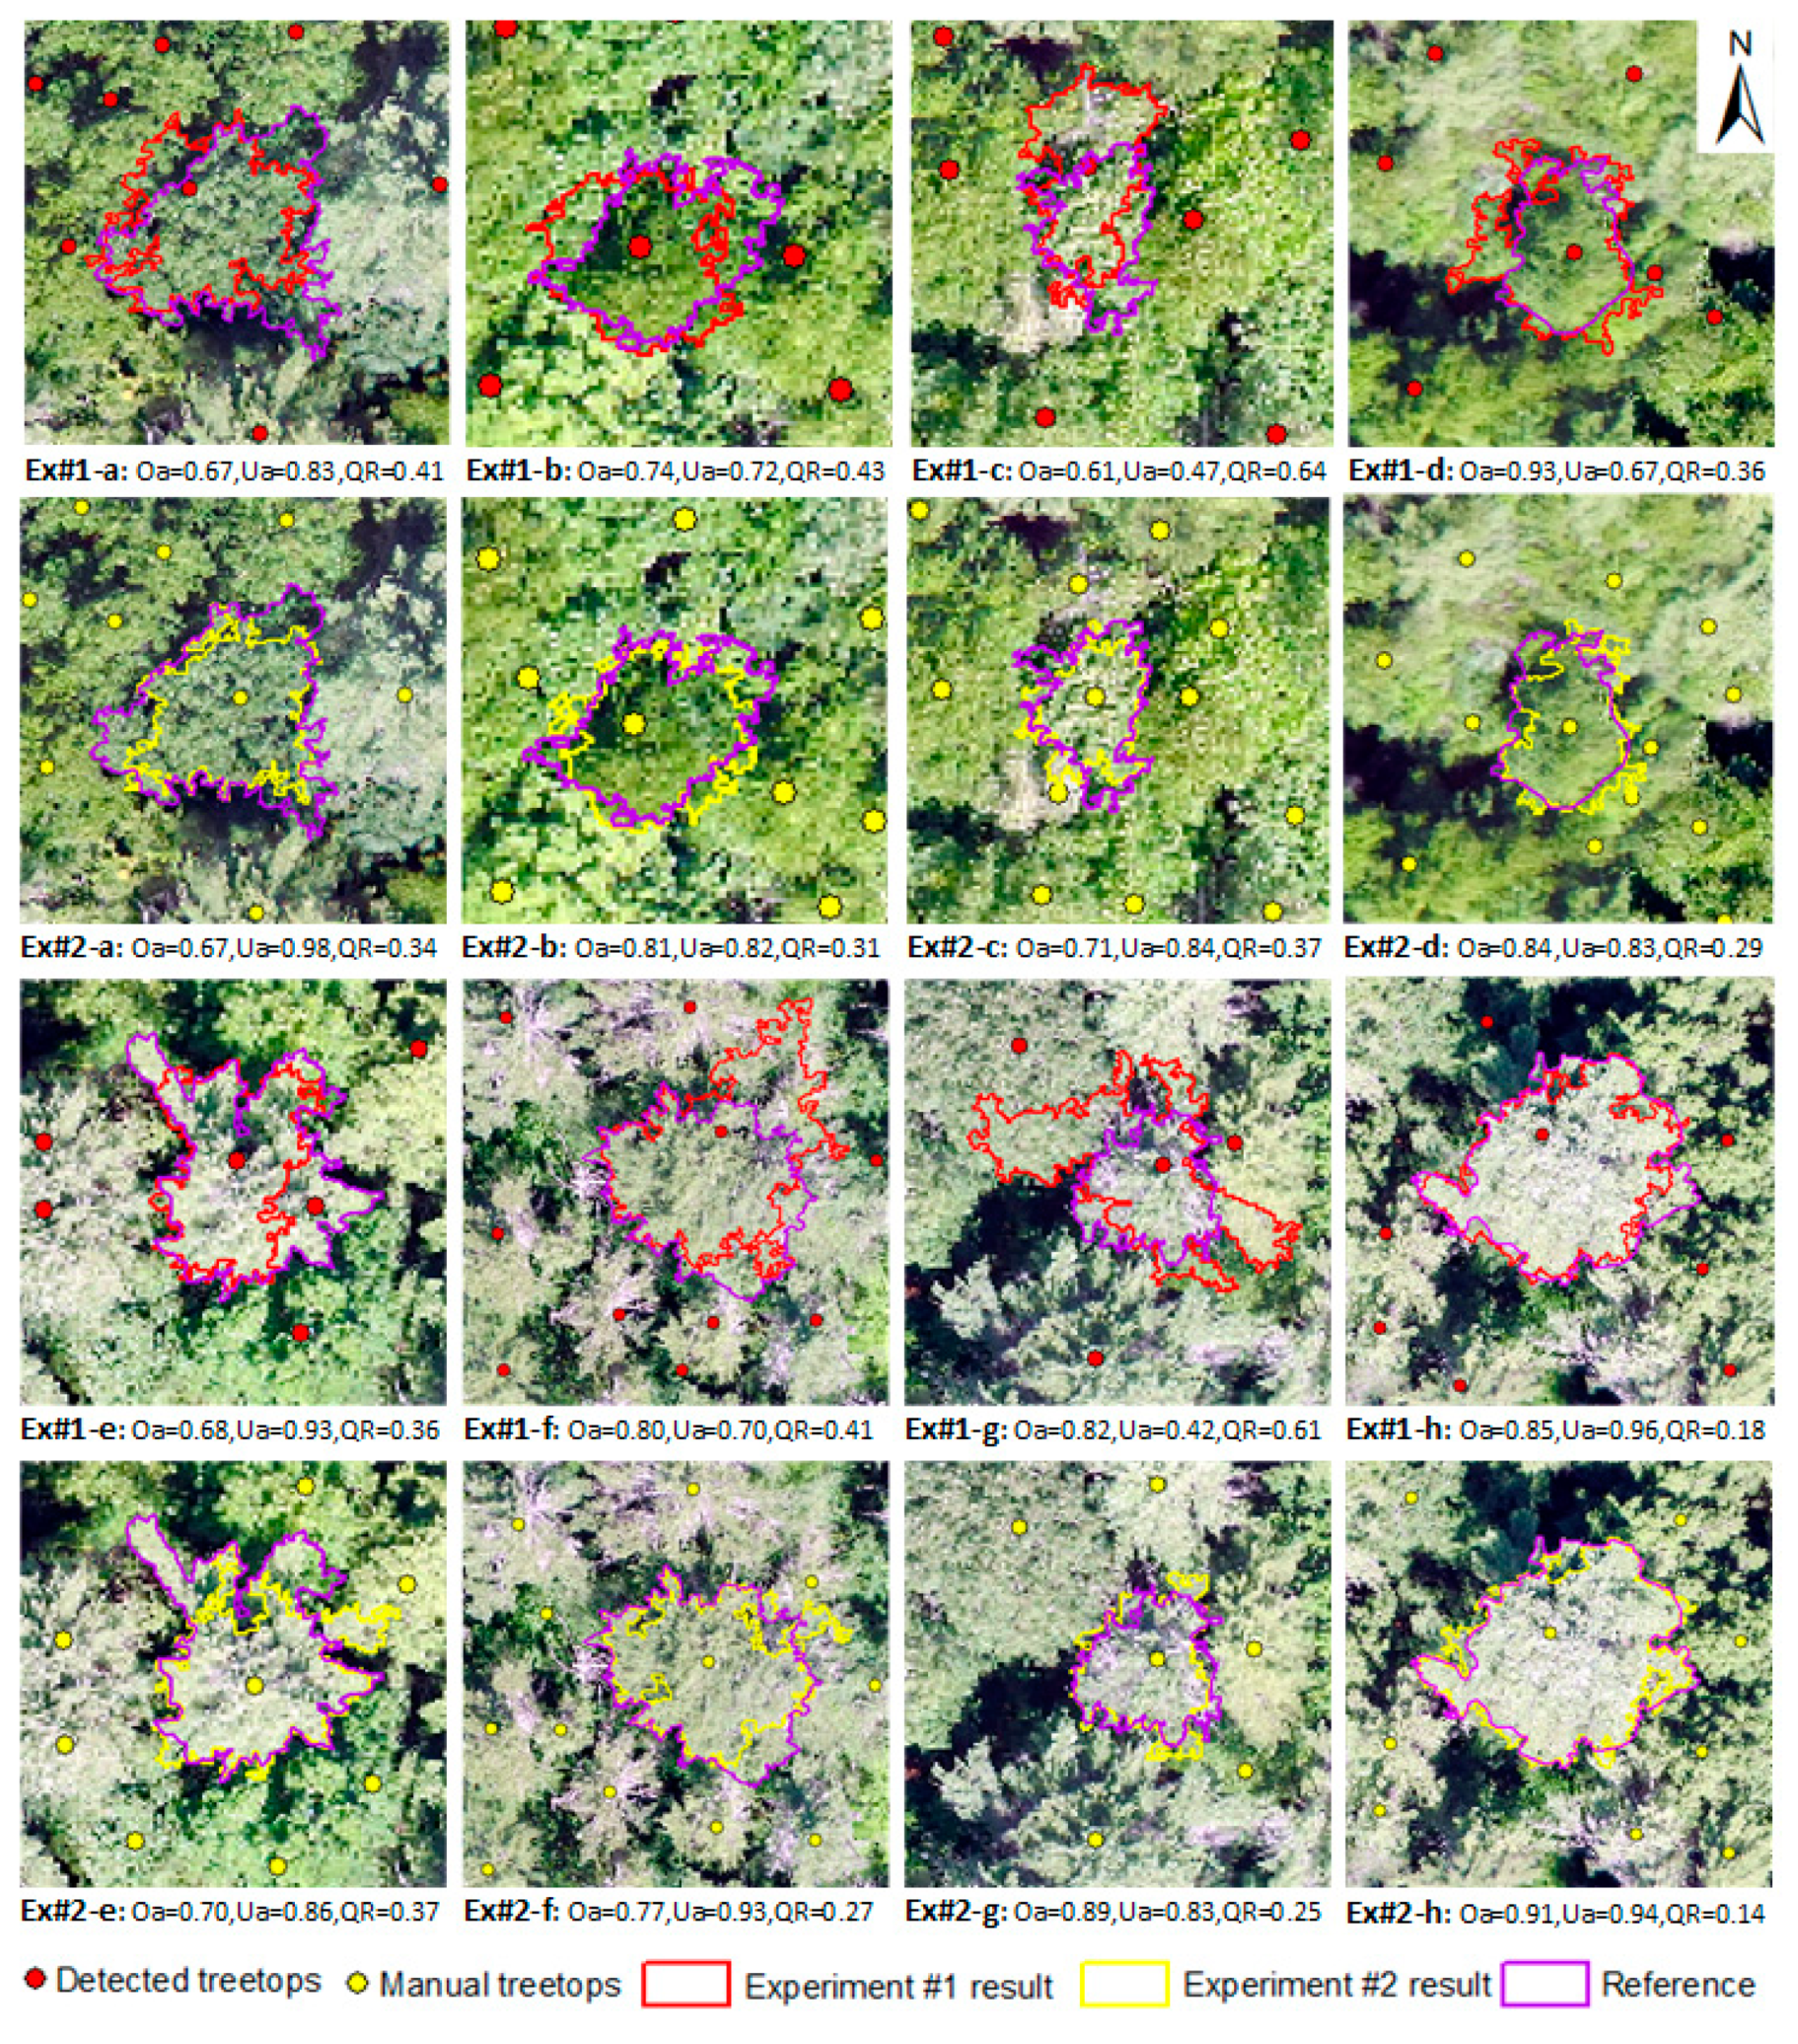
3.1. Experiment #1
3.2. Experiment #2
4. Results
4.1. Individual Treetop Detection Results
4.2. ITC Delineation Results
5. Discussion
6. Conclusions
Author Contributions
Funding
Acknowledgments
Conflicts of Interest
References
- Navarro, J.A.; Algeet, N.; Fernández-Landa, A.; Esteban, J.; Rodríguez-Noriega, P.; Guillén-Climent, M.L. Integration of UAV, Sentinel-1, and Sentinel-2 Data for Mangrove Plantation Aboveground Biomass Monitoring in Senegal. Remote Sens. 2019, 11, 77. [Google Scholar] [CrossRef]
- Ok, A.O.; Ozdarici-Ok, A. 2-D delineation of individual citrus trees from UAV-based dense photogrammetric surface models. Int. J. Digit. Earth 2018, 11, 583–608. [Google Scholar] [CrossRef]
- Nevalainen, O.; Honkavaara, E.; Tuominen, S.; Viljanen, N.; Hakala, T.; Yu, X.W.; Hyyppa, J.; Saari, H.; Polonen, I.; Imai, N.N.; et al. Individual Tree Detection and Classification with UAV-Based Photogrammetric Point Clouds and Hyperspectral Imaging. Remote Sens. 2017, 9, 185. [Google Scholar] [CrossRef]
- Shin, J.-I.; Seo, W.-W.; Kim, T.; Park, J.; Woo, C.-S. Using UAV Multispectral Images for Classification of Forest Burn Severity—A Case Study of the 2019 Gangneung Forest Fire. Forests 2019, 10, 1025. [Google Scholar] [CrossRef]
- Huang, H.Y.; Li, X.; Chen, C.C. Individual Tree Crown Detection and Delineation from Very-High-Resolution UAV Images Based on Bias Field and Marker-Controlled Watershed Segmentation Algorithms. IEEE J. Sel. Top. Appl. Earth Obs. Remote Sens. 2018, 11, 2253–2262. [Google Scholar] [CrossRef]
- Wan Mohd Jaafar, W.S.; Woodhouse, I.H.; Silva, C.A.; Omar, H.; Abdul Maulud, K.N.; Hudak, A.T.; Klauberg, C.; Cardil, A.; Mohan, M. Improving Individual Tree Crown Delineation and Attributes Estimation of Tropical Forests Using Airborne LiDAR Data. Forests 2018, 9, 759. [Google Scholar] [CrossRef]
- Hossain, M.D.; Chen, D. Segmentation for Object-Based Image Analysis (OBIA): A review of algorithms and challenges from remote sensing perspective. ISPRS J. Photogramm. Remote Sens. 2019, 150, 115–134. [Google Scholar] [CrossRef]
- Chen, G.; Weng, Q.; Hay, G.J.; He, Y. Geographic object-based image analysis (GEOBIA): Emerging trends and future opportunities. GISci. Remote Sens. 2018, 55, 159–182. [Google Scholar] [CrossRef]
- Blaschke, T. Object based image analysis for remote sensing. ISPRS J. Photogramm. Remote Sens. 2010, 65, 2–16. [Google Scholar] [CrossRef]
- Poblete-Echeverria, C.; Olmedo, G.F.; Ingram, B.; Bardeen, M. Detection and Segmentation of Vine Canopy in Ultra-High Spatial Resolution RGB Imagery Obtained from Unmanned Aerial Vehicle (UAV): A Case Study in a Commercial Vineyard. Remote Sens. 2017, 9, 268. [Google Scholar] [CrossRef]
- La, H.P.; Eo, Y.D.; Chang, A.; Kim, C. Extraction of individual tree crown using hyperspectral image and LiDAR data. KSCE J. Civil Eng. 2015, 19, 1078–1087. [Google Scholar] [CrossRef]
- Carr, J.C.; Slyder, J.B. Individual tree segmentation from a leaf-off photogrammetric point cloud. Int. J. Remote Sens. 2018, 39, 5195–5210. [Google Scholar] [CrossRef]
- Yin, D.; Wang, L. Individual mangrove tree measurement using UAV-based LiDAR data: Possibilities and challenges. Remote Sens. Environ. 2019, 223, 34–49. [Google Scholar] [CrossRef]
- Ke, Y.; Quackenbush, L.J. A review of methods for automatic individual tree-crown detection and delineation from passive remote sensing. Int. J. Remote Sens. 2011, 32, 4725–4747. [Google Scholar] [CrossRef]
- Zhen, Z.; Quackenbush, J.L.; Zhang, L. Trends in Automatic Individual Tree Crown Detection and Delineation—Evolution of LiDAR Data. Remote Sens. 2016, 8, 333. [Google Scholar] [CrossRef]
- Ma, J.; Du, K.; Zhang, L.; Zheng, F.; Chu, J.; Sun, Z. A segmentation method for greenhouse vegetable foliar disease spots images using color information and region growing. Comput. Electron. Agric. 2017, 142, 110–117. [Google Scholar] [CrossRef]
- Soltani-Nabipour, J.; Khorshidi, A.; Noorian, B. Lung tumor segmentation using improved region growing algorithm. Nucl. Eng. Technol. 2020. [Google Scholar] [CrossRef]
- Merzougui, M.; Allaoui, A.E. Region growing segmentation optimized by evolutionary approach and Maximum Entropy. Procedia Comput. Sci. 2019, 151, 1046–1051. [Google Scholar] [CrossRef]
- Milas, A.S.; Arend, K.; Mayer, C.; Simonson, M.A.; Mackey, S. Different colours of shadows: Classification of UAV images. Int. J. Remote Sens. 2017, 38, 3084–3100. [Google Scholar] [CrossRef]
- Erikson, M. Segmentation of individual tree crowns in colour aerial photographs using region growing supported by fuzzy rules. Can. J. Forest Res. 2003, 33, 1557–1563. [Google Scholar] [CrossRef]
- Zhen, Z.; Quackenbush, L.J.; Stehman, S.V.; Zhang, L. Agent-based region growing for individual tree crown delineation from airborne laser scanning (ALS) data. Int. J. Remote Sens. 2015, 36, 1965–1993. [Google Scholar] [CrossRef]
- Zhen, Z.; Quackenbush, J.L.; Zhang, L. Impact of Tree-Oriented Growth Order in Marker-Controlled Region Growing for Individual Tree Crown Delineation Using Airborne Laser Scanner (ALS) Data. Remote Sens. 2014, 6, 555–579. [Google Scholar] [CrossRef]
- Falah, R.K.; Bolon, P.; Cocquerez, J.P. A region-region and region-edge cooperative approach of image segmentation. In Proceedings of the 1st International Conference on Image Processing, Austin, TX, USA, 13–16 November 1994; pp. 470–474. [Google Scholar]
- Jain, P.K.; Susan, S. An adaptive single seed based region growing algorithm for color image segmentation. In Proceedings of the Annual IEEE India Conference (INDICON), Mumbai, India, 13–15 December 2013; pp. 1–6. [Google Scholar]
- Wang, Z.; Jensen, J.R.; Im, J. An automatic region-based image segmentation algorithm for remote sensing applications. Environ. Model. Softw. 2010, 25, 1149–1165. [Google Scholar] [CrossRef]
- Cui, W.; Guan, Z.; Zhang, Z. An Improved Region Growing Algorithm for Image Segmentation. In Proceedings of the International Conference on Computer Science and Software Engineering, Wuhan, China, 12–14 December 2008; pp. 93–96. [Google Scholar]
- Jun, P.; Bai, Z.; Jun-chen, L.; Li, S. Automatic segmentation of crop leaf spot disease images by integrating local threshold and seeded region growing. In Proceedings of the International Conference on Image Analysis and Signal Processing, San Francisco, CA, USA, 21–23 October 2011; pp. 590–594. [Google Scholar]
- Sezgin, M.; Sankur, B. Survey over image thresholding techniques and quantitative performance evaluation. J. Electron. Imaging 2004, 13, 146–165. [Google Scholar] [CrossRef]
- Jianping, F.; Yau, D.K.Y.; Elmagarmid, A.K.; Aref, W.G. Automatic image segmentation by integrating color-edge extraction and seeded region growing. IEEE Trans. Image Process. 2001, 10, 1454–1466. [Google Scholar] [CrossRef]
- Grebner, D.L.; Bettinger, P.; Siry, J.P. Chapter 6—Ecosystem Services. In Introduction to Forestry and Natural Resources; Academic Press: San Diego, CA, USA, 2013; pp. 147–165. [Google Scholar] [CrossRef]
- Popescu, S.; Wynne, R. Seeing the Trees in the Forest: Using Lidar and Multispectral Data Fusion with Local Filtering and Variable Window Size for Estimating Tree Height. Photogramm. Eng. Remote Sens. 2004, 70, 589–604. [Google Scholar] [CrossRef]
- Bontemps, S.; Defourny, P.; Van Bogaert, E.; Arino, O.; Kalogirou, V.; Perez, J.R. GlobCOVER 2009 Products Description and Validation Report; UCLouvain and ESA: Paris, France, 2010. [Google Scholar]
- Congalton, R.; Gu, J.; Yadav, K.; Thenkabail, P.; Ozdogan, M. Global Land Cover Mapping: A Review and Uncertainty Analysis. Remote Sens. 2014, 6, 12070–12093. [Google Scholar] [CrossRef]
- Panagiotidis, D.; Abdollahnejad, A.; Surový, P.; Chiteculo, V. Determining tree height and crown diameter from high-resolution UAV imagery. Int. J. Remote Sens. 2017, 38, 2392–2410. [Google Scholar] [CrossRef]
- Chudasama, D.; Patel, T.; Joshi, S.; Prajapati, G.I. Image segmentation using morphological operations. Int. J. Comput. Appl. 2015, 117. [Google Scholar] [CrossRef]
- Bhargava, N.; Trivedi, P.; Toshniwal, A.; Swarnkar, H. Iterative Region Merging and Object Retrieval Method Using Mean Shift Segmentation and Flood Fill Algorithm. In Proceedings of the Third International Conference on Advances in Computing and Communications, Cochin, India, 29–31 August 2013; pp. 157–160. [Google Scholar]
- Mohan, M.; Silva, C.A.; Klauberg, C.; Jat, P.; Catts, G.; Cardil, A.; Hudak, A.T.; Dia, M. Individual Tree Detection from Unmanned Aerial Vehicle (UAV) Derived Canopy Height Model in an Open Canopy Mixed Conifer Forest. Forests 2017, 8, 340. [Google Scholar] [CrossRef]
- Möller, M.; Lymburner, L.; Volk, M. The comparison index: A tool for assessing the accuracy of image segmentation. Int. J. Appl. Earth Obs. Geoinform. 2007, 9, 311–321. [Google Scholar] [CrossRef]
- Chen, Y.Y.; Ming, D.P.; Zhao, L.; Lv, B.R.; Zhou, K.Q.; Qing, Y.Z. Review on High Spatial Resolution Remote Sensing Image Segmentation Evaluation. Photogramm. Eng. Remote Sens. 2018, 84, 629–646. [Google Scholar] [CrossRef]
- Weidner, U. Contribution to the assessment of segmentation quality for remote sensing applications. Int. Arch. Photogramm. Remote Sens. 2008, 37, 479–484. [Google Scholar]
- SenseFly User-Manuals. Available online: https://www.sensefly.com/my-sensefly/user-manuals/ (accessed on 21 June 2020).
- Iizuka, K.; Yonehara, T.; Itoh, M.; Kosugi, Y. Estimating Tree Height and Diameter at Breast Height (DBH) from Digital Surface Models and Orthophotos Obtained with an Unmanned Aerial System for a Japanese Cypress (Chamaecyparis obtusa) Forest. Remote Sens. 2018, 10, 13. [Google Scholar] [CrossRef]
- Fraser, T.B.; Congalton, G.R. Evaluating the Effectiveness of Unmanned Aerial Systems (UAS) for Collecting Thematic Map Accuracy Assessment Reference Data in New England Forests. Forests 2019, 10, 24. [Google Scholar] [CrossRef]
- GRANIT LiDAR Distribution Site. Available online: http://lidar.unh.edu/map/ (accessed on 21 June 2020).
- Congalton, R.G.; Green, K. Assessing the accuracy of remotely sensed data: Principles and practices. Photogramm. Rec. 2019, 25. [Google Scholar] [CrossRef]
- Ye, S.; Pontius, R.G.; Rakshit, R. A review of accuracy assessment for object-based image analysis: From per-pixel to per-polygon approaches. ISPRS J. Photogramm. Remote Sens. 2018, 141, 137–147. [Google Scholar] [CrossRef]
- Dronova, I. Object-Based Image Analysis in Wetland Research: A Review. Remote Sens. 2015, 7, 6380–6413. [Google Scholar] [CrossRef]
- Li, Z.; Hayward, R.; Zhang, J.; Liu, Y. Individual Tree Crown Delineation Techniques for Vegetation Management in Power Line Corridor. In Proceedings of the Digital Image Computing: Techniques and Applications, Canberra, Australia, 1–3 December 2008; pp. 148–154. [Google Scholar]
- Vauhkonen, J.; Ene, L.; Gupta, S.; Heinzel, J.; Holmgren, J.; Pitkänen, J.; Solberg, S.; Wang, Y.; Weinacker, H.; Hauglin, K.M.; et al. Comparative testing of single-tree detection algorithms under different types of forest. For.: Int. J. For. Res. 2011, 85, 27–40. [Google Scholar] [CrossRef]
- Kwak, D.-A.; Lee, W.-K.; Lee, J.-H.; Biging, G.S.; Gong, P. Detection of individual trees and estimation of tree height using LiDAR data. J. Forest Res. 2007, 12, 425–434. [Google Scholar] [CrossRef]
- Larsen, M.; Eriksson, M.; Descombes, X.; Perrin, G.; Brandtberg, T.; Gougeon, F.A. Comparison of six individual tree crown detection algorithms evaluated under varying forest conditions. Int. J. Remote Sens. 2011, 32, 5827–5852. [Google Scholar] [CrossRef]
- Jayathunga, S.; Owari, T.; Tsuyuki, S. Evaluating the Performance of Photogrammetric Products Using Fixed-Wing UAV Imagery over a Mixed Conifer-Broadleaf Forest: Comparison with Airborne Laser Scanning. Remote Sens. 2018, 10, 187. [Google Scholar] [CrossRef]
- Vastaranta, M.; Wulder, M.A.; White, J.C.; Pekkarinen, A.; Tuominen, S.; Ginzler, C.; Kankare, V.; Holopainen, M.; Hyyppä, J.; Hyyppä, H. Airborne laser scanning and digital stereo imagery measures of forest structure: Comparative results and implications to forest mapping and inventory update. Can. J. Remote Sens. 2013, 39, 382–395. [Google Scholar] [CrossRef]
- Habib, A.; Bang, K.I.; Kersting, A.P.; Lee, D.-C. Error budget of LiDAR systems and quality control of the derived data. Photogramm. Eng. Remote Sens. 2009, 75, 1093–1108. [Google Scholar] [CrossRef]
- Pla, M.; Duane, A.; Brotons, L. Potential of UAV images as ground-truth data for burn severity classification of Landsat imagery: Approaches to an useful product for post-fire management. Rev. Teledetección 2017, 49. [Google Scholar] [CrossRef]
- Hassan, M.A.; Yang, M.; Fu, L.; Rasheed, A.; Zheng, B.; Xia, X.; Xiao, Y.; He, Z. Accuracy assessment of plant height using an unmanned aerial vehicle for quantitative genomic analysis in bread wheat. Plant Methods 2019, 15, 37. [Google Scholar] [CrossRef]
- Ke, Y.; Quackenbush, L.J. Comparison of individual tree crown detection and delineation methods. In Proceedings of the ASPRS Annual Conference, Portland, OR, USA, 28 April–2 May 2008. [Google Scholar]


| Reference Data | |||
| Positive | Negative | ||
| Detected | Positive | TP | FP |
| Negative | FN | TN | |
| Reference Data | |||
| Positive | Negative | ||
| Detected | Positive | 878 | 93 |
| Negative | 295 | NA | |
© 2020 by the authors. Licensee MDPI, Basel, Switzerland. This article is an open access article distributed under the terms and conditions of the Creative Commons Attribution (CC BY) license (http://creativecommons.org/licenses/by/4.0/).
Share and Cite
Gu, J.; Grybas, H.; Congalton, R.G. Individual Tree Crown Delineation from UAS Imagery Based on Region Growing and Growth Space Considerations. Remote Sens. 2020, 12, 2363. https://doi.org/10.3390/rs12152363
Gu J, Grybas H, Congalton RG. Individual Tree Crown Delineation from UAS Imagery Based on Region Growing and Growth Space Considerations. Remote Sensing. 2020; 12(15):2363. https://doi.org/10.3390/rs12152363
Chicago/Turabian StyleGu, Jianyu, Heather Grybas, and Russell G. Congalton. 2020. "Individual Tree Crown Delineation from UAS Imagery Based on Region Growing and Growth Space Considerations" Remote Sensing 12, no. 15: 2363. https://doi.org/10.3390/rs12152363
APA StyleGu, J., Grybas, H., & Congalton, R. G. (2020). Individual Tree Crown Delineation from UAS Imagery Based on Region Growing and Growth Space Considerations. Remote Sensing, 12(15), 2363. https://doi.org/10.3390/rs12152363