Article

The First Pi2 Pulsation Observed by China Seismo-Electromagnetic Satellite

1
National Research Institute of Astronomy and Geophysics, Helwan 11421, Cairo, Egypt
2
International Center for Space Weather Science and Education, Kyushu University, Fukuoka 819-0395, Japan
3
School of Remote Sensing and Geomatics Engineering, Nanjing University of Information Science and Technology, Nanjing 210044, China
4
INGV Istituto Nazionale di Geofisica e Vulcanologia, 00143 Rome, Italy
5
Department of Earth and Planetary Science, Kyushu University, Fukuoka 819-0395, Japan
6
Institute of Crustal Dynamics, China Earthquake Administration, Beijing 100085, China
7
Physics Department, Faculty of Science, Fayoum University, Fayoum 63514, Egypt
*
Author to whom correspondence should be addressed.
Remote Sens. 2020, 12(14), 2300; https://doi.org/10.3390/rs12142300
Submission received: 14 June 2020 / Revised: 6 July 2020 / Accepted: 13 July 2020 / Published: 17 July 2020
(This article belongs to the Special Issue Remote Sensing of Ionosphere Observation and Investigation)

Abstract

:
On 2 February 2018, the China Seismo-Electromagnetic Satellite (CSES) ZhangHeng 01 (ZH-01) was successfully launched, carrying on board, in addition to a suite of plasma and particle physics instruments, a high precision magnetometer package (HPM), able to observe the ultra-low frequency (ULF) waves. In this paper, a night time Pi2 pulsation observed by CSES is reported for the first time. This Pi2 event occurred on 3 September 2018, and began at 14:30 UT (02:37 magnetic local time), when the satellite was in the southern hemisphere between −49 and −13 magnetic latitude (MLAT). Kakioka (KAK) ground station in Japan detected the same Pi2 between 14:30–14:42 UT (23:30–23:42 local time). The Pi2 oscillations in the compressional, toroidal, and poloidal components at the CSES satellite and the H-component at the KAK station are investigated by estimating coherence, amplitude, and cross-phase. We noticed a high degree of similarity between the Pi2 event in the horizontal component at KAK and the ionospheric fluctuations in the compressional component at CSES. This high correlation indicated the magnetospheric source of the Pi2 event. In addition, Pi2 is exhibited clearly in the δBy component at CSES, which is highly correlated with the ground H component, so the Pi2 event could be explained by the Substorm Current Wedge (SCW). This interpretation is further confirmed by checking the compressional component of Van Allen Probe (VAP) B satellite inside the plasmasphere, which, for the first time, gives observational support for an earlier model. This ULF wave observation shows the consistency and reliability of the high precision magnetometer (HPM) equipped by two fluxgate magnetometers (FGM1 and FGM2) onboard CSES.

Graphical Abstract

1. Introduction

Pi2 magnetic pulsation is an impulsive nightside ultra-low frequency (ULF) wave and it is considered a sensitive indicator to the onset of the geomagnetic substorms within low- and mid-latitudinal regions. The presence of Pi2s with the substorm onset makes it as an imperative intermedia for understanding the electrodynamic processes occurring in the coupling between magnetospheric and ionospheric regions. The frequency range of this wave is 6.6–25 mHz, i.e., a period of 40–150 s, with an amplitude of 0.2–2.3 nT. Pi2 pulsations have a common period and can be noticed on the ground over wide regions, which vary from high to low latitudes with different spectral contents over a wide Local Time (LT) [1]. Although Pi2 is a common nighttime phenomenon, daytime Pi2 can be observed as well with similar periods and phases [2,3], and with an enhancement of its amplitude at the dip equator [4].
The mechanism of the Pi2 has not been firmly established but it suggests that it has different source for different latitudes [5]. At high latitudes, Alfvén waves are commonly invoked as the source of Pi2 on the ground, which is known as the field line resonance (FLR) and is linked with Ffield-Aligned Currents (FAC). However, at the mid and low latitudes, a plasmaspheric cavity resonance is presumably a common source of Pi2 waves [6]; this phenomenon is commonly known as a fast mode wave enclosed inside the plasmasphere [7,8,9].
The authors of [10] suggested a Pi2 model connected with the substorm current wedge (SCW) structure. They proposed that azimuthal magnetic perturbation of Pi2 can be generated by the field-aligned currents (FACs) in the pulses of SCW. The authors of [11,12,13] investigated global high-correlation Pi2 events on the night side region.
The delay time of Pi2 magnetic micro-pulsation in the high-latitude H component exhibits a significant delay (T < ~100 s) from Pi2 in the H component at a low-latitude station, as reported by [11,12,13,14,15]. These authors also found that the delay time of Pi2 in the D component at a high-latitude exhibits fewer seconds to Pi2 than at the H component in a low-latitude station. Based on Pi2 observations at ground stations, the model in [11], which focused on studying the high-latitude Pi2 as observed in the H and D components, is compatible with the model in [10]. One of the wave elements that likely exists in global high-correlation Pi2 waves, according to [11,13], is the SCW oscillations, which mainly occurred in D component in the low, middle, and high-latitudinal Pi2 regions. The study reported in [16] for the Pi2 pulsation, observed near terminators, clarifies the contribution of the night side SCW on this pulsation.
In the last few decades, Low Earth Orbit (LEO) satellites in the upper ionosphere have given some unique opportunities and a lot of information to demonstrate the effect of the ionosphere on ULF waves propagating from the magnetosphere [17]. In ULF studies from LEO satellites, one of the prime challenges is the rapid movement of the spacecraft so the lower frequencies of the ULF waves (<10 mHz) would be masked by the Doppler shift.
There are several studies of ULF waves in the Pc3 and Pi2 frequency ranges (22–100 mHz and 6.7–25 mHz, respectively) that have been investigated using LEO satellite observations such as the Swarm three-satellite mission in the topside ionosphere [18,19]. The authors of [20] elucidated a Pi2 wave seen by LEO satellite, called UARS, and on the ground by the low-latitude Kakioka (KAK) station. They demonstrated a similarity between the Pi2 event at a low-latitude region in the horizontal H component and ionospheric perturbations in the compressional Bz component. Using the CHAMP satellite, the authors of [21], in their comparison between the Pi2 waves detected at a low-latitudinal ground station, showed that the Bx and Bz oscillations have a good similarity with the horizontal H component, but the Bx and Bz perturbations were in phase and out of phase in the Northern Hemisphere and Southern Hemisphere, respectively. The same authors concluded that the observations give more support for a plasmaspheric cavity mode. They showed that night side Pi2 pulsation in the azimuthal component seems to have a good correlation between the ground station and the topside ionosphere. The authors of [22] used data acquired from the LEO satellite called Ørsted and the KAK ground station and made an analysis of Pi2 magnetic micro-pulsations; they found a similarity between the Bz component of Pi2 pulsations at Ørsted and the H component on the ground, but no correlation found in the Bx and By components, with the ground observations at H.
China Seismo-Electromagnetic Satellite (CSES) has been already useful to study several phenomena, including space weather events like the geomagnetic storm of the 26 August 2018 [23,24,25], and the possible response of the ionosphere to a preparation phase of the earthquakes as the case study of the M7.5 Indonesia 28 September 2018, event [26], or other shallow and deep earthquakes with a magnitude between 7.1 and 8.1 [27]. Moreover, the satellite can give an important contribution to the monitor of the geomagnetic field and its variations and pulsations (as it will be investigated in this work) to better understand the physics of the ionosphere, the Van Allen belts, and more [28].
To the best of authors’ knowledge, this is the first investigation of Pi2 pulsation made using the CSES satellite. Few studies have addressed the observation of global high-correlation Pi2 on the ground and in the ionosphere and magnetosphere. The authors of [29] show the formation and time evolution of a three-dimensional (3-D) oscillatory current system in the SCW. Our results strongly support the result of [29] using in situ observation of Pi2 in the magnetosphere. Pi2 analysis confirms the consistency and reliability of the high precision magnetometer (HPM) equipped by two fluxgate magnetometers (FGM1 and FGM2) onboard CSES. We use the KAK low-latitude ground station as the reference signal relative to those spectral intensities, coherence, and phase of the ionospheric magnetic field observed at the CSES and Van Allen Probe (VAP) satellites. The paper can be organized as follows. In Section 2, all data sets are described. The observations are presented in Section 3. In Section 4 we discuss the results. Section 5 presents the conclusions of this paper.

2. Data Sets

2.1. CSES Satellite

The first CSES is also called Zhangheng (ZH-1) in honor of Zhang Heng, a Chinese scientist who lived from AD 78 to 139 and who invented the first seismoscope. The satellite, managed by the Chinese Space Agency, China Earthquake Administration, and Italian Space Agency, has been working for over two years since its launch on 2 February 2018, and it is still in orbit and in nominal working conditions. The main scope of the mission is to search for perturbations of the ionosphere and to study their possible correlation with the occurrence of seismic events. To achieve this goal, the satellite has been equipped with nine payloads that monitor the ionospheric magnetic and electric field, two-particle detectors, and other instruments to analyze the plasma, like LAP (Langmuir Probes) and PAP (Plasma Analyzer Package) to determine the electron density, temperature, and which ionized elements are present in the orbital environment.
CSES-01 is the first satellite of a constellation of at least five satellites, and China and Italy are presently building the second one, i.e., CSES-02. CSES-01 works in two modes: burst and survey, with different parameters and sampling rates. The satellite is set to work in burst mode over China and in a seismic belt around the world, and in survey mode in other regions. The data are downloaded from China when the satellite passes over the country. The orbit is quasi polar and Sun-synchronous, with a coverage return time of exactly five days.
To measure the magnetic field, CSES has been equipped with two fluxgate magnetometers (HPM1 and HPM2), placed on two orthogonal booms, which provide the orientation of the magnetic field while an absolute scalar magnetometer allows us to determine the intensity of the same field and calibrate the fluxgates. These instruments form the High Precision Magnetometer (HPM) instrument. The data are sampled at 60 Hz (however, we analyzed them at 1 Hz). The orientation of the spacecraft is checked by two star-cameras placed on the satellite body. The electron density and electron temperature are measured by a couple of Langmuir probes. An Electric Field Detector (EFD) placed at the end of another boom is dedicated to measuring the electric field vector. To detect possible particles emitted from the active faults, the satellite has been provided with two-particle detectors: The Low Energy Particle Detector and the High Energy Particle Detector; the latter detector has been designed and assembled in Italy by the Italian National Institute of Nuclear Physics (INFN).
The data are elaborated by the CSES team in four levels, starting from the raw level. In this study we processed the Level2, which is the calibrated data reported in the Earth Reference System. The data have been downloaded from the CSES portal (www.leos.ac.cn) where the data are available after a free registration.
CSES data are provided in the WSG84 reference system and coordinates. This reference system is defined in the Earth center with the x-y plane as the equatorial one, where X points toward the Greenwich meridian, Z is parallel to the Earth’s rotational axis, and Y is orthogonal forming a right-hand reference system. The origin of the reference system is then translated to the satellite position. To report the magnetic signal to the commonly used NEC frame (i.e., the one used by Swarm satellites), a rotation has been applied. The new coordinates have been calculated by two rotation matrices following the next equation:
| B X B Y B Z | = 1 · | cos ( 180 λ ) 0 sin ( 180 λ ) 0 1 0 sin ( 180 λ ) 0 cos ( 180 λ ) | · | cos ( 180 φ ) sin ( 180 φ ) 0 sin ( 180 φ ) cos ( 180 φ ) 0 0 0 1 | · | B X ( C S E S ) B Y ( C S E S ) B Z ( C S E S ) |
where λ and φ are the geographical latitude and longitude of the CSES satellite at the acquisition time. As the CSES measures the total magnetic field (including the internal field, crustal field, and external field), we have used the CHAOS-6 model [30] of Earth’s geomagnetic field, which was developed using more than 6.5 years of high-precision geomagnetic measurements from the Swarm three satellites, to retrieve the external ionospheric component. The residual fields, obtained from this model, are then transformed to Mean-Field Aligned (MFA) coordinates, poloidal, and toroidal components in the topside ionosphere.

2.2. VAP Mission

The twin VAP mission was launched on 30 August 2012, by NASA for its Living with a Star program. The VAP mission has two near-equatorial orbit spacecrafts (VAP-A and VAP-B). Both VAPs, with apogee near L ~ 6, contain several sensors prepared to investigate the Earth’s radiation medium [31]. The triaxial fluxgate magnetometers onboard the two satellites are qualified to measure 64 vectors per second [32].
We used Electric and Magnetic Field Instrument Suite and Integrated Science (EMFISIS) [32] to get 1Hz data of the magnetic field. The EMFISIS magnetic data are rotated from the GSM coordinates into mean field-aligned (MFA) coordinates. This decomposition allows the dominant magnetic field wave polarization to be determined as toroidal (azimuthal), poloidal (radial), or compressional (parallel). In this system, the Bx is outward, perpendicular to the averaged magnetic field; By is eastward, perpendicular to the averaged magnetic field; and Bz is northward, along the averaged magnetic field.

2.3. KAK Geomagnetic Observatory

We used one-second resolution data from the low-latitude KAK geomagnetic observatory in Japan to examine Pi2 magnetic pulsations as detected on the ground. The geographic latitude, geographic longitude, and magnetic latitude of the KAK is 36.23°N, 140.18°E, and 27.18°, respectively. The KAK L-value = 1.31 and its local time = universal time +9 h.

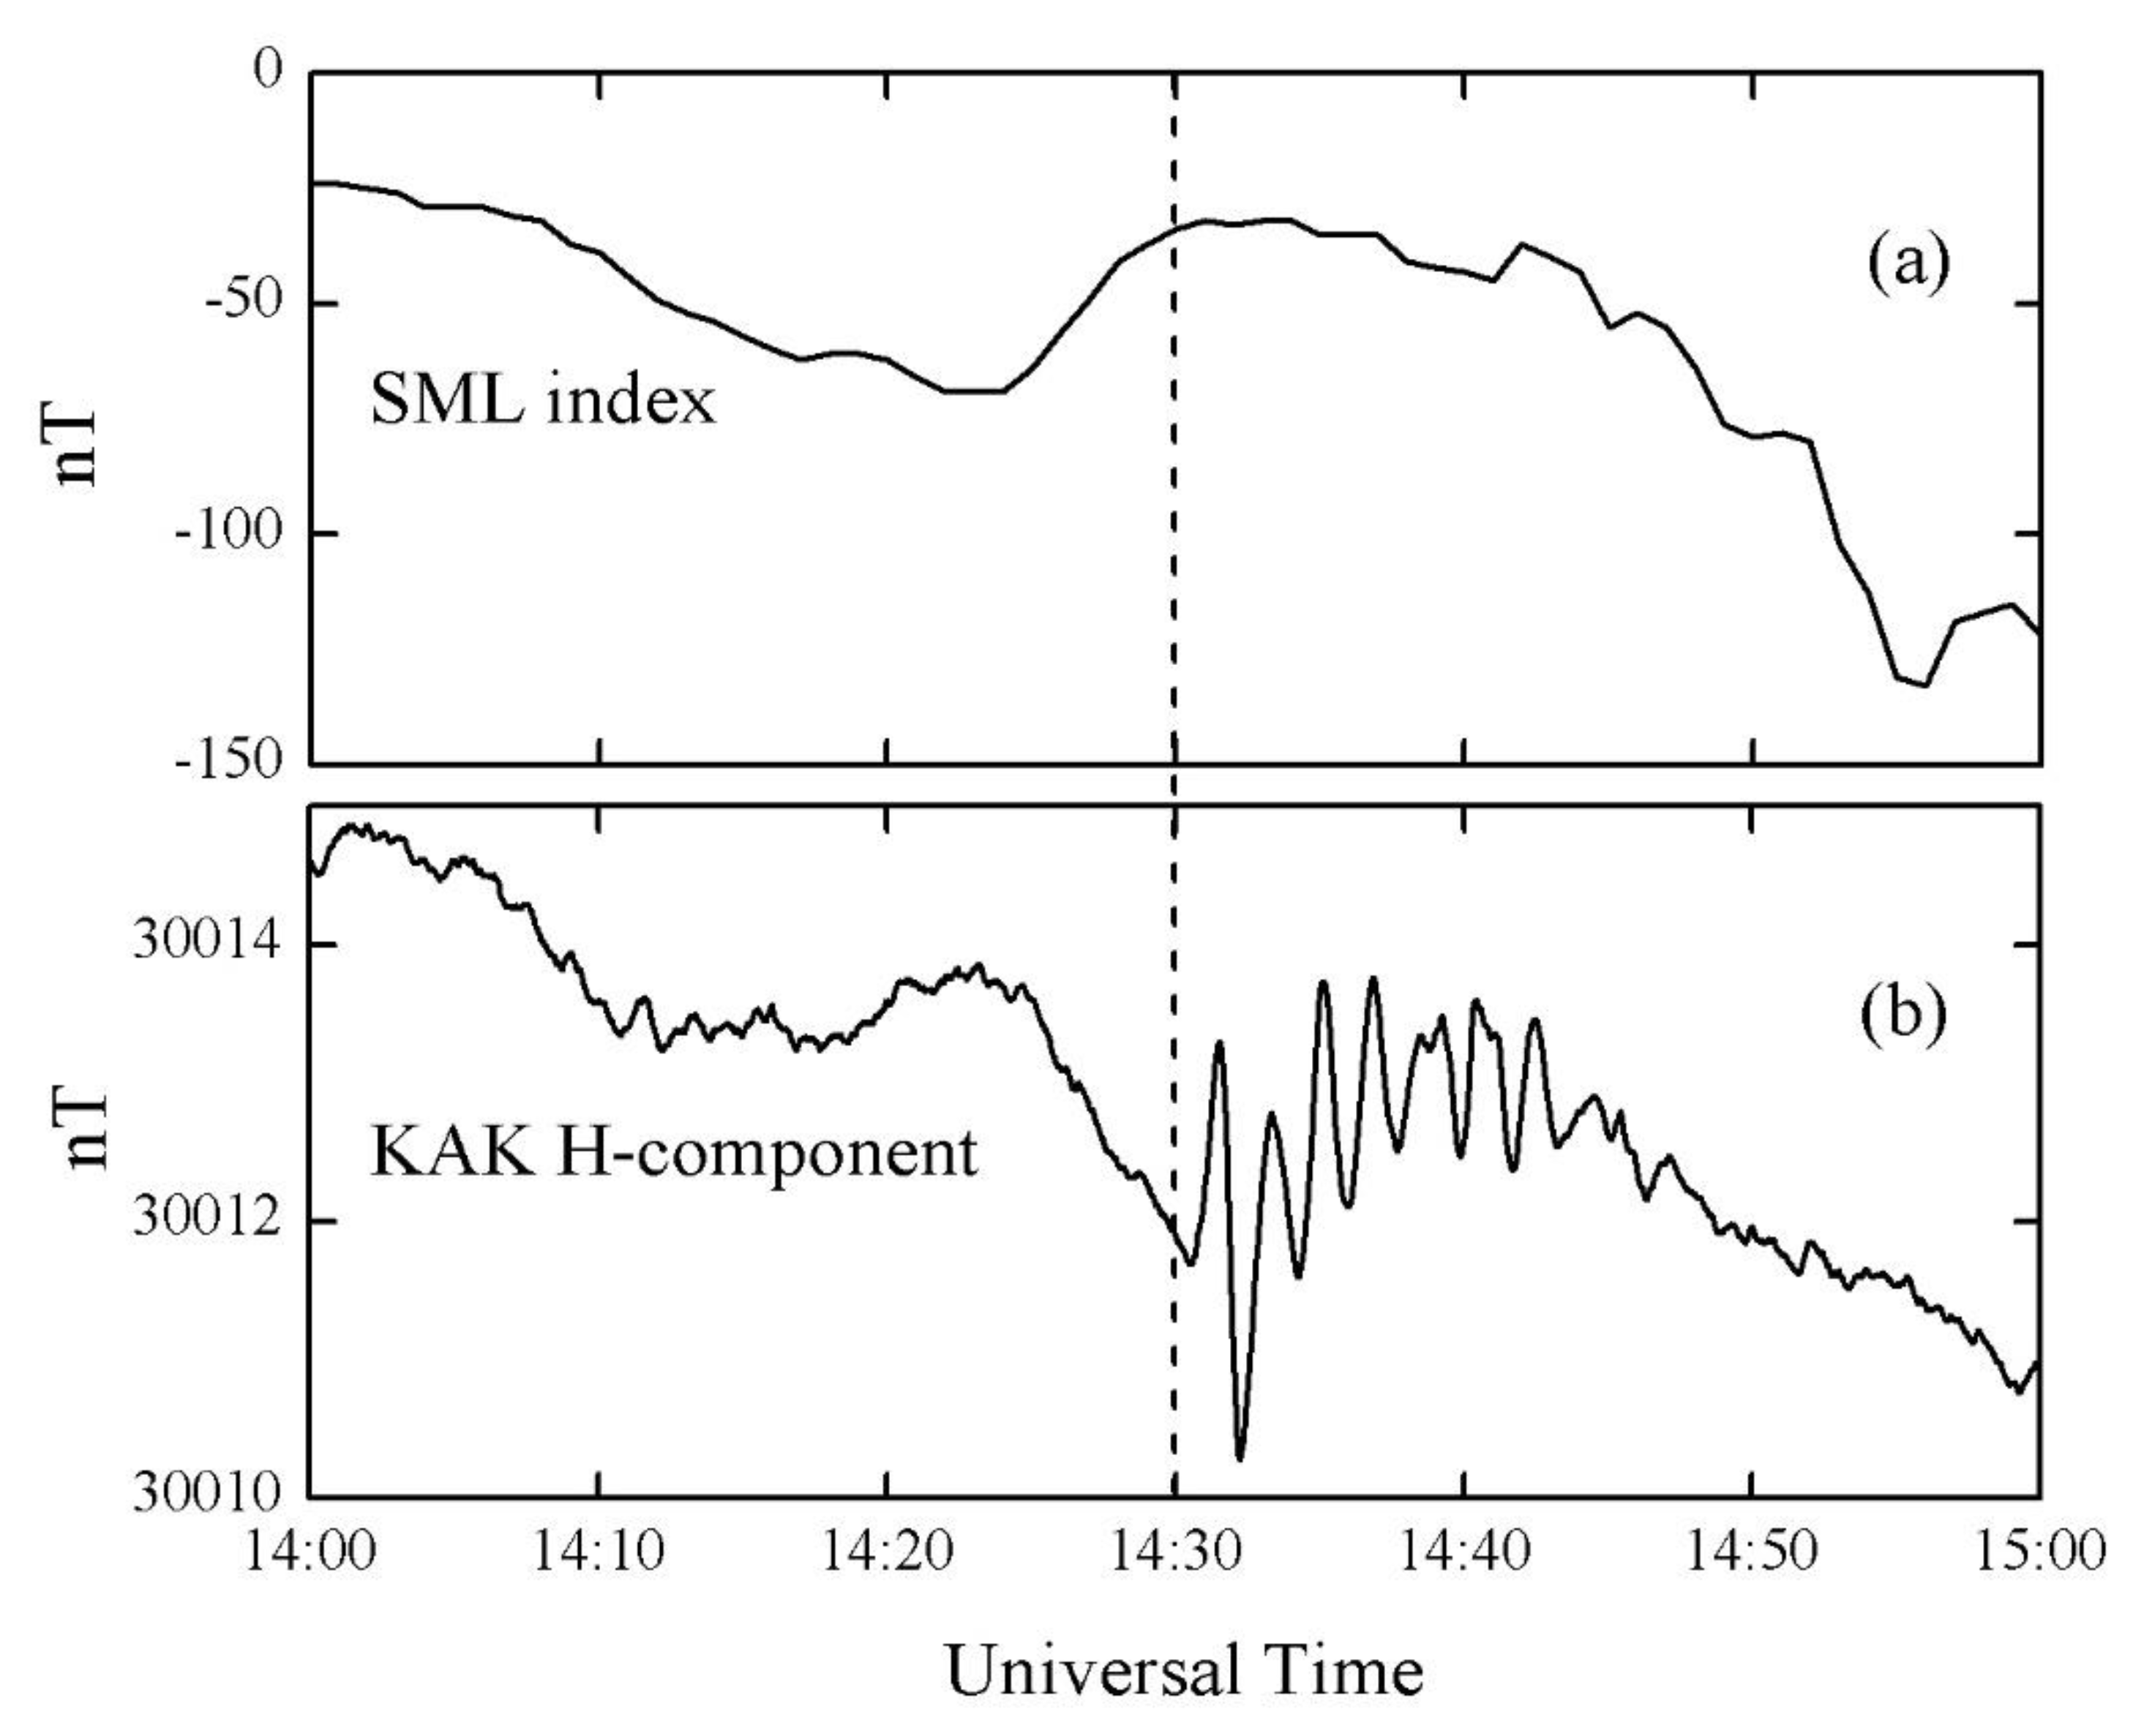
2.4. Supermag Auroral Electrojet Index (SML)

We used 1 min data from the SML index to identify the onset of the substorm. The SML index is the equivalent of the AL index as identified from SuperMAG derived auroral electrojet indices. SuperMAG is a worldwide collaboration of organizations, and the derived indices are determined from approximately 110 stations. The authors of [33,34] described the substorm identification technique.

3. Observations

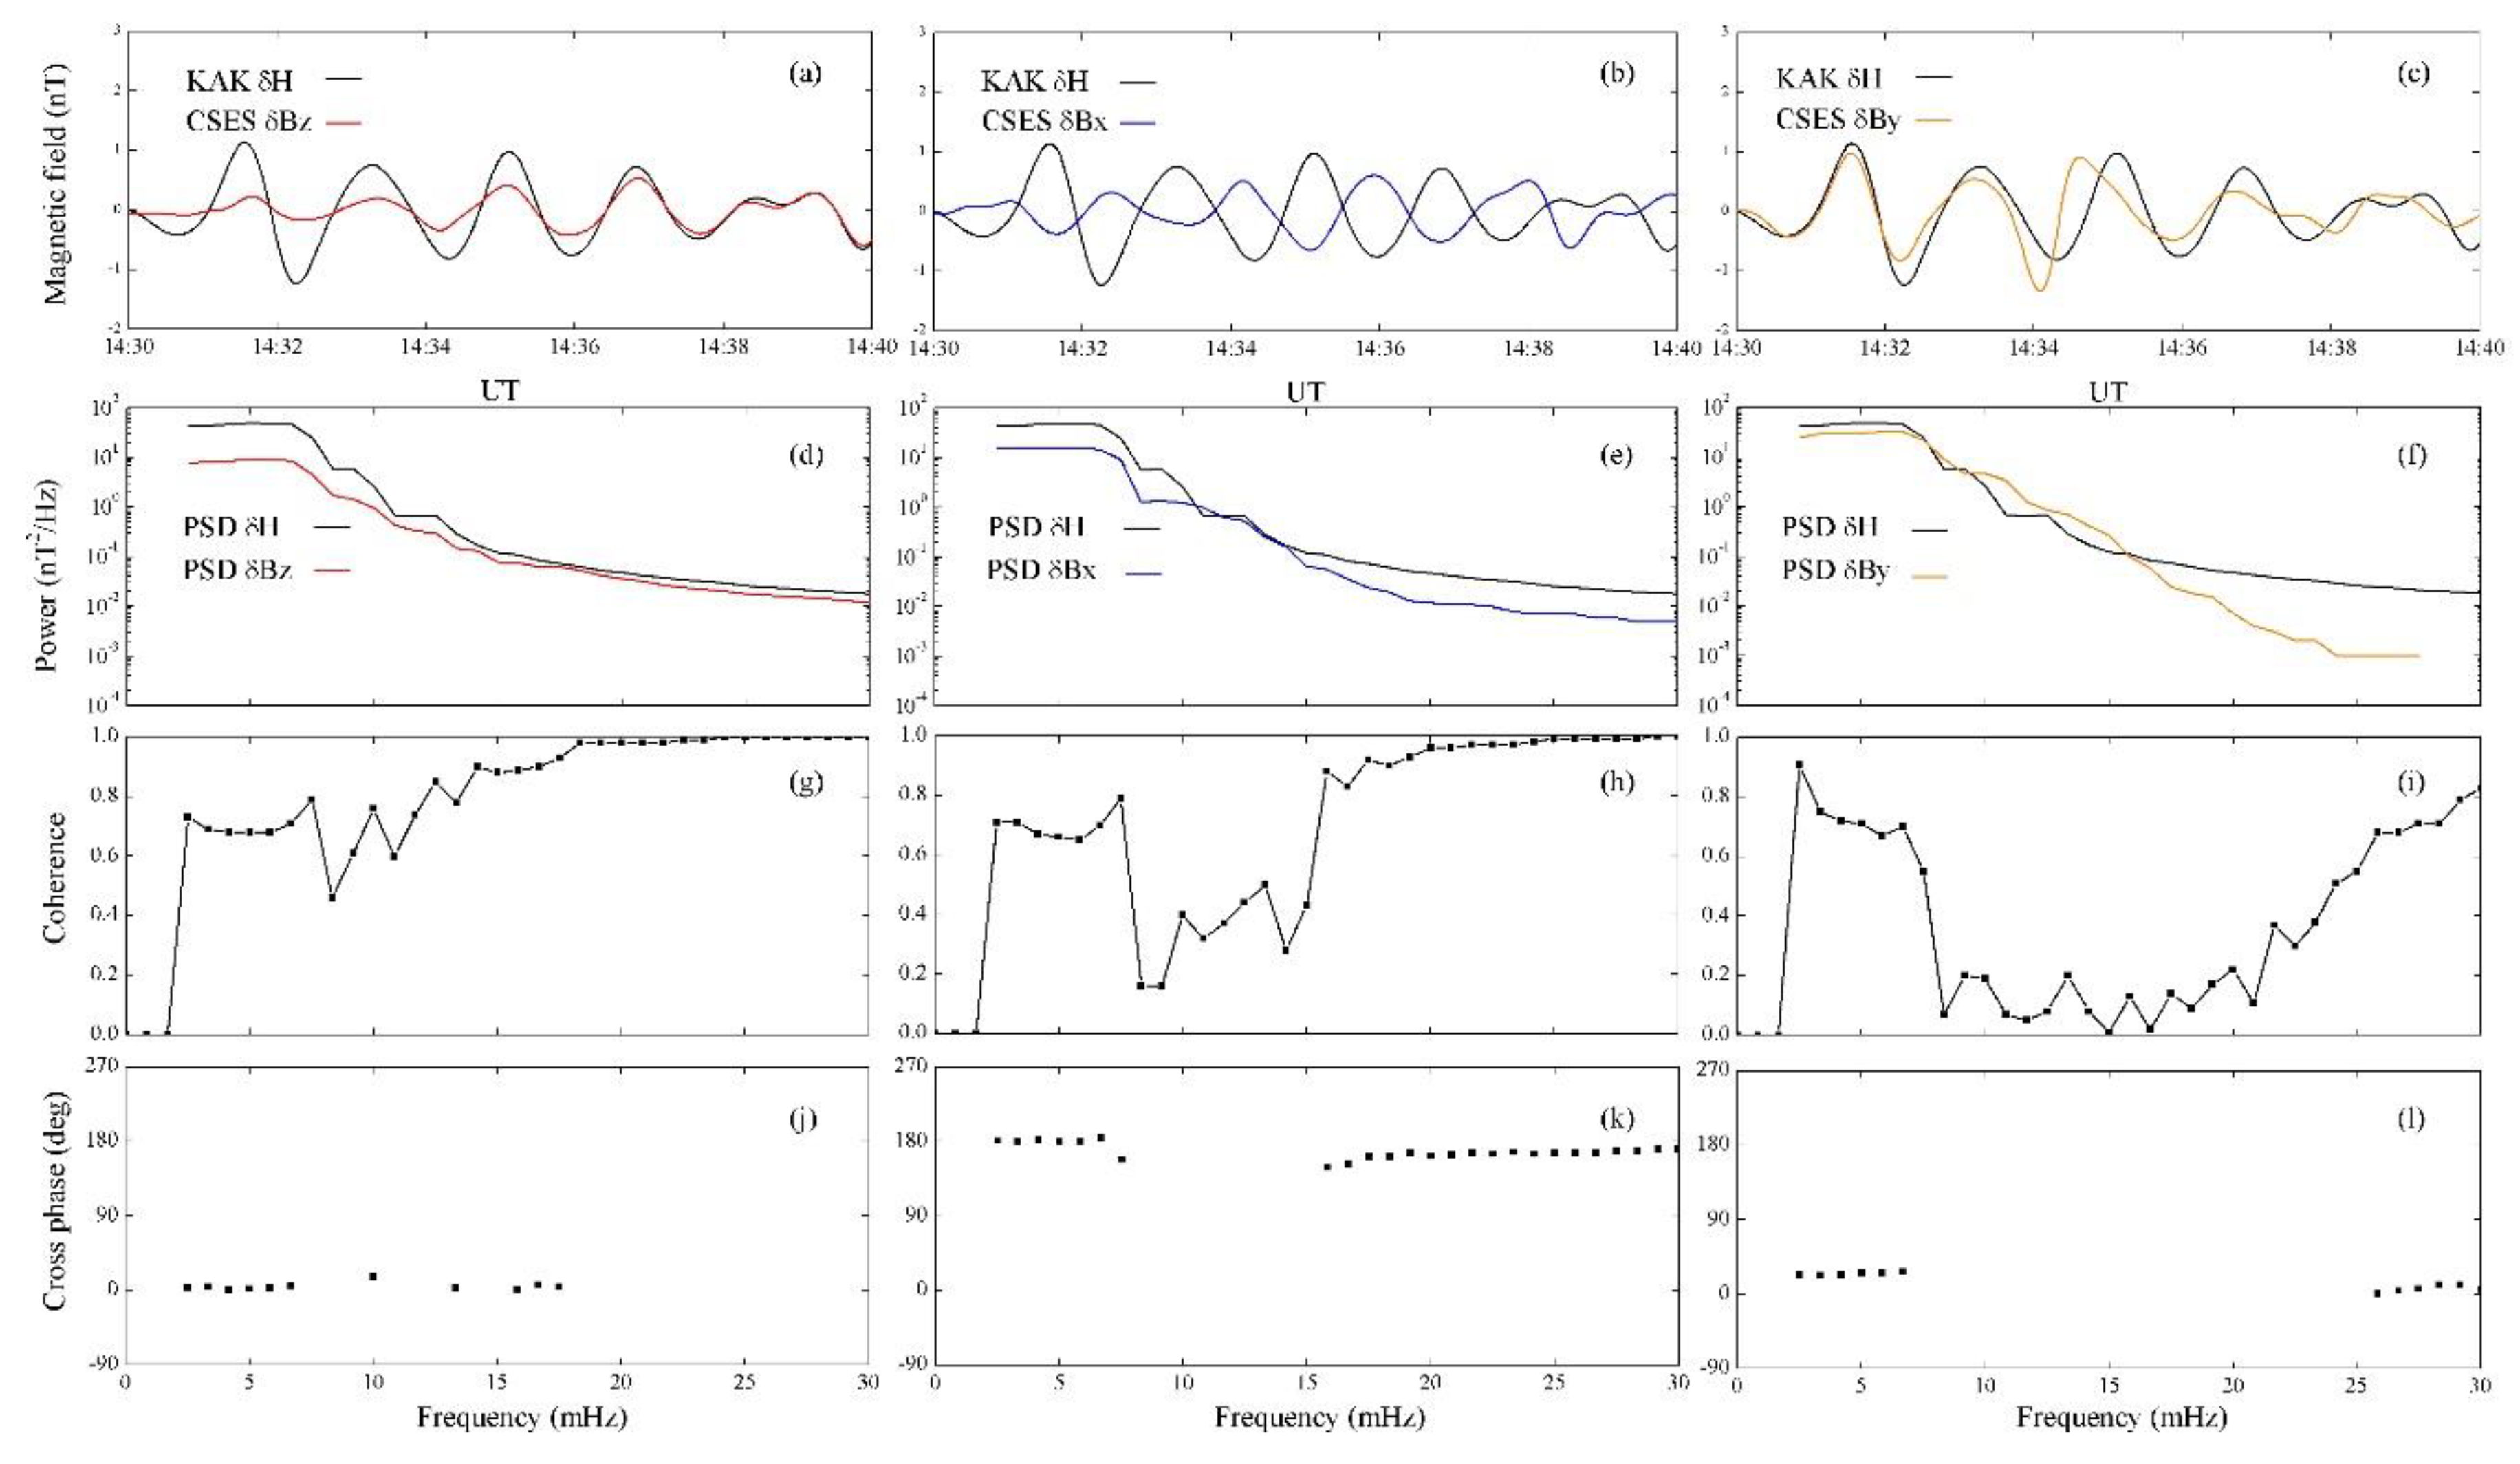
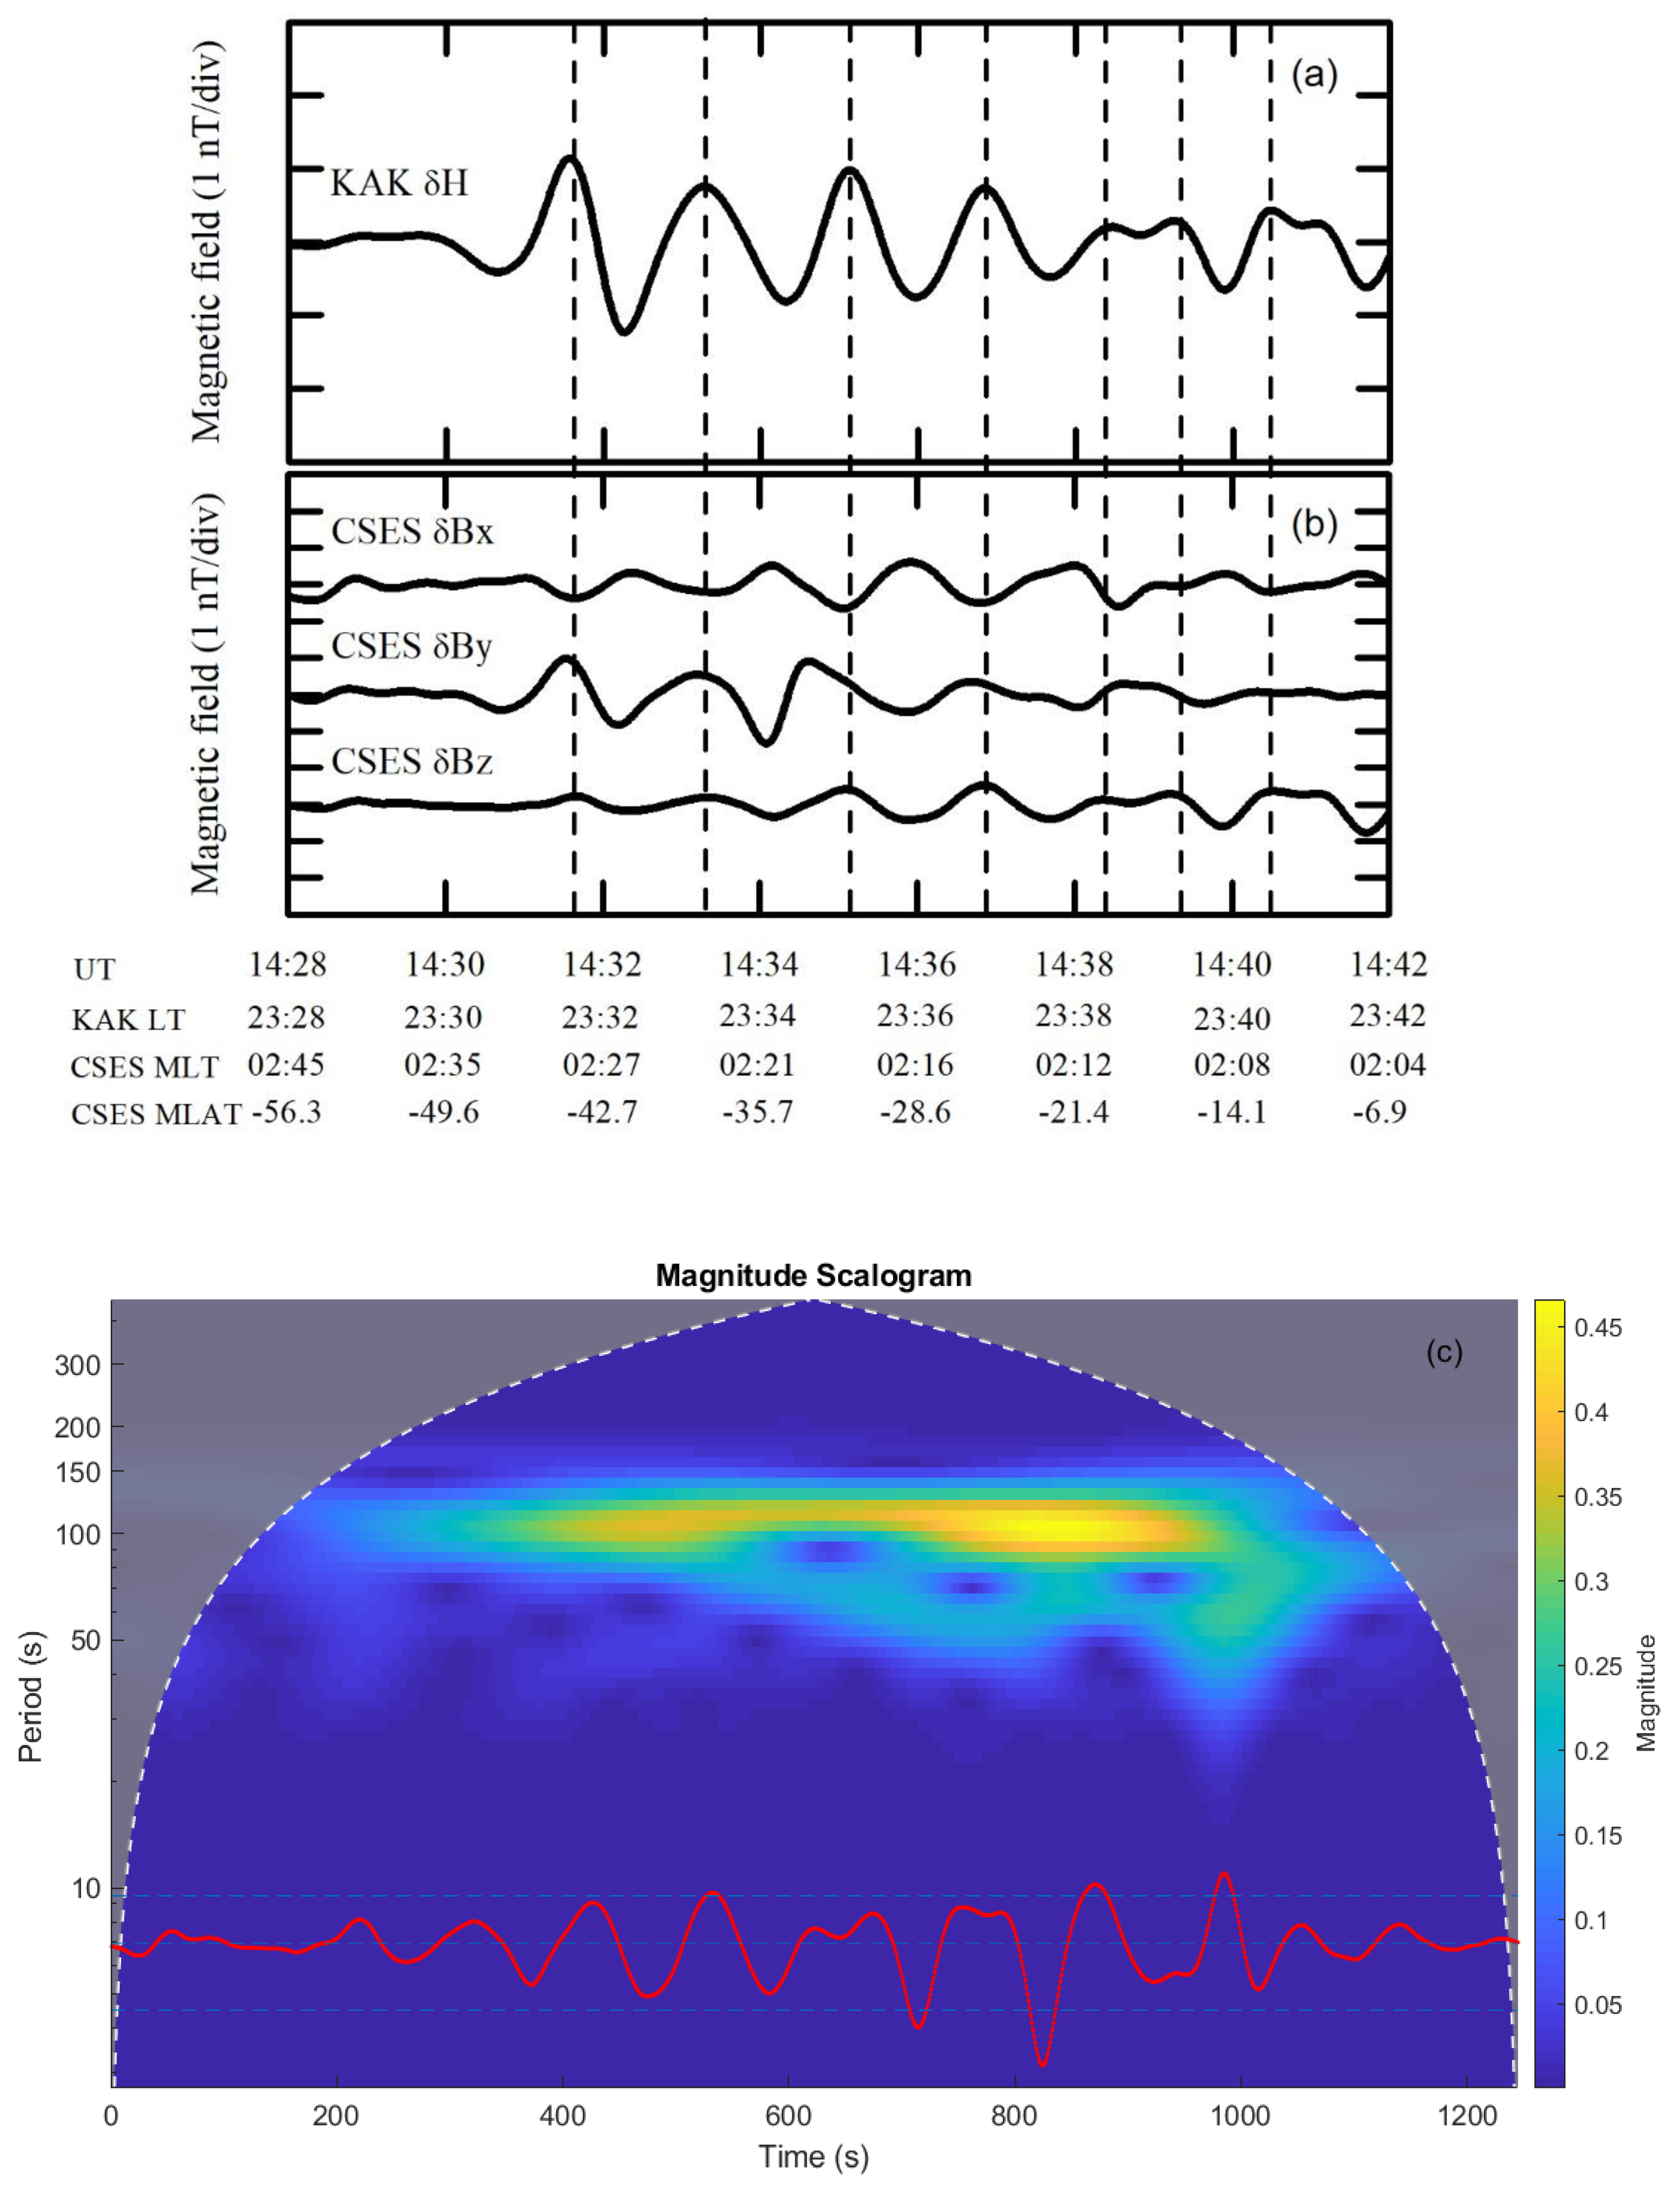
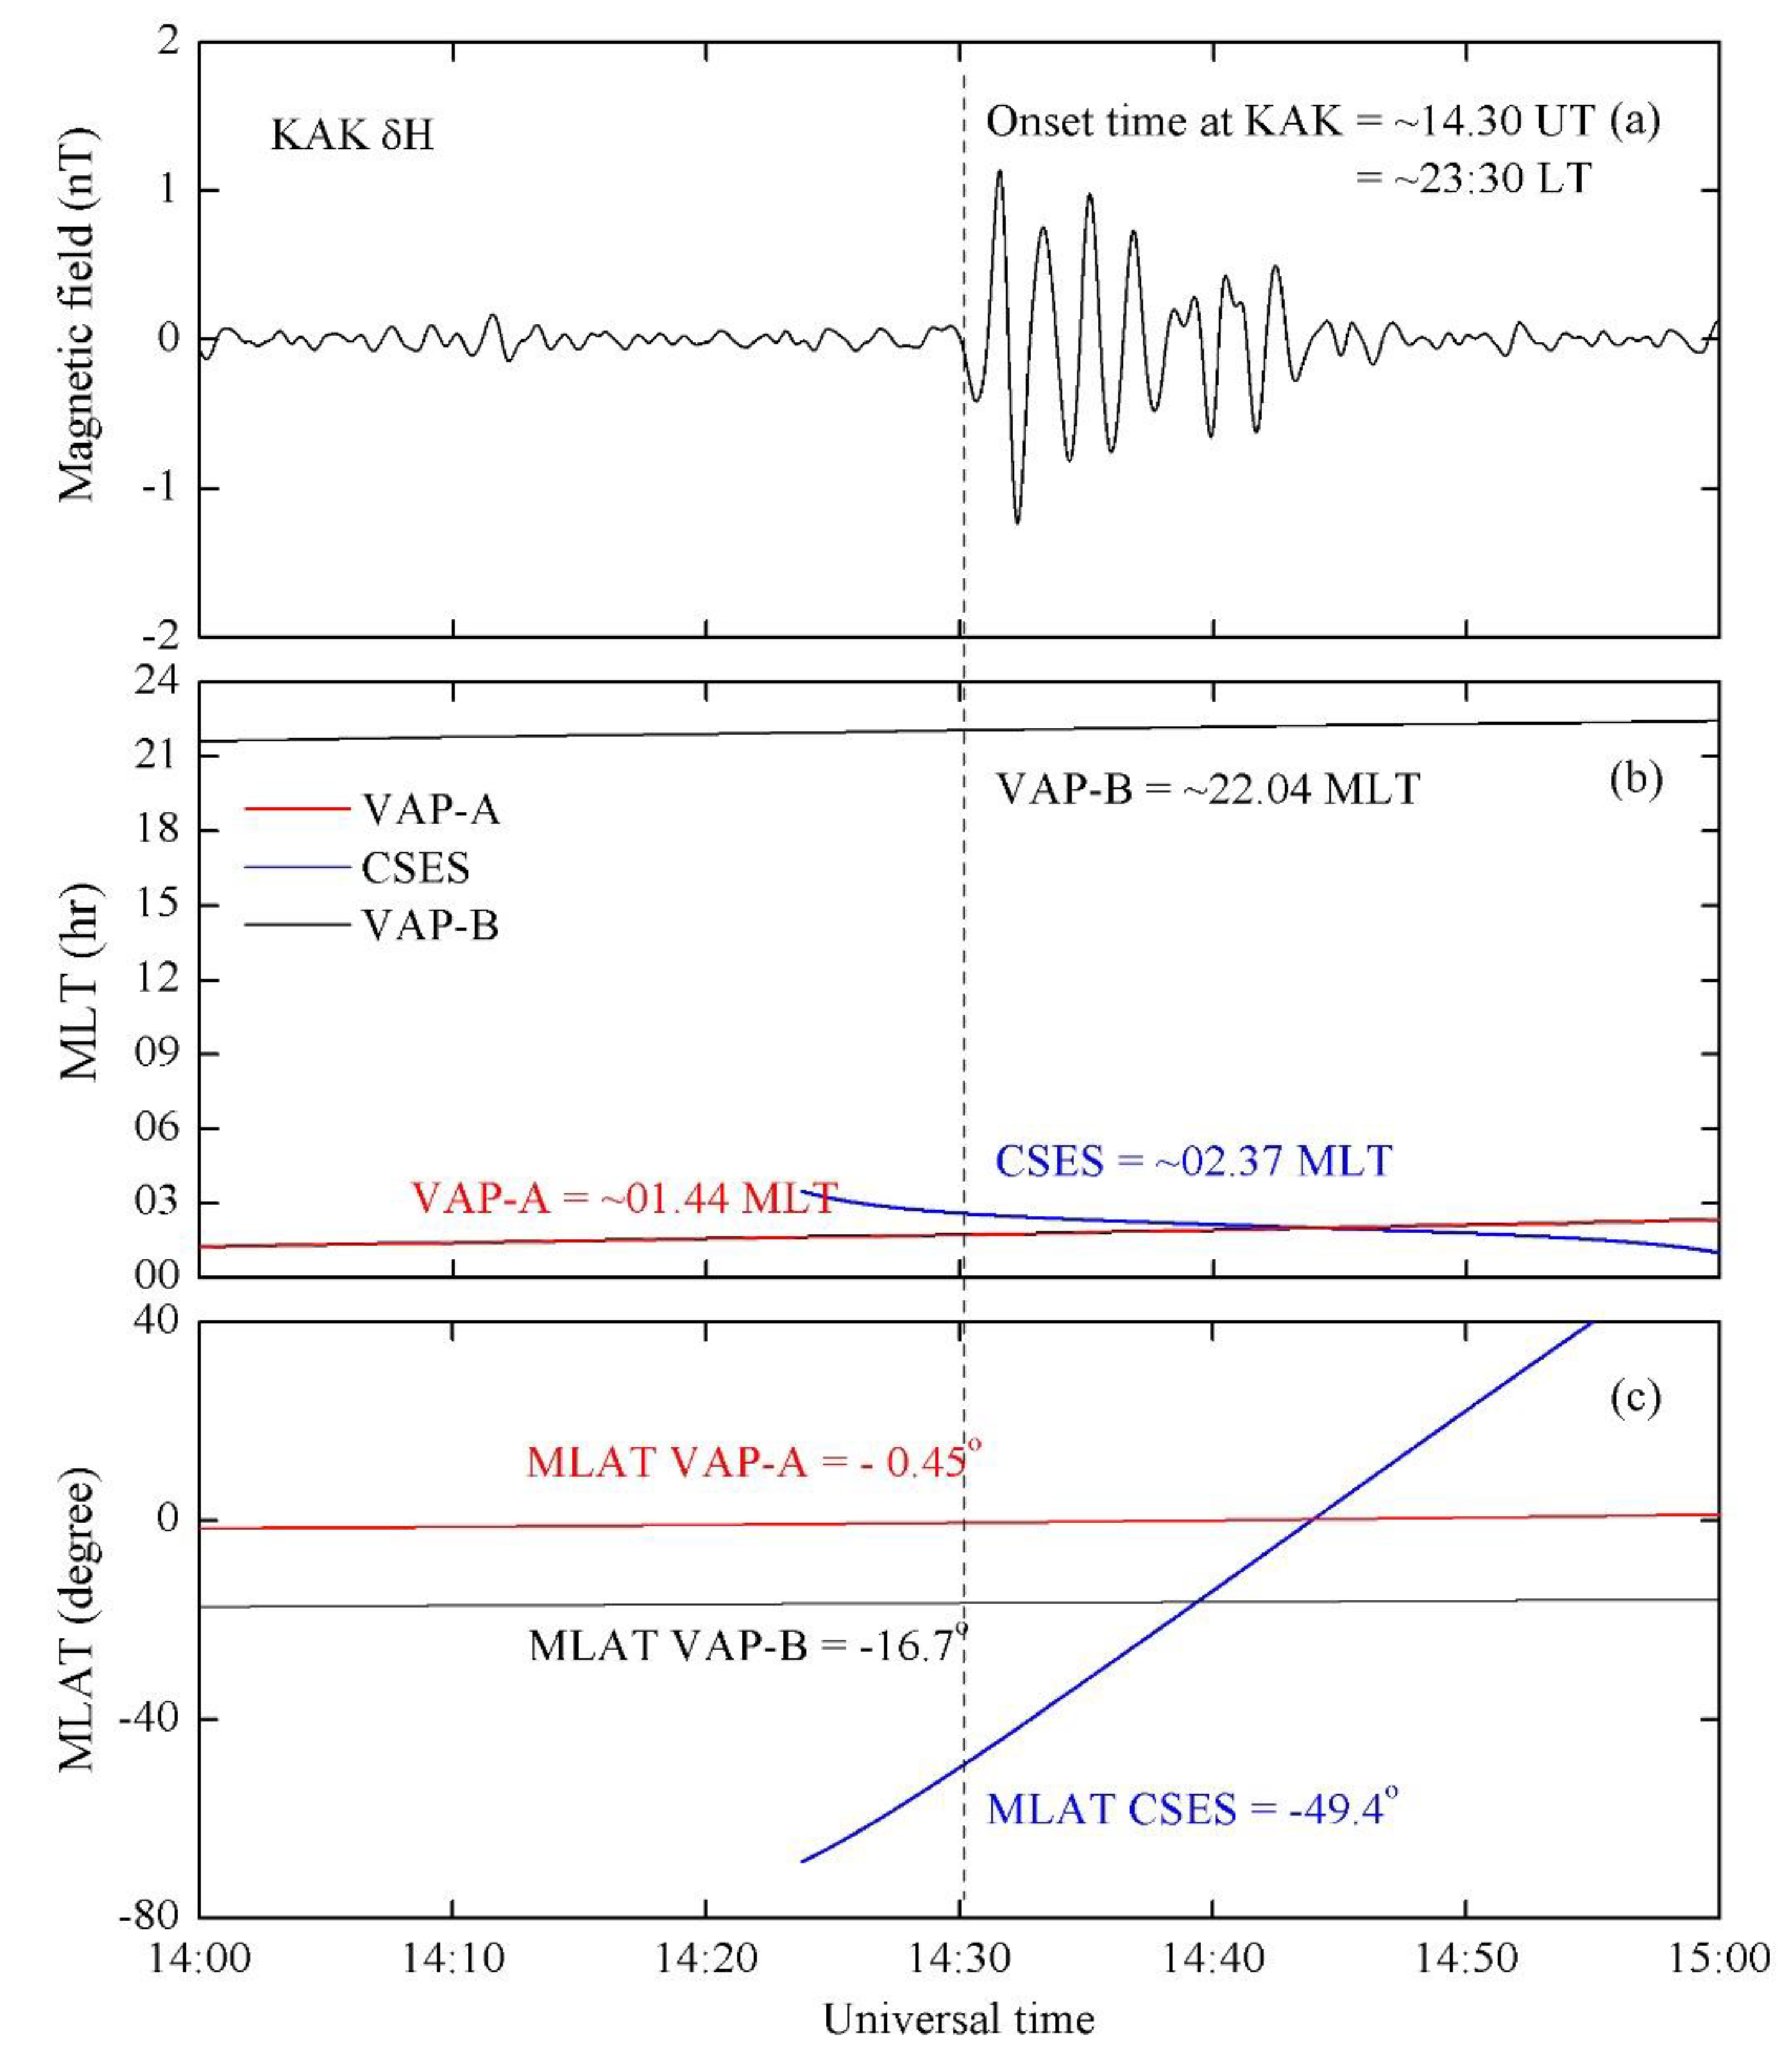
3.1. Pi2 Event at KAK and CSES

Figure 1a shows the geomagnetic activity, represented by the SuperMag auroral electrojet SML index, and Figure 1b shows the low-latitude magnetic field variations (H component) observed by the KAK station in Japan.
The Pi2 pulsation occurred from 14:30 to 14:44 universal time (UT) on 3 September 2018, where the KAK was in the premidnight (23:30 LT). During the time interval 14:30–14:40 UT, which was subjected to detailed waveform analysis, the CSES satellite was in the southern hemisphere, moving from −49.4° to −6° magnetic latitude (MLAT). At that time, CSES was orbiting in the postmidnight at 02:37 magnetic local time (MLT). Both the KAK observatory and the CSES spacecraft were near and within 2.5 h of local time from each other. The magnetic data from the simultaneous availability of CSES and KAK give an opportunity to study, for the first time, the amplitude and phase of the Pi2 pulsation in the ionospheric magnetic field fluctuations at the CSES altitude. We examine the relationship between the Pi2 magnetic oscillation in the topside ionosphere and the Pi2 pulsations at a low-latitude region on the ground.
Figure 2a shows the time series of KAK δH while Figure 2b shows the δBx, δBy, and δBz oscillations observed at the CSES satellite. The zero-phase band pass filter (6.6–25 mHz) time series demonstrates that the Pi2 oscillates in all three components at the CSES satellite. The vertical dashed lines point out the crests of the δH component. Figure 2c shows the magnitude scalogram of the compressional component of the CSES.
First, we note that the KAK δH displayed seven cycles of a quasiperiodic fluctuation starting at 14:30 UT. CSES sees the same seven cycles in all magnetic field components. The waveform of the magnetic field in δH at KAK is very similar to δBz at CSES without significant phase delay; however, the amplitude of KAK is larger than δBz by a factor of ∼3. This identical waveform reordered both at the ground and in the ionosphere indicates that these oscillations are caused by a common source mechanism. At CSES, δBz and δBx oscillate exactly in phase for the entire Pi2 interval and their amplitudes are similar. The fluctuations in CSES δBy and their waveform/period seem to match δH with small phase delay.
To confirm the similarity between KAK on the ground and CSES in the topside ionosphere, spectral dissection in the frequency domain was performed. Figure 3 shows the time series and spectral properties of Pi2 observed by KAK and CSES during the 10 min interval of 14:30–14:40 UT. Note that when the coherence was higher than 0.6, then the cross phase was plotted.
As expected from Figure 2, the spectral dissection for the δH and δBz components (Figure 3d) shows a dominant spectral enhancement centered at around 6.5–7.5 mHz with a similar spectral shape, but the δBz power spectrum is smaller than that of δH. The δBz–δH coherence (Figure 3g) is more than 0.6, and the cross phase is near to 0° (Figure 3j).
The δBx spectral dissection (Figure 3e) also points out an enhancement at ∼6.5 mHz, and the intended δBx−δH coherence (Figure 3h), estimated for 10 minutes, is more than 0.6 with a phase delay of 180° (Figure 3k). Figure 3f shows that the power spectrum of δBy is similar to that of δBz near 6.5 mHz, and the δBy power is quite similar to the δH power. The δBy−δH calculated coherence (Figure 3i) shows a higher spectrum than 0.6 at ∼6–7.5 mHz, but quickly reduces to less than 0.2 at frequencies of ∼8–25 mHz.

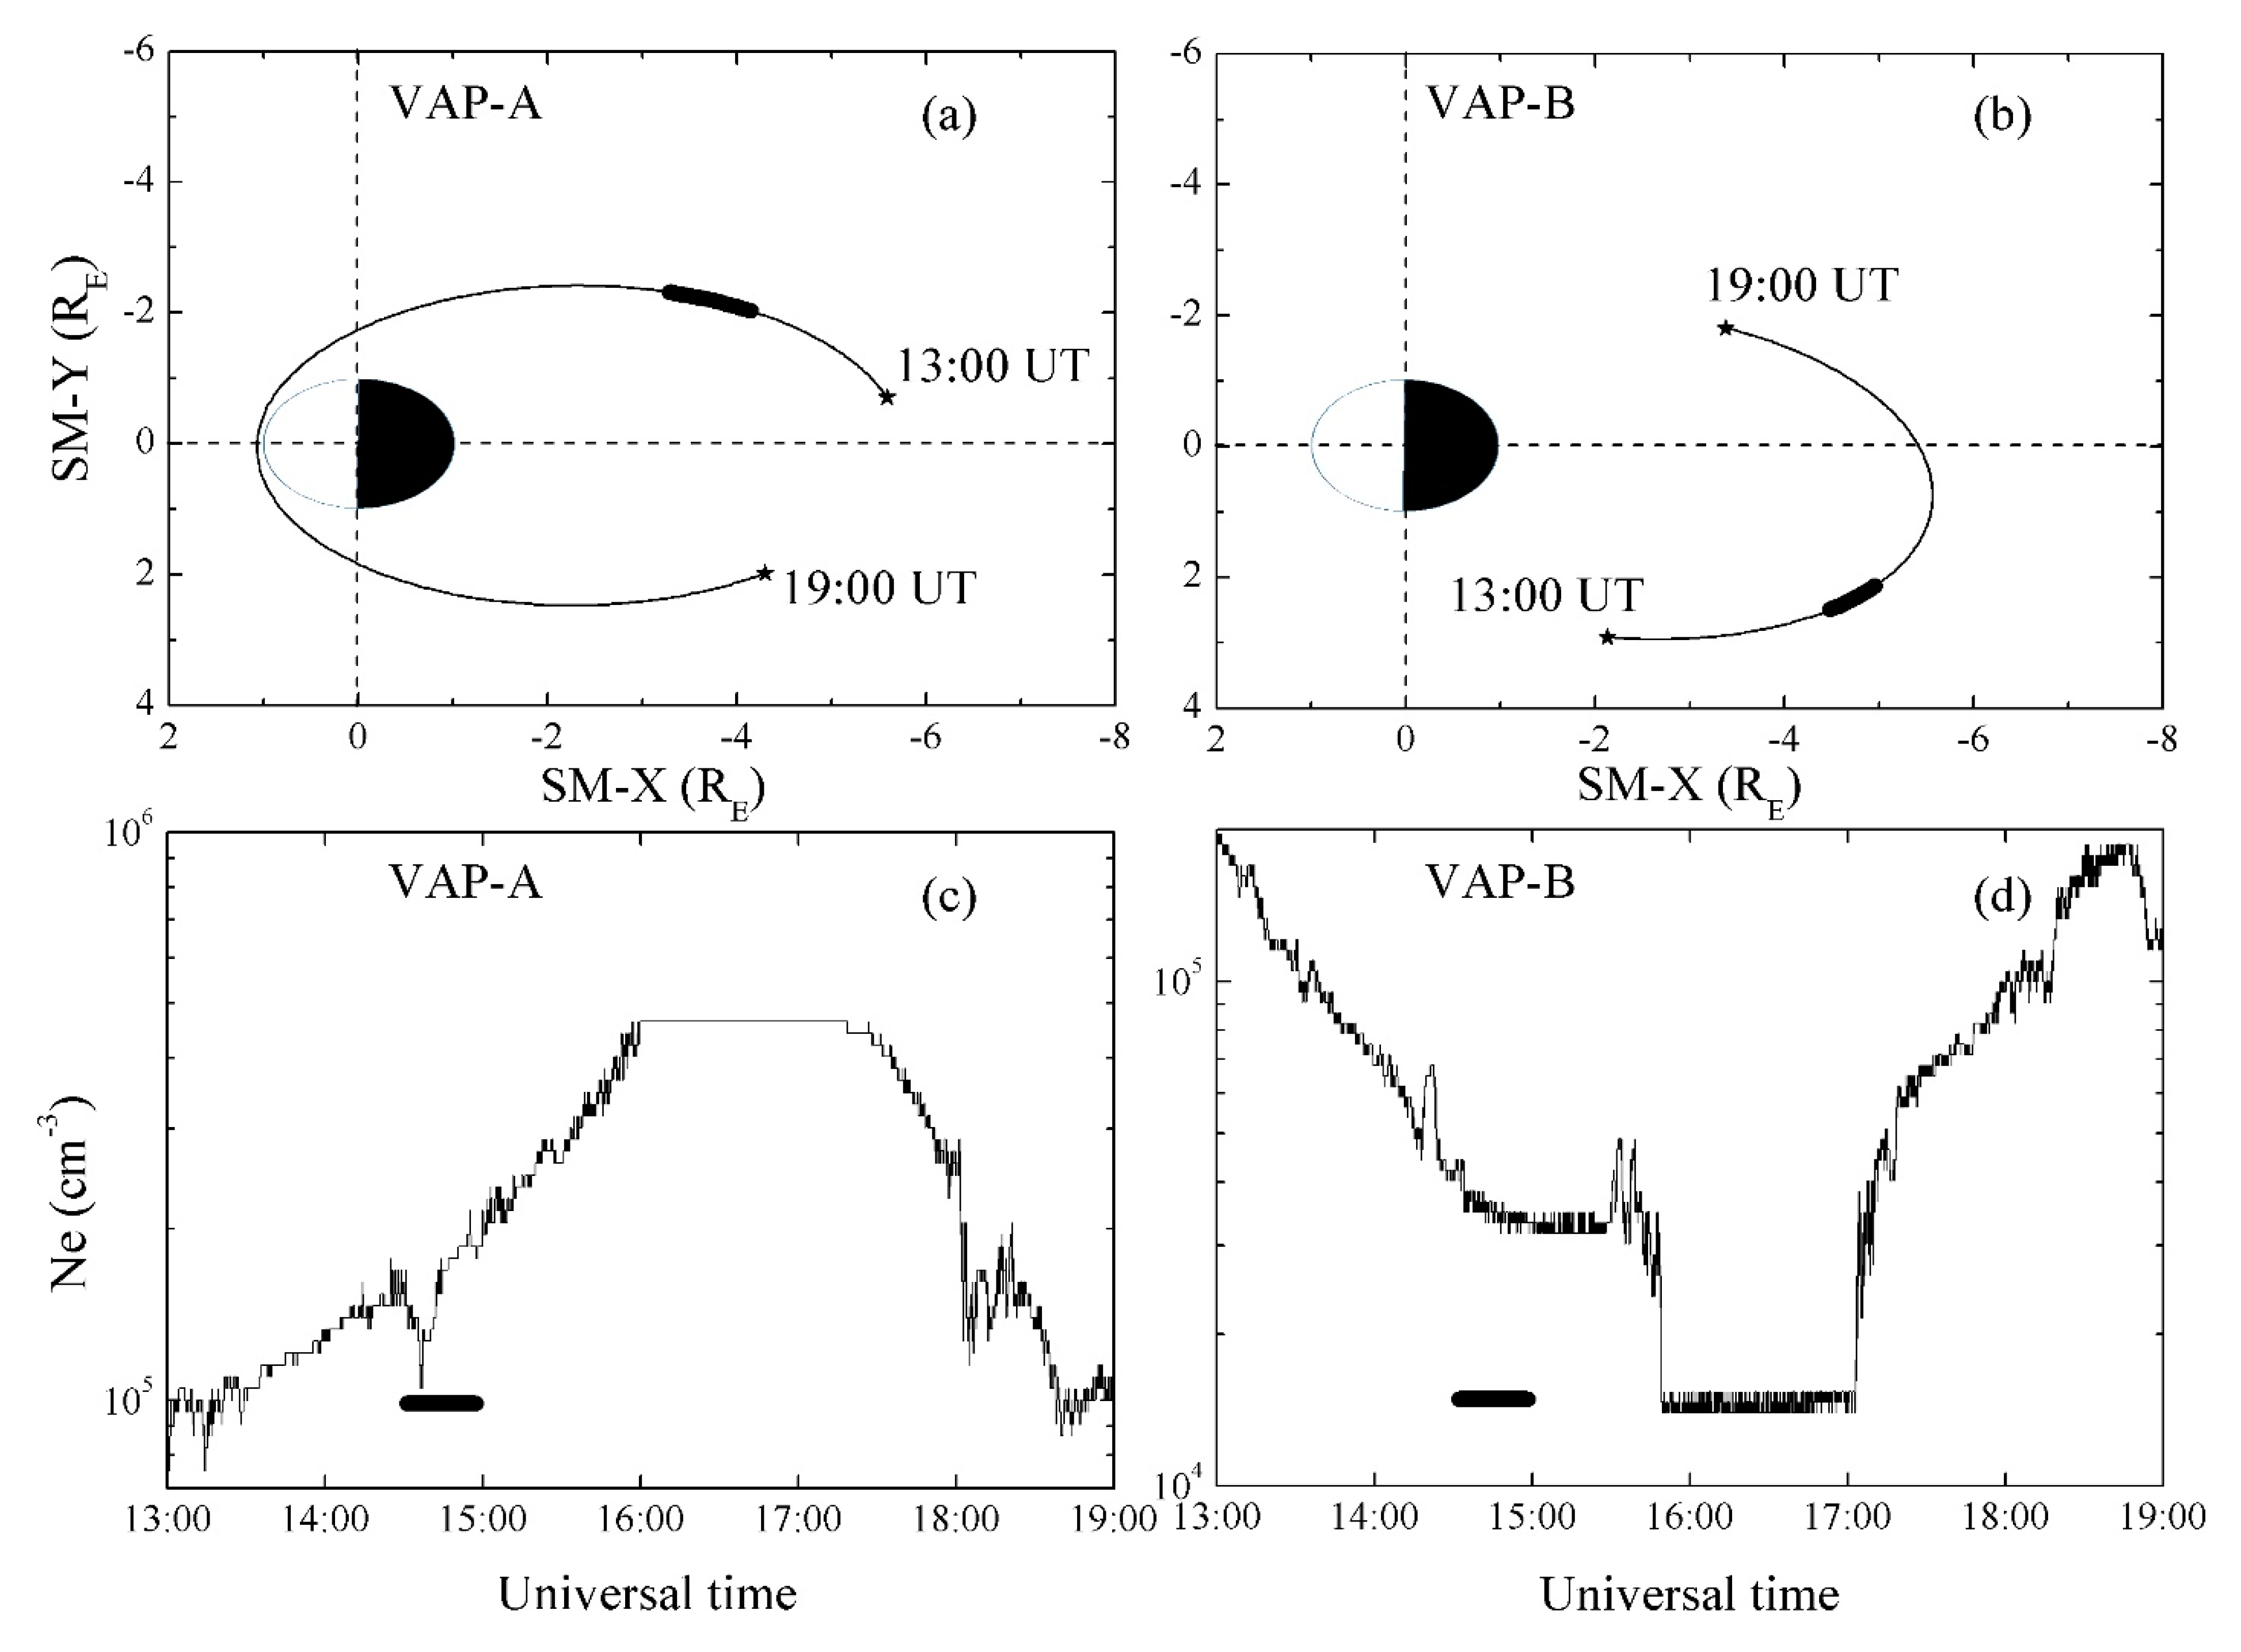
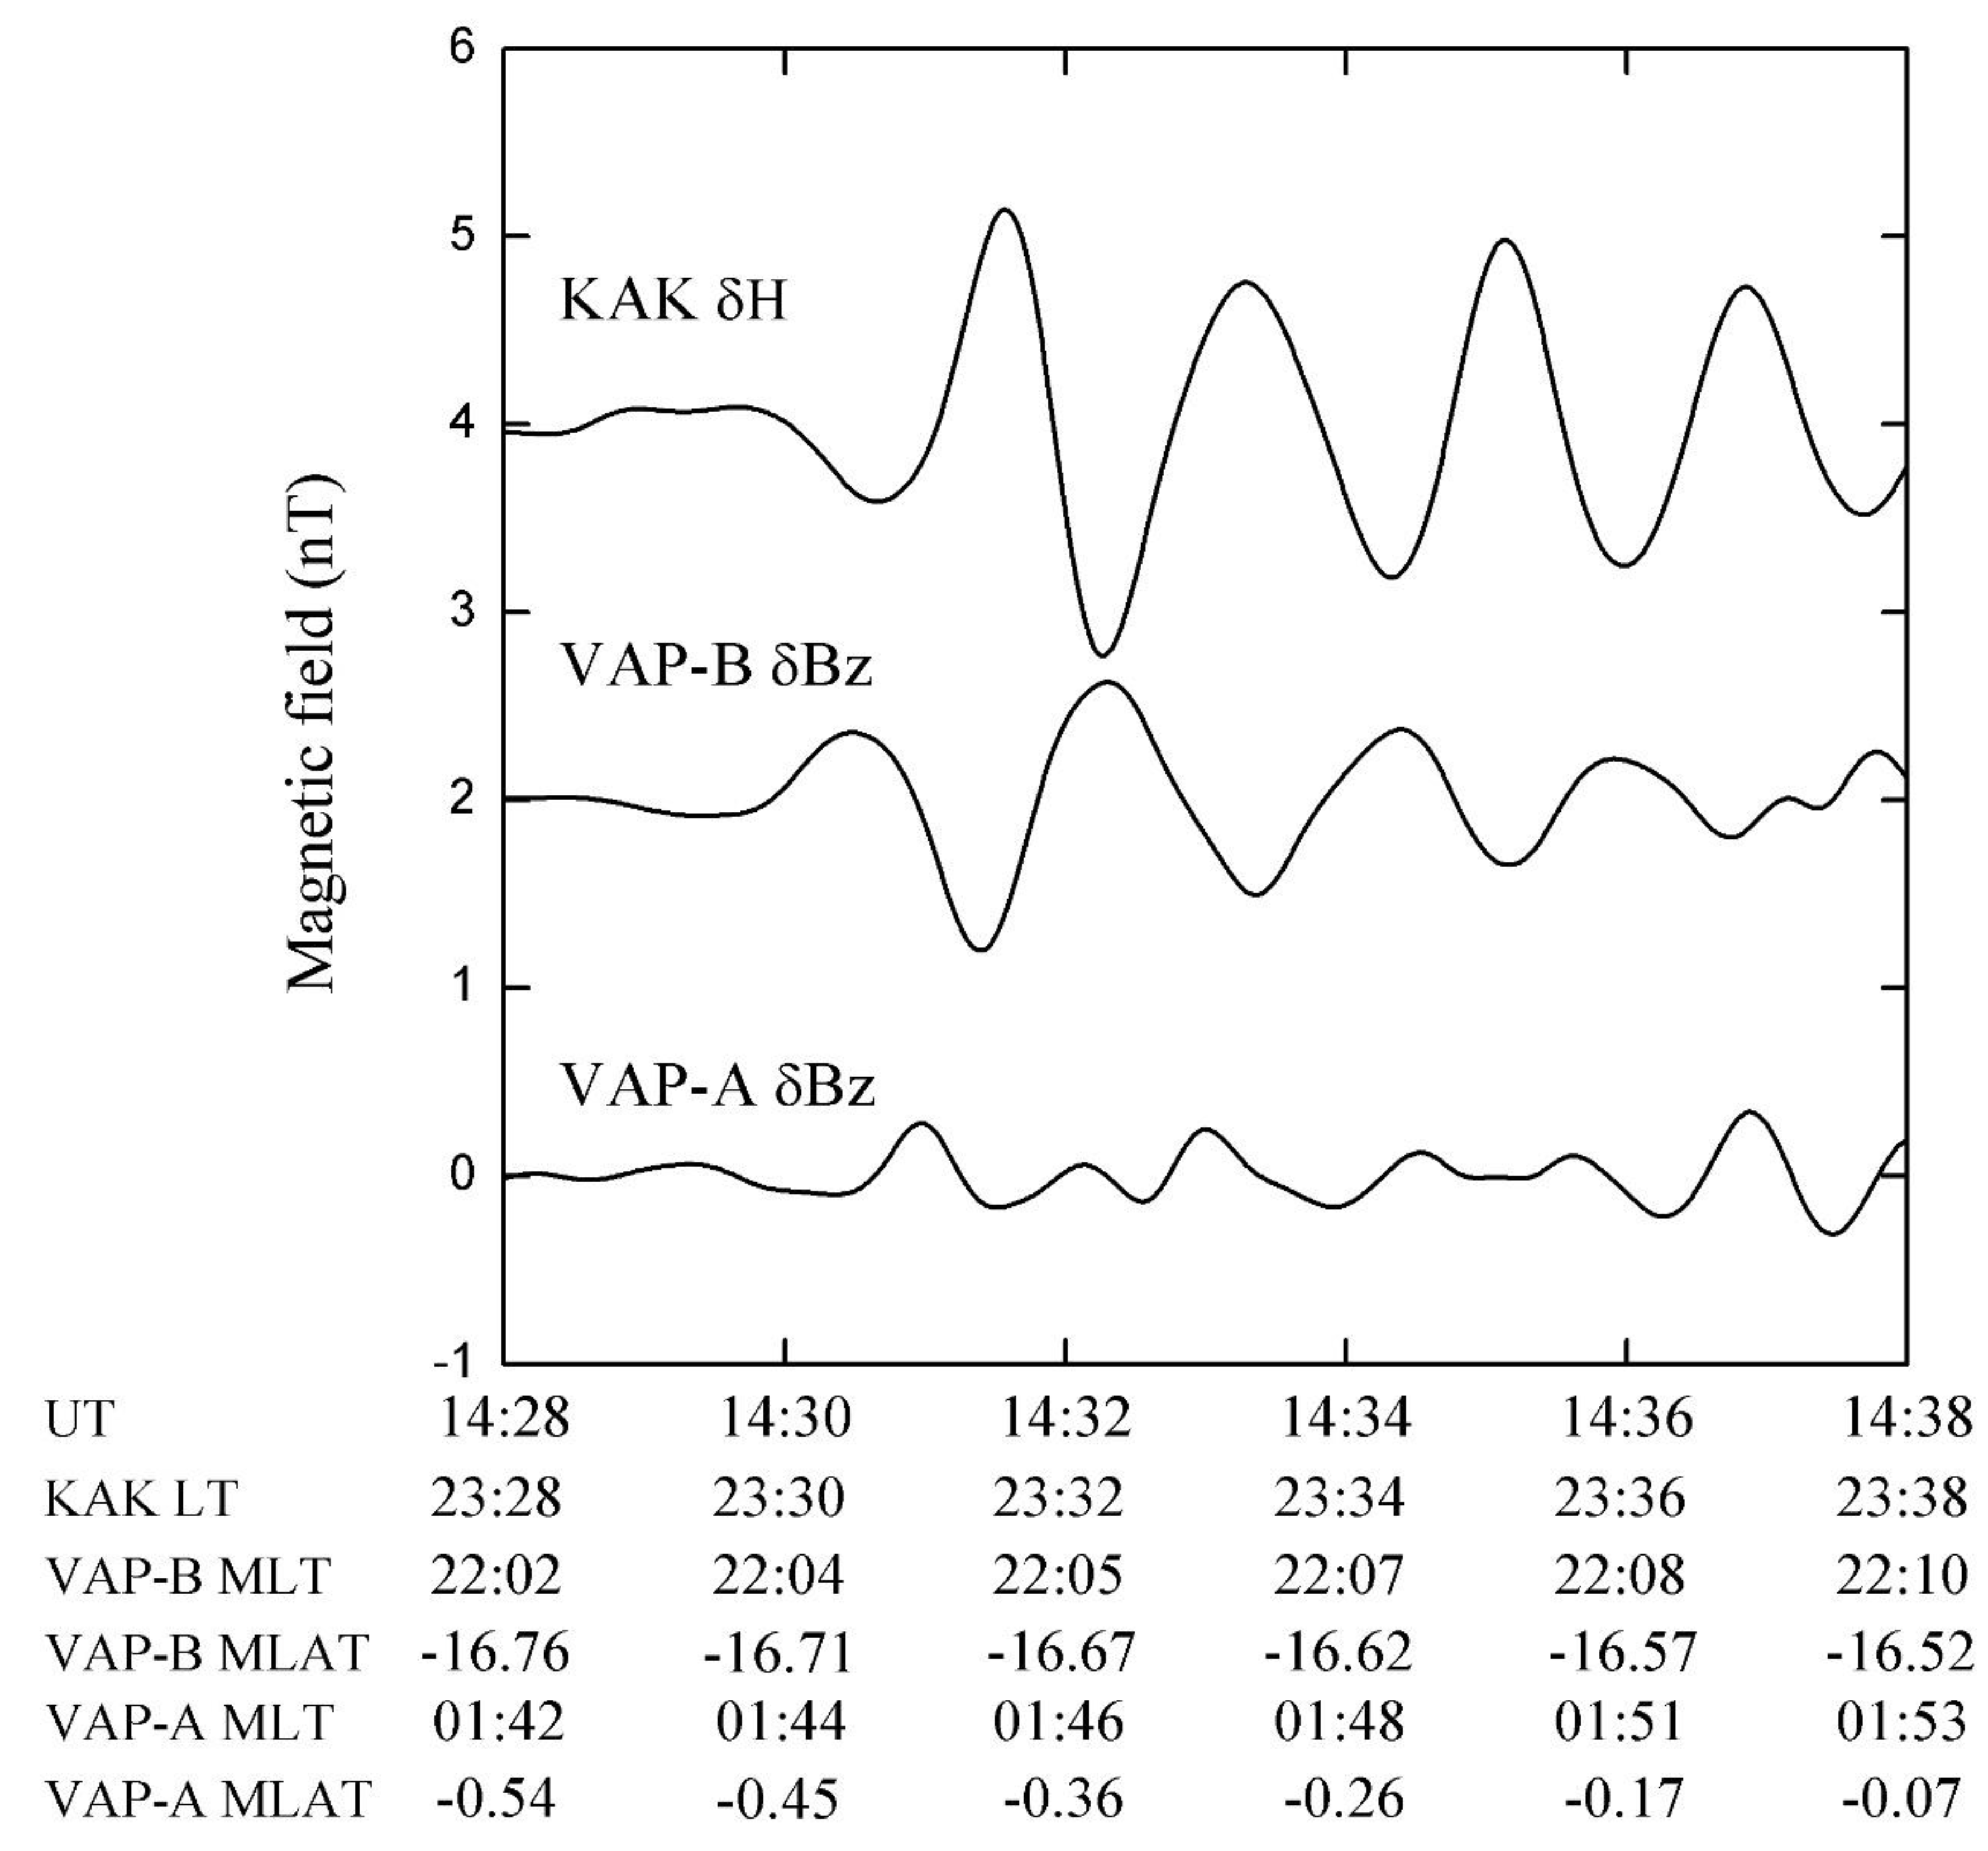
3.2. VAP Observations

Here we will examine the Pi2 event using data from the VAP magnetospheric mission. During the time interval of the Pi2 pulsation (14:30–14:40 UT), VAP-A and VAP-B satellites were located in the night side (01:49 and 22:06 MLT, respectively). The radial distances at the onset of the substorm were 4.62 RE and 5.35 RE for VAP-A and VAP-B, respectively. Both the VAP-A and VAP-B orbits were visualized onto the solar magnetic x-y plane for the 6 h intervals, and they are shown in Figure 4a,b, respectively. To examine if both satellites are inside or outside the plasmasphere, we checked the electron number density (Ne). Figure 4c,d show the Ne as being calculated from the frequency of the upper hybrid waves identified by the VAP-A and VAP-B satellites from 13:00 UT to 19:00 UT.
At the onset time of the Pi2, VAP-A was near the inner edge of the plasmapause. Thus, the Pi2 event occurred when VAP-A was inside the plasmasphere. VAP-B was at first in the plasmasphere from 13:00 UT to ∼15:50 UT, and after that it ran across a severe Ne decrease from ∼15 cm−3 to ∼2 cm−3 at L = ∼6.2 before midnight (∼23:00 MLT). This decrease in density is attributed to an outbound plasmapause crossing. VAP-B ran across an abrupt Ne increase from ∼2 cm−3 to ∼13 cm−3, which is due to an inbound plasmapause crossing, at about 17:03 UT (L = ∼5.9 and MLT = 23:55). From this Ne information, we can emphasize that VAP-B was inside the plasmasphere when the Pi2 pulsation was observed at the ground station.
Figure 5a–c show the Pi2 pulsations at KAK δH and the places of CSES, VAP-A, and VAP-B in a dipole-based coordinate system (MLAT and MLT) during 14:00–15:00 UT. We indicate the onset time of the Pi2 pulsations by the vertical dashed line as identified from a visual check of the KAK δH.
Figure 6 displays the comparison of Pi2 pulsations detected at the δH component at KAK and the compressional δBz component at both the VAP-A and VAP-B satellites. The event UT, MLAT, and MLT are indicated at the bottom. It is clear that there are perturbations in VAP-B δBz, but their waveforms do not match δH with a small phase delay. On the other hand, VAP-A does not exhibit Pi2 oscillation, likely because VAP-A is close to the magnetic equator (~−0.5 MLAT). Therefore, we will focus on the Pi2 wave detected by VAP-B.
To check the correspondence between the Pi2 perturbations as observed by KAK, CSES, and VAP-B, we calculated the coherence, cross phase between KAK δH, the CSES δBz, and the VAP-B δBz during the time interval 14:30–14:40 UT. Figure 7 and Figure 8 reveal the comparison of the time series and spectral characteristics of both KAK δH/VAP-B δBz and CSES δBz/VAP-B δBz, respectively. In Figure 7 and Figure 8, we noticed that δBz components of VAP-B present oscillations that have a waveform similar to those of KAK and CSES with a time delay of ~90 s. The oscillations in the δBz component were in phase. The calculated high-coherence spectral numbers of δBz between CSES and VAP-B and KAK δH and VAP-B δBz are quite similar. Figure 7 and Figure 8 confirm that the VAP-B and CSES Pi2s in the δBz have quite a similar spectrum at ~7.5 mHz as that of the KAK δH component on the ground.

4. Discussion

This paper reports, for the first time, the observation of a Pi2 event from the CSES satellite in the topside ionosphere. In previous studies and observations [35,36,37], the 3-D fluctuation current system of SCWs have been investigated. The authors of [38] reported the distribution of the two-dimensional (2-D) substorm system structure using AMPERE satellite data. According to [10,39], the first deflection in a Pi2 wave could be a proxy for the signature of the substorm current wedge, and the Pi2 wave displays deflections at the sub-storm onset [40]. This Pi2 pulsation initial deflection could be the signature of the onset time of the substorm current wedge [29].
The oscillations of the KAK δH in a low latitude and the δBy component in the topside ionosphere are in agreement with the SCW model, but at the same time, the δBy component displayed some phase shifts exhibited after the Pi2 onset (see Figure 2b). On the other hand, a 90 s phase shift during the Pi2 event is shown between the δBz component oscillations at VAP-B in the plasmasphere with both the δBz component at CSES and at the KAK δH (see Figure 7 and Figure 8). As shown in Figure 3, Figure 7 and Figure 8, the Pi2 wave in the KAK δH component has the same spectral peak at ~7 mHz, with few phase differences, and with both δBz components at CSES and VAP-B. The FLR model is not likely considered as a source of a Pi2 event because the frequency of a spectral peak was not different at the magnetosphere, ionosphere, and on the ground, so the driven Alfvénic waves generated by the fast wave mode is likely to be considered as valid. This behavior could be interpreted by the SCW, and we assume that the fast mode wave is the reason for the exhibition of the Pi2 wave at the KAK δH component.
The SCW source mode and cavity mode have not been verified by several studies, while a few of them showed a coherent relationship. The authors of [41] showed that the behavior of SCW was detected in conjugate stations at a high latitude with plasma flow vortices of up to 900 km/s. These observations were in the premidnight region at the radial distance between 9 and 12 RE and generated the FAC of the SCW at the substorm expansion phase onset time. The authors of [42] showed that the compressional pulse could modulate the SCW. Returning to Figure 1a, we notice that the substorm activity associated with our Pi2 pulsation was quite low. In the onset time of the Pi2 event, SML was −25 nT. At the same time, the positive bay at KAK H was detected (see Figure 1b). It suggests that the SCW could be sufficient for exhibiting the magnetic bay signature in our Pi2 study.
Figure 2a,b show that the compressional oscillation detected at CSES in the topside ionosphere was observed at the same time with the horizontal component identified on the ground without time delay. Figure 2b suggests that the first two cycles of the δBy component fluctuations were due to the SCW pulses. Power spectrum density almost has a similar pattern between δH and δBx/δBz, but not for δH and δBy (Figure 3a–c). It suggests a different generation mechanism between δBx/δBz and δBy.
During the Pi2 event, CSES moved rapidly from middle-latitude to the near-equatorial region (Figure 5). Magnetic perturbations of northern and southern FACs of SCW are almost canceled out in the equatorial latitude. The decay of CSES δBy amplitudes was more rapid than those of δBx/δBz (Figure 2 and Figure 3). The higher frequency part of the δBy power was more attenuated than those of δBx/δBz. It could be due to the integrated effect of the fine-structured FACs [29]. This is consistent with what has been schematically illustrated by [11]. This scenario in the magnetosphere-ionosphere coupling system proposed that the Pi2 wave current system generated an AC circuit in this system [43].
The authors of [11] developed the magnetohydrodynamics (MHD) model to describe wave propagation. This model estimates the time delay from the satellite to the conjugate ionosphere as ~50 s. In our event, no time of flight is observed between the low latitude station and the ionosphere (Figure 2a,b). Observation shows that the periodicity characteristics of the dominant pulses between δH and δBy corresponded to one another, although δH and δBy have different decay patterns and spectrum signatures. This is a manifestation of global high-correlation Pi2 waves [11,29].
The same model of [11] also estimated the time of flight of the fast wave propagation from the near-Earth plasma sheet to Earth. They found that it was ~60 s for the paths between the THEMIS satellites and equatorial ground station, Ancon (ANC, geomagnetic latitude = −2.1°, geomagnetic longitude = 355.6°). The time of flight of the fast wave, identified in our event between the VAP-B satellite and KAK station, is 90 s (Figure 7). However, the displayed wave at the CSES was delayed by 90 s compared with those displayed in the magnetosphere (Figure 8). This lateness could be referring to the Alfvén wave propagation along the SCW [29].
Therefore, it is well known that the Pi2 oscillation is triggered first from the magnetosphere to the ionosphere by the Alfvén wave, which is considered responsible for FACs evolution [44,45], along with the initial SCW signal [29,30,31,32,33,34,35,36,37,38,39,40,41,42,43,44,45,46,47].

5. Conclusions

In this work, we report a Pi2 event observed by CSES satellite on 3 September 2018, at 14:30 UT. To the best of the authors’ knowledge, this is the first investigation of a Pi2 pulsation made using the CSES satellite. The notable key findings of this study are the following:
(1)
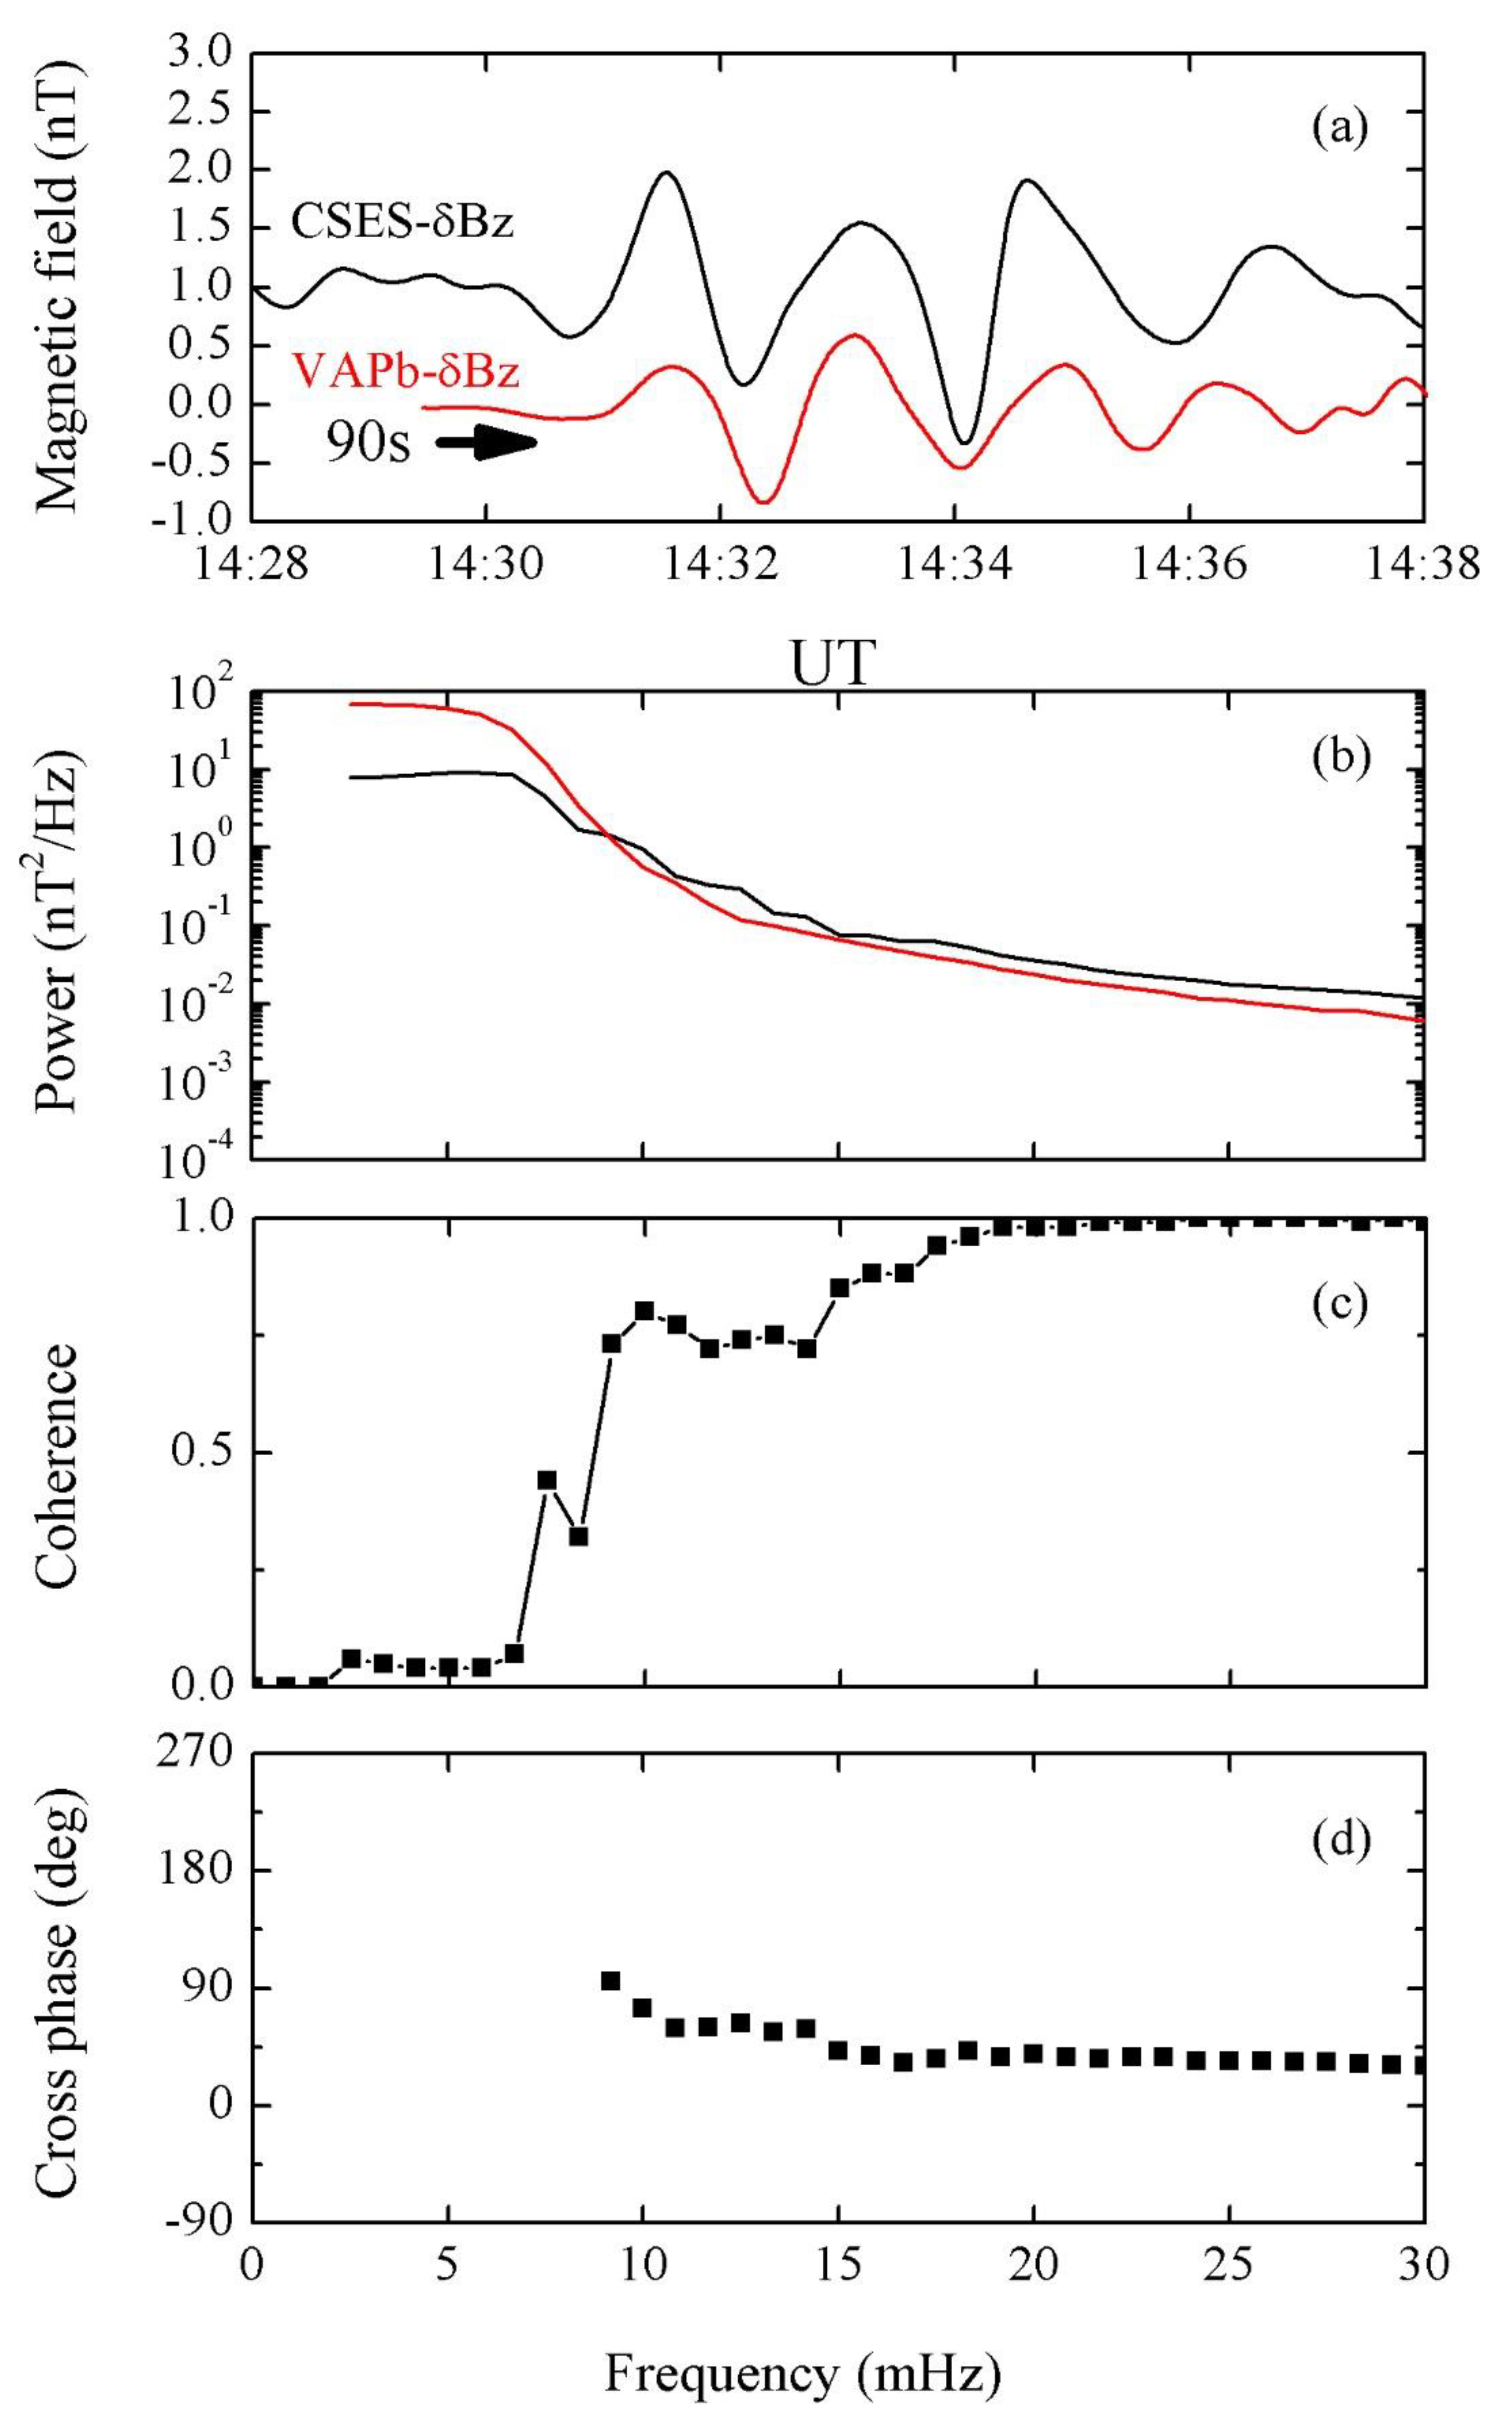
Pi2 observation and analysis confirm the consistency and reliability of the high precision magnetometer (HPM) equipped by two fluxgate magnetometers (FGM1 and FGM2) onboard CSES.
(2)
The observed waveform in the compressional component at CSES is similar to that of the horizontal component at KAK, indicating the magnetospheric source of the Pi2 event.
(3)
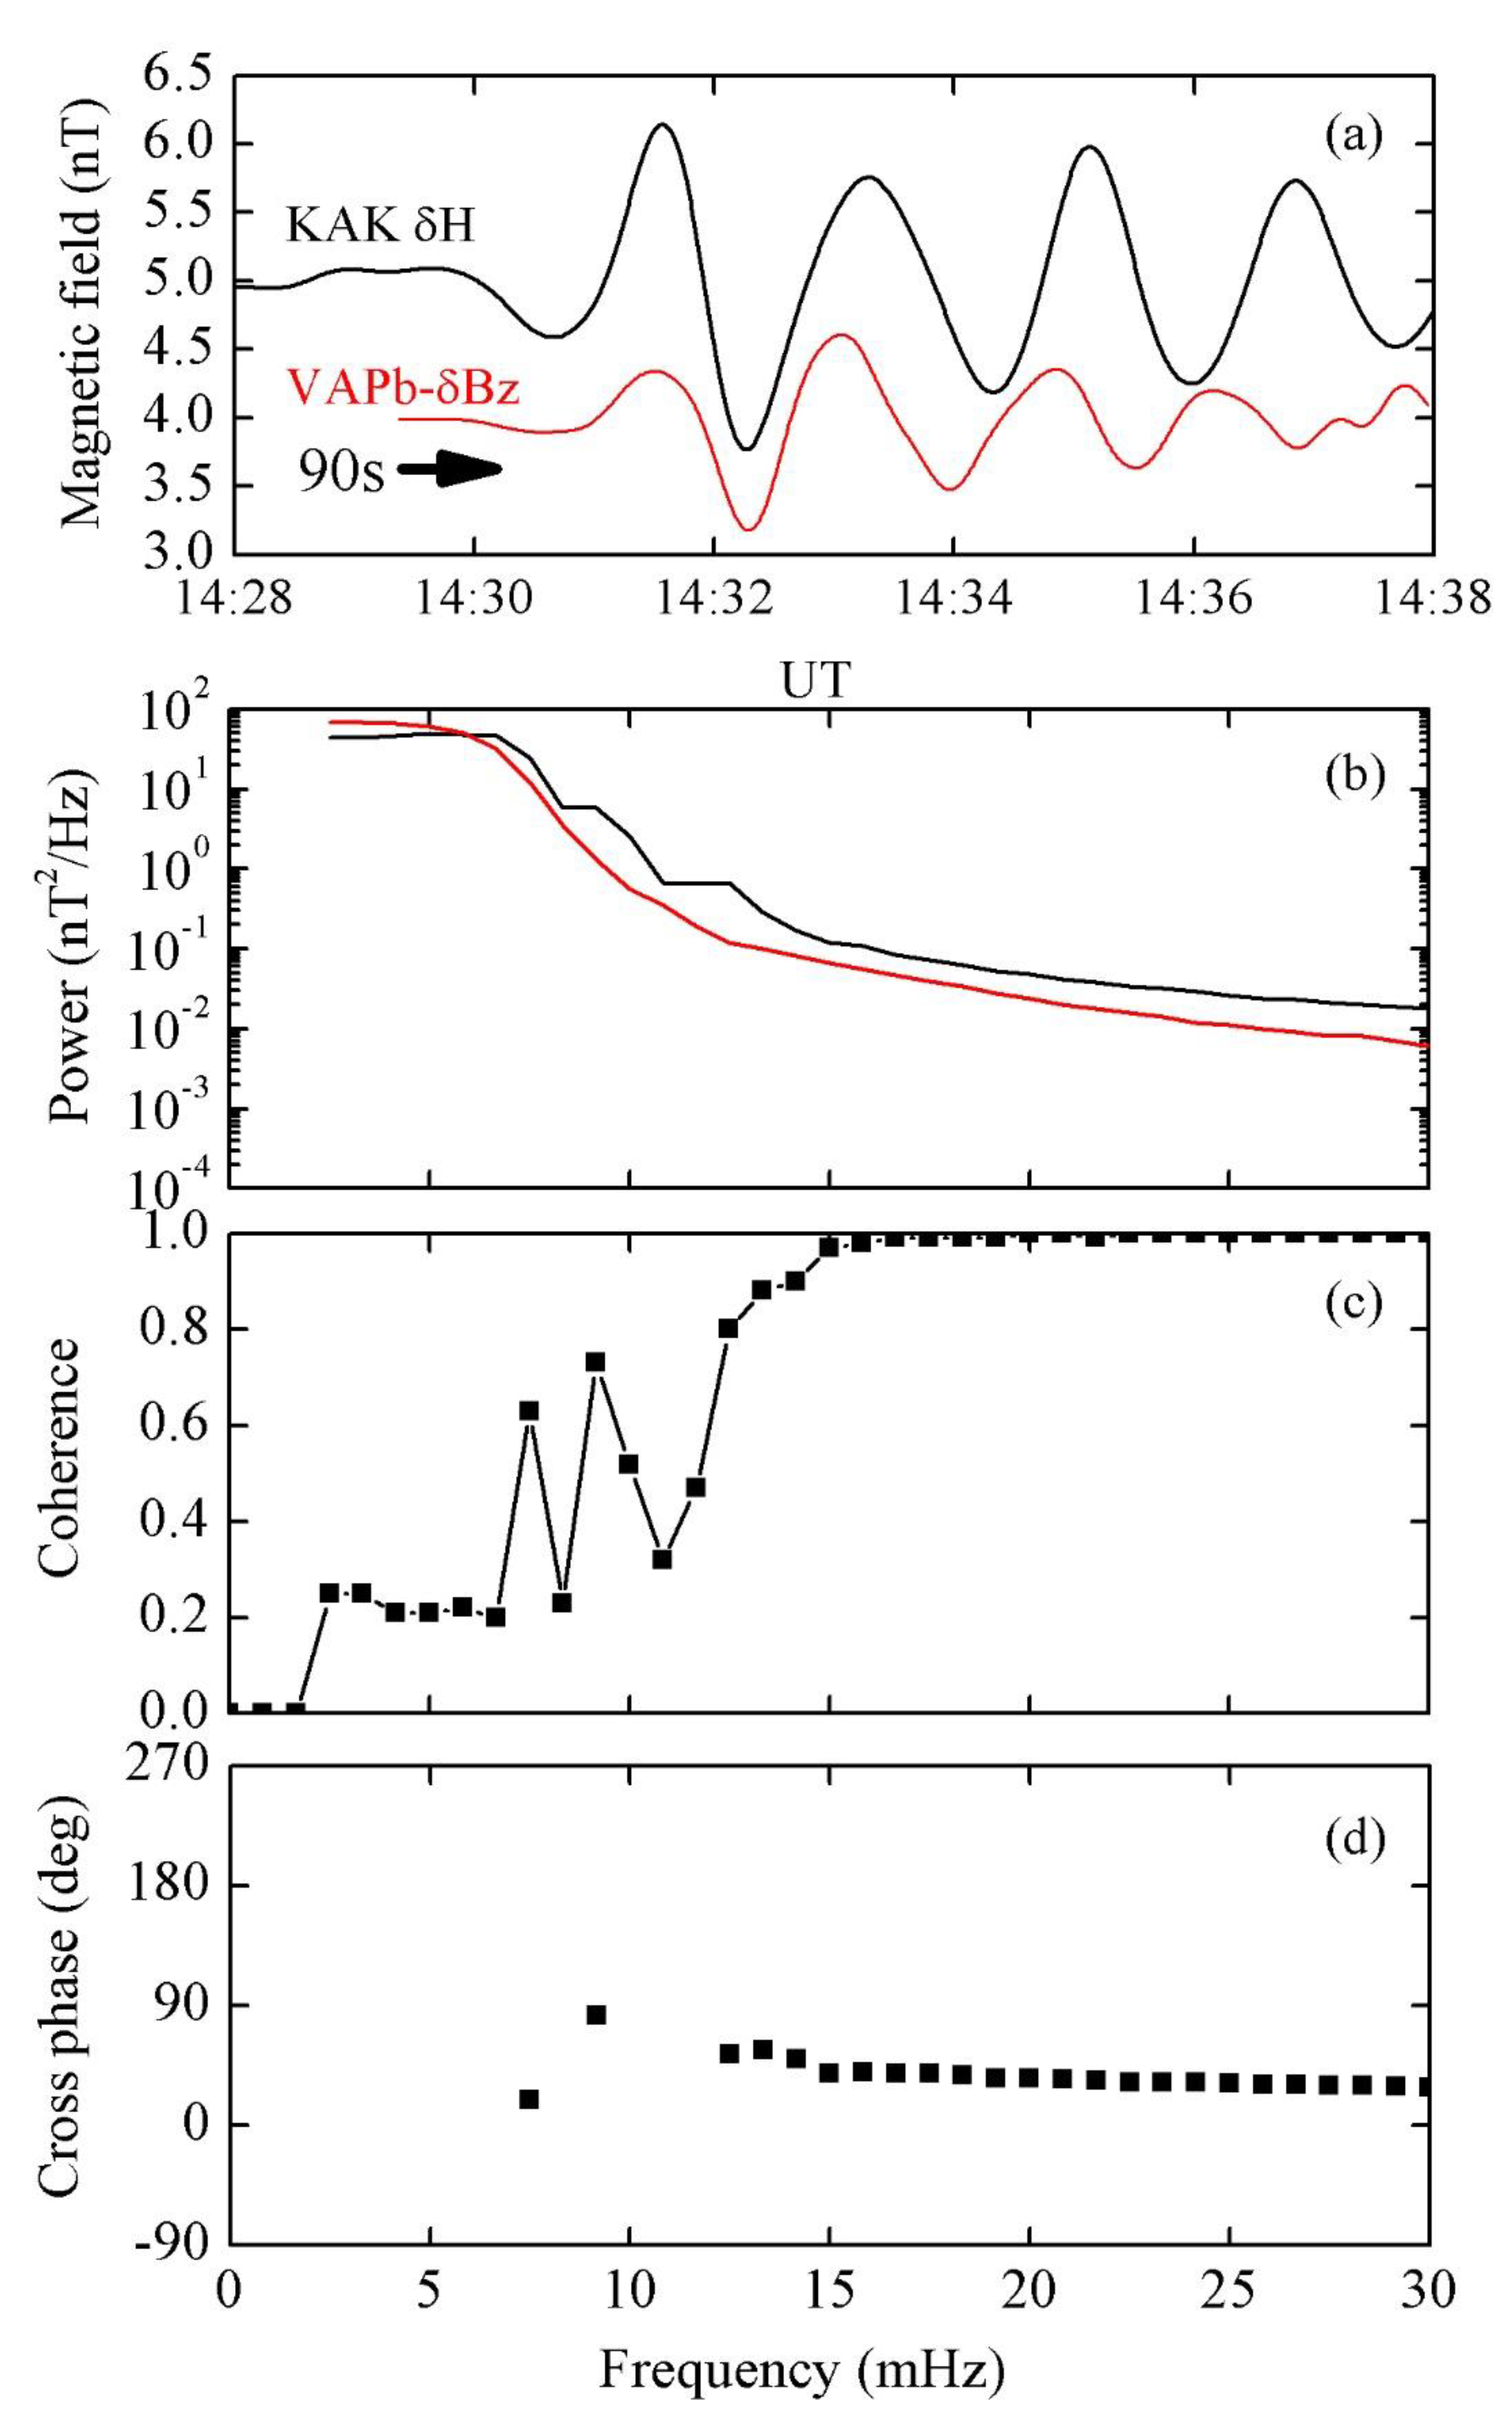
The Pi2 wave is seen in the azimuthal component at CSES with a high correlation with the ground horizontal component, which could be explained by the substorm current wedge (SCW).
(4)
This interpretation is further confirmed by checking the compressional component of the Van Allen Probe B satellite inside the plasmasphere, which, for the first time, gives observational support for an earlier model of the three-dimension oscillations of the SCW associated with the Pi2 event as studied by [29].
With the interpretation of magnetic field data from different space sources in the magnetosphere, the ionosphere can help to better understand the propagation of Pi2 magnetic pulsation. Simultaneous Pi2 events recorded in several locations of the geospace are necessary, and LEO missions such as the CSES and Swarm satellites in the topside ionosphere, integrated with VAP, MMS, ERG (Arase), and GOES observations in the inner magnetosphere, as well as THEMIS observations in the plasma sheet, are expected to resolving many Pi2 issues that are still unclear. Moreover, the integration of space-based satellites with ground-based measurements can explain how Pi2 pulsation spread spatially.

Author Contributions

Conceptualization, E.G. and T.U.; Data curation, E.G. and D.M.; Formal analysis, E.G. and D.M.; Funding acquisition, A.Y.; Investigation, E.G. and D.M.; Methodology, E.G. and D.M.; Software, E.G. and D.M.; Writing – original draft, E.G. and D.M.; Writing – review & editing, E.G., D.M., A.Y., T.U., A.D.S., L.P., X.S. and A.F. All authors have read and agreed to the published version of the manuscript.

Funding

This research work was funded by International Center for Space Weather Science and Education, Kyushu University, Japan.

Acknowledgments

E.G. would like to express his gratitude to the Egyptian Government for providing him a fellowship for visiting ICSWSE, Kyushu University, Japan. The geomagnetic field data from KAK were provided by Kakioka Magnetic Observatory (http://www.kakioka-jma.go.jp/). We gratefully acknowledge SuperMAG for SML index data (http://supermag.jhuapl.edu/) and Van Allen Probes Science Operations Centers located at University of Iowa (http://emfisis.physics.uiowa.edu) for Van Allen Probes magnetic data. W.K. is acknowledged for deriving electron density detected by Van Allen Probes.. This work made use of the data from CSES mission, a project funded by China National Space Administration (CNSA) and China Earthquake Administration (CEA) in collaboration with Italian Space Agency (ASI) and Istituto Nazionale di Fisica Nucleare (INFN). We acknowledge also LIMADOU-Science Project funded by ASI and the project “The electromagnetic data validation and scientific application research based on CSES satellite” funded by ISSI-BJ under which some of the coauthors make active research. This work was supported by JSPS KAKENHI Grand Number JP20H01961 and JP15H05815.

Conflicts of Interest

The authors declare no conflict of interest.

References

  1. Keiling, A.; Takahashi, K. Review of Pi2 models. Space Sci. Rev. 2011, 161, 63–148. [Google Scholar] [CrossRef]
  2. Sutcliffe, P.R.; Yumoto, K. On the cavity mode nature of low latitude Pi2 pulsations. J. Geophys. Res. 1991, 96, 1543–1551. [Google Scholar] [CrossRef]
  3. Ghamry, E. Morningside Pi2 pulsation observed in space and on the ground. J. Astron. Space Sci. 2015, 32, 305–310. [Google Scholar] [CrossRef]
  4. Shinohara, M.; Yumoto, K.; Yoshikawa, A.; Saka, O.; Solovyev, S.I.; Vershinin, E.F.; Trivedi, N.B.; Da Costa, J.M.; The 210° MM Magnetic Observation Group. Wave characteristics of daytime and nighttime Pi2 pulsations at the equatorial and low latitudes. Geophys. Res. Lett. 1997, 24, 2279–2282. [Google Scholar] [CrossRef] [Green Version]
  5. Olson, J.V. Pi2 pulsations and substorm onsets: A review. J. Geophys. Res. 1999, 104, 17499–17520. [Google Scholar] [CrossRef]
  6. Allan, W.; Menk, F.; Fraser, B.; Li, Y.; White, S. Are low-latitude Pi2 pulsations cavity/waveguide modes? J. Geophys. Res. 1996, 23, 765–768. [Google Scholar] [CrossRef]
  7. Takahashi, K.; Lee, D.H.; Nosé, M.; Anderson, R.R.; Hughes, W.J. CRRES electric field study of the radial mode structure of Pi2 pulsations. J. Geophys. Res. 2003, 108, 1210. [Google Scholar] [CrossRef]
  8. Ghamry, E.; Kim, K.H.; Kwon, H.J.; Lee, D.H.; Park, J.S.; Choi, J.; Hyun, K.; Kurth, W.; Kletzing, C.; Wygant, J. Simultaneous Pi2 observations by the Van Allen probes inside and outside the plasmasphere. J. Geophys. Res. 2015, 120, 4567–4575. [Google Scholar] [CrossRef] [Green Version]
  9. Ghamry, E. Pi2 pulsations during extremely quiet geomagnetic condition: Van Allen Probe observations. J. Astron. Space Sci. 2017, 34, 111–118. [Google Scholar] [CrossRef]
  10. Baumjohann, W.; Glaßmeier, K. The transient response mechanism and Pi2 pulsations at substorm onset—Review and outlook. Planet. Space Sci. 1984, 32, 1361–1370. [Google Scholar] [CrossRef]
  11. Uozumi, T.; Abe, S.; Kitamura, K.; Tokunaga, T.; Yoshikawa, A.; Kawano, H.; Marshall, R.; Morris, R.J.; Shevtsov, B.M.; Solovyev, S.I.; et al. Propagation characteristics of Pi2 pulsations observed at high- and low-latitude MAGDAS/ CPMN stations: A statistical study. J. Geophys. Res. 2009, 114, A11207. [Google Scholar] [CrossRef] [Green Version]
  12. Uozumi, T.; Yumoto, K.; Tokunaga, T.; Solovyev, S.I.; Shevtsov, B.M.; Marshall, R.; Liou, K.; Ohtani, S.; Abe, S.; Ikeda, A.; et al. AKR modulation and Global Pi 2 oscillation. J. Geophys. Res. 2011, 116, A06214. [Google Scholar] [CrossRef] [Green Version]
  13. Uozumi, T.; Yoshikawa, A.; Ohtani, S.; Imajo, S.; Baishev, D.G.; Moiseev, A.V.; Yumoto, K. Initial deflection of middle-latitude Pi2 pulsations in the premidnight sector: Remote detection of oscillatory upward field-aligned current at substorm onset. J. Geophys. Res. Space Phys. 2016, 121, 6324–6340. [Google Scholar] [CrossRef]
  14. Ghamry, E.; Fathy, A. A new method to calculate the time delay of the Pi2 pulsations. Adv. Space Res. 2016, 57, 701–709. [Google Scholar] [CrossRef]
  15. Fathy, A.; Ghamry, E.; Mahrous, S. Propagation of irregular magnetic pulsation using cross wavelet and maximum time energy methods. NRIAG J. Astron. Geophys. 2017, 6, 141–147. [Google Scholar] [CrossRef]
  16. Imajo, S.; Yoshikawa, A.; Uozumi, T.; Ohtani, S.; Nakamizo, A.; Chi, P. Application of a global magnetospheric-ionospheric current model for dayside and terminator Pi2 pulsations. J. Geophys. Res. Space Phys. 2017, 122, 8589–8603. [Google Scholar] [CrossRef]
  17. Pilipenko, V.; Fedorov, E.; Heilig, B.; Engebretson, M.J.; Sutcliffe, P.; Lühr, H. ULF waves in the topside ionosphere: Satellite observations and modeling, in the dynamic magnetosphere. In IAGA Special Sopron Book Series; Springer: Dodderek, The Netherlands, 2011; pp. 257–269. [Google Scholar]
  18. Balasis, G.; Papadimitriou, C.; Daglis, I.A.; Pilipenko, V. ULF wave power features in the topside ionosphere revealed by Swarm observations. Geophys. Res. Lett. 2015, 42, 6922–6930. [Google Scholar] [CrossRef]
  19. Heilig, B.; Sutcliffe, P.R. Coherence and phase structure of compressional ULF waves at low-Earth orbit observed by the Swarm satellites. Geophys. Res. Lett. 2016, 43, 945–951. [Google Scholar] [CrossRef]
  20. Takahashi, K.; Hughes, W.; Anderson, R.; Solovyev, S. CRRES satellite observations associated with low-latitude Pi2 pulsations. J. Geophys. Res. 1999, 104, 17431–17440. [Google Scholar] [CrossRef] [Green Version]
  21. Sutcliffe, P.R.; Lühr, H. A comparison of Pi2 pulsations observed by CHAMP in low Earth orbit and on the ground at low latitudes. Geophys. Res. Lett. 2003, 30, 2105. [Google Scholar] [CrossRef]
  22. Han, D.S.; Iyemori, T.; Nose, M.; McCreadie, H.; Gao, Y.; Yang, F.; Yamashita, S.; Stauning, P. A comparative analysis of low-latitude Pi2 pulsations observed by Ørsted and ground stations. J. Geophys. Res. 2004, 109, A10209. [Google Scholar] [CrossRef]
  23. Yang, Y.Y.; Zhima, Z.R.; Shen, X.H.; Chu, W.; Huang, J.P.; Wang, Q.; Yan, R.; Xu, S.; Lu, H.X.; Liu, D.P. The first intense geomagnetic storm event recorded by the China Seismo-Electromagnetic Satellite. Space Weather 2020, 18, e2019SW002243. [Google Scholar] [CrossRef] [Green Version]
  24. Zhou, B.; Cheng, B.; Gou, X.; Li, L.; Zhang, Y.; Wang, J.; Magnes, W.; Lammegger, R.; Pollinger, A.; Ellmeier, M.; et al. First in-orbit results of the vector magnetic field measurement of the High Precision Magnetometer onboard the China Seismo-Electromagnetic Satellite. Earth Planets Space 2019, 71, 119. [Google Scholar] [CrossRef]
  25. Piersanti, M.; De Michelis, P.; Del Moro, D.; Tozzi, R.; Pezzopane, M.; Consolini, G.; Marcucci, M.F.; Laurenza, M.; Di Matteo, S.; Pignalberi, A.; et al. From the Sun to the Earth: August 25, 2018 geomagnetic storm effects. Ann. Geophys. 2020, 38, 703–724. [Google Scholar] [CrossRef]
  26. Marchetti, D.; De Santis, A.; Shen, X.; Campuzano, S.A.; Perrone, L.; Piscini, A.; Di Giovambattista, R.; Jin, S.; Ippolito, A.; Cianchini, G.; et al. Possible Lithosphere-Atmosphere-Ionosphere Coupling effects prior to the 2018 Mw = 7.5 Indonesia earthquake from seismic, atmospheric and ionospheric data. J. Asian Earth Sci. 2020, 188, 104097. [Google Scholar]
  27. Yan, R.; Shen, X.; Huang, J.; Wang, Q.; Chu, W.; Liu, D.; Yang, Y.; Lu, H.; Xu, S. Examples of unusual ionospheric observations by the CSES prior to earthquakes. Earth Planet. Phys. 2018, 2, 515–526. [Google Scholar] [CrossRef]
  28. Shen, X.; Zong, Q.G.; Zhang, X.M. Introduction to special section on the China Seismo-Electromagnetic Satellite and initial results. Earth Planet. Phys. 2018, 2, 439–443. [Google Scholar] [CrossRef]
  29. Uozumi, T.; Yoshikawa, A.; Ohtani, S. Formation of a 3-D Oscillatory Current System Associated with Global High-Correlation Pi2 Event: A Case Study. J. Geophys. Res. Space Phys. 2020, 125, e2019JA02698. [Google Scholar] [CrossRef] [Green Version]
  30. Finlay, C.; Olsen, N.; Kotsiaros, S.; Gillet, N.; Tøffner-Clausen, L. Recent geomagnetic secular variation from Swarm and ground observatories as estimated in the CHAOS-6 geomagnetic field model. Earth Planets Space 2016, 68, 112. [Google Scholar] [CrossRef] [Green Version]
  31. Mauk, H.B.; Fox, N.J.; Kanekal, S.G.; Kessel, R.L.; Sibeck, D.G.; Ukhorskiy, A. Science objectives and rationale for the Radiation Belt Storm Probes mission. Space Sci. Rev. 2012, 179, 3–27. [Google Scholar] [CrossRef] [Green Version]
  32. Kletzing, C.A.; Kurth, W.S.; Acuna, M.; MacDowall, R.J.; Torbert, R.B.; Averkamp, T.; Bodet, D.; Bounds, S.R.; Chutter, M.; Connerney, J.; et al. The Electric and Magnetic Field Instrument Suite and Integrated Science (EMFISIS) on RBSP. Space Sci. Rev. 2013, 179, 127–181. [Google Scholar] [CrossRef] [Green Version]
  33. Newell, P.T.; Gjerloev, J.W. Evaluation of SuperMAG auroral electrojet indices as indicators of substorms and auroral power. J. Geophys. Res. 2011, 116, A12211. [Google Scholar] [CrossRef]
  34. Newell, P.T.; Gjerloev, J.W. Substorm and magnetosphere characteristic scales inferred from the SuperMAG auroral electrojet indices. J. Geophys. Res. 2011, 116, A12232. [Google Scholar] [CrossRef] [Green Version]
  35. Kamide, Y. The relationship between field-aligned currents and the auroral electrojets: A review. Space Sci. Rev. 1982, 31, 127–243. [Google Scholar] [CrossRef]
  36. Fujii, R.; Offman, R.A.; Anderson, P.C.; Craven, J.D.; Sugiura, M.; Frank, L.A.; Maynard, N.C. Electrodynamic parameters in thenighttime sector during auroral substorms. J. Geophys. Res. 1994, 99, 6093–6112. [Google Scholar] [CrossRef]
  37. Gjerloev, J.W.; Hoffman, R.A. The large-scale current system during auroral substorms. J. Geophys. Res. Space Phys. 2014, 119, 4591–4606. [Google Scholar] [CrossRef]
  38. Murphy, K.R.; Mann, I.R.; Rae, I.J.; Waters, C.L.; Frey, H.U.; Kale, A.; Singer, H.J.; Anderson, B.J.; Korth, H. The detailed spatial structure of field-aligned currents comprising the substorm current wedge. J. Geophys. Res. Space Phys. 2013, 118, 7714–7727. [Google Scholar] [CrossRef]
  39. Nishida, A. Possible origin of transient dusk-to-dawn electric field in the nightside magnetosphere. J. Geophys. Res. 1979, 84, 3409–3412. [Google Scholar] [CrossRef]
  40. Sakurai, T.; McPherron, R.L. Satellite observations of Pi2 activity at synchronous orbit. J. Geophys. Res. 1983, 88, 7015–7027. [Google Scholar] [CrossRef]
  41. Keiling, A.; Angelopoulos, V.; Runov, A.; Weygand, J.; Apatenkov, S.V.; Mende, S.; McFadden, J.; Larson, D.; Amm, O.; Glassmeier, K.H.; et al. Substorm current wedge driven by plasma flow vortices: THEMIS observations. J. Geophys. Res. 2009, 114, A00C22. [Google Scholar] [CrossRef] [Green Version]
  42. Kepko, L.; Kivelson, M.G.; Yumoto, K. Flow bursts, braking, and Pi2 pulsations. J. Geophys. Res. 2001, 106, 1903–1916. [Google Scholar] [CrossRef]
  43. Ohtani, S.; Uozumi, T. Nightside magnetosphere-ionosphere current circuit: Implications for auroral streamers and Pi2 pulsations. J. Geophys. Res. Space Phys. 2018, 123, 350–363. [Google Scholar] [CrossRef] [Green Version]
  44. Southwood, D.J.; Kivelson, M.G. An approximate description of field-aligned currents in a planetary magnetic field. J. Geophys. Res. 1991, 96, 67–75. [Google Scholar] [CrossRef]
  45. Kan, J.R.; Sun, W. Substorm expansion phase caused by an intense localized convection imposed on the ionosphere. J. Geophys. Res. 1996, 101, 27271–27281. [Google Scholar] [CrossRef]
  46. Lester, M.; Hughes, W.J.; Singer, H.J. Polarization patterns of Pi2 magnetic pulsations and the substorm current wedge. J. Geophys. Res. 1983, 88, 7958–7966. [Google Scholar] [CrossRef] [Green Version]
  47. Lester, M.; Hughes, W.J.; Singer, H.J. Longitudinal structure in Pi2 pulsations and the substorm current wedge. J. Geophys. Res. 1984, 89, 5489–5494. [Google Scholar] [CrossRef]
Figure 1. (a) SuperMag auroral electrojet index (SML) and (b) low-latitude magnetic field variations (H component) represented by Kakioka (KAK) station. The vertical dashed line indicates the onset time of Pi2 event.
Remotesensing 12 02300 g001
Figure 2. (a) shows KAK δH; (b) represents δBx, δBy, and δBz oscillations observed at the China Seismo-electromagnetic satellite (CSES) satellite. MLAT denotes magnetic latitude, MLT stands for magnetic local time, and (c) is the magnitude scalogram of the compressional component of CSES. The original signal is reported as a red line at (c) while the light blue dashed lines represent −0.5, 0.0, and +0.50 nT, respectively. The vertical dashed lines at (a,b) indicate the crests of KAK δH component.
Remotesensing 12 02300 g002
Figure 3. (ac) Pi2 time series of the KAK (δH component) and the CSES (δBz, δBx, and δBy components). The power density, coherence, and phase difference between each component of CSES (δBz, δBx, and δBy) and KAK (δH component) are presented in (df), (gi), and (jl), respectively.
Remotesensing 12 02300 g003
Figure 4. Van Allen Probe A (VAP-A) orbit (a) and Van Allen Probe B (VAP-B) orbit (b) visualized onto the solar magnetic x–y plane for six-hour periods. (c,d) depict the electron density identified by VAP-A and VAP-B, respectively. Thick curved lines in (a,b) and thick bars in (c,d) highlight the time period of 14:30–15:00 UT.
Remotesensing 12 02300 g004
Figure 5. Pi2 pulsations at the δH component of the KAK ground station (a) and the positions of the CSES, VAP-A, and VAP-B in dipole-based coordinates with MLT (b) and MLAT (c) during 14:00–15:00 UT.
Remotesensing 12 02300 g005
Figure 6. Comparison of Pi2 oscillations observed by the horizontal δH component at the KAK and the compressional δBz component at both VAP-A and VAP-B satellites.
Remotesensing 12 02300 g006
Figure 7. Comparison of (a) time series and (bd) spectral characteristics of KAK δH and VAP-B δBz.
Remotesensing 12 02300 g007
Figure 8. Comparison of (a) time series and (bd) spectral characteristics of CSES δBz and VAP-B δBz.
Remotesensing 12 02300 g008

