Correction: Miraglio, T., et al. Monitoring LAI, Chlorophylls, and Carotenoids Content of a Woodland Savanna Using Hyperspectral Imagery and 3D Radiative Transfer Modeling. Remote Sensing 2020, 12, 28
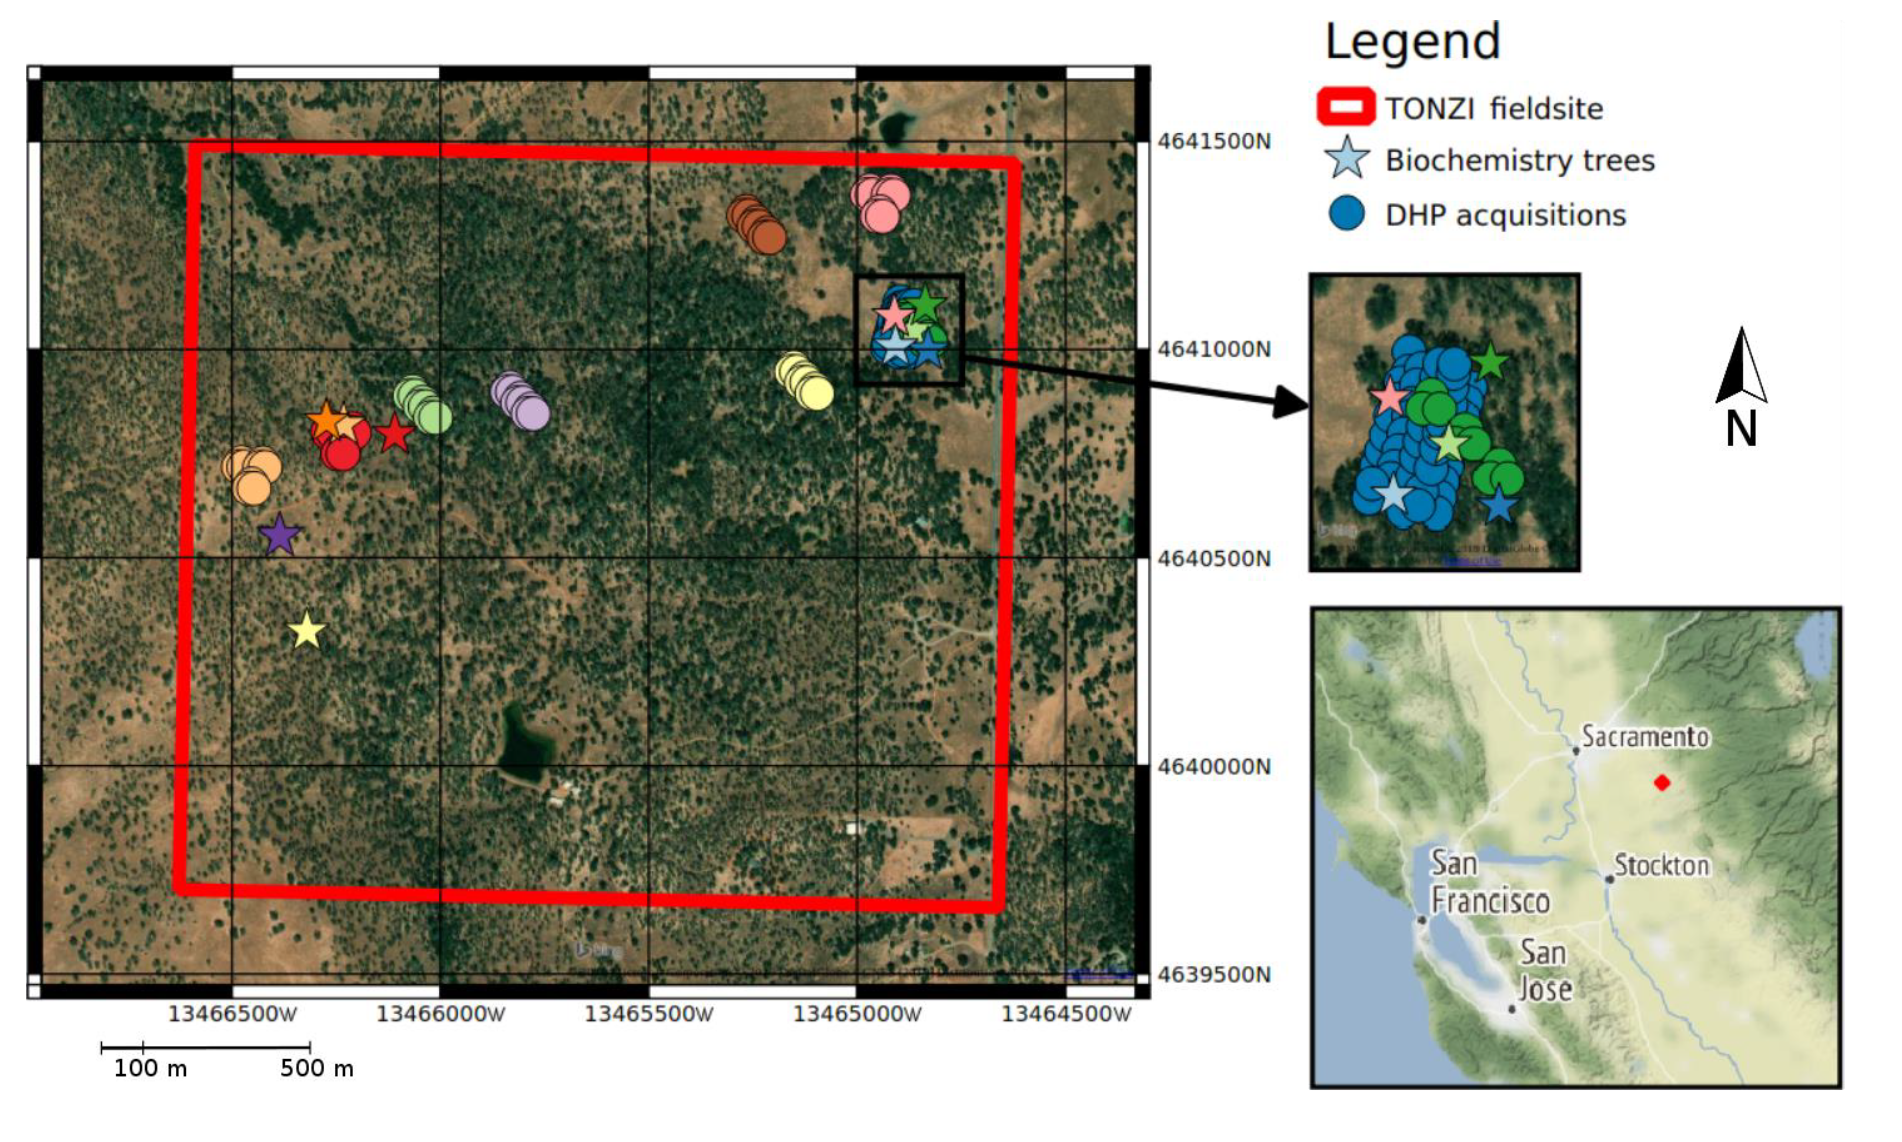
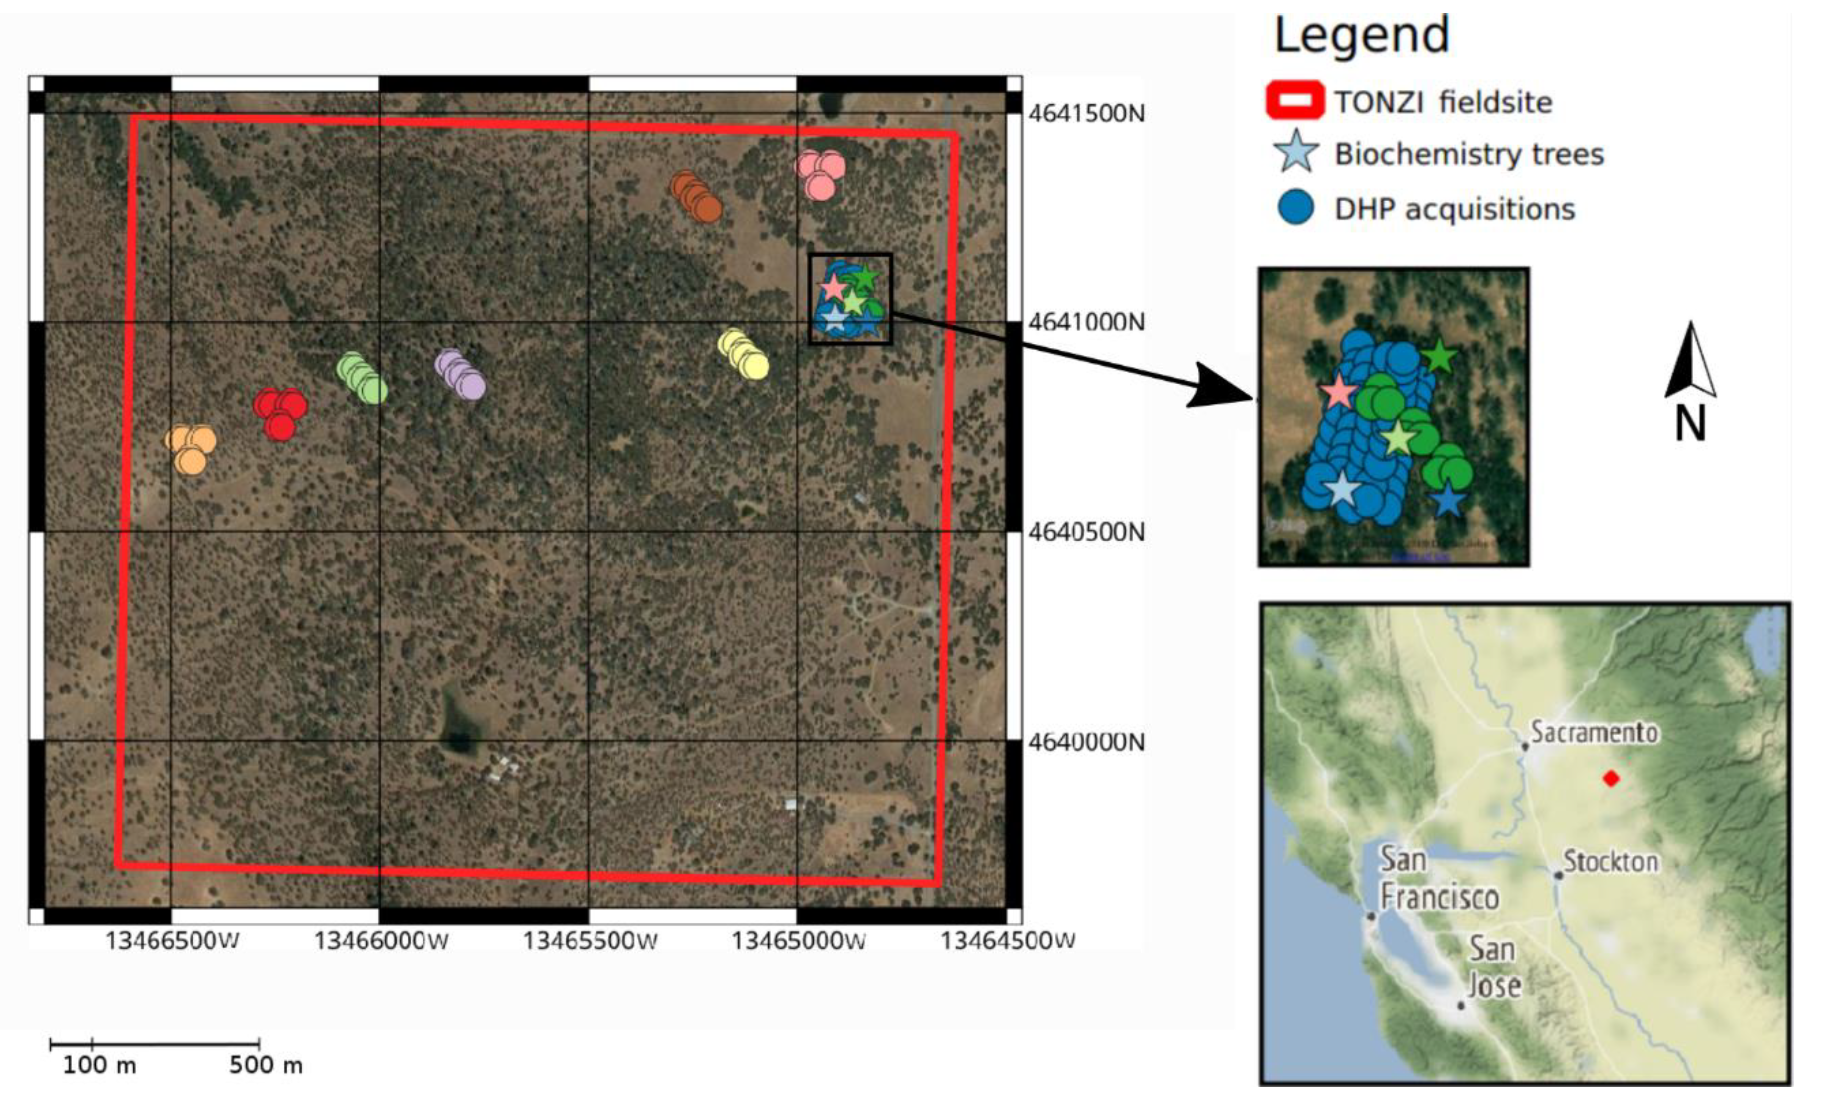
| Validation Data | ||
| Date | LAI | Biochemistry |
| Summer 2013 | 5 | |
| Fall 2013 | 12 | 5 |
| Summer 2014 | 19 | 5 |
| Summer 2016 | 21 | |
| Total | 52 | 15 |
| Validation Data | ||
| Date | LAI | Biochemistry |
| Summer 2013 | 3 | |
| Fall 2013 | 12 | 5 |
| Summer 2014 | 19 | 5 |
| Summer 2016 | 21 | |
| Total | 52 | 13 |
| Fall 2013 | Summer 2014 | Summer 2016 | All Dates | ||
| q | 100 | 100 | 100 | 100 | |
| LAI [m²/m²] | RMSE INT LAI | 0.61 | 0.61 | 0.63 | 0.62 |
| SAM INT LAI | 0.66 | 0.21 | 0.31 | 0.39 | |
| NDVI | 0.17 | 0.23 | 0.24 | 0.22 | |
| MSAVI2 | 0.18 | 0.24 | 0.29 | 0.25 | |
| Summer 2013 | Fall 2013 | Summer 2014 | All Dates | ||
| q | 300 | 300 | 300 | 300 | |
| Cab [µg/cm²] | RMSE INT CAB | 14.2 | 15.36 | 6.36 | 12.6 |
| SAM INT CAB | 13.42 | 15.91 | 5.8 | 12.5 | |
| MCARI2 | 18.22 | 14.38 | 10.57 | 14.7 | |
| TCARI/OSAVI | 12.9 | 8.09 | 4.31 | 9.14 | |
| Maccioni | 11.33 | 9.34 | 6.12 | 9.19 | |
| gNDVI | 11.4 | 4.22 | 2.89 | 7.21 | |
| GM_94b | 8.91 | 3.86 | 3.39 | 5.94 | |
| q | 100 | 400 | 400 | 400 | |
| Car [µg/cm²] | RMSE INT CAR | 3.03 | 1.14 | 2.94 | 2.71 |
| SAM INT CAR | 7.88 | 9.31 | 2.36 | 7.45 | |
| R515/R570 | 7.06 | 4.32 | 2.74 | 4.75 | |
| CRI | 3.07 | 3.83 | 1.91 | 3.01 |
| Fall 2013 | Summer 2014 | Summer 2016 | All Dates | ||
| q | 100 | 100 | 100 | 100 | |
| LAI [m²/m²] | RMSE INT LAI | 0.61 | 0.61 | 0.63 | 0.62 |
| SAM INT LAI | 0.66 | 0.21 | 0.31 | 0.39 | |
| NDVI | 0.17 | 0.23 | 0.24 | 0.22 | |
| MSAVI2 | 0.18 | 0.24 | 0.29 | 0.25 | |
| Summer 2013 | Fall 2013 | Summer 2014 | All Dates | ||
| q | 300 | 300 | 300 | 300 | |
| Cab [µg/cm²] | RMSE INT CAB | 12.45 | 15.36 | 6.36 | 11.92 |
| SAM INT CAB | 9.1 | 15.91 | 5.8 | 11.37 | |
| MCARI2 | 10.44 | 14.38 | 10.57 | 12.15 | |
| TCARI/OSAVI | 5.86 | 8.09 | 4.31 | 6.34 | |
| Maccioni | 8.38 | 9.34 | 6.12 | 8.02 | |
| gNDVI | 9.09 | 4.22 | 2.89 | 5.39 | |
| GM_94b | 8.62 | 3.86 | 3.39 | 5.21 | |
| q | 400 | 400 | 400 | 400 | |
| Car [µg/cm²] | RMSE INT CAR | 0.58 | 1.14 | 2.94 | 1.34 |
| SAM INT CAR | 4.78 | 9.31 | 2.36 | 6.54 | |
| R515/R570 | 5.74 | 4.32 | 2.74 | 4.01 | |
| CRI | 2.87 | 3.83 | 1.91 | 2.89 |

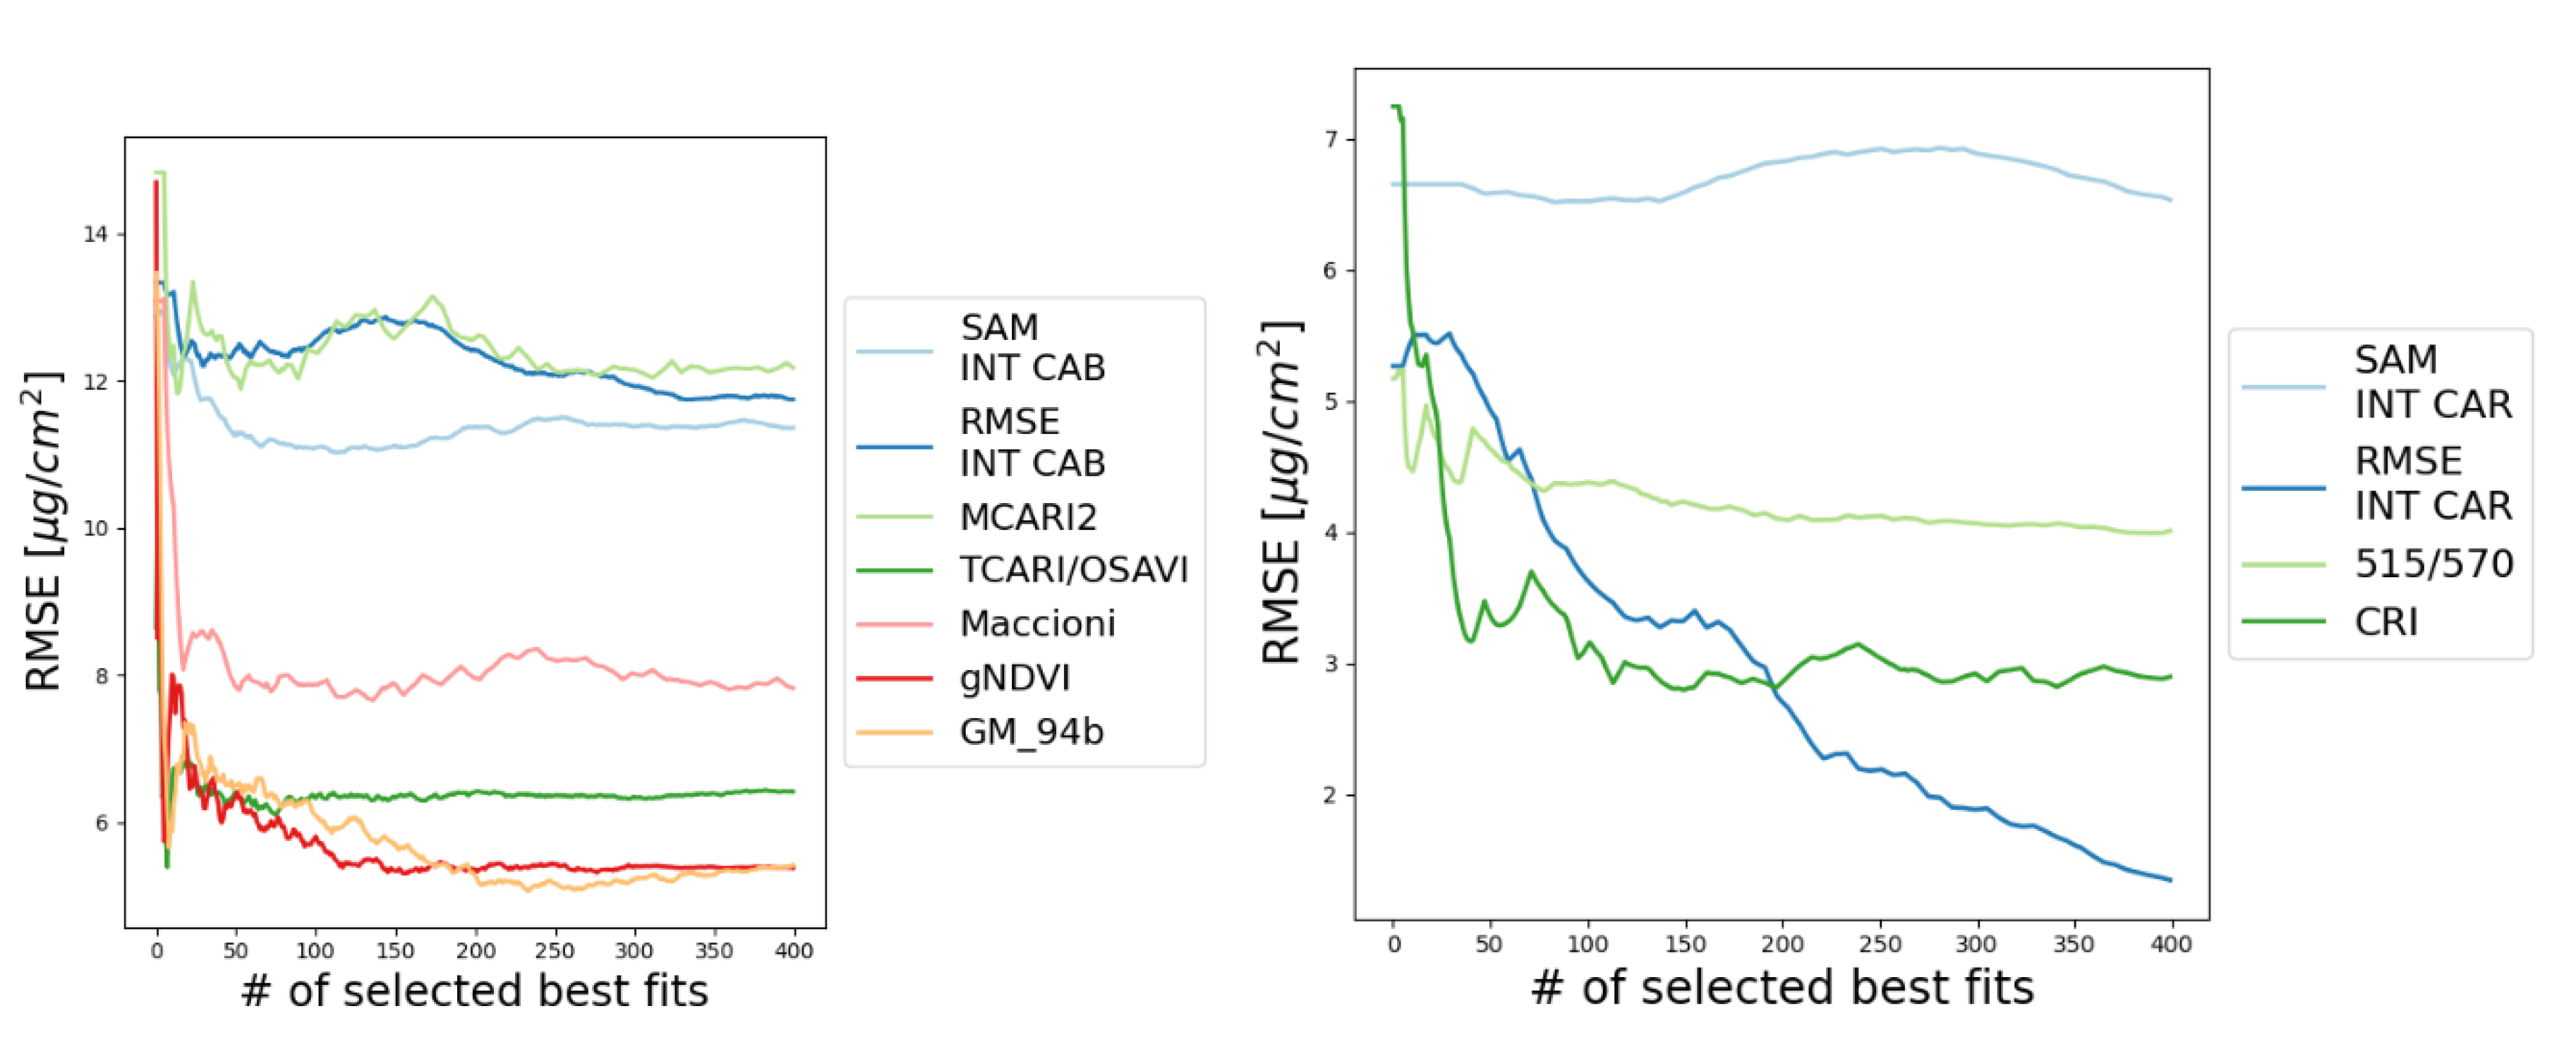
| Method | RMSE [µg/cm²] | bias [µg/cm²] | STDB [µg/cm²] | R² |
| Cab | ||||
| RMSE INT CAB | 12.6 | 8.93 | 6.23 | 0.15 |
| SAM INT CAB | 12.5 | 5.99 | 8.66 | 0.07 |
| MCARI2 | 14.7 | −5.4 | 11.0 | 0.01 |
| TCARI/OSAVI | 9.14 | 3.39 | 4.76 | 0.15 |
| Maccioni | 9.19 | 4.4 | 5.22 | 0.21 |
| gNDVI | 7.21 | −2.14 | 5.34 | 0.44 |
| GM_94b | 5.94 | −3.81 | 4.06 | 0.75 |
| Car | ||||
| RMSE INT CAR | 2.71 | 0.7 | 2.21 | 0.11 |
| SAM INT CAR | 7.45 | 3.59 | 4.14 | 0.32 |
| R515/R570 | 4.75 | −0.26 | 4.35 | 0.0 |
| CRI | 3.01 | 0.36 | 2.09 | 0.01 |
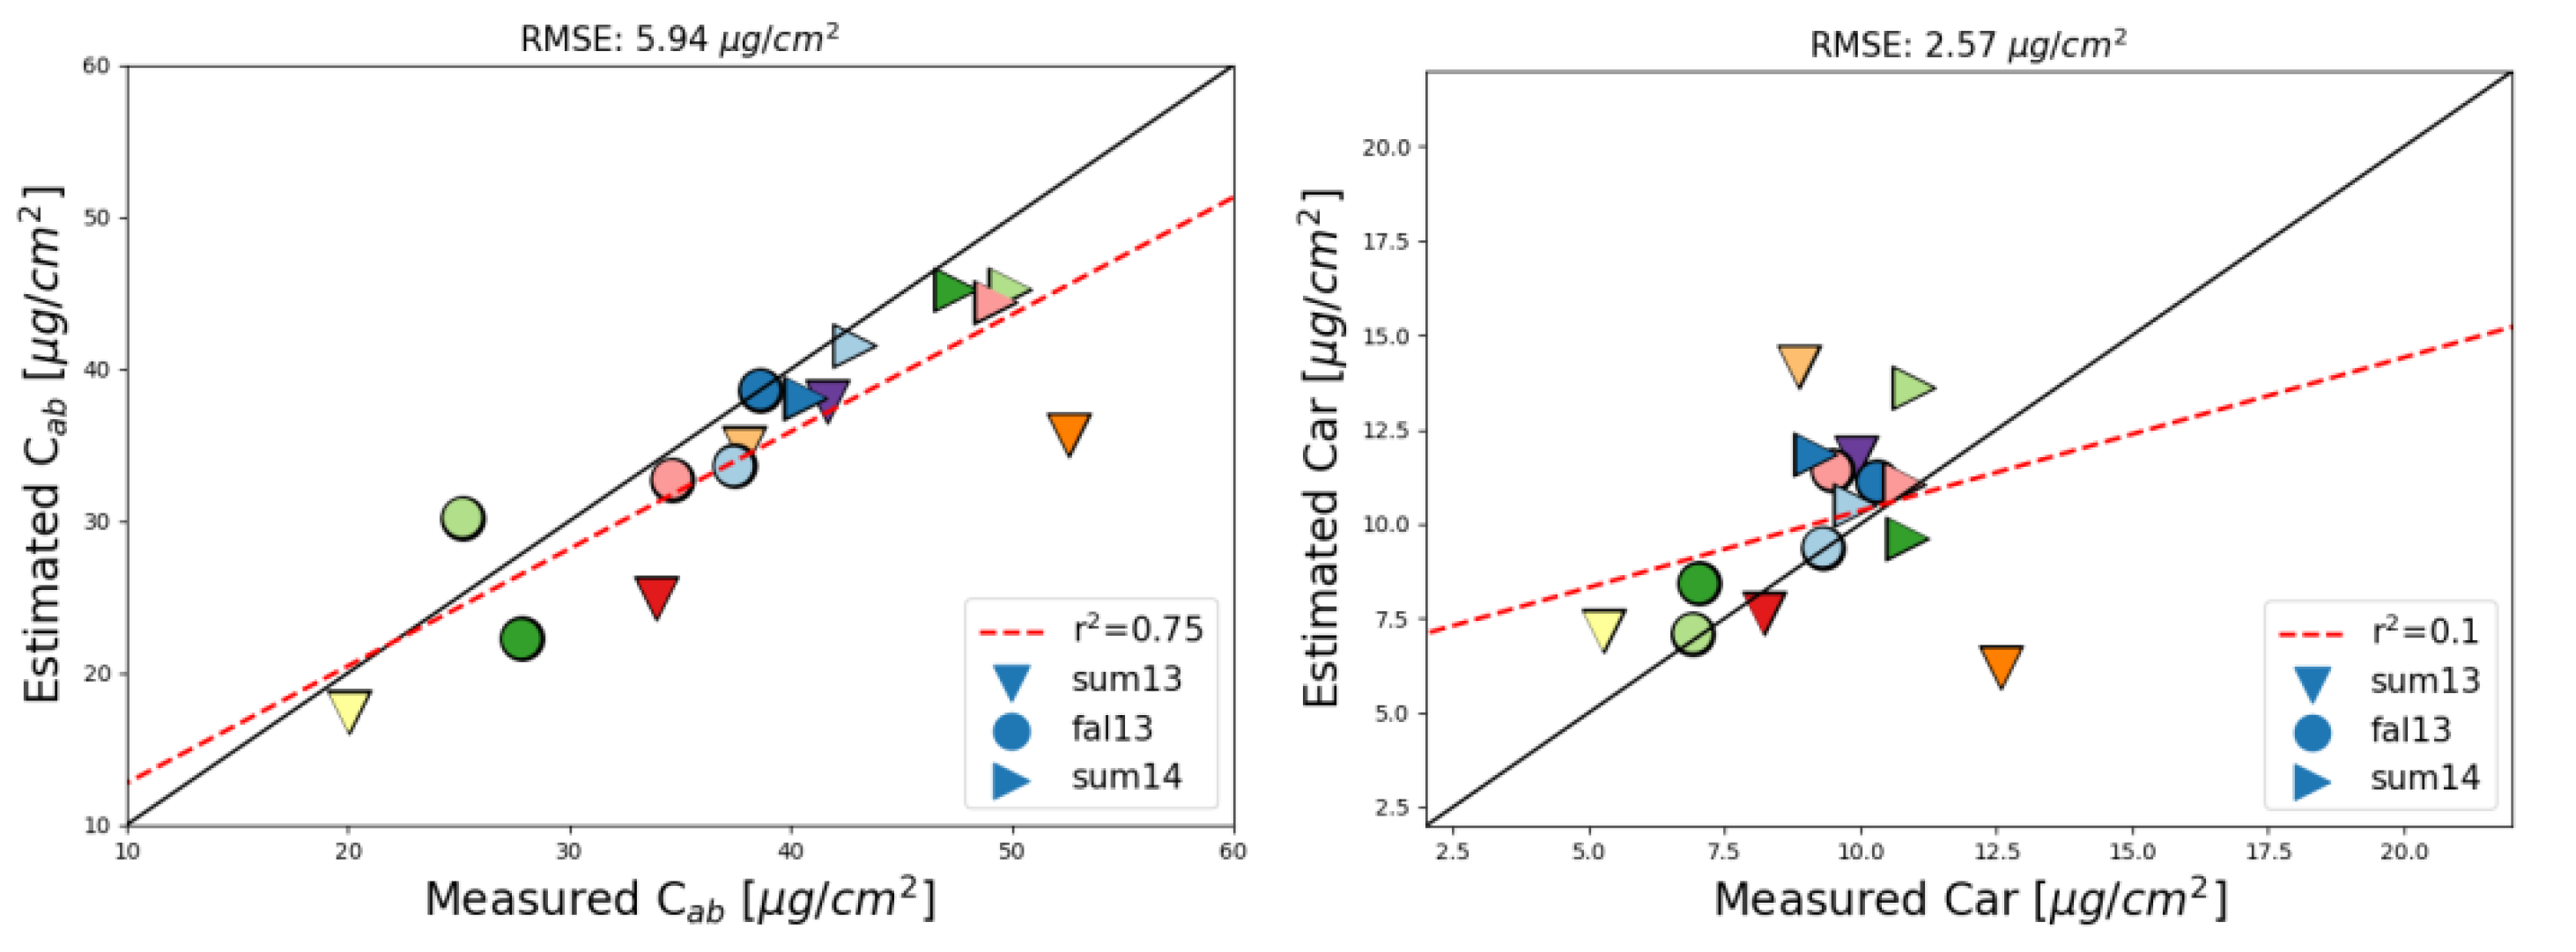
| Method | RMSE [µg/cm²] | bias [µg/cm²] | STDB [µg/cm²] | R² |
| Cab | ||||
| RMSE INT CAB | 11.92 | 8.99 | 5.21 | 0.14 |
| SAM INT CAB | 11.37 | 7.46 | 6.05 | 0.08 |
| MCARI2 | 12.15 | −5.05 | 8.62 | 0.01 |
| TCARI/OSAVI | 6.34 | 2.75 | 4.15 | 0.48 |
| Maccioni | 8.02 | 4.36 | 5.03 | 0.32 |
| gNDVI | 5.39 | −2.15 | 3.82 | 0.61 |
| GM_94b | 5.21 | −3.21 | 3.38 | 0.73 |
| Car | ||||
| RMSE INT CAR | 1.34 | 0.79 | 1.06 | 0.59 |
| SAM INT CAR | 6.53 | 1.59 | 4.53 | 0.29 |
| R515/R570 | 4.01 | −1.26 | 3.74 | 0.26 |
| CRI | 2.89 | −0.2 | 2.1 | 0.05 |
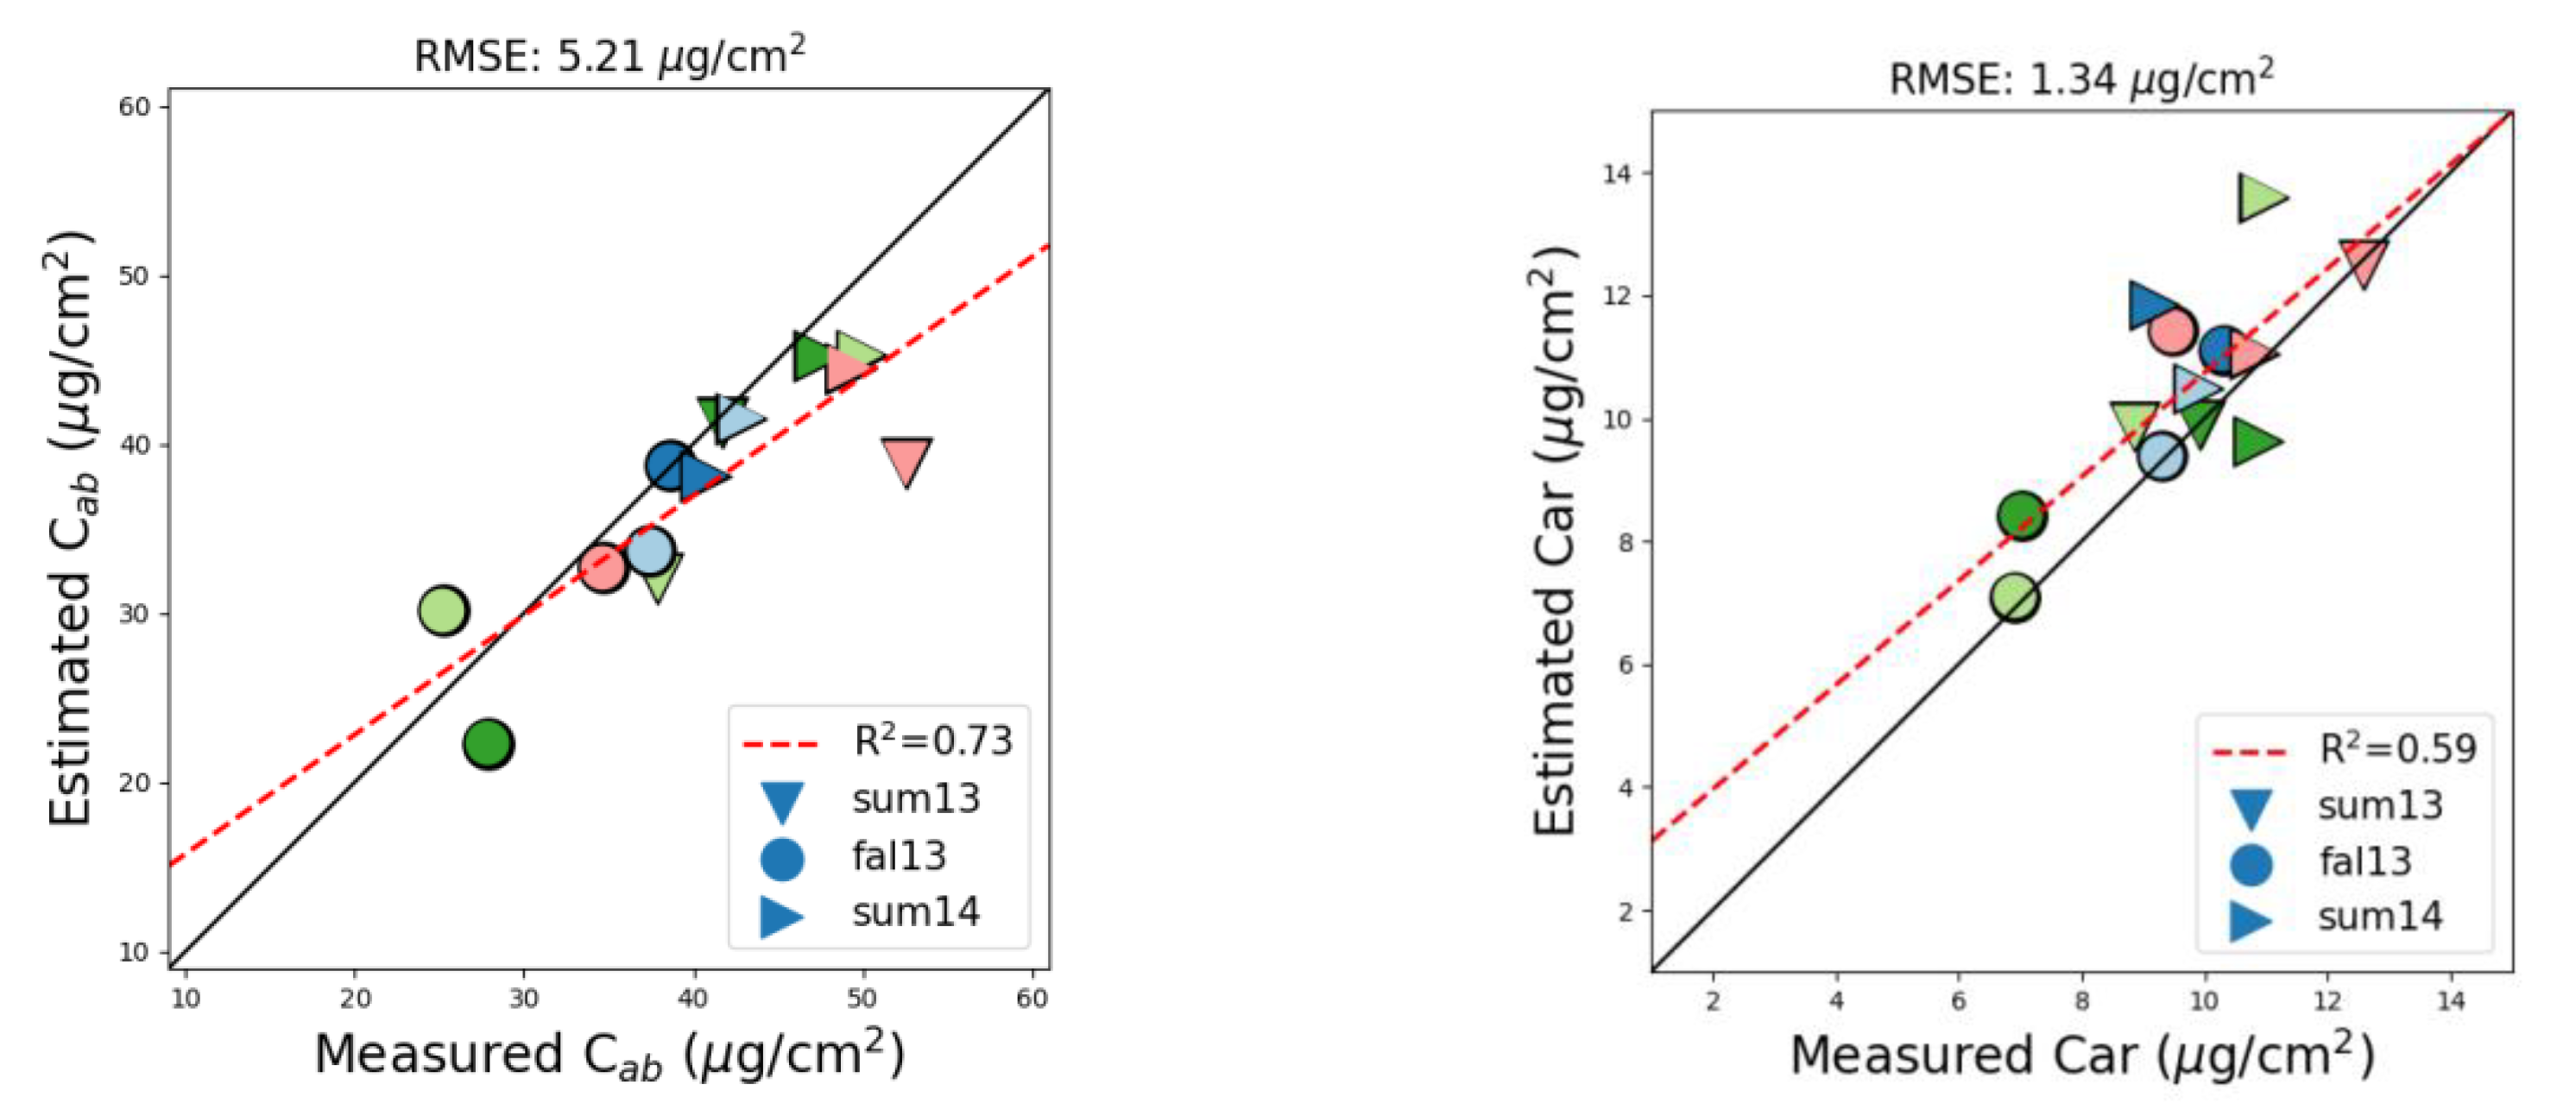
Reference
- Miraglio, T.; Adeline, K.; Huesca, M.; Ustin, S.; Briottet, X. Monitoring LAI, Chlorophylls, and Carotenoids Content of a Woodland Savanna Using Hyperspectral Imagery and 3D Radiative Transfer Modeling. Remote Sens. 2020, 12, 28. [Google Scholar] [CrossRef]
© 2020 by the authors. Licensee MDPI, Basel, Switzerland. This article is an open access article distributed under the terms and conditions of the Creative Commons Attribution (CC BY) license (http://creativecommons.org/licenses/by/4.0/).
Share and Cite
Miraglio, T.; Adeline, K.; Huesca, M.; Ustin, S.; Briottet, X. Correction: Miraglio, T., et al. Monitoring LAI, Chlorophylls, and Carotenoids Content of a Woodland Savanna Using Hyperspectral Imagery and 3D Radiative Transfer Modeling. Remote Sensing 2020, 12, 28. Remote Sens. 2020, 12, 2263. https://doi.org/10.3390/rs12142263
Miraglio T, Adeline K, Huesca M, Ustin S, Briottet X. Correction: Miraglio, T., et al. Monitoring LAI, Chlorophylls, and Carotenoids Content of a Woodland Savanna Using Hyperspectral Imagery and 3D Radiative Transfer Modeling. Remote Sensing 2020, 12, 28. Remote Sensing. 2020; 12(14):2263. https://doi.org/10.3390/rs12142263
Chicago/Turabian StyleMiraglio, Thomas, Karine Adeline, Margarita Huesca, Susan Ustin, and Xavier Briottet. 2020. "Correction: Miraglio, T., et al. Monitoring LAI, Chlorophylls, and Carotenoids Content of a Woodland Savanna Using Hyperspectral Imagery and 3D Radiative Transfer Modeling. Remote Sensing 2020, 12, 28" Remote Sensing 12, no. 14: 2263. https://doi.org/10.3390/rs12142263
APA StyleMiraglio, T., Adeline, K., Huesca, M., Ustin, S., & Briottet, X. (2020). Correction: Miraglio, T., et al. Monitoring LAI, Chlorophylls, and Carotenoids Content of a Woodland Savanna Using Hyperspectral Imagery and 3D Radiative Transfer Modeling. Remote Sensing 2020, 12, 28. Remote Sensing, 12(14), 2263. https://doi.org/10.3390/rs12142263


