


Abstract
The purpose of this study was to develop an optimal estimation model for rainfall rate retrievals using radar reflectivity, thereby gaining an effective grasp of rainfall information for disaster prevention uses. A process was designed for evaluating the optimal retrieval models using various dataset combinations with radar reflectivity and ground meteorological attributes. Various ground meteorological attributes (such as relative humidity, wind speed, precipitation, etc.) were obtained using the land-based weather stations affiliated with Taiwan’s Central Weather Bureau (CWB). This study used nine radar reflectivity provided by the Hualien weather surveillance radar station’s Volume Cover Pattern 21 system. The developed models are built using multiple machine learning algorithms, including linear regression (REG), support vector regression (SVR), and extreme gradient boosting (XGBoost), in addition to the Marshall–Palmer formula (MP). The study examined 14 typhoons that occurred from 2008 to 2017 at Chenggong station in southeast Taiwan, and Lanyu station in the outlying islands, and the top four major rainfall events were designated as test typhoons—Nanmadol (2011), Tembin (2012), Matmo (2014), and Nepartak (2016). The results indicated that for rainfall retrievals, radar reflectivity at a scanning (elevation) angle of 6.0° combined with ground meteorological attributes were the optimal input variables for the Chenggong station, whereas radar reflectivity at an elevation angle of 4.3° combined with ground meteorological attributes were optimal for the Lanyu station. In terms of model performance, XGBoost models had the lowest error index at Chenggong and Lanyu stations compared with MP, REG, and SVR models. XGBoost models at Lanyu station had the highest efficiency coefficient (0.903), and those at Chenggong station had the second highest (0.885). As a result, pairing the combination of optimal radar reflectivity and ground meteorological attributes, as verified by the evaluation process, with a high-efficiency algorithm (XGBoost) can effectively increase the accuracy of rainfall retrieval during typhoons.
1. Introduction
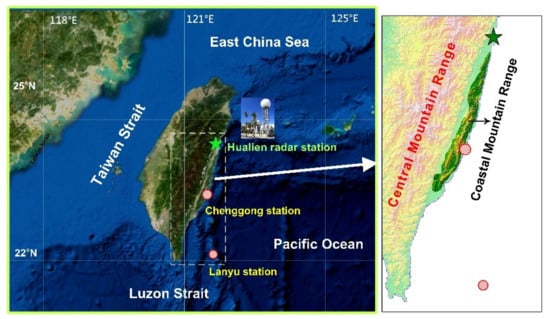
Typhoons are extreme weather systems that occur more frequently during summer and fall in Taiwan. Typhoons mostly originate in the intertropical convergence zone, with the strongest typhoons created in the western North Pacific and the South China Sea. Approximately 25.7 typhoons are formed on average each year, and the strong winds and rainstorms generated by landfall affect hydrological cycles in East Asia [1,2]. Taiwan is positioned at 120–122° east and 22–25° north in the West Pacific (Figure 1), and its terrain is mostly steep hills. Due to the simultaneous influence of monsoons, ocean climate, and West Pacific typhoons, climate conditions easily form extreme weather systems that are highly destructive; the extreme rainfall and strong winds brought by typhoons are the cause of the most serious disasters in Taiwan [3,4,5].
Figure 1.
Locations of Hualien weather surveillance radar and Chenggong and Lanyu ground stations.
Remote sensing, by definition, refers to the gathering of information regarding objects or media (e.g., ground, rivers, oceans, and atmosphere) without contact. The information is obtained through interaction of electromagnetic or acoustic waves with the media or objects by using passive or active instruments. Remote sensing instruments and rain gauges are the tools most often used to measure hydrometeorological parameters in research [6,7,8]. Most meteorological radars are set up on the ground, and scan clouds or falling water drops near the radar station (e.g., maximum scan radius = approximately 450 km for S-band radar) in a 360° omnidirectional rotation using multiple elevation angles from the bottom upwards. Because of radars’ higher resolution and real-time data acquisition, many radar rainfall prediction systems employ the relationship between radar reflectivity and rainfall intensity, expressed as the relationship between radar reflectivity (Z) and rainfall rate (R); for instance, the Marshall–Palmer formula [9] (Z = 200 R1.6 where Z is in mm6/m3 and R is in mm/h) converts radar reflectivity into rainfall rate. Numerous studies have analyzed and explored radar reflectivity-based rainfall estimations [10,11,12,13,14,15,16,17]. For example, Borga et al. [18] used high-resolution radar rainfall fields and space–time distributed hydrological models to evaluate the rainfall runoff during storm floods. Gabella et al. [19] used radar reflectivity to improve the accuracy of rainfall estimations in complex terrains. Seo and Breidenbach [20] used rain gauge measurements to correct nonuniform spatial deviations in radar rainfall parameters in real time. Libertino et al. [21] developed a quasi-real-time procedure for an adaptive (in space and time) estimation of the Z–R relationship. Tang and Matyas [22] presented a methodology to forecast a tropical cyclone rainfall distribution up to 8 h into the future using a high-resolution Doppler radar reflectivity mosaic in a large analytical domain. Chen et al. [23] reported the vertical structures of raindrop size distribution features and quantitative precipitation estimation parameters of two main synoptic systems, typhoons and meiyu/baiu fronts, based on summer observations with a ground-based impact disdrometer and a vertically pointing radar.
Radar reflectivity is highly correlated with rainfall estimation. However, few studies have compared errors in rainfall estimates from a single scan with estimates from scans at multiple elevations; for example, the terrain might block the radar reflectivity, making rainfall conditions behind the mountains unobservable. This results in radar reflectivity that might result in the miscalculation of the actual rainfall in a specific location. The aim of this study was to develop an optimal estimation model for rainfall retrievals during typhoons in Taiwan. Usually, the radar system can provide radar reflectivity from various scanning (elevation) angles. Thus, this study used the radar reflectivity from various elevation angles as input variables for retrieval models and evaluated the optimal elevation angles. In the rainfall retrieval models established in the study, additional inputs included ground meteorological attributes as well as radar reflectivity. The meteorological attributes were obtained using the land-based weather stations affiliated with Taiwan’s Central Weather Bureau (CWB) and located at Chenggong and Lanyu. The data collected from the weather stations comprised the following: pressure, temperature, humidity, solar radiation, rainfall, and wind at or near the ground. The presented retrieval models used the data combination of radar reflectivity and ground meteorological attributes with a specific gauge instrument. In practice, the meteorological attributes should be obtained in advance. Fortunately, because Taiwan has a tight cluster of automatic rainfall stations, sufficient ground meteorological attributes of an arbitrary location can be obtained. However, when a location lacks an automatic rainfall station, one could obtain the meteorological attributes through a self-built meteorological instrument.
An increased number of input variants necessitates the use of newer algorithms for high-dimensional and nonlinear regression models. With the rapid development of artificial intelligence (AI), regression-type models have become one of the key algorithms in machine learning (ML) and are used to solve high-dimensional and nonlinear problems [24,25,26,27,28,29]. Therefore, an increasing number of scholars have used advanced regression algorithm models and applied them to rainfall estimation problems to gain more precise estimation values. Some renowned ML models are support vector regression (SVR), artificial neural networks (ANNs), Bayesian networks, decision trees, and random forests [30,31,32,33,34,35,36,37,38,39,40]. Moreover, studies have used radar reflectivity in ML models; for example, Chiang et al. [41] used radar reflectivity in dynamic neural networks for rainfall estimation and prediction, in addition to weather radar data in ANNs—which are capable of processing complex nonlinear relationships—to conduct quantitative precipitation estimation. Wei [42] developed a typhoon radar reflectivity-based rainfall nowcasting model to operationally predict hourly rainfall. An adaptive network-based fuzzy inference system was developed to estimate precipitation.
In the current study, evaluation process was designed for a typhoon-season rainfall retrieval model. During the design of the process, radar reflectivity values from multiple scanning angles of weather in elevation (i.e., the elevation angles of the antenna) were tested to find the optimal elevation angles. Multiple ML algorithms were used to build a more precise rainfall estimation models, including linear regression (REG), SVR, and extreme gradient boosting (XGBoost). The XGBoost model was developed by Chen and Guestrin [43], and is a popular state-of-the-art algorithm applied in ML. XGBoost is a scalable ML system for tree boosting, which is a highly effective and widely used ML method; XGBoost improves the deficiencies of traditional tree learning algorithms in processing sparse data. Furthermore, XGBoost can simplify learning by models and prevent overfitting; therefore, its calculative abilities are superior to those of traditional gradient boosted decision trees (GBDTs). Dissertations on XGBoost have already been published in the fields of atmospheric composition and atmospheric science, substantiating its usability [44,45,46,47,48]. Currently, there are a few applications in rainfall estimation, such as [49,50]; therefore, this new algorithm was adopted in the present study to improve the accuracy of rainfall retrieval. Furthermore, the Marshall–Palmer formula (hereafter “MP”) proposed in a previous study [9] was used as the benchmark model for the estimation values.
The remainder of this paper is organized as follows. Section 2 introduces the study regions, selected typhoon events, raw radar reflectivity collection, and ground meteorological attributes. Section 3 outlines the rainfall retrieval case design and algorithm theory. Section 4 describes the building of the rainfall retrieval model and its parameter verification, and Section 5 evaluates and discusses the results. Section 6 presents the typhoon simulation results, and Section 7 provides the conclusion.
2. Study Area and Data
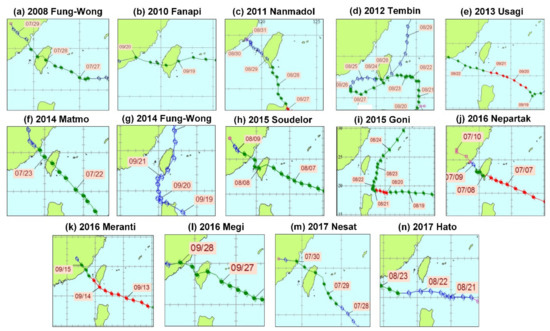
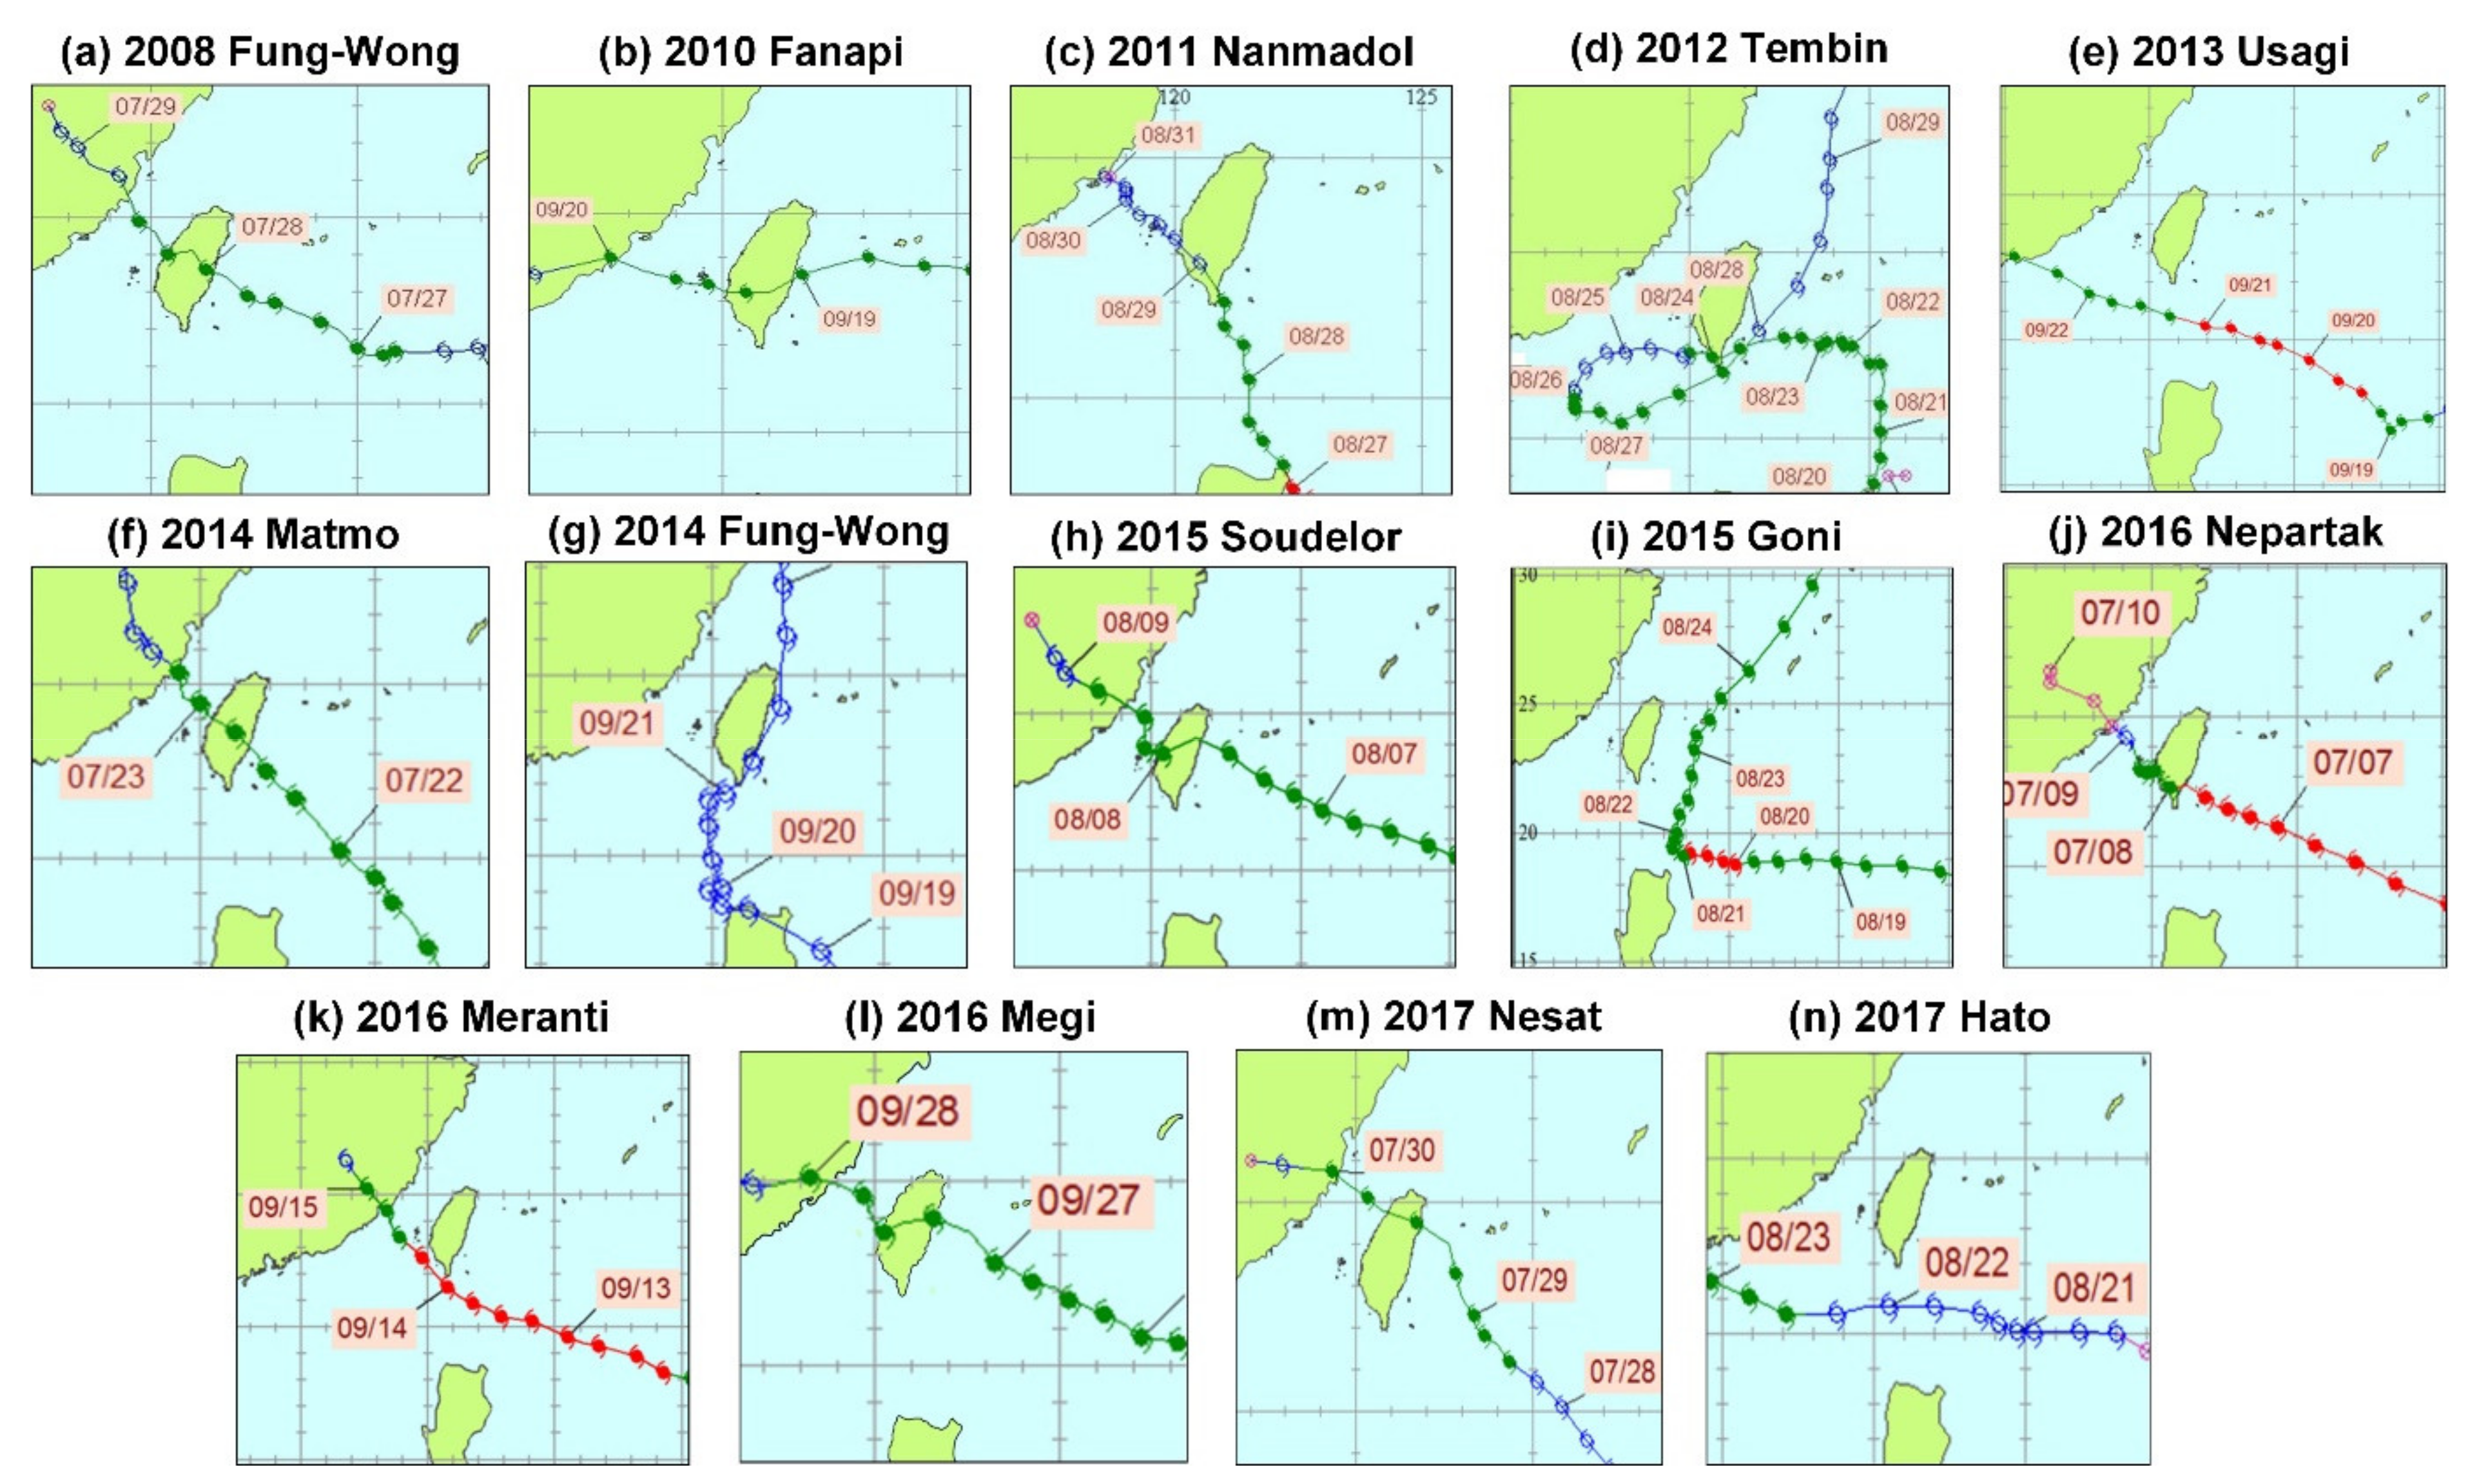
Because typhoons typically move toward Taiwan along an east-to-west path, Chenggong weather station on Taiwan’s east coast and Lanyu weather station in Taiwan’s outlying islands were selected as the study areas (Figure 1). We preliminarily screened for previous typhoons in Taiwan that had moved through the study areas or that had affected Taiwan’s southeastern coastal areas (Figure 2).
Figure 2.
Historical tracks of typhoons during 2008–2017: (a) Fung-Wong, (b) Fanapi, (c) Nanmadol, (d) Tembin, (e) Usagi, (f) Matmo, (g) Fung-Wong, (h) Soudelor, (i) Goni, (j) Nepartak, (k) Meranti, (l) Megi, (m) Nesat, and (n) Hato.
Table 1 presents typhoons that affected the study areas from 2008 to 2017 and their dates, total rainfall, and intensity. Fourteen typhoon events were collected for this study. According to CWB definitions, severe typhoons have maximum windspeeds of 51.0 m/s or higher near the typhoon eye, whereas moderate and mild typhoons have windspeeds of 32.7–50.9 m/s and 17.2–32.6 m/s, respectively. Statistics showed that moderate typhoons are most common (eight occurrences), followed by severe typhoons (five), and mild typhoons (one).
Table 1.
Typhoons affecting the study areas during 2008–2017.
2.1. Radar Reflectivity
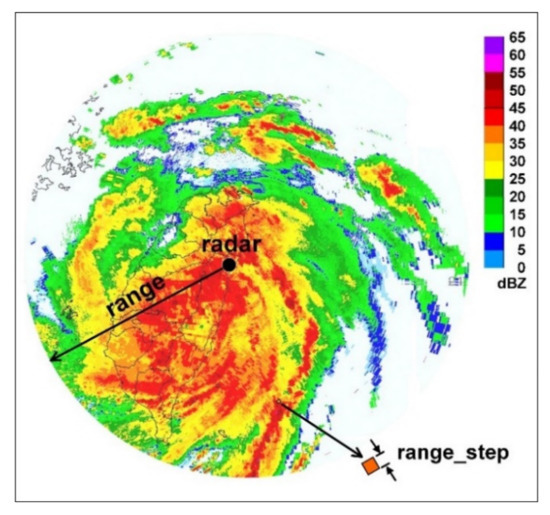
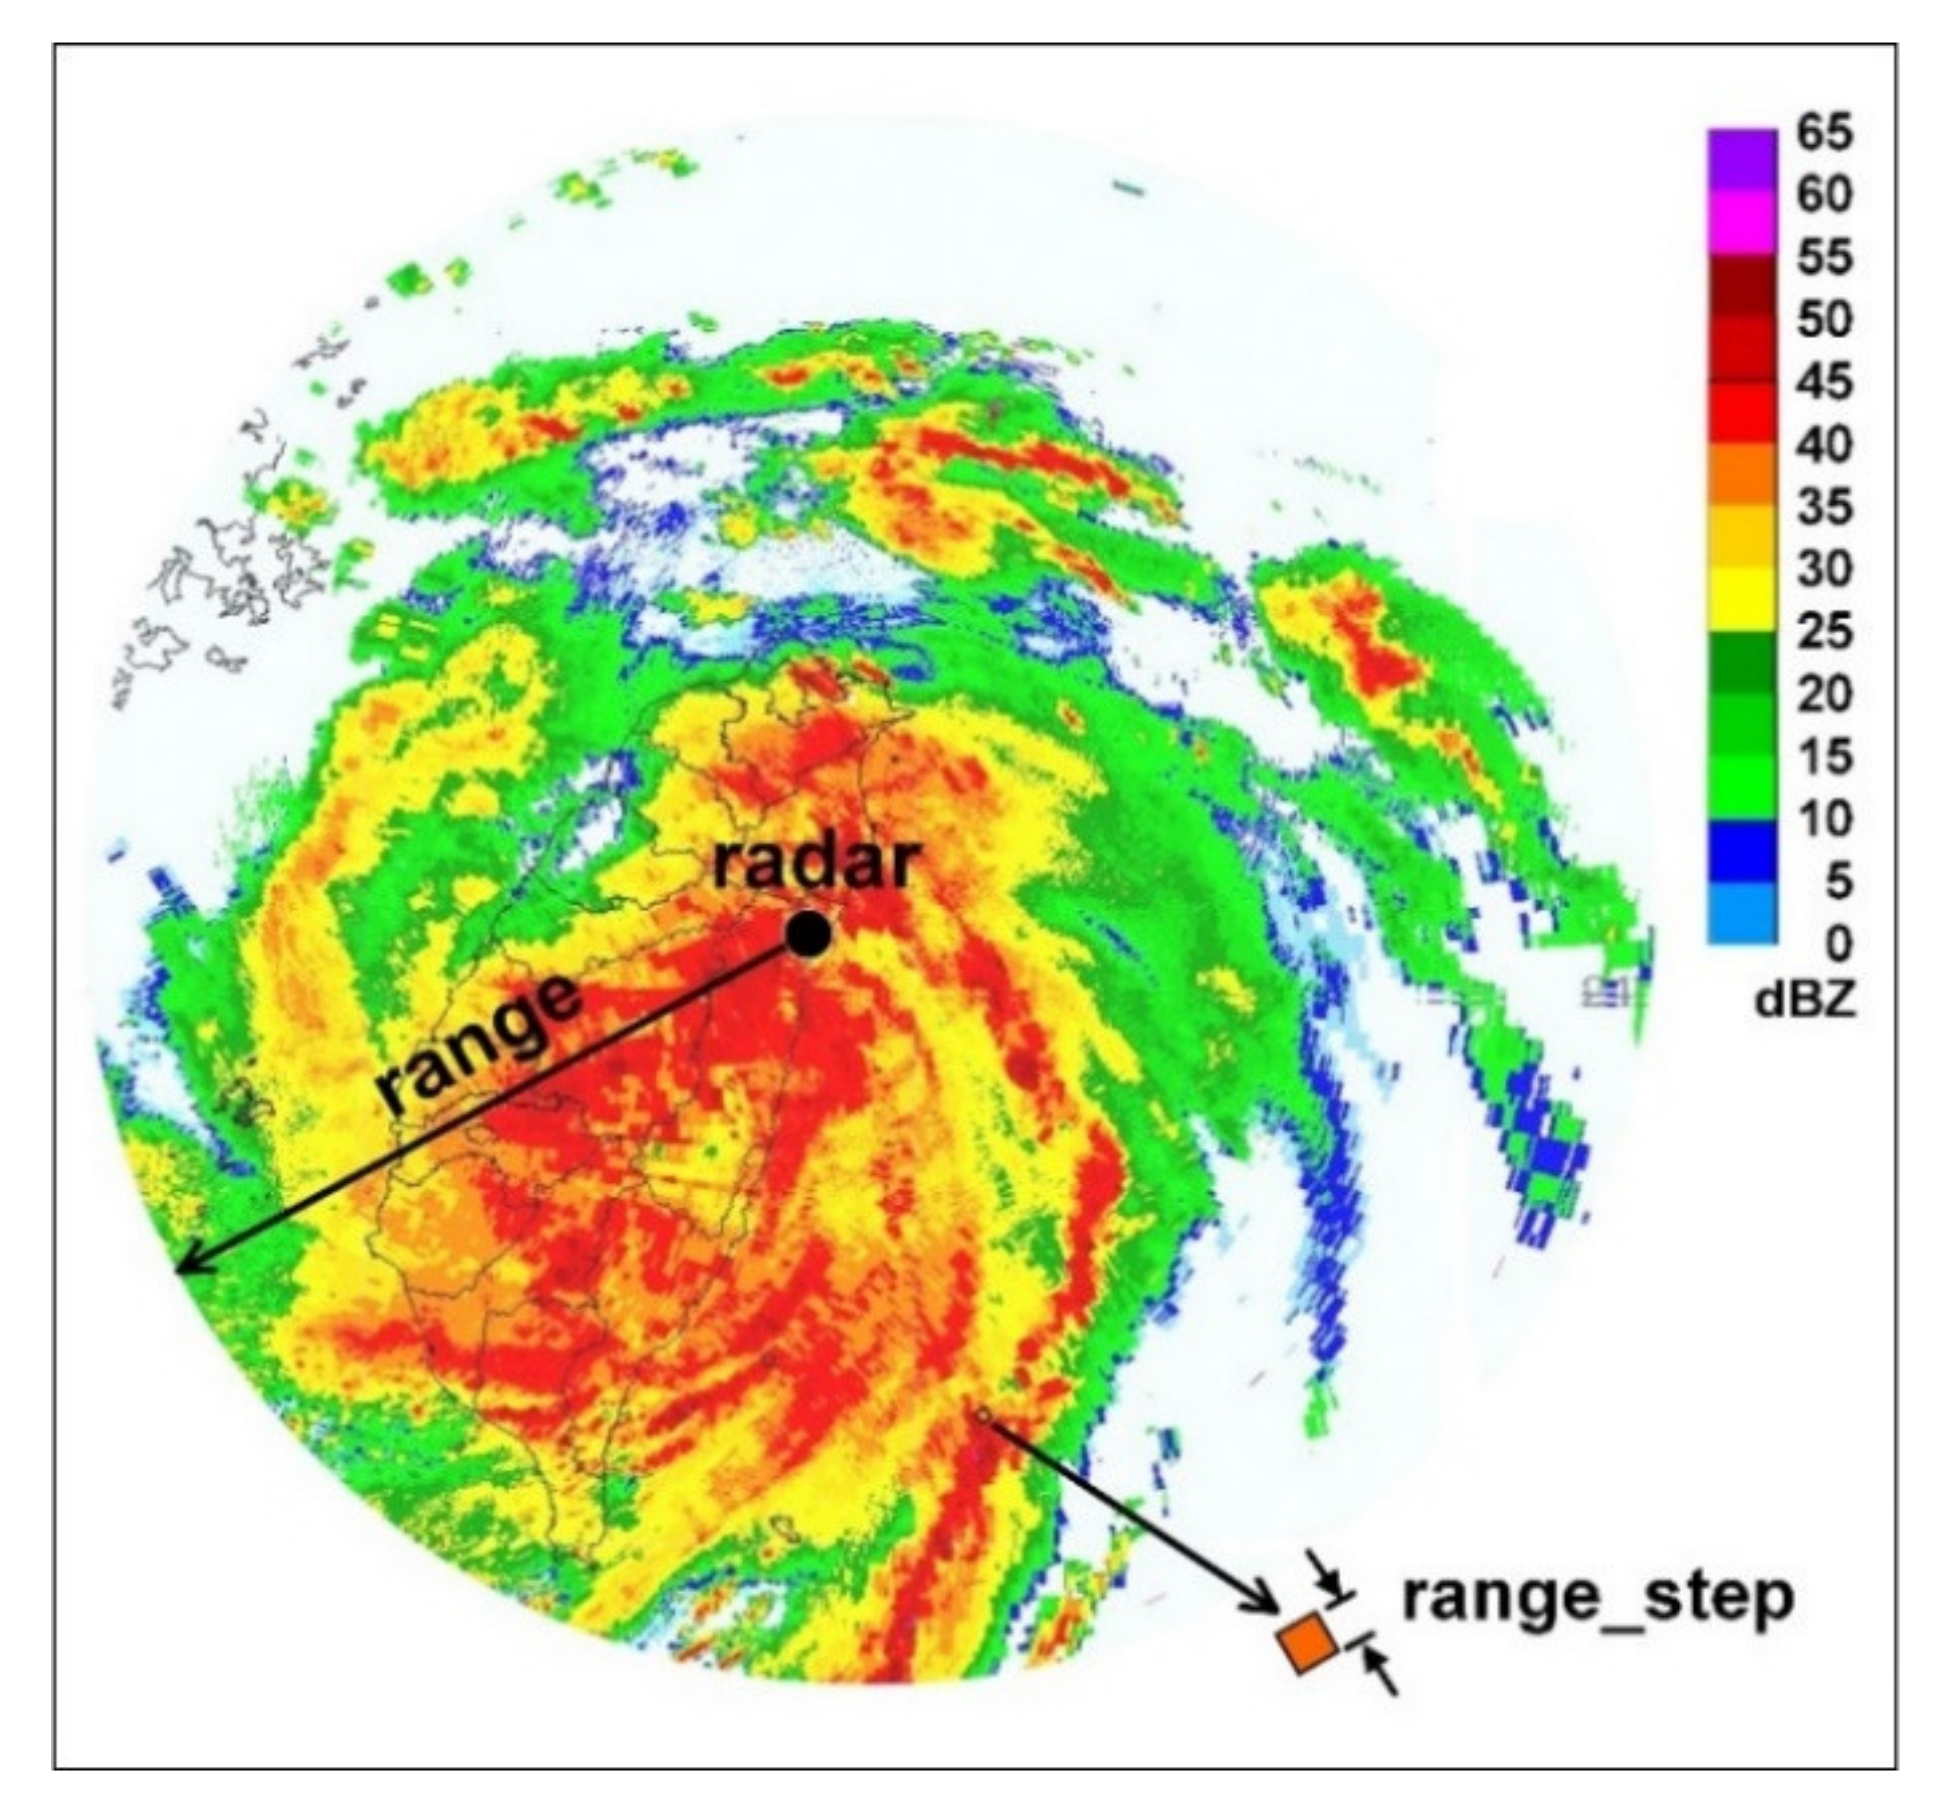
This study used radar reflectivity from Taiwan’s southeastern coastal area and outlying islands recorded by the Hualien Doppler weather surveillance radar (Figure 1). The reflectivity data from this radar in Rainbow® 5 format and CWB hourly observation data were collected for each typhoon that made landfall in Taiwan; the radar reflectivity data over weather stations were collected from scanning results of the CWB’s Doppler weather radar at Hualien. The Volume Cover Pattern (VCP) 21 system used by Hualien radar station can provide radar measurements for nine elevation angles: 0.5, 1.4, 2.4, 3.4, 4.3, 6.0, 9.9, 14.6, and 19.5°. The VCP21 system can complete scanning at nine elevation angles within 6 minutes and, compared with other radar systems (such as VCP11), it has slower antenna rotation, resulting in more precise radar reflectivity and velocity data [51]. Figure 3 displays a radar reflectivity rotating 360° with the radar at the center, where “range” is the scan range for the elevation, and “range_step” is the size of each range bin.
Figure 3.
Schematics of radar reflectivity parameters of range and range_step. (The example is the reflectivity mosaic of Typhoon Matmo at 2014/07/22 1600 UTC; scanning modes in plan position indicator. The mosaic was produced by the Central Weather Bureau (CWB). The dBZ values of 0−30 km from radar center are using the reflectivity from an elevation angle of 6.0°, the dBZ values of 30−180 km are using the average reflectivity from elevation angles between 1.4° and 4.3°, and the dBZ values of greater than 180 km are using the reflectivity from elevation angle of 0.5° [52]).
Google Earth Pro was used to accurately determine the azimuth and the distance between the Hualien radar station and a ground weather station. The azimuth and the distance were 199° and 102 km, respectively, between the Hualien radar station and Chenggong station, and 183° and 218 km, respectively, between the Hualien radar station and Lanyu station. Considering strong winds affecting the rainfall location of raindrops over the ground station, the average value of radar reflectivity generated in larger station-centered grid spaces (i.e., 10 by 10 km) were selected to represent radar reflectivity intensity above the target station.
2.2. Ground Observations
This study used hourly meteorological attributes (2008–2017) from CWB weather stations (Chenggong and Lanyu). Table 2 presents the meteorological attributes and CWB notations (i.e., PS01, PS02, TX01, TX05, RH01, SS02, PP02, RH02, WD01, WD02, WD05, WD06, and PP01). There are 13 attributes at each station.
Table 2.
Meteorological attributes at or near the ground.
Based on the meteorological attributes of the data collected, the number of model input attributes was discovered. However, some attributes may not have exhibited a high degree of correlation with the objective attribute (rainfall). Therefore, suitable attributes were required to be chosen before model construction. A correlation analysis was used to select the meteorological attributes with higher correlations with the rainfall attribute. The correlation coefficient (ρ) is defined as follows:
where x is the independent variable and y is the dependent variable; and are the average values of x and y.
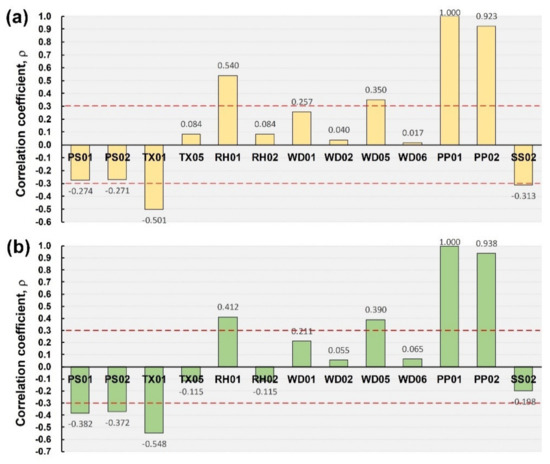
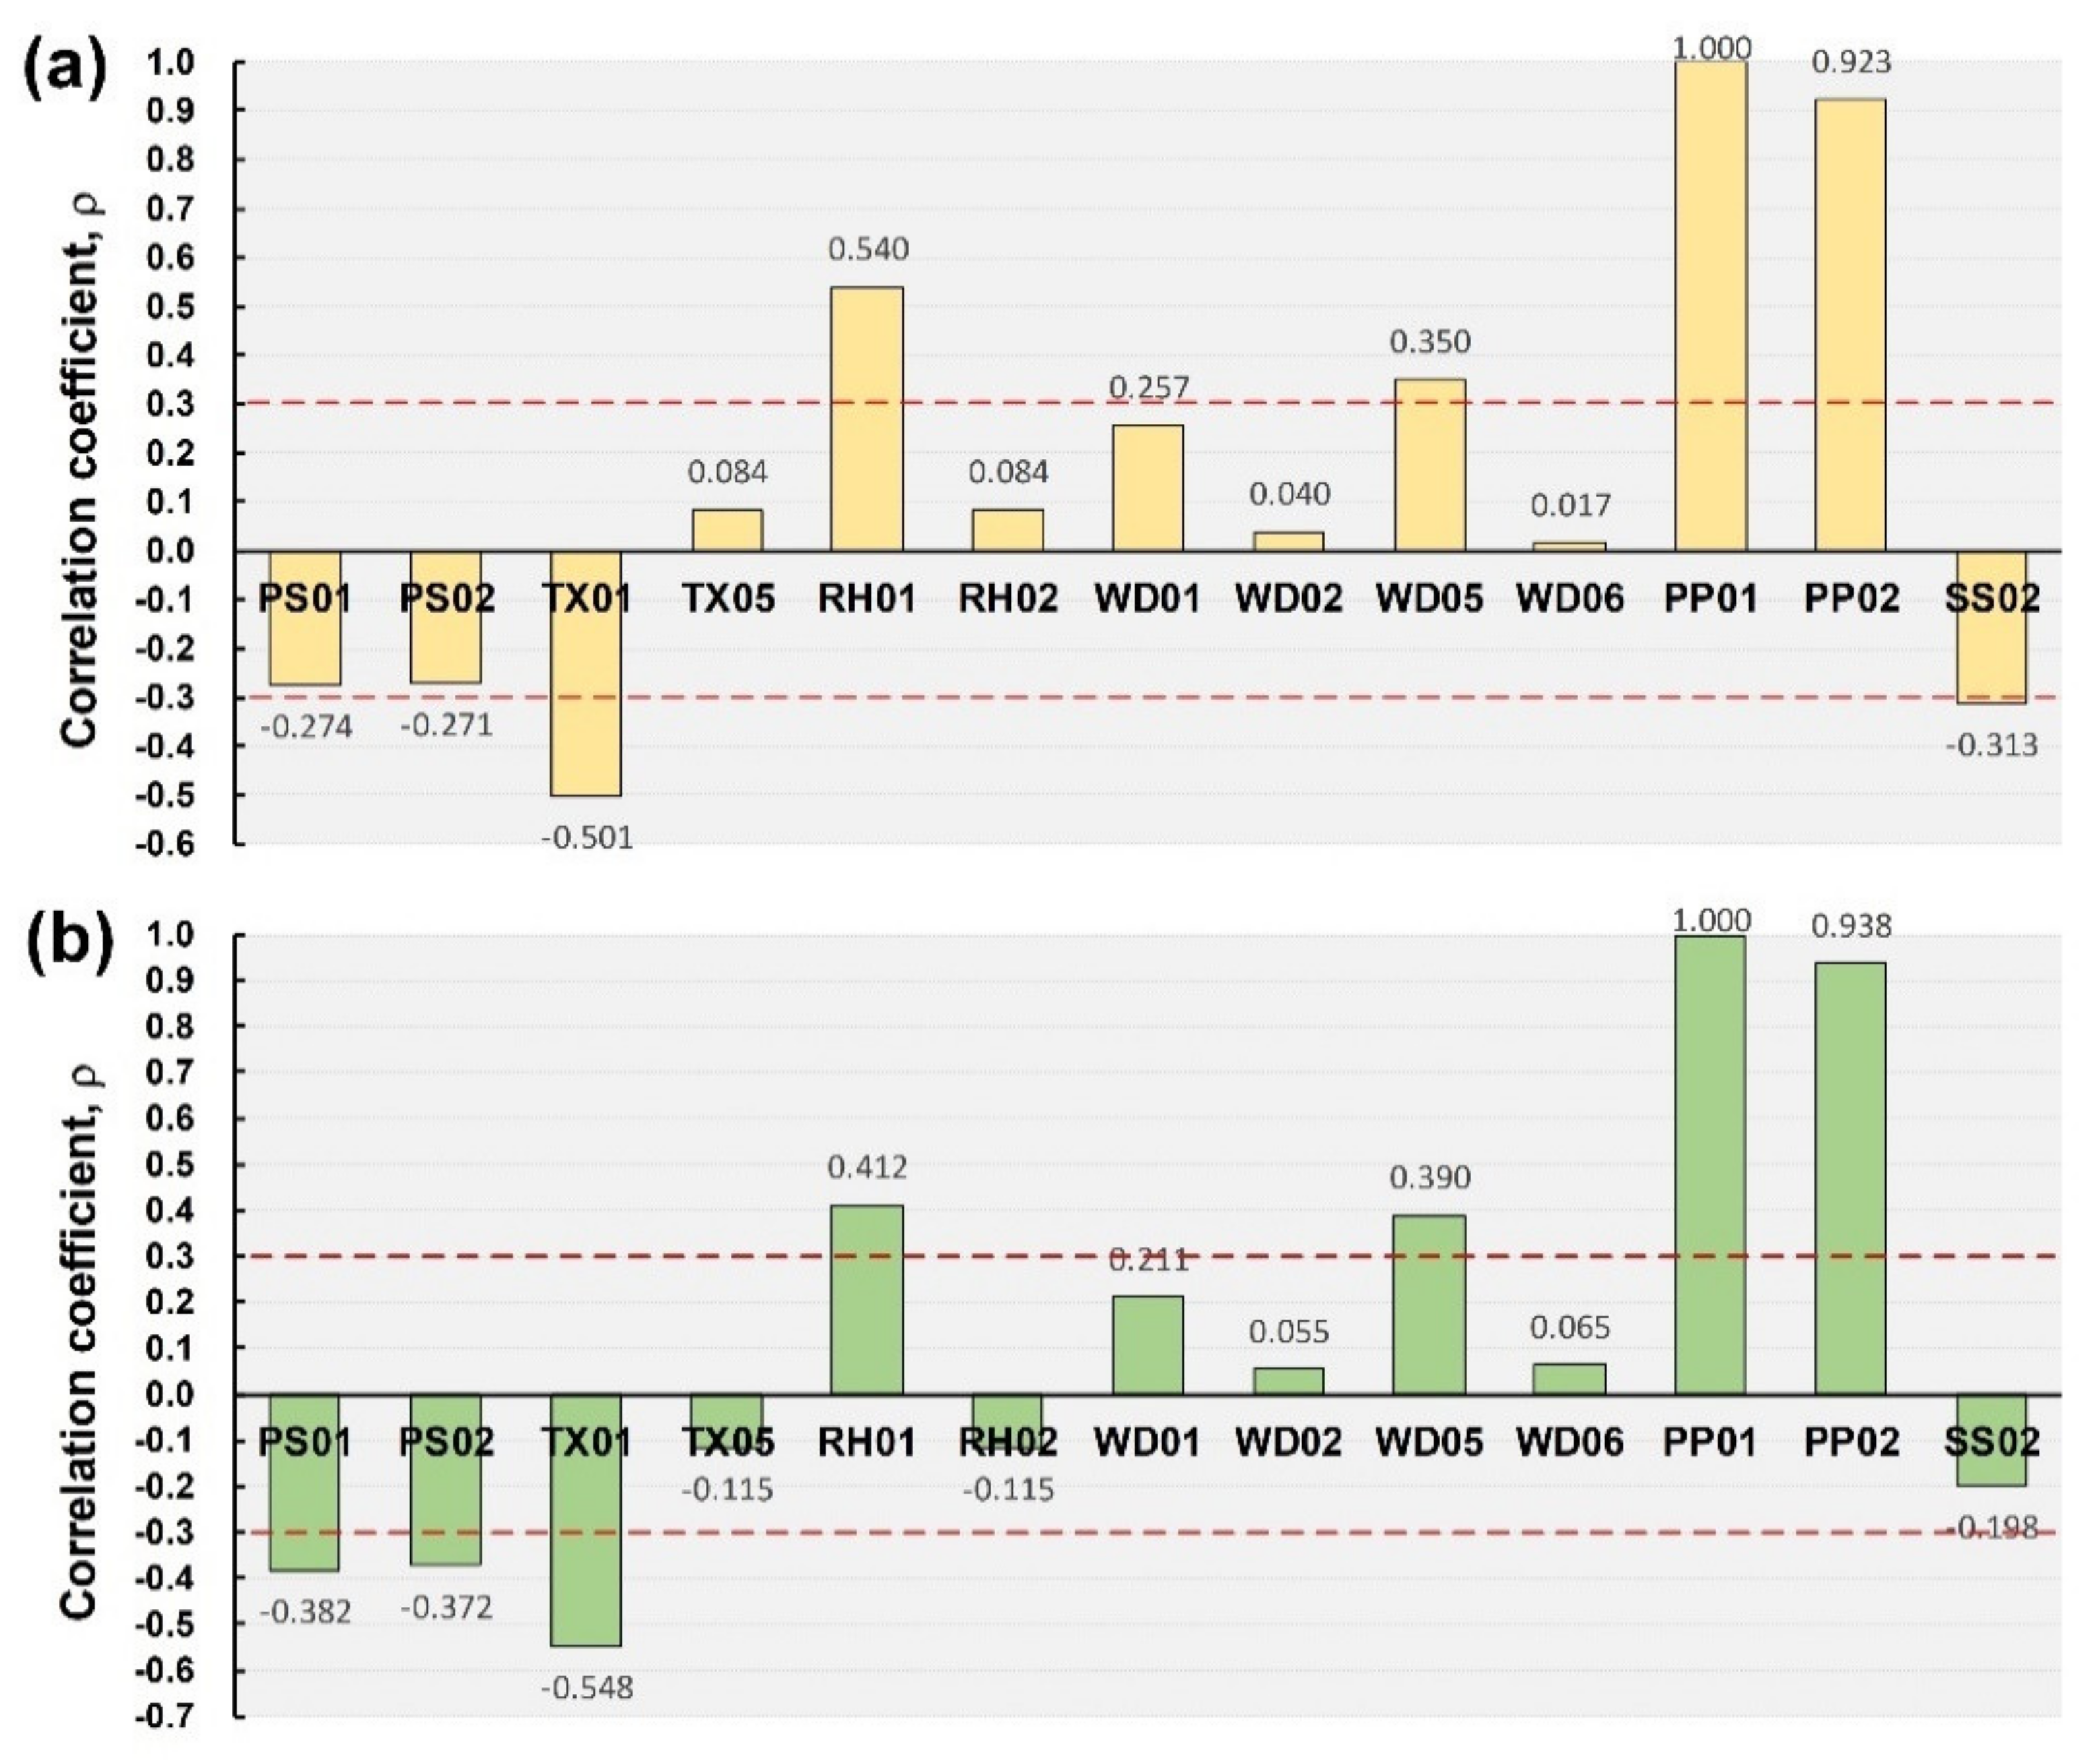
Typically, || > 0.7 represents a strong correlation, and || < 0.3 represents a weak correlation [53]. Based on these definitions, ρ absolute values over 0.3 were adopted as the attribute data in this study. Figure 4 displays the correlation analysis results for each weather station. In the figure, for example, the ρ value of PS01 (−0.274) was computed by Equation (1), where x is the ground air pressure (i.e., PS01) and y is the precipitation (i.e., PP01). Table 3 presents the selected meteorological attributes of Chenggong station (TX01, RH01, WD05, PP01, PP02, and SS02) and Lanyu station (PS01, PS02, TX01, RH01, WD05, PP01, and PP02) and their corresponding statistical values.
Figure 4.
Analysis results of correlation coefficient: (a) Chenggong station; (b) Lanyu station.
Table 3.
Statistical values of the employed data attributes. The collection time ranges from 2008 to 2017 (including 14 typhoon events). The sampling frequency is one hour and a total of 2339 records were collected.
2.3. Dataset Definitions
A total of 2339 hourly records were collected. The data were then divided into three datasets: radar reflectivity {Z}, ground meteorological attributes {G}, and rainfall {R}. The {Z} dataset contained radar reflectivity from all elevation angles, and the mathematical expression was {Z}={Zi}I=1,9, where i represents the radar elevation angles in the VCP21 system (i is from 1 to 9 representing the elevation angles at 0.5, 1.4, 2.4, 3.4, 4.3, 6.0, 9.9, 14.6, and 19.5°, respectively). {G} contained meteorological attributes filtered through correlation analyses, expressed mathematically as {G}={Gk}k=1,6, where k represents the meteorological attributes (for Chenggong station, k is from 1 to 6 representing TX01, RH01, WD05, PP01, PP02, and SS02, respectively; and for Lanyu station, k is from 1 to 7 representing PS01, PS02, TX01, RH01, WD05, PP01, and PP02, respectively). {R} was the rainfall dataset.
3. Case Design and Algorithms
This section presents the process for evaluating the optimal rainfall retrieval model. As illustrated in Figure 5, the various models, including three ML-based models (REG, SVR, and XGBoost) and the MP formula, in addition to the designed cases, were used to build retrieval models. The case designs for the rainfall retrieval model were based on the datasets established in the previous section. The dataset combinations of three cases are described as follows:
Figure 5.
Schematic of the rainfall retrieval model case analysis and evaluation process.
- Case 1 used radar reflectivity {Z} to retrieve rainfall rate. This case used radar reflectivity from every elevation angle as the model input to establish separate models. For example, the radar reflectivity from an elevation angle of 0.5° formulates ML-based rainfall retrieval models (namely subcase 1.1). That is, R = f1(Z1), where f1() can be an ML-based model or the MP formula. Because there were nine elevation angles, nine models were established (i.e., subcases 1.1 to 1.9). An additional model, subcase 1.10, featured a specific model that used radar reflectivity of all elevation angles; that is, R = f2({Zi}i=1,9), where f2() represents using ML-based models.
- Case 2 used meteorological attributes {Gk}k=1,6 of weather stations to retrieve rainfall rate; that is, R = f3({Gk}k=1,6), where f3() represents using ML-based models.
- Case 3 combined reflectivity intensity {Z} and meteorological attributes {G} to retrieve rainfall rate. Nine elevation angles (Z1 to Z9) separately combined with {Gk}k=1,6 can build nine models (i.e., subcases 3.1 to 3.9). For example, for subcase 3.2, R = f4(Z2, {Gk}k=1,6), where f4() represents ML-based models. An additional model, subcase 3.10, featured a specific model that combined meteorological attributes with the radar reflectivity of all elevation angles; that is, R = f5({Zi}i=1,9, {Gk}k=1,6), where f5() represents using ML-based models.
Then, the corresponding performance criteria for the rainfall observation values and rainfall retrieval values were calculated. Based on the comparison results, the optimal calculation model and corresponding dataset were selected.
3.1. Algorithms
This section explains the theoretical bases for the REG, SVR, and XGBoost models.
- 1.
- REG
Linear regression is a crucial and widely used regression technique, and the main strength is that results are easy to interpret. When linear regression is performed for a set of independent variables x = (x1,…xr), r is the number of variables, assuming that the linear regression relationship between y and x is as follows:
where β0, β1, and βr are regression coefficients, and ε is the random error. In this study, rainfall was estimated with datasets {Z} and {G} using linear regression.
y = β0 + β1 x1+ …+ βr xr + ε
- 2.
- SVR
The basic theory of SVR is to find the most suitable hyperplane within a space. Training data were set as (x1, y1),…, (xi, yi), with x as the input characteristic and y representing the characteristic’s corresponding regression value. SVR’s mathematical representation is similar to the following regression formula:
f(x) = w · x + b, w ∈ Rd, b ∈ R
If the difference between the regression value f(xi) and truth value yi is very small, then the predictive value f(x) can be accurately derived after inputting property x, and weight w is the hyperplane sought in SVR.
- 3.
- XGBoost
XGBoost is a novel sparsity-aware algorithm for sparse data and a weighted quantile sketch for approximate tree learning [43]. The basis of XGBoost is gradient boosting (GB). GB iteratively generates models with weaker convergence results in ML and sums each weak model’s predictive results to optimize or minimize the loss function. Boosting can also be defined as raising or improving, and each addition of training generated by the new weak model improves on the previous results [54].
GB is simply a framework in which different algorithms can be entered, the most common being decision trees. The classic classification and regression tree was used in this study, and can also be referred to as GBDT [55]. Because each algorithm generates residuals, each subsequent calculation will establish a new algorithm calculation based on the gradient direction of the previous residual reduction, and the residual will decrease with multiple iterations. The derivation process of the GB formula is explained as follows.
The optimal prediction function F′(x) minimizes L(y, F(x)) projected by x onto y:
where F(x) is the function of weak classifier P={P1,P2,…}.
The weak classifier equation can be expressed as:
where αm is the parameter of the mth regression tree, and βm is the weight of the same tree in the prediction function.
The mth weak classifier is expressed as ; therefore, the prediction function can be expressed as:
The mth weak classifier in Equation (6) should be established on the prediction loss function generated by the m−1 weak classifier to predict the direction of descent; represents the direction in which the mth iteration weak classifier is built, and the formula is:
αm and βm can be expressed as follows:
To avoid overfitting, each weak classifier is typically multiplied by the learning rate v:
XGBoost is built on the basis of this derivation formula and has two more Taylor expansions than GB when calculating residuals; as a result, XGBoost has superior convergence in its loss function prediction.
3.2. Programming Tools
The SVR and XGBoost models were implemented using the open-source scikit-learn and Keras libraries in Python 3.7 (Python Software Foundation, Wilmington, DE, USA [56,57]). Because CWB radar reflectivity data were stored as Rainbow® 5 files, Python wradlib modules were then used to analyze the data and obtain the radar reflectivity.
3.3. Performance Criteria
The performance criteria used in this study included the root mean square error (RMSE), mean absolute error (MAE), relative RMSE (rRMSE), relative MAE (rMAE), and efficiency coefficient (CE). The formulas are defined as follows:
where N is the number of data records; is the ith observation value; is the ith retrieval value; is the average observation value; and is the average retrieval value.
4. Modeling
Because there were only 14 typhoon events, this study adopted the following approach to use data to effectively improve the quality of model training. During a testing typhoon, the data for the other 13 typhoons were used as the training and validation dataset; the trained model parameters were then used in the simulation of the testing typhoon. During another testing typhoon, the same approach was used for model building and the simulation of the testing typhoon.
The model training and validation process in this study used 10-folder cross-validation, in which 90% of the data were randomly selected as training data each time; the remaining 10% were used as validation data and not repeated until all of the data had been part of the 10% testing set. Lastly, the final accurate value was obtained by averaging the results of each test set. The four typhoons with the greatest rainfall were selected as the testing typhoons: Tembin in 2012 (459 mm), Nepartak in 2016 (399 mm), Matmo in 2014 (394 mm), and Nanmadol in 2011 (360 mm).
4.1. Parameter Calibration
This section discusses the processes used to verify and optimize the parameters of the SVR and XGBoost models. Possible values for the parameters were searched for in the process to execute the model’s best-fit data capabilities. Parameters were calibrated through trial and error; that is, a single parameter was fixed and another parameter was adjusted to verify which parameter combination had a lower error. Because of the many case models designed in this study, the verification process for model parameters in Cases 1–3 and their optimal results are explained using the examples of Chenggong station with a radar angle of 6.0° and Lanyu station with a radar angle of 4.3°.
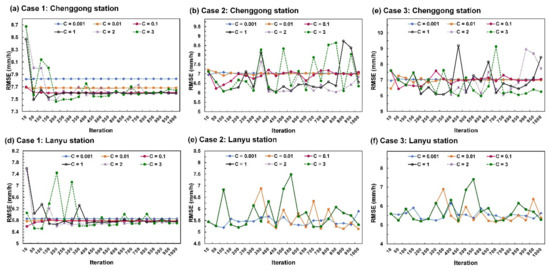
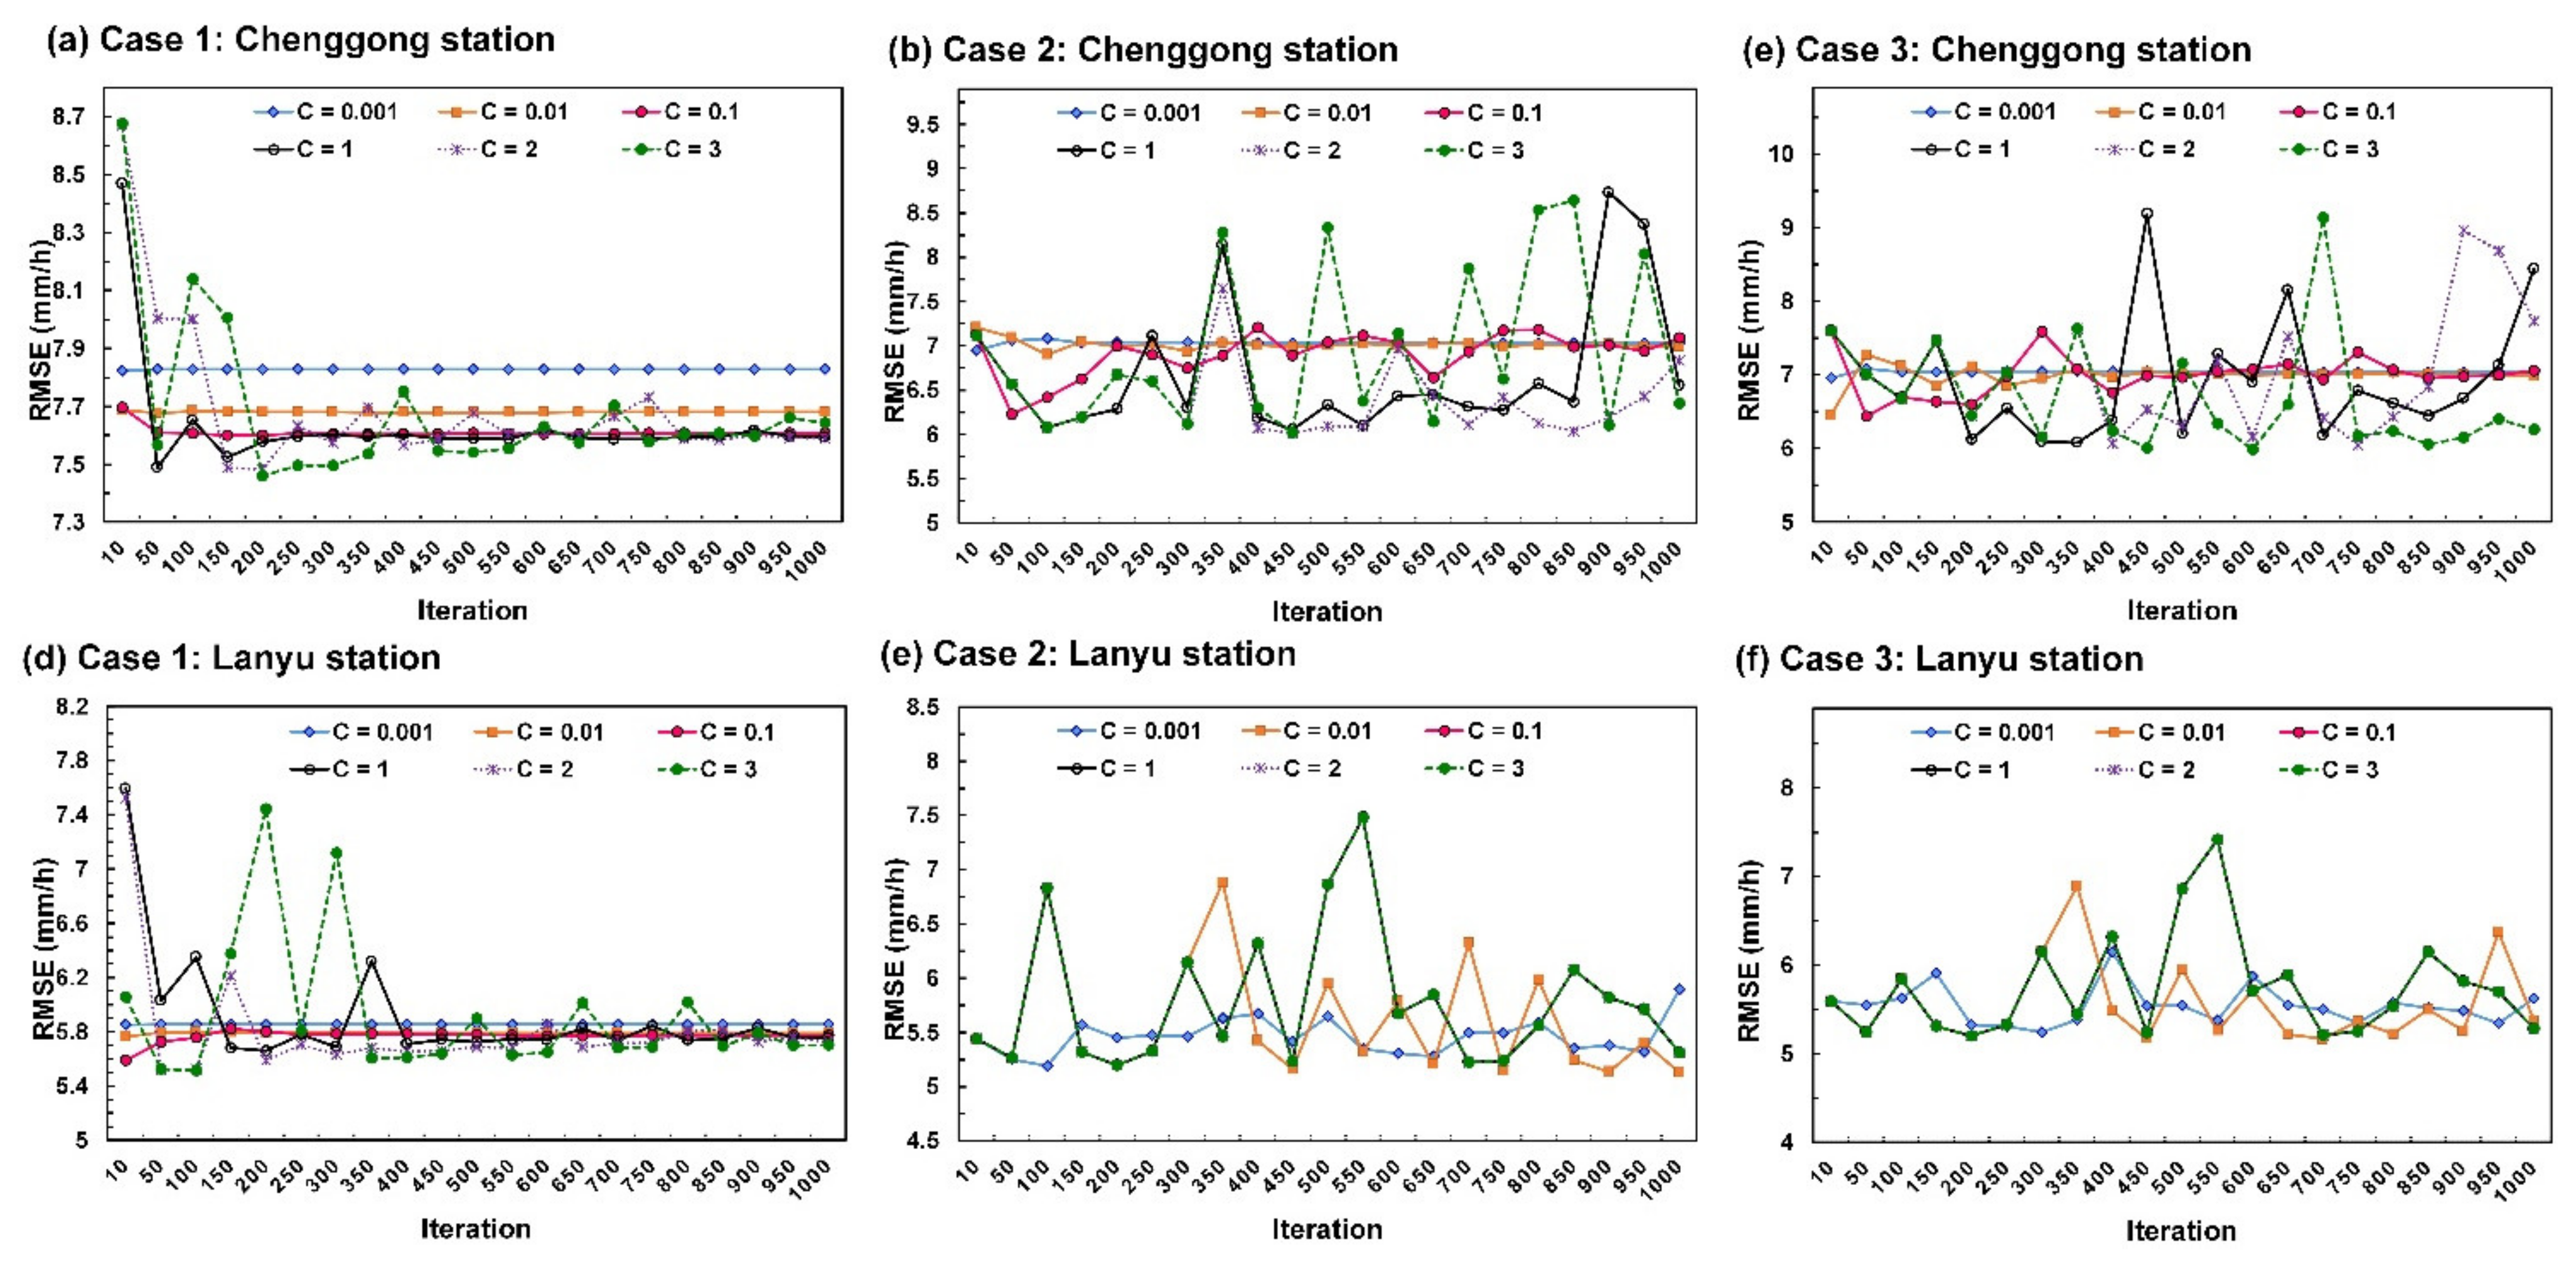
Figure 6 displays the verification results for the SVR models, for which the main parameters were penalty coefficient C. The C represents the degree of punishment for samples outside the margin, and the value is related to the degree of tolerance of error. The C values of 0.001, 0.01, 0.1, 1, 2, and 3 were used for verification in this study, with 10 to 1000 iterations. First, the RMSE for each iteration was drawn, fixing the C value at 0.001 and so on for every C value, to determine the smallest parameter for RMSE. The results showed that the optimal C values for Chenggong station for Cases 1–3 were 3, 2, and 3, respectively, whereas the optimal C values for Lanyu station in Cases 1–3 were 3, 0.01, and 0.01, respectively.
Figure 6.
Parameter C verification results for SVR models in Cases 1–3: (a–c) Chenggong station at a radar elevation angle of 6.0°; and (d–f) Lanyu station at a radar angle of 4.3°.
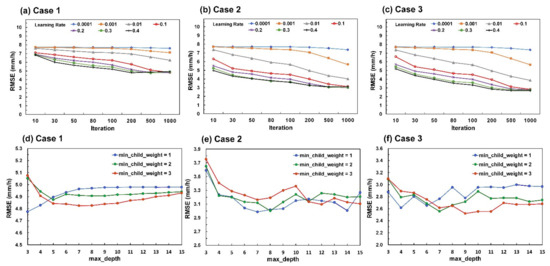
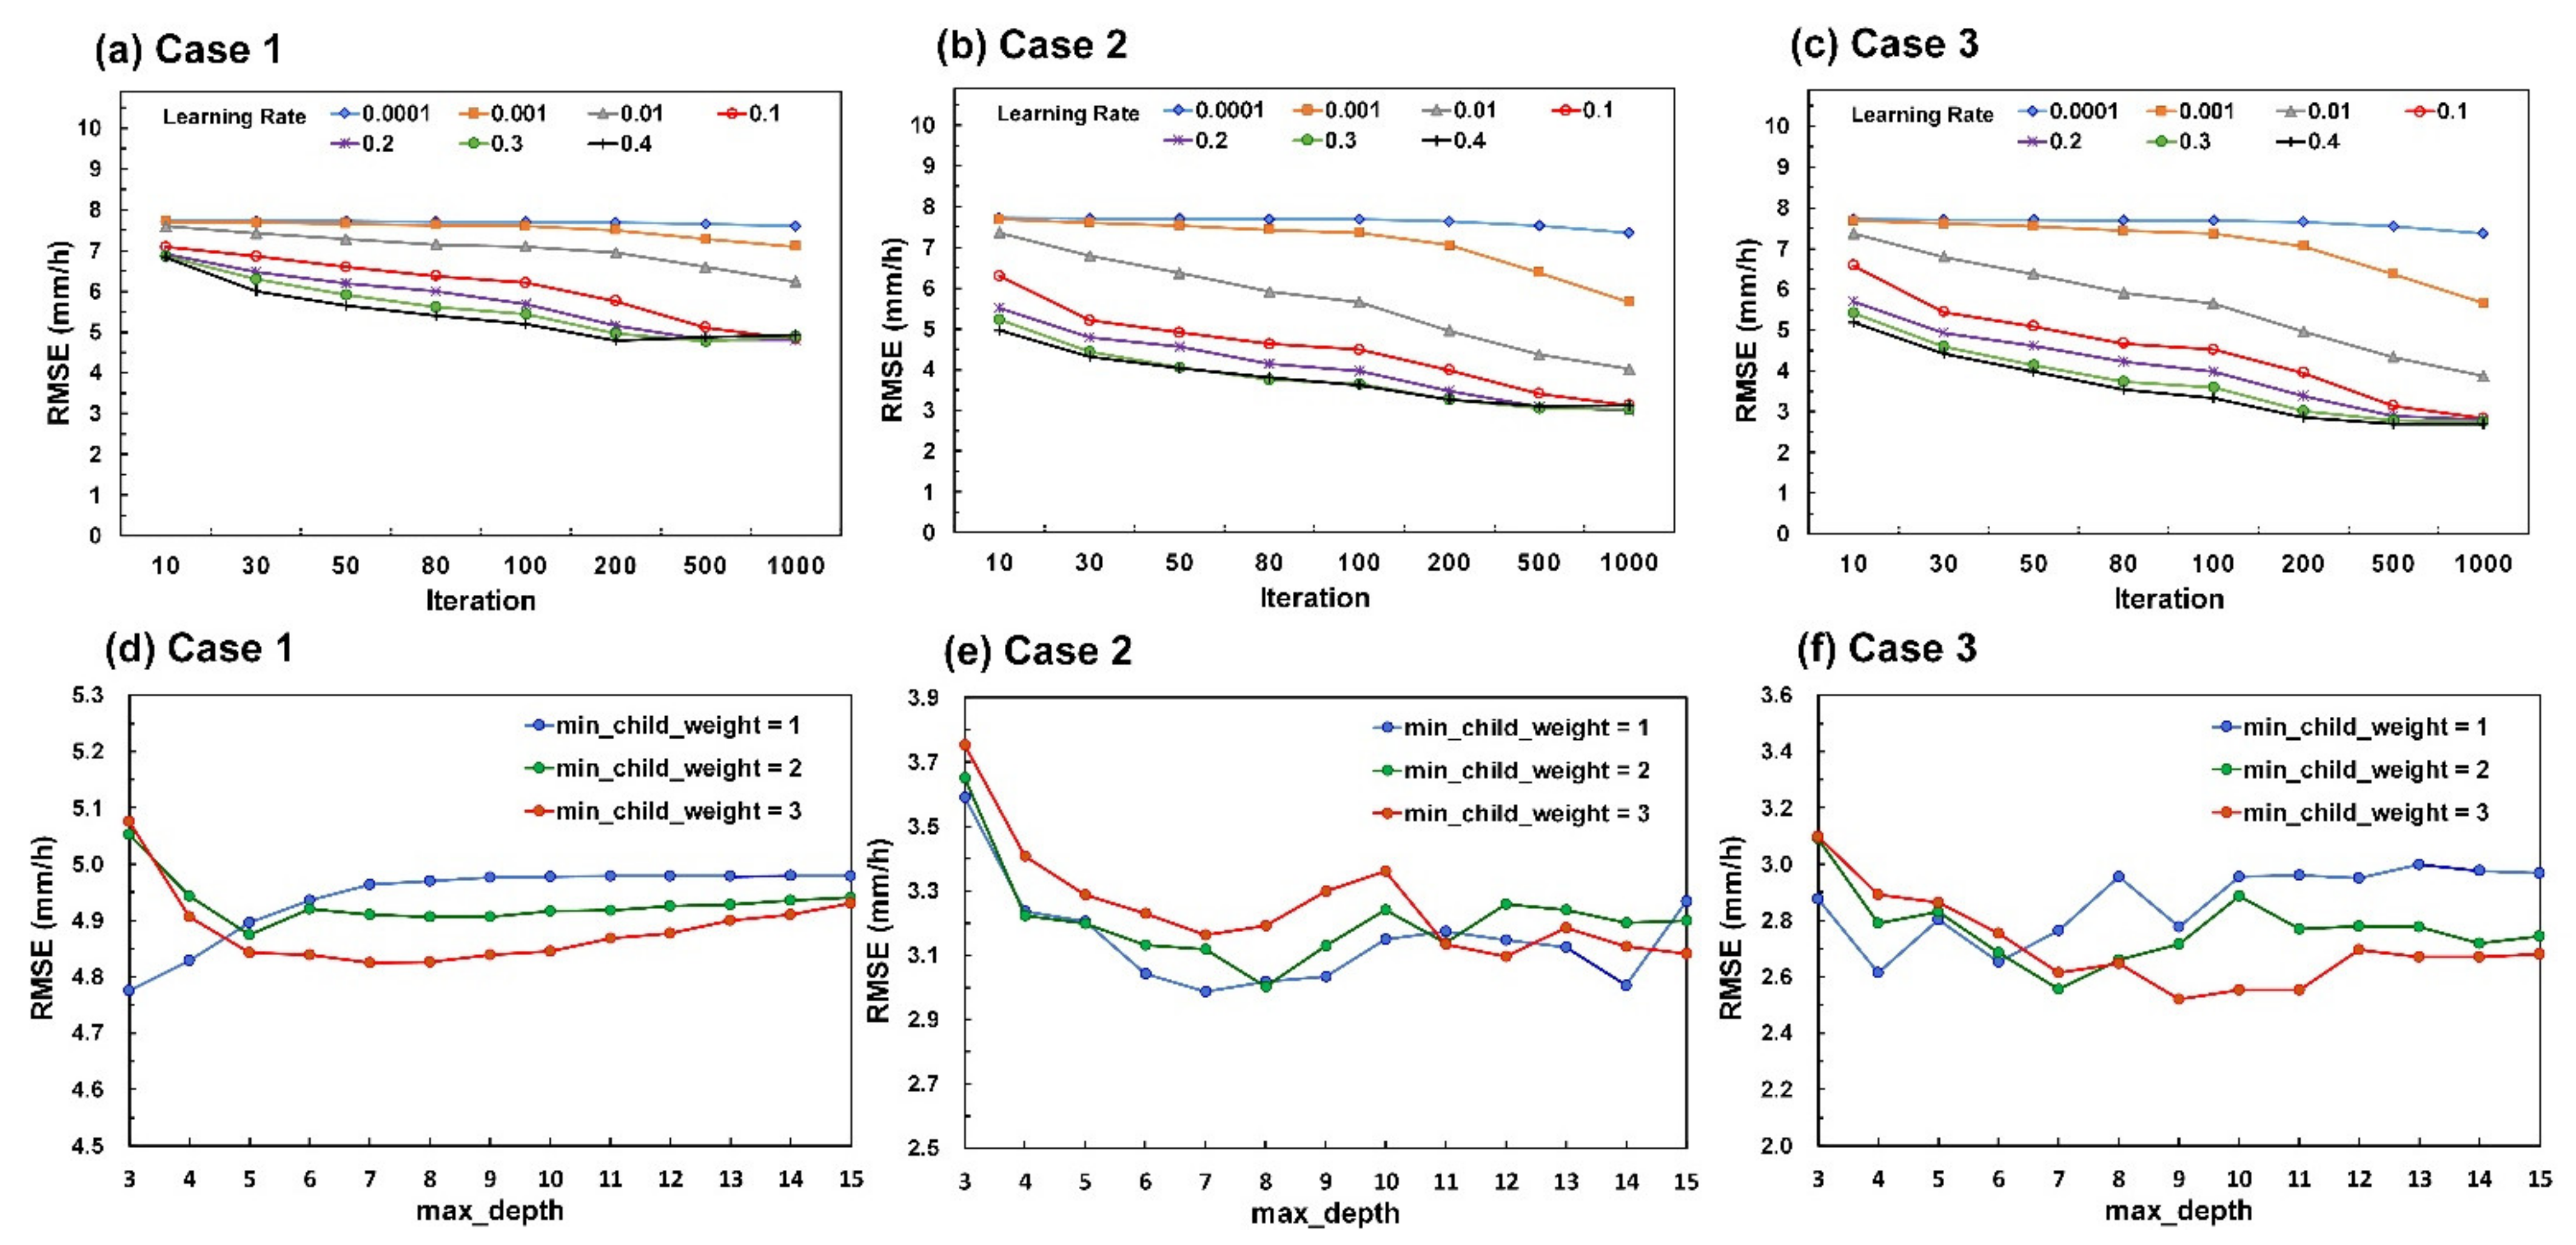
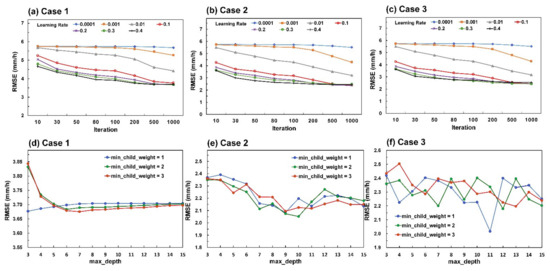
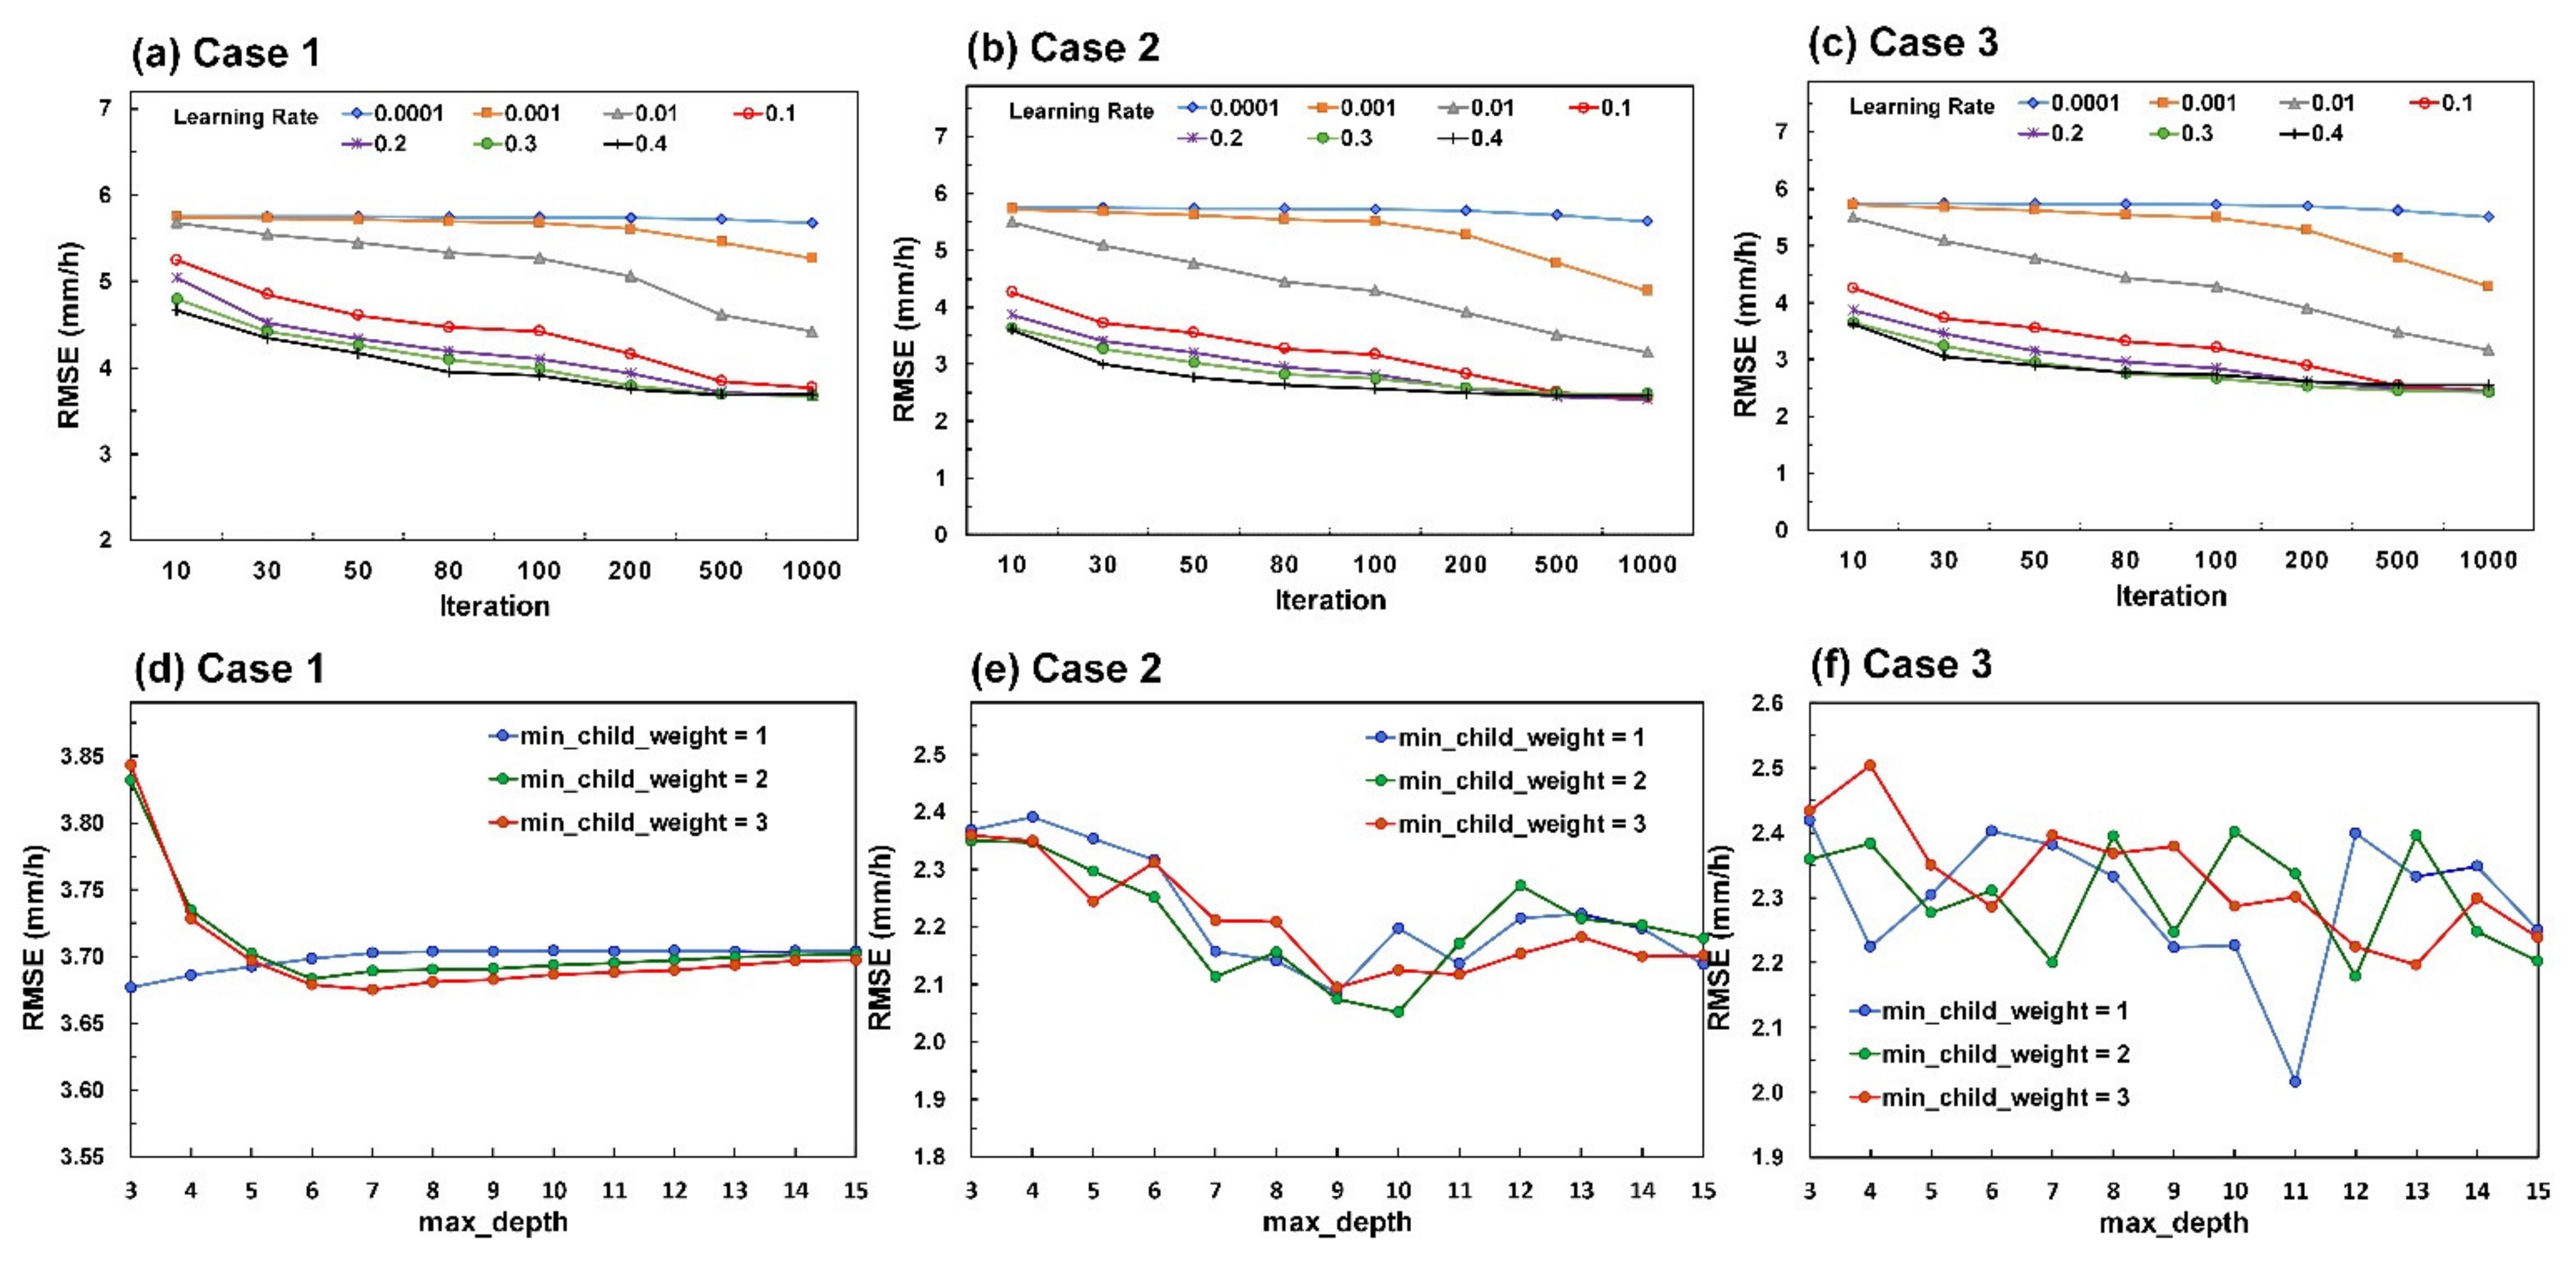
Figure 7 and Figure 8 present the verification results of the XGBoost models; XGBoost parameters include learning rate, min_child_weight, and max_depth. The min_child_weight refers to the minimum sum of instance weight needed in a child, and the max_depth is used to prevent overfitting, to avoid the tree growing very deep. The scope of the verification learning rate was 0.0001, 0.001, 0.01, 0.1, 0.2, 0.3, and 0.4, with 10 to 1000 iterations; min_child_weight was configured at 1, 2, and 3 for verification, and the max_depth verification scope was 3 to 15. Parameters were verified using trial and error, first by fixing the learning rate and adjusting the iterations to obtain the smaller parameter set in RMSE. Once the optimal learning rate parameter was obtained, the optimal parameter sets for min_child_weight and max_depth were verified. Table 4 lists the verification results for the optimal XGBoost model parameters in Cases 1–3.
Figure 7.
XGBoost model verification results for Cases 1–3 of Chenggong station at a radar elevation angle of 6.0°: (a–c) learning rate; (d–f) min_child_weight and max_depth.
Figure 8.
XGBoost model verification results for Cases 1–3 of Lanyu station at a radar angle of 4.3°: (a–c) learning rate; (d–f) min_child_weight and max_depth.
Table 4.
Verification results for optimal XGBoost model parameters in Cases 1–3.
4.2. Model Performance
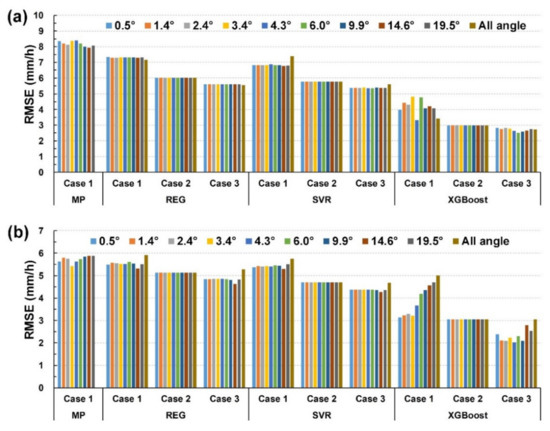
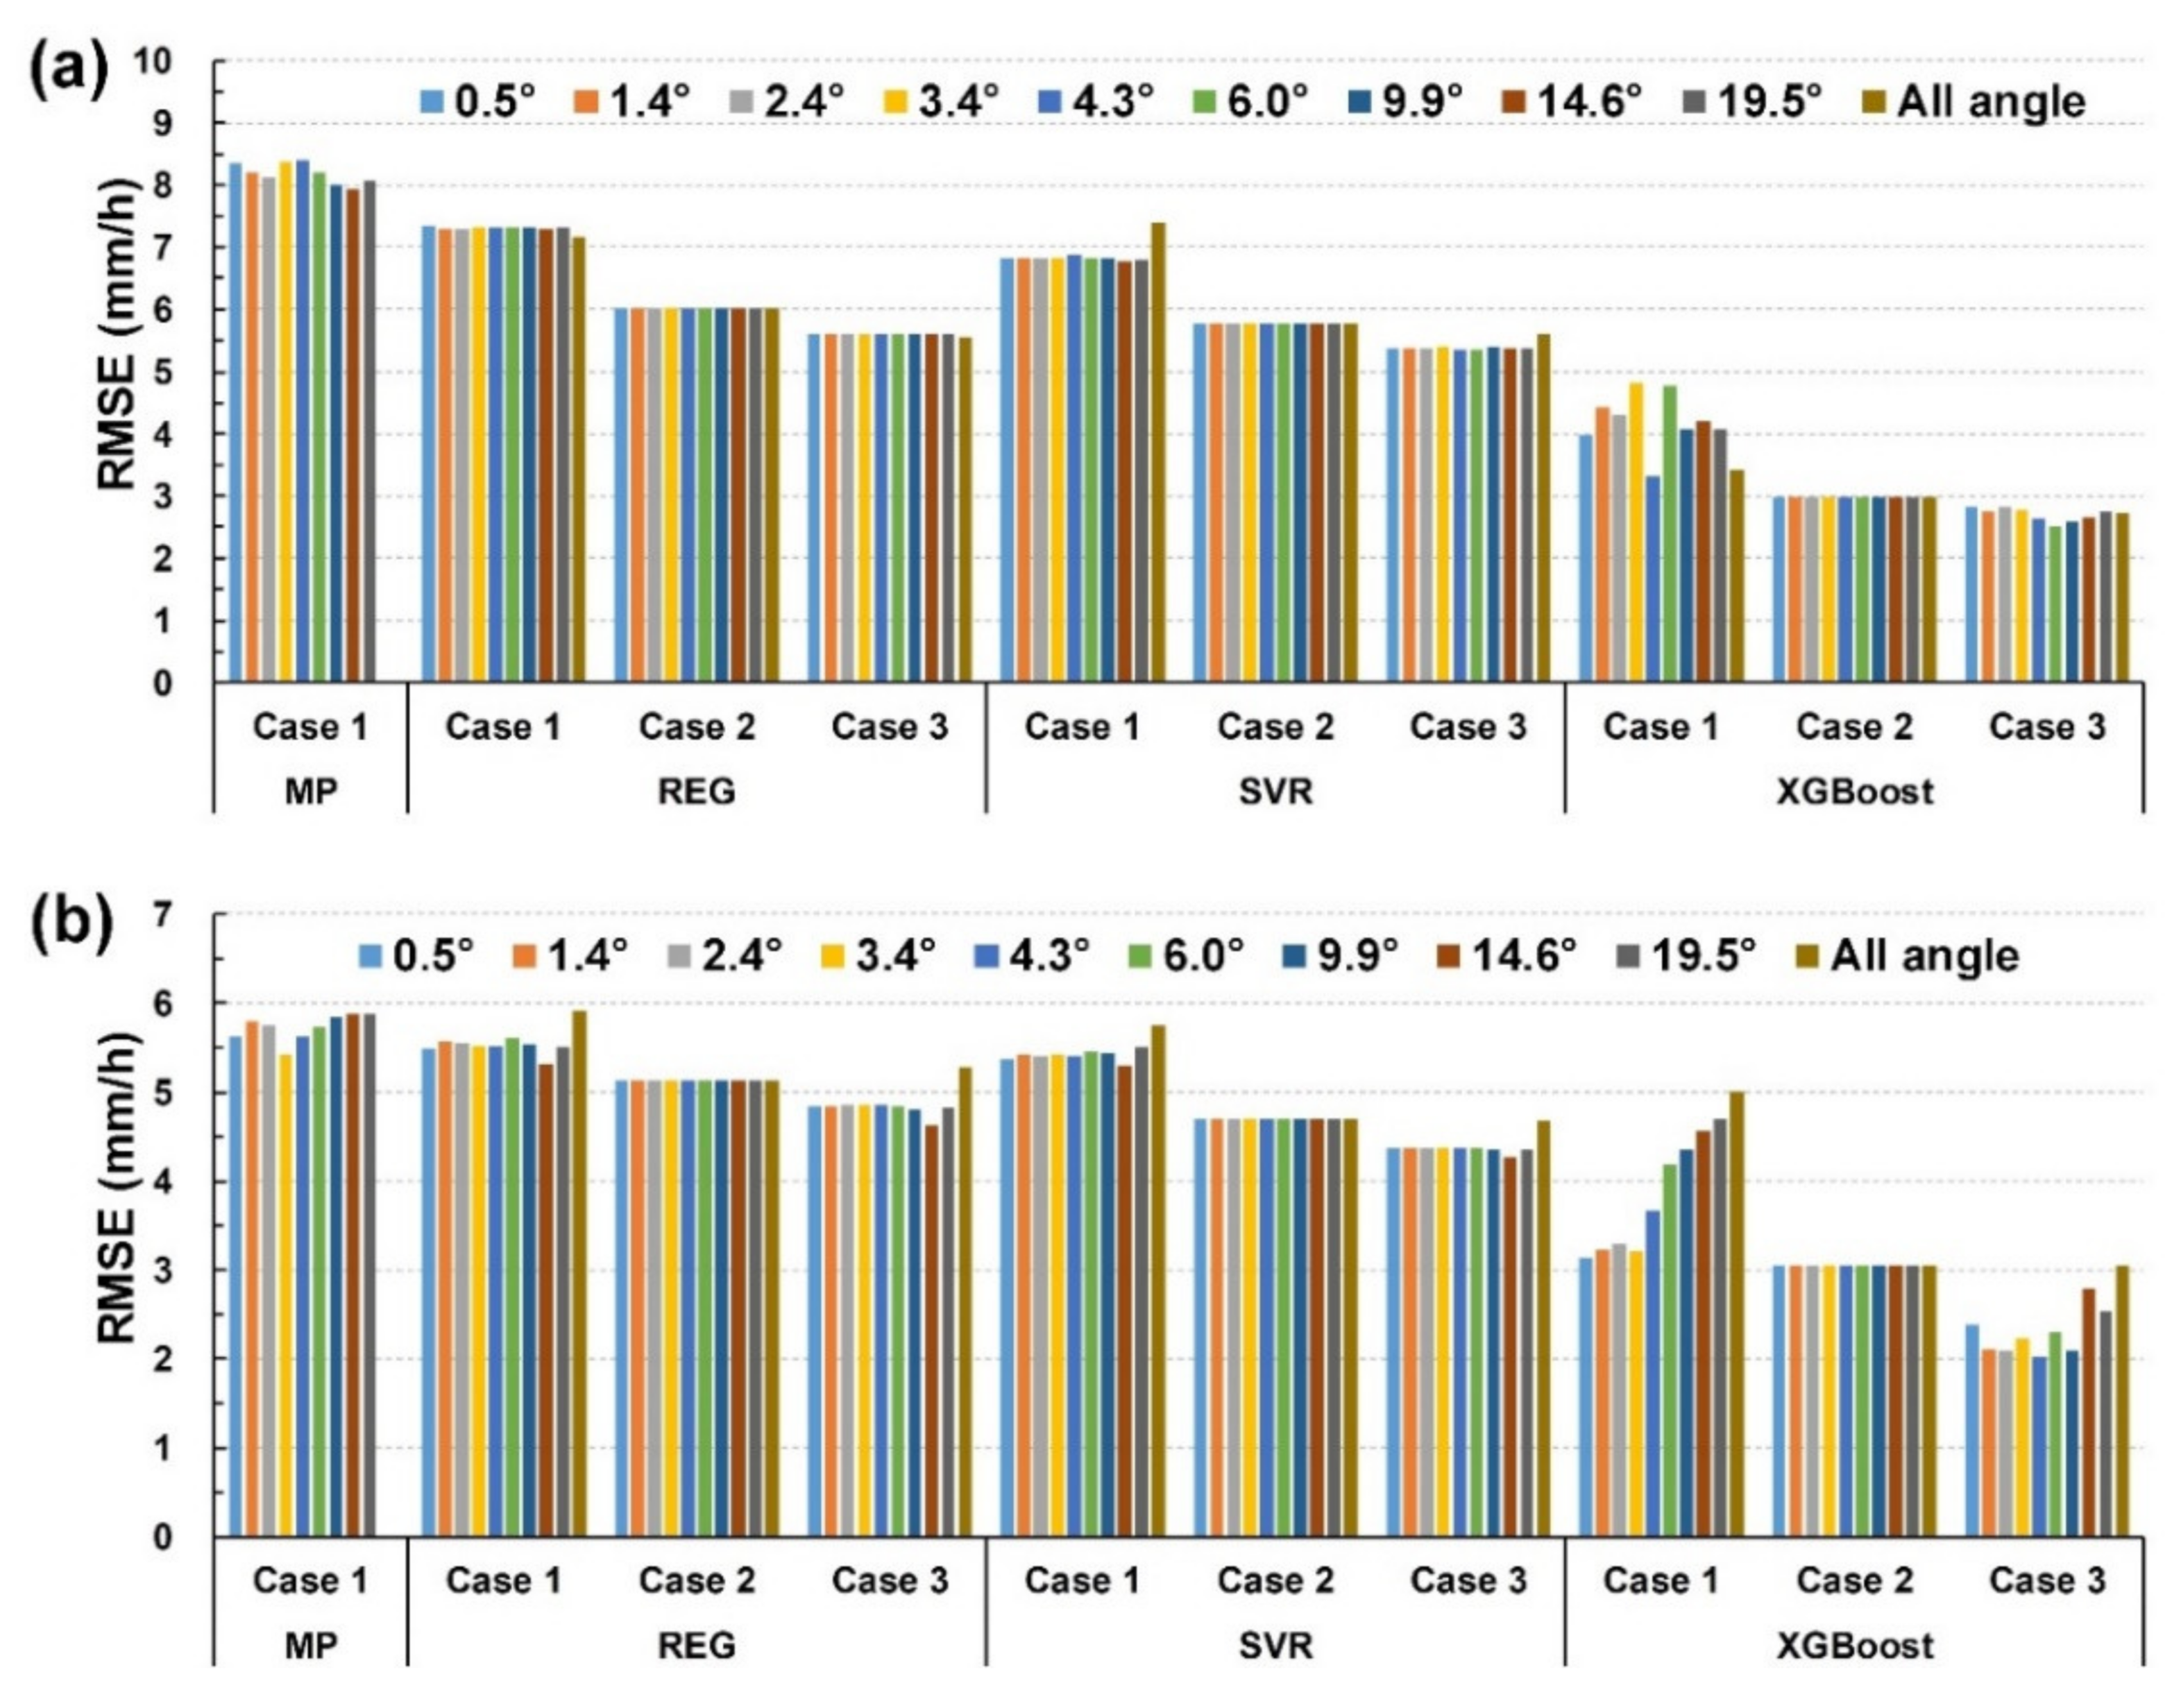
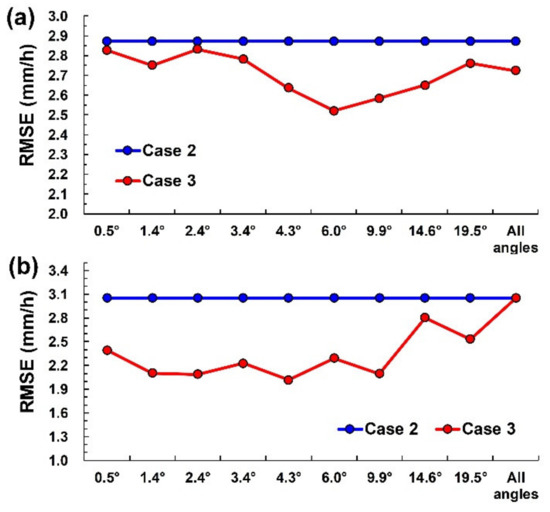
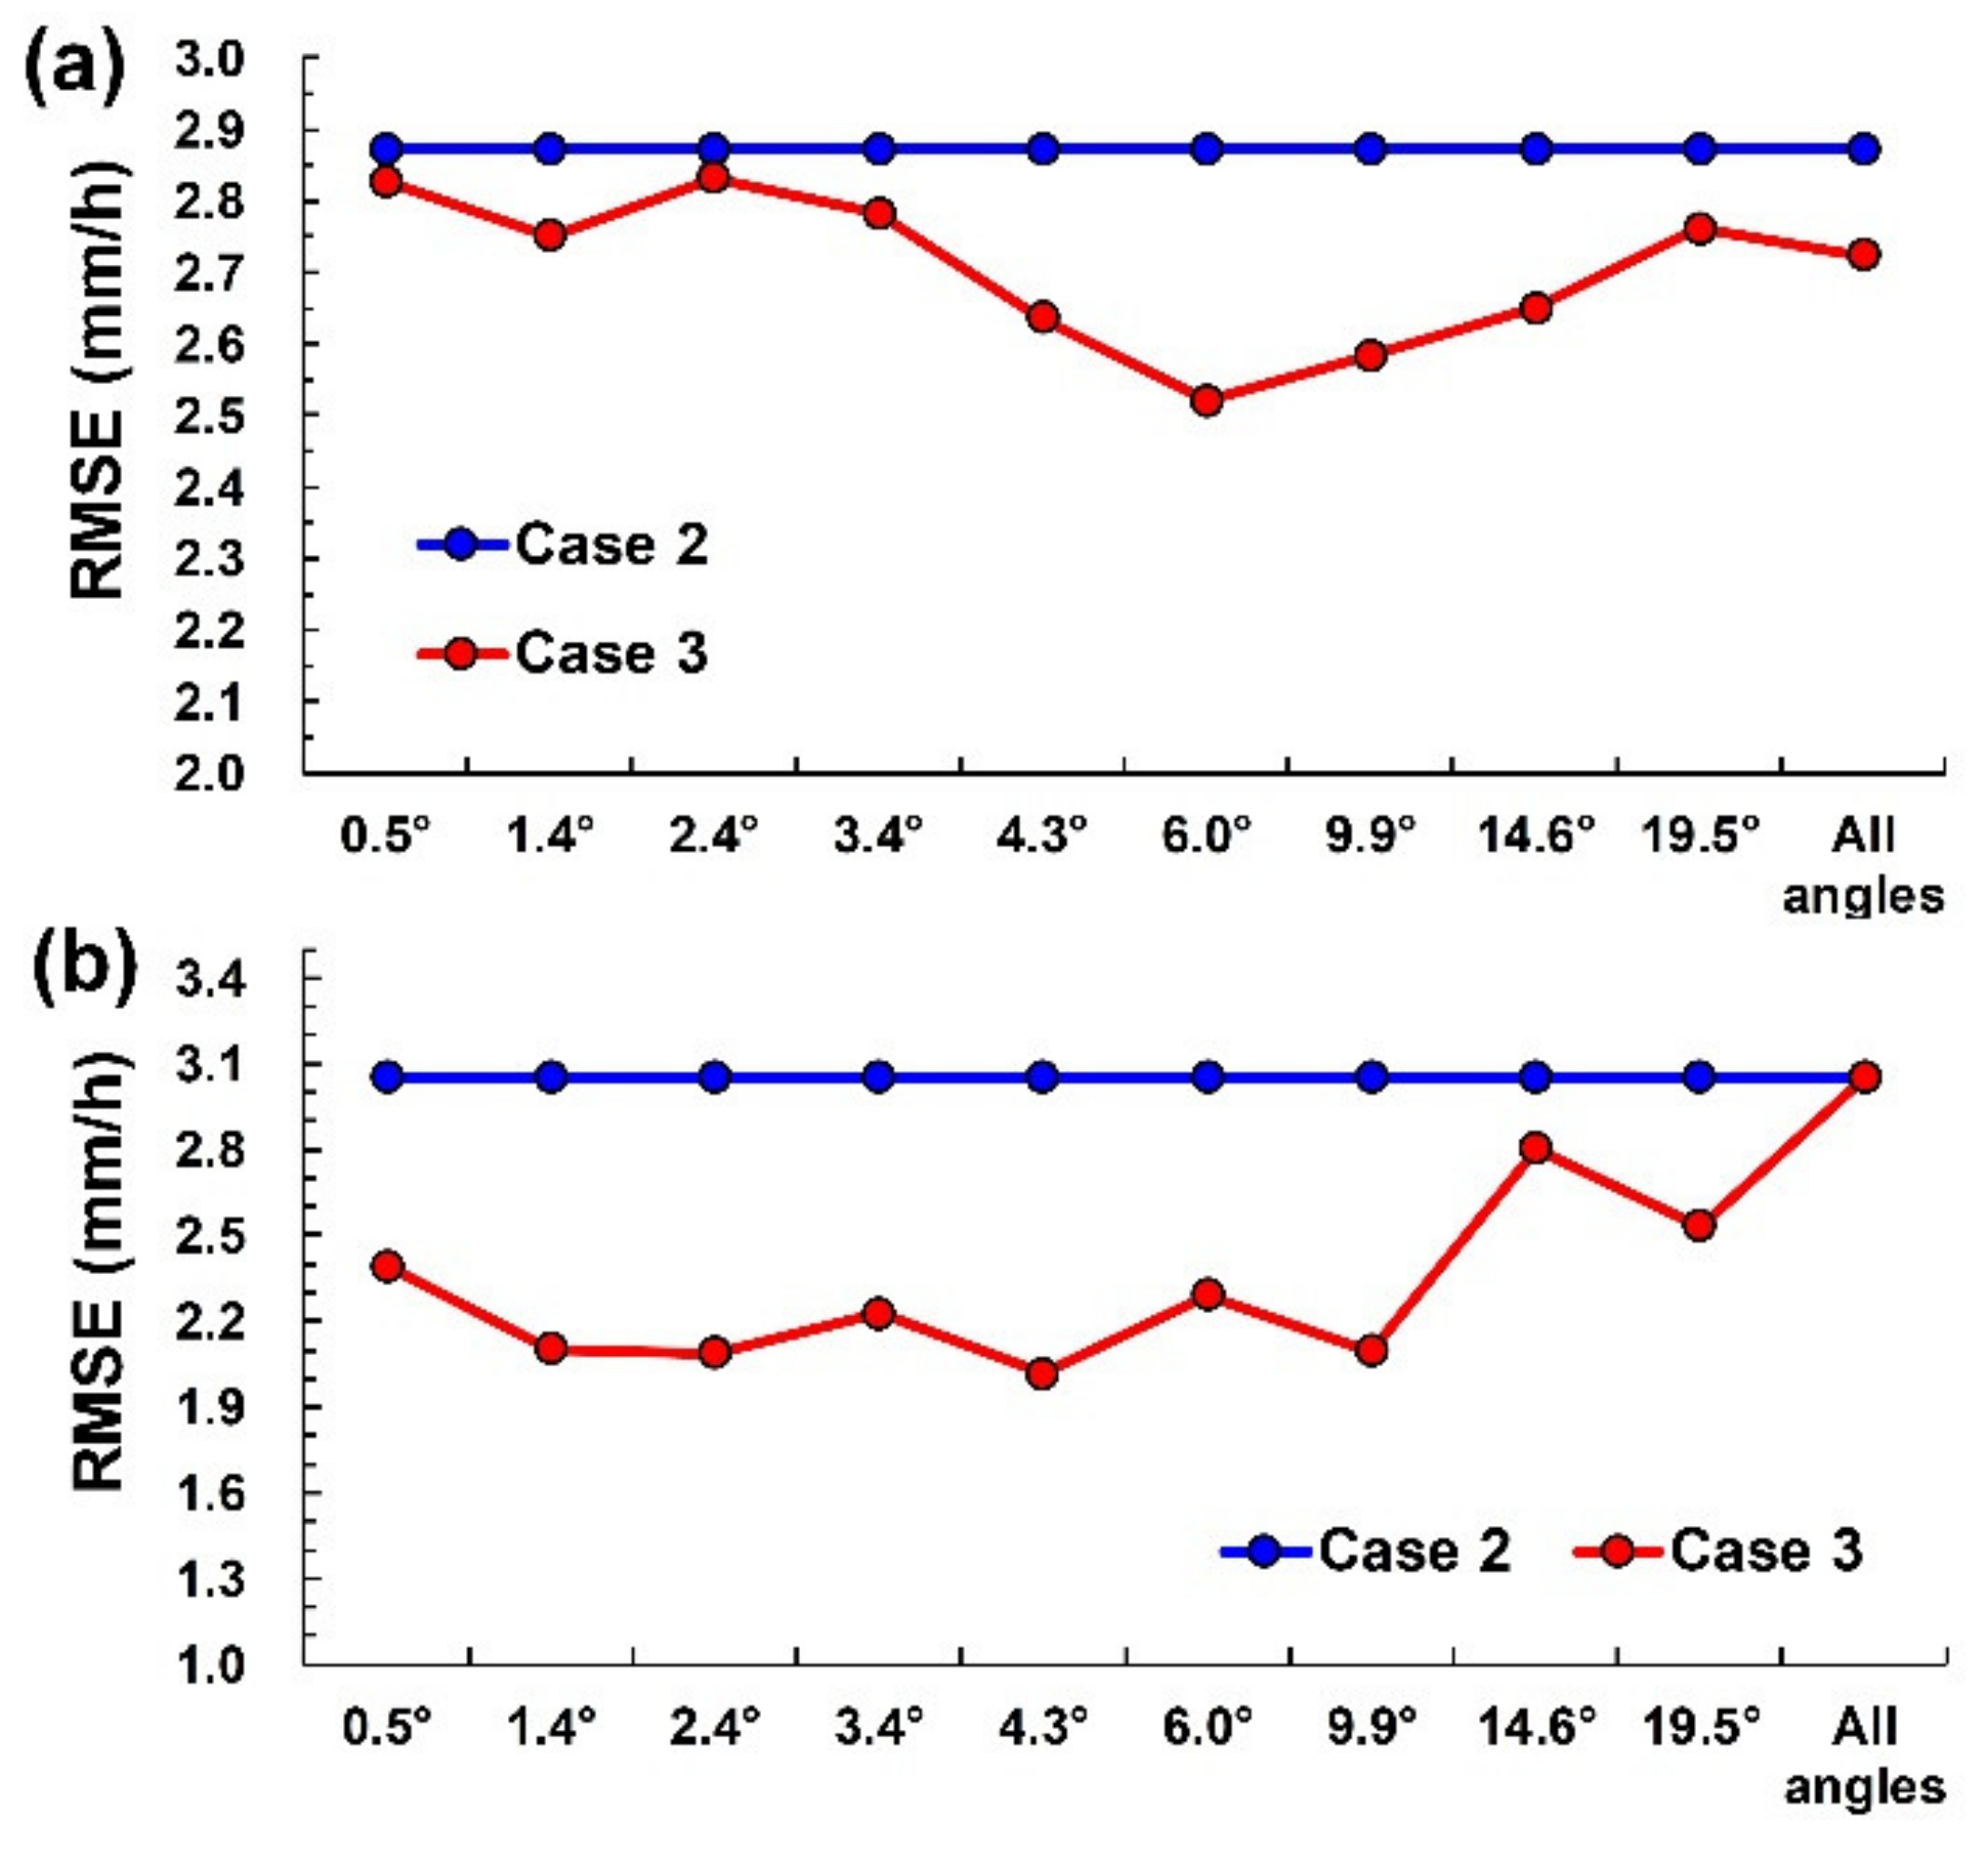
Based on the approaches in the previous section, the optimal parameter set was found through completing the verification process for all cases. This section compares the error indices of all the cases. Figure 9a presents the RMSE results for the MP, REG, SVR, and XGBoost models in every case and under every elevation angle at Chenggong station; the figure demonstrates that (1) XGBoost models had the lowest error index, followed by SVR, REG, and MP; and (2) Case 3 had the lowest error index among the cases, followed by Cases 2 and 1. Based on the optimal model, XGBoost, Case 2 used ground station data and did not consider radar reflectivity from each elevation angle; therefore, the error values were the same; Case 3 used both elevated radar data and ground station data and had superior performance compared with Case 2. By illustrating the error results of these two cases (Figure 10a), we found that using different radar reflectivity could display changes in their error quantities. Figure 10a also demonstrates that optimal retrieval results were observed at an elevation angle of 6.0° (error index value = 2.520 mm/h).
Figure 9.
Root mean square error (RMSE) verification results for every retrieval model and case: (a) Chenggong station; (b) Lanyu station.
Figure 10.
Comparison of RMSE for Cases 2 and 3 in the XGBoost model: (a) Chenggong station; (b) Lanyu station.
Figure 9b presents the model verification results for every case of rain retrieval at Lanyu station. This figure demonstrates that, similarly, XGBoost models showed optimal performance and that Cases 2 and 3 had superior performance. Figure 10b illustrates the RMSE error values for both cases in XGBoost models for further evaluation, demonstrating that radar reflectivity data at an elevation angle of 4.3° had the best results (error index value = 2.016 mm/h).
5. Evaluation and Discussion
This section presents an evaluation to determine the optimal model and dataset combinations under different elevation angles. Table 5 presents the XGBoost model with Case 3 datasets as the optimal combination at Chenggong and Lanyu stations under every elevation angle; this study compared the average performance between stations and found that Lanyu station (RMSE = 2.359 mm/s) outperformed Chenggong station (RMSE = 2.706 mm/s).
Table 5.
Evaluation of the optimal models using Case 3 data under each angle.
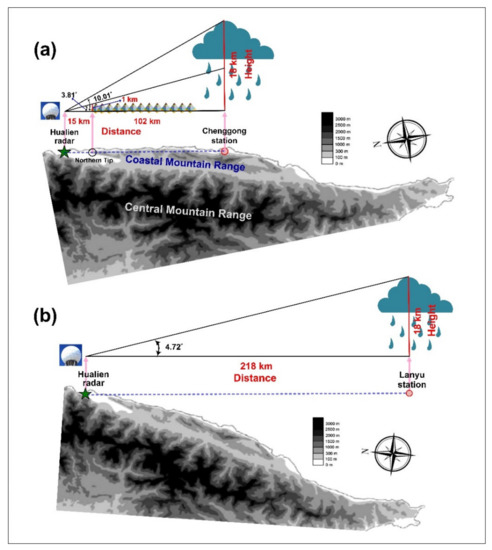
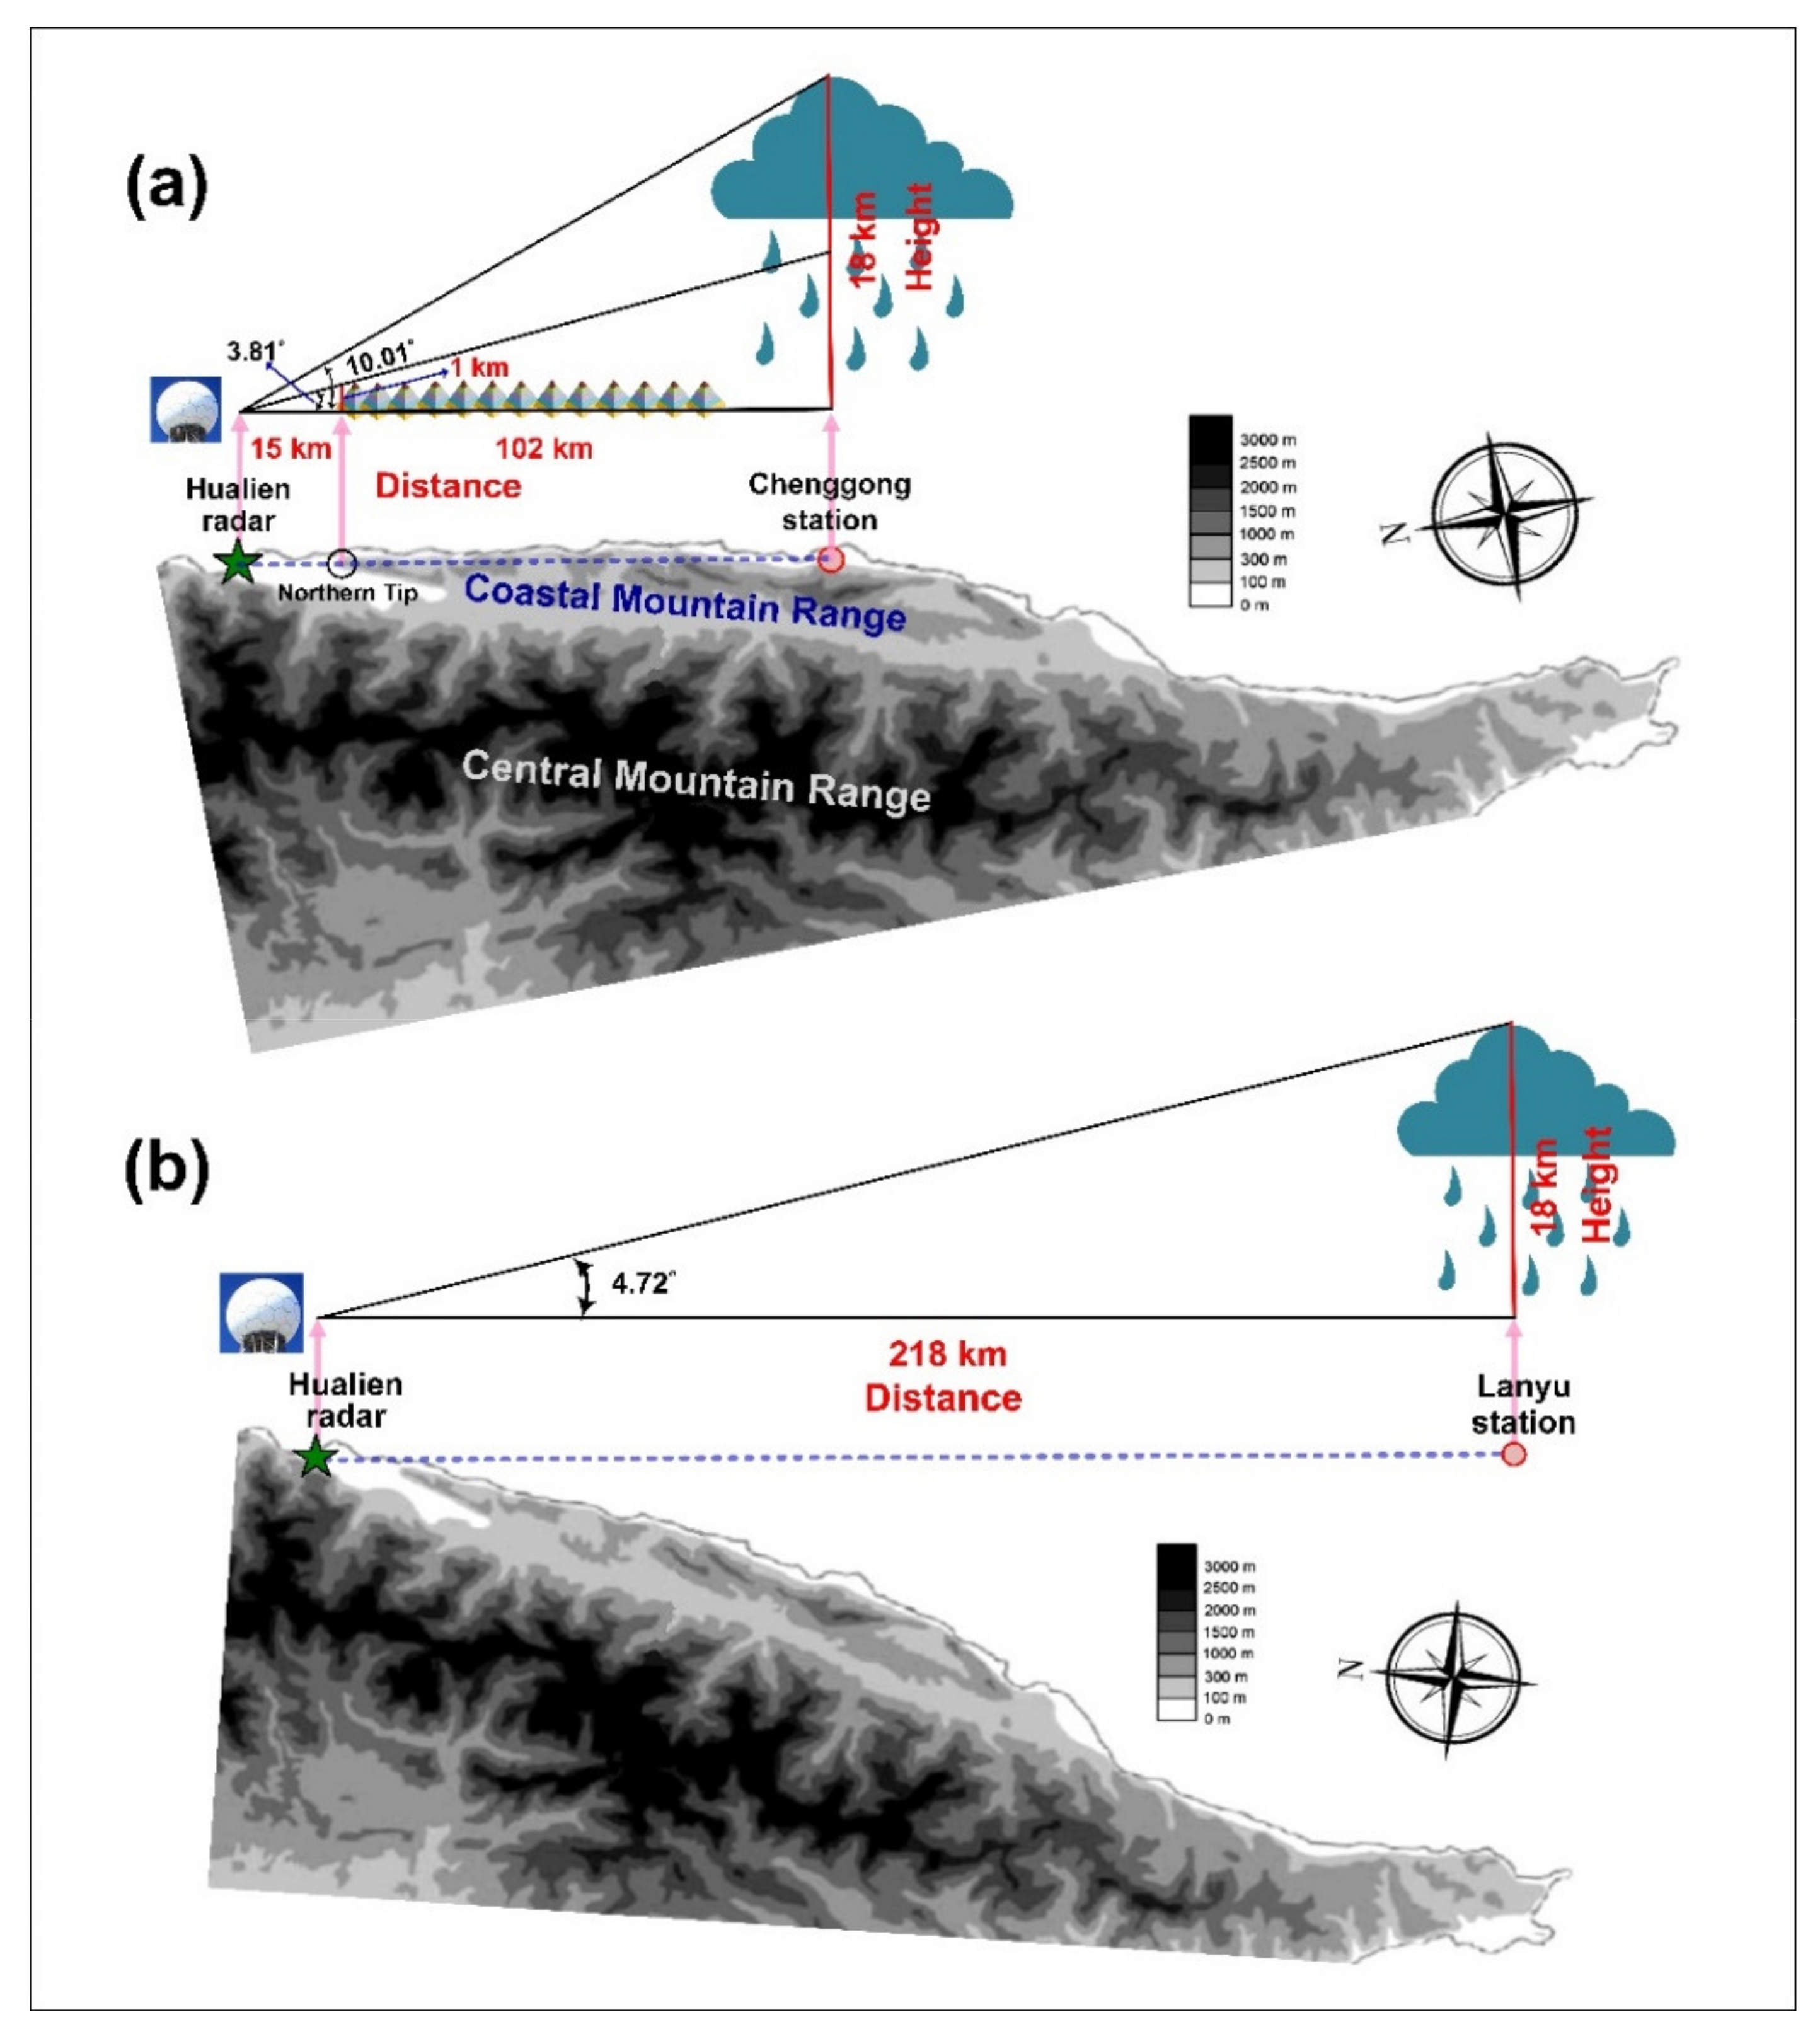
The Chenggong station is situated in the southeast of the main island of Taiwan and is possibly affected by terrain factors, with the Coastal Mountain Range (150 km long, 10 km across from east to west, with an average height of 1000 m and the tallest peak height of 1682 m; Figure 11a) sheltering the station. Model verification results demonstrated that favorable results can be obtained under a specific elevation angle of 6.0°. According to Figure 11a, the range of theoretical elevation angles can be calculated. Waco [58] reported that the upper circulation of strong hurricanes extends into the tropopause of the atmosphere at 15–18 km. Houze et al. [59] and Houze [60] reported that the convective cell of Hurricane Ophelia (2005) reached approximately 17 km in echo top height. In this study, we assumed that the height of the cloud top in a tropical cyclone is 18 km (Figure 11a). The distance from the Hualien radar station to the Chenggong station is 102 km and to the northern tip of the Coastal Mountain Range is 15 km. Therefore, the range of radar elevation angles can be derived from 3.81° to 10.01°. As a result, the model demonstrated its validity regarding the optimal angle of 6.0°.
Figure 11.
Theoretical radar elevation angles at the (a) Chenggong station and (b) Lanyu station.
The Lanyu station generally had lower RMSE at lower elevation angles (approximately 1.4–4.3°), according to the model results, possibly because of less interference from land elevation factors when the electromagnetic pulses (radar beam) sent and received by the radar station pass across sea level, resulting in superior error results closer to the error index values at lower elevation angles. As illustrated in Figure 11b, the theoretical radar elevation angle can be calculated for the Lanyu station. The distance between the Hualien radar station and the Lanyu station is 218 km, with the maximum elevation angle at 4.72°. As a result, the model results appear reasonable regarding the optimal angle of 4.3°.
6. Simulations
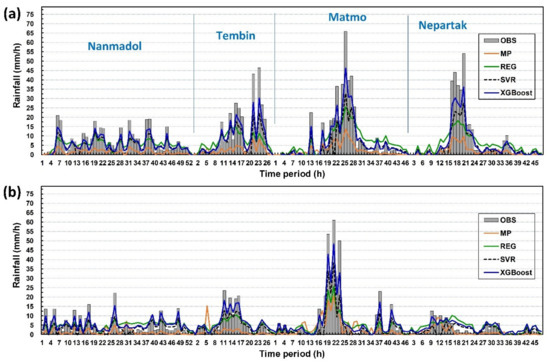
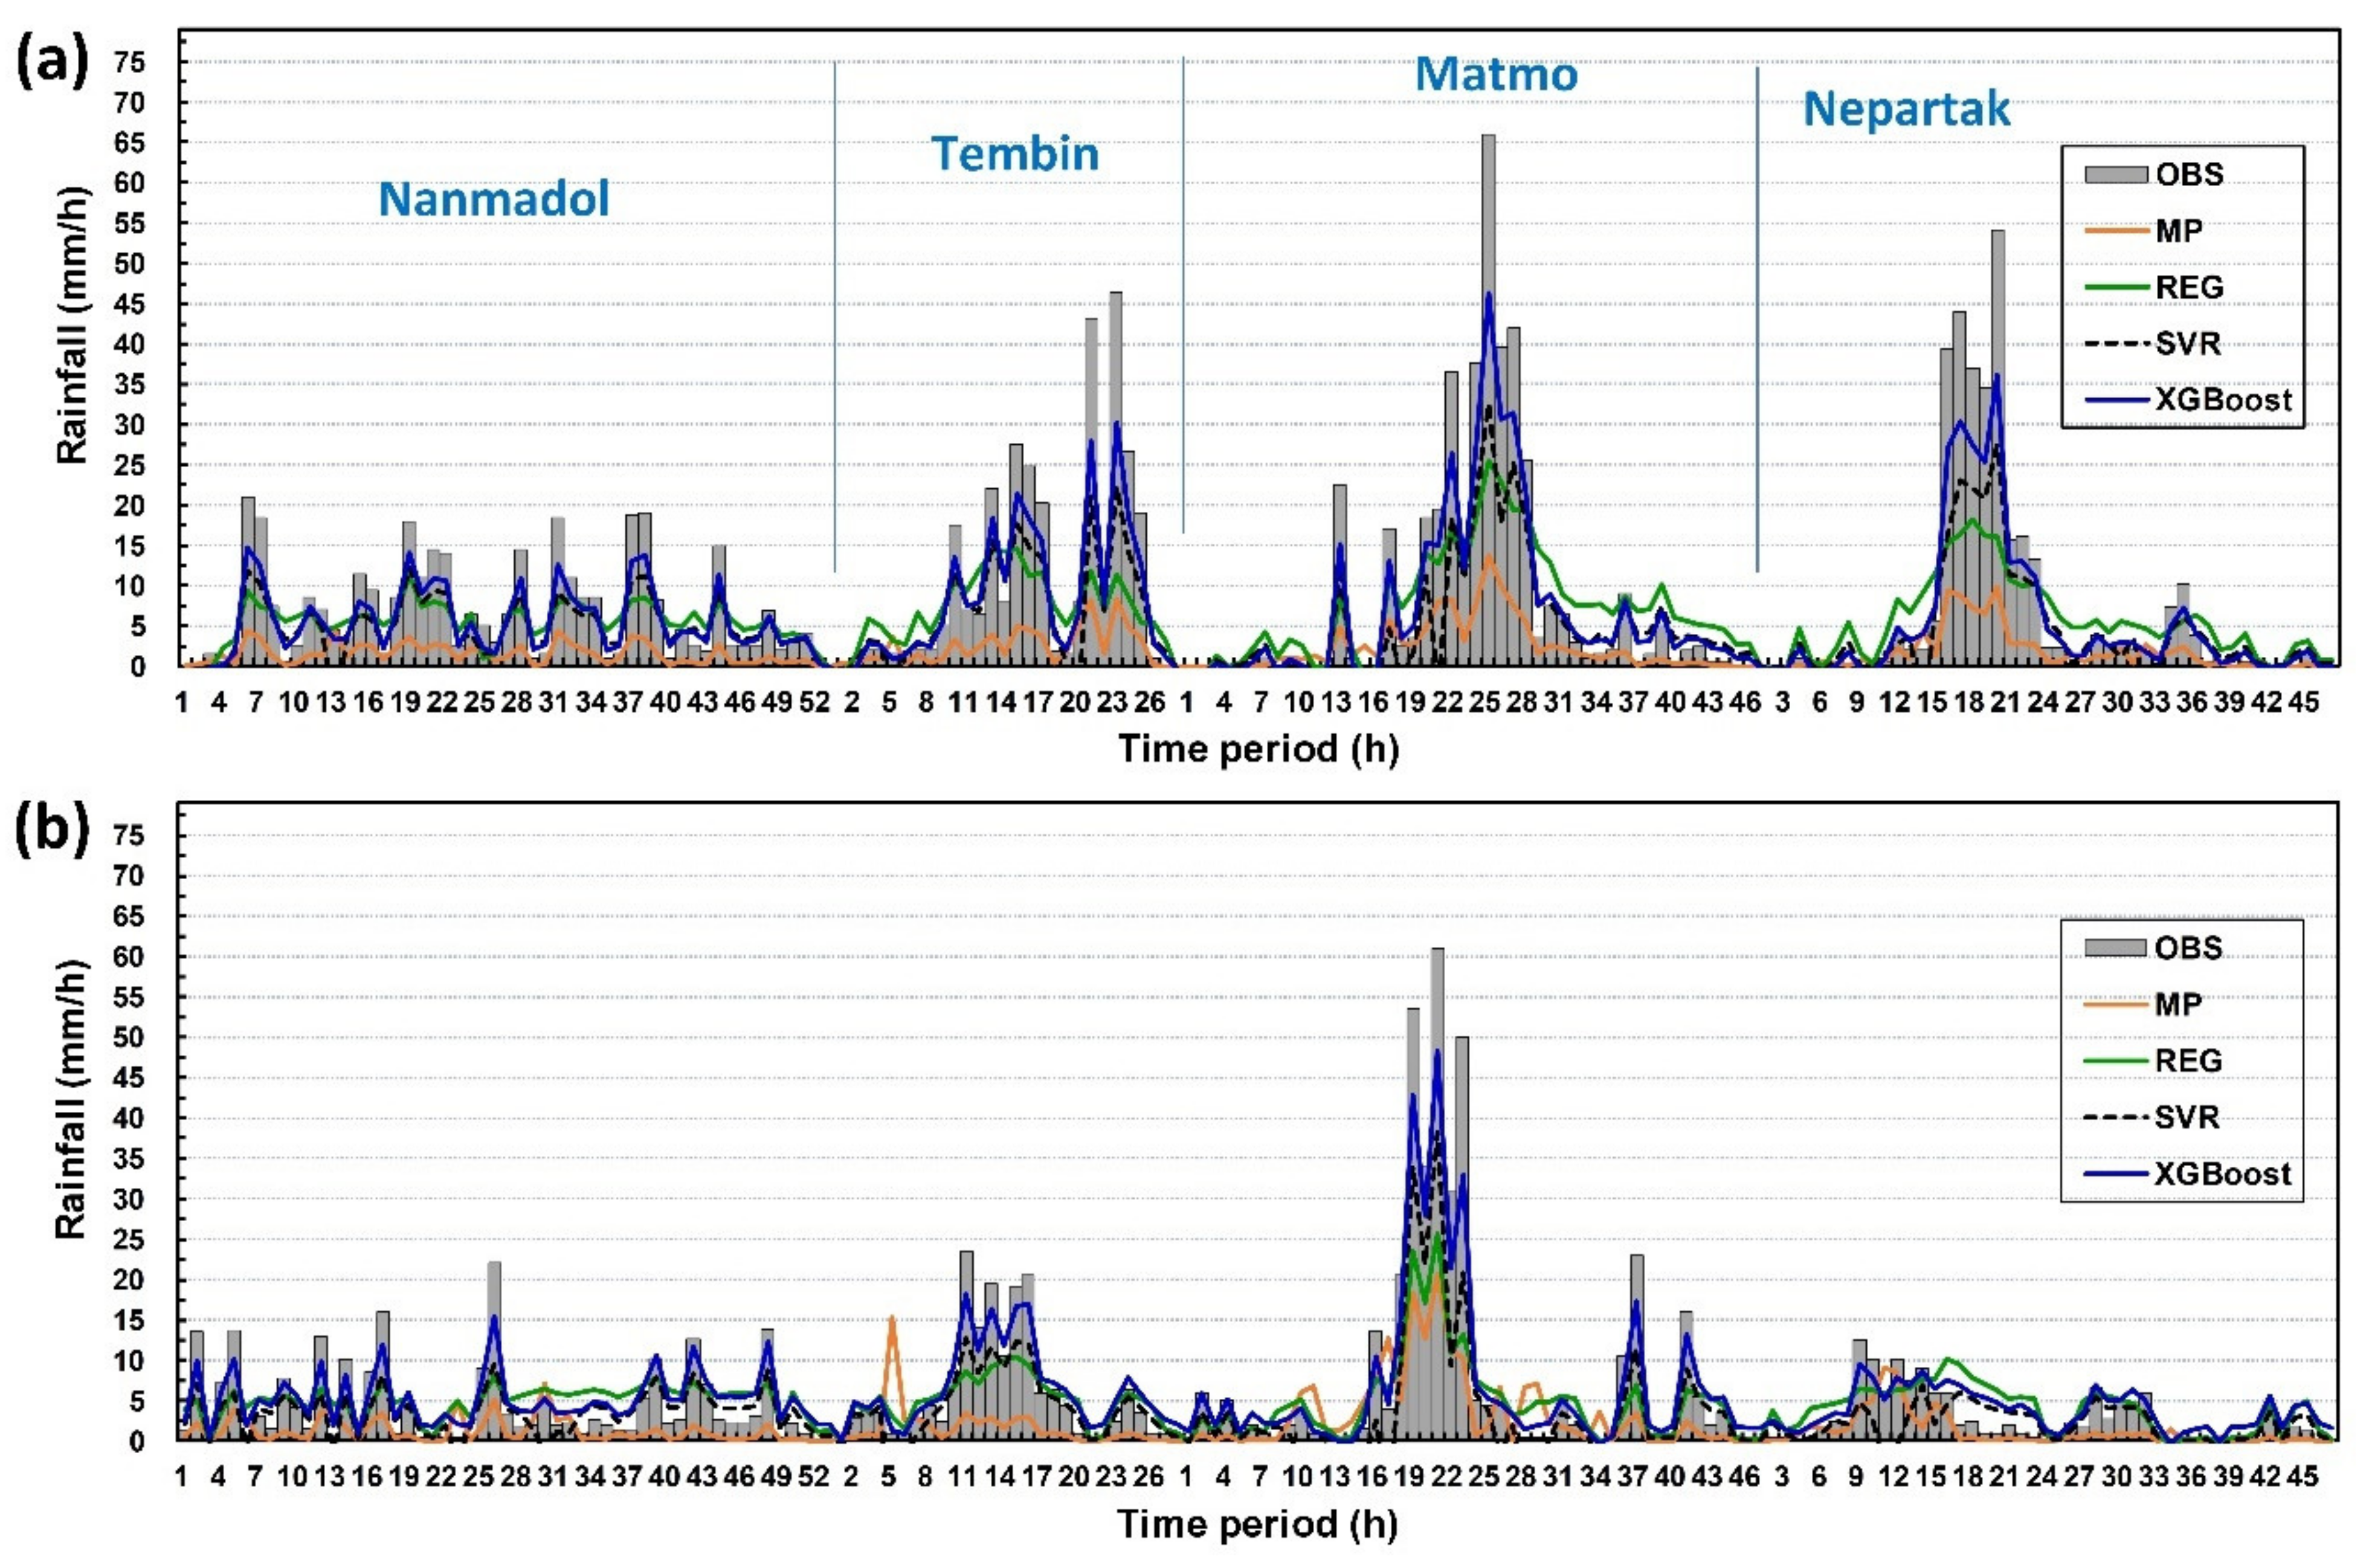
The four testing typhoons were simulated to evaluate the retrieval effectiveness. Figure 11a,b presents the retrieval results of the testing typhoons at Chenggong and Lanyu stations: Chenggong station’s retrieval results were obtained at an elevation angle of 6.0° under Case 3 conditions, and Lanyu station used retrieval values at an elevation angle of 4.3° under Case 3 conditions. In the figures, the thick gray line represents the timeline (or hyetograph) of the observation data and hourly rainfall of the four testing typhoons: the first timepoints for the typhoon simulations were 2011/8/27 12:00 for Nanmadol (total = 53 h), 2012/8/23 11:00 for Tembin (23 h), 2014/7/21 21:00 for Matmo (46 h), and 2016/7/7 10:00 for Nepartak (47 h).
Among the four typhoons, Matmo had the highest rainfall between both stations (observation value = 66 mm/h at Chenggong station and 61 mm/h at Lanyu station). Figure 2f shows that the path of Matmo’s center was very close to both stations, resulting in heavy rain. Rainfall observation records for the four typhoons at both stations showed that Chenggong station was more likely to see rainfall than Lanyu station, possibly because of the “wind sweep” rainfall phenomenon caused by the terrain of Central Mountain Range and the impact of the Coastal Mountain Range on the typhoon’s peripheral circulation as it drew nearer Taiwan’s east coast; when the typhoon airflow encounters the slope and is forced to rise, the water vapor in the air begins to condense from the lowering temperatures in higher altitudes and forms terrain rainfall. Conversely, Lanyu station is situated on the ocean, and therefore sees topographical rainfall; this is similar to the peak rainfall patterns observed for Typhoons Tembin (Figure 2d) and Nepartak (Figure 2j) at Chenggong and Lanyu stations reflecting the possible effects of topographical rainfall. Furthermore, Nanmadol did not exhibit significant single-peak rainfall patterns, possibly because its trajectory was from south to north—drawing near Taiwan’s southern tip and following the southern edge of the Central Mountain Range (Figure 2c), resulting in continuous and sustained rainfall.
In Figure 12, the orange solid line represents the MP model’s retrieval value, the green solid line represents that of the REG model, the black dashed line represents that of the SVR model, and the blue solid line represents that of the XGBoost model. For simulations at Chenggong station (Figure 12a), the rain pattern variations retrieved by the four models exhibited greater differences, and peak rainfall was significantly underestimated; this may be because of faster structural variations of typhoon circulation at Chenggong station, resulting in radar data and ground meteorological attributes changing faster, and thus exhibiting high and unsteady variation; therefore, the models exhibited higher biases when estimating rainfall. At Lanyu station (Figure 12b), the overall rain patterns in the MP, REG, SVR, and XGBoost models were approximately similar to observed rain patterns. The peak time points in the MP, REG, SVR, and XGBoost models reflected underestimated rainfall variation and peak values.
Figure 12.
Retrieval results for the top four major typhoons: (a) Chenggong station at an elevation angle of 6.0° under Case 3; (b) Lanyu station at an elevation angle of 4.3° under Case 3.
Both Chenggong and Lanyu stations exhibited significant peak rain patterns for Typhoon Matmo. Retrieval results mostly demonstrated that Lanyu station outperformed Chenggong station in grasping rainfall trends (i.e., fewer instances of underestimation); the reason might be smaller variations in the typhoon structure and circulation, and stable development of the typhoon structure, and the absence of topographical interference allowing radar reflectivity signals to more accurately reflect rainfall. Conversely, the typhoon circulation and structure rapidly changed when the typhoon circulation encountered land and the Central Mountain Range, resulting in greater fluctuations in radar reflectivity signals at Chenggong station; as a result, the ability of the retrieval model to reflect rainfall at Chenggong station was worse compared with at Lanyu station.
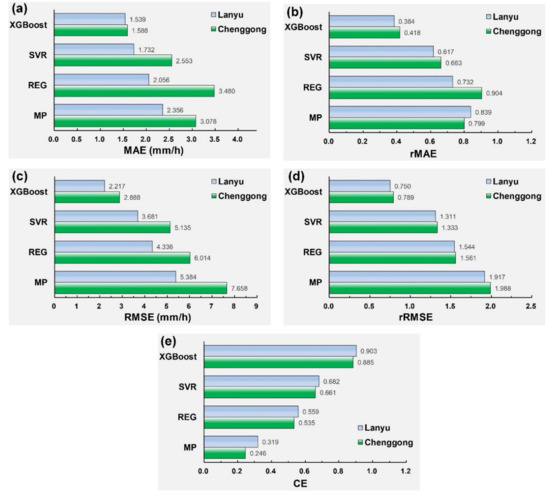
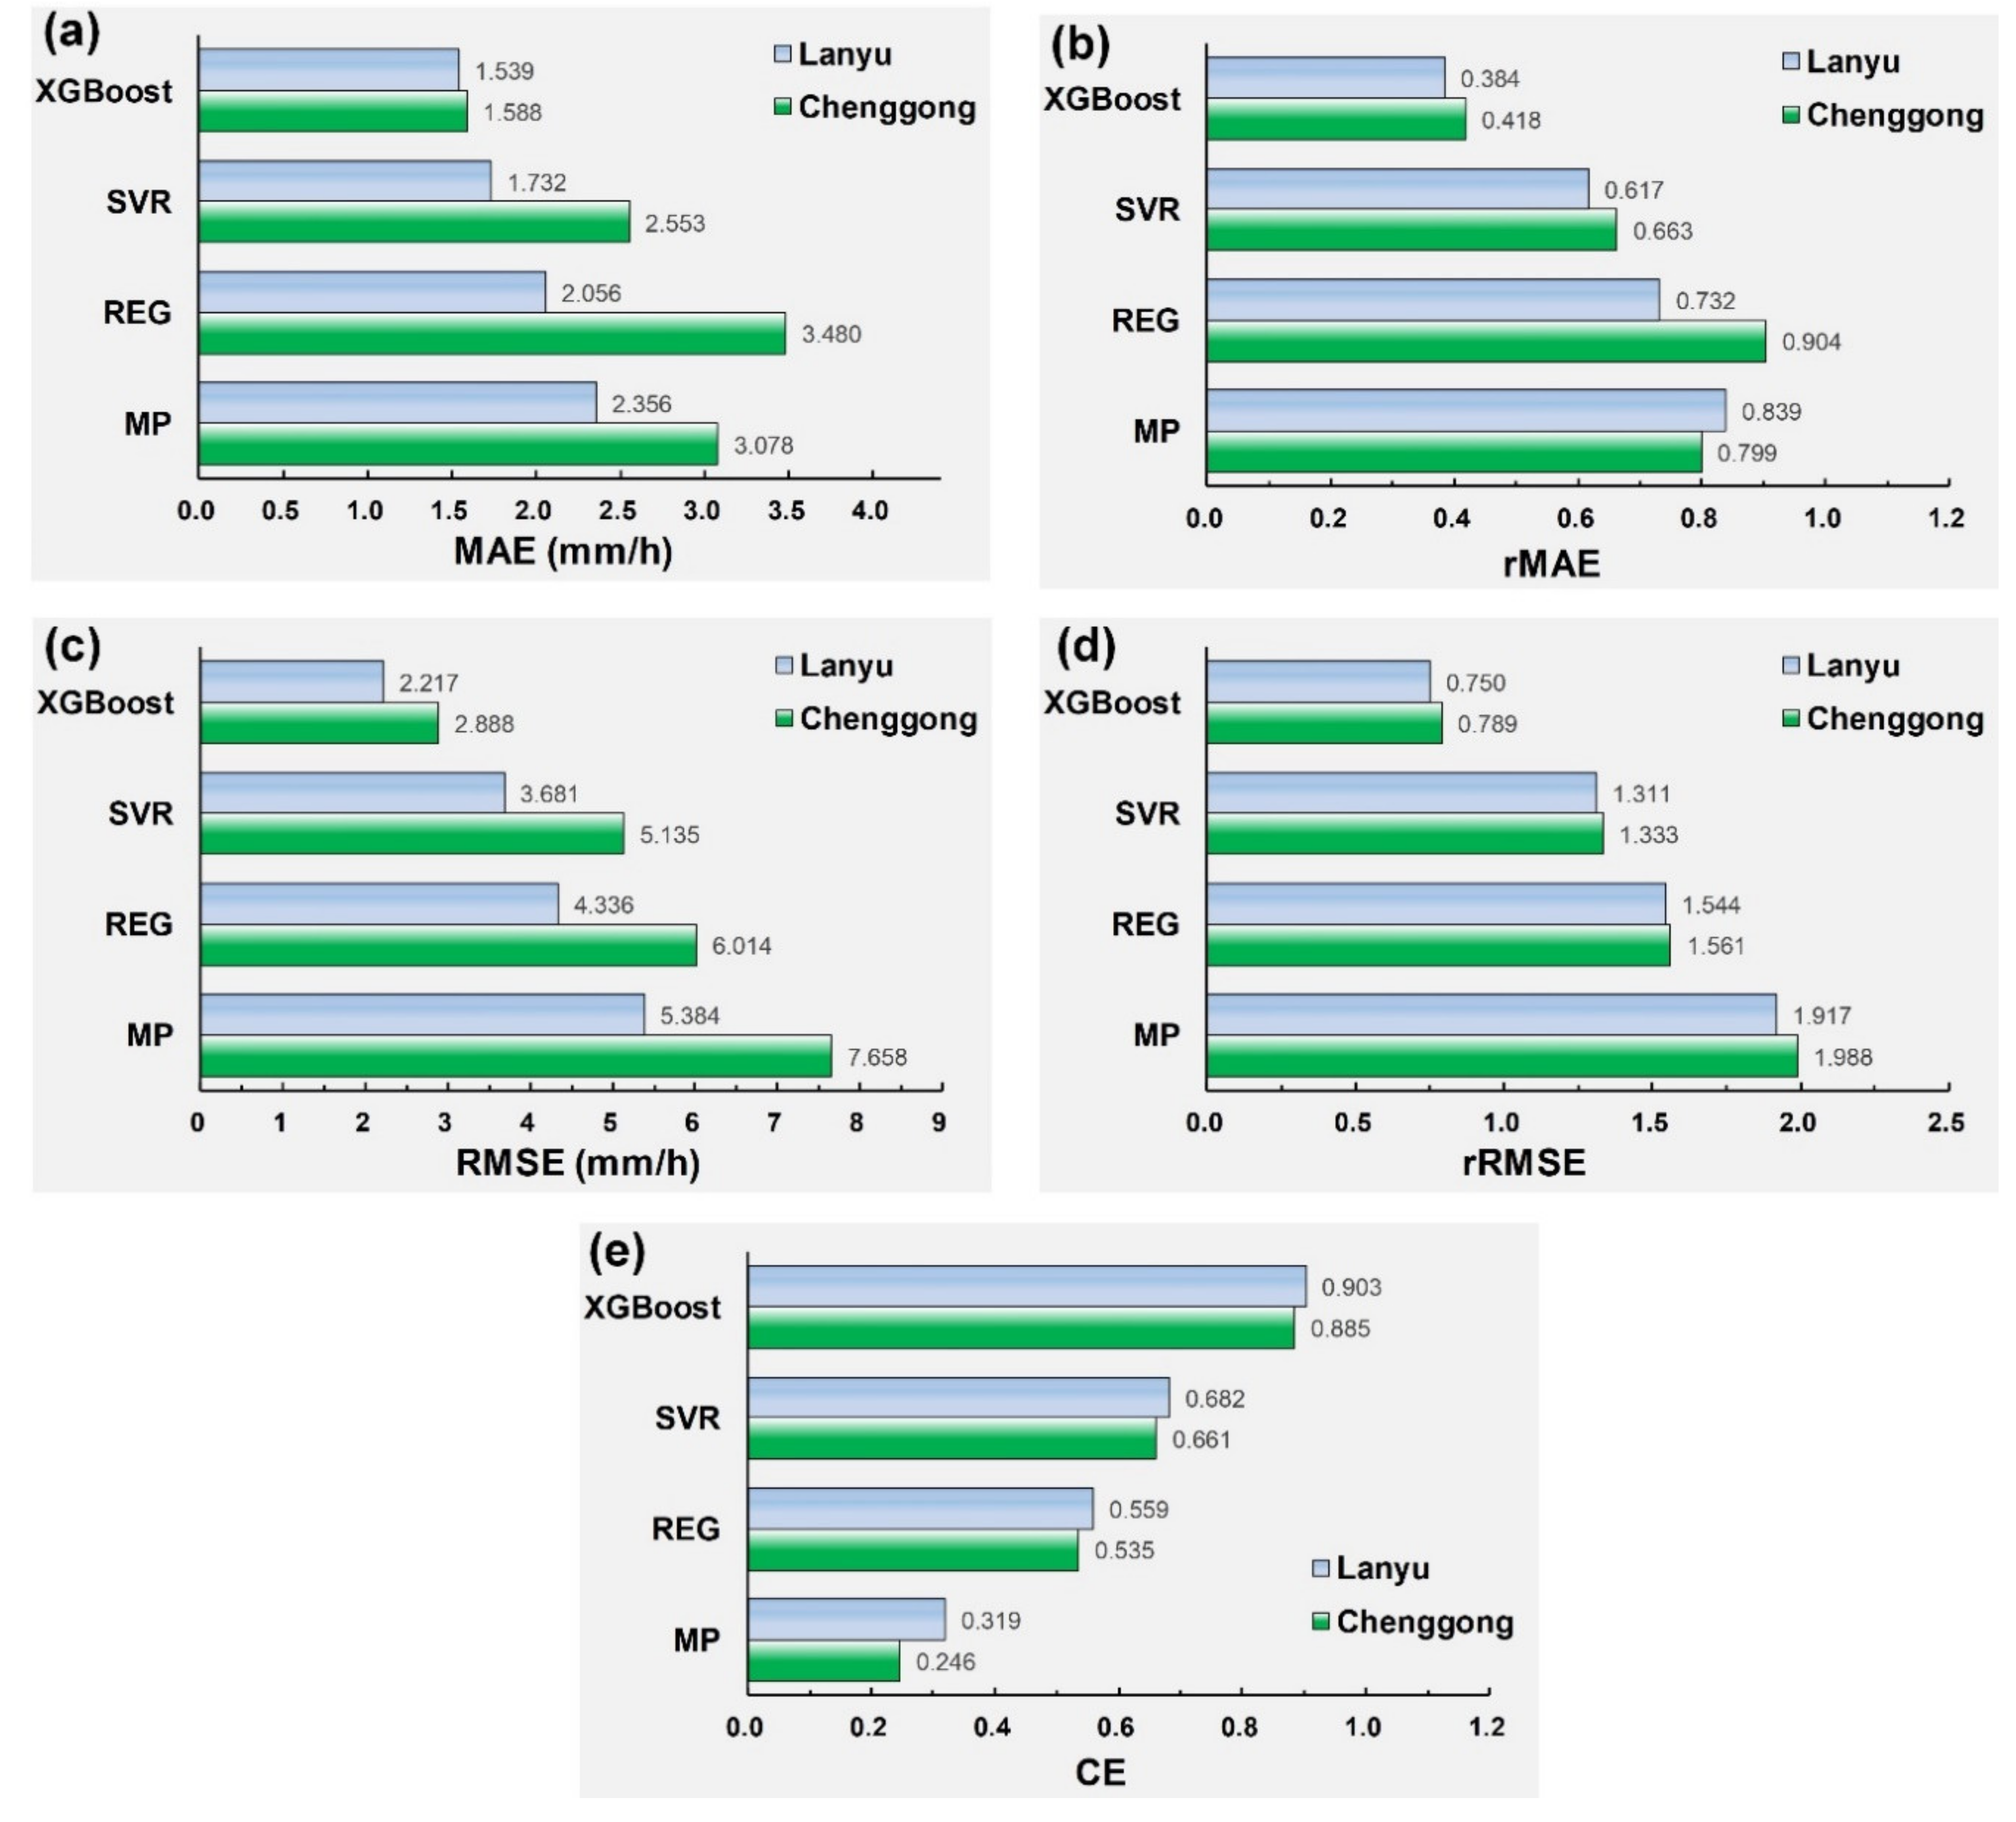
Next, the models were further compared in terms of their performance for each performance criterion. In absolute errors, MAE and RMSE indices were used to evaluate overall performance in all four typhoons; as presented in Figure 13a,b, the XGBoost model fared better than the MP, REG, and SVR models in absolute errors, and Lanyu station exhibited smaller absolute errors compared with Chenggong station. In relative errors, rMAE and rRMSE indices were used; Figure 13c,d shows that the XGBoost model outperformed the MP, REG, and SVR models and that Lanyu station exhibited smaller relative values compared with Chenggong station. Lastly, in terms of CE (Figure 13e), the XGBoost model produced the highest CE at both stations and that for Lanyu station was slightly higher, at 0.903, compared to 0.885 for the Chenggong station.
Figure 13.
Performance comparison of Chenggong and Lanyu stations: (a) mean absolute error (MAE), (b) relative mean absolute error (rMAE), (c) RMSE, (d) relative root mean square error (rRMSE), and (e) efficiency coefficient (CE).
7. Conclusions
The aim of this study was to develop a typhoon-season rain retrieval model that could estimate possible rainfall in the study area when typhoons struck Taiwan. The studied sites were Chenggong weather station on Taiwan’s southeast coast and Lanyu weather station in Taiwan’s outlying islands. Rainfall retrieval cases and a process for evaluating the optimal model were designed, and the model case designs employed combined datasets of radar reflectivity factors from multiple elevation angles and ground meteorological attributes. The scope of the study was 14 typhoons from 2008 to 2017, and the radar reflectivity at nine elevation angles were provided by the VCP21 system at the CWB’s Hualien weather surveillance radar station. The case models in this study were constructed using the ML algorithms REG, SVR, XGBoost, and MP.
The results at the experimental stations can be summarized as follows:
- In the process of building the rainfall-retrieval models, combining radar reflectivity with ground meteorological attributes (Case 3) achieved superior rainfall-retrieval results compared with only inputting radar reflectivity (Case 1) or only ground meteorological attributes (Case 2).
- When the experimental station radar elevation angles were evaluated, radar reflectivity at an elevation angle of 6.0° combined with ground meteorological attributes were the optimal input variables for rainfall retrieval at Chenggong station; at Lanyu station, the optimal input variables were radar reflectivity at an elevation angle of 4.3° combined with ground meteorological attributes.
- Simulation results of the testing typhoons (Nanmadol in 2011, Tembin in 2012, Matmo in 2014, and Nepartak in 2016) demonstrated that Lanyu station exhibited smaller error index values in model retrieval than Chenggong station. This study speculated that this is because Lanyu station is situated on the ocean, where a typhoon circulation encounters little to no topographical interference to affect its structure when passing; as a result, the radar reflectivity signals are better reflected off the variations (gradients) of water vapor and possibly rain. By contrast, Chenggong station is affected by rapid changes in typhoon circulation and structure when a typhoon circulation encounters land and the Coastal Mountain Range and the Central Mountain Range, resulting in greater fluctuations in radar reflectivity signals. As a result, the Chenggong station retrieval models were worse at predicting rainfall than those at Lanyu station.
- In terms of model errors, the XGBoost model at both Chenggong and Lanyu stations exhibited smaller error indices than the MP, REG, and SVR models (including absolute errors (MAE and RMSE) and relative errors (rMAE and rRMSE)). In terms of efficiency performance during retrievals, Lanyu station’s XGBoost model had the highest efficiency coefficient (0.903), and Chenggong station’s XGBoost model had the second highest (0.885).
Finally, based on the radar reflectivity at optimal radar elevation angles and ground meteorological attributes verified in this study’s evaluation process, entering the combined dataset into a high-performance algorithm (XGBoost) can effectively improve the accuracy of rainfall retrieval during typhoon season. As a result, the concrete study results also demonstrate the contribution of this study.
Author Contributions
C.-C.W. conceived and designed the experiments and wrote the manuscript; C.-C.W. and C.-C.H. carried out this experiment and analysis of the data and discussed the results. All authors have read and agreed to the published version of the manuscript.
Funding
This study was supported by the Ministry of Science and Technology, Taiwan, under Grant No. MOST108-2622-M-019-001-CC3.
Acknowledgments
The authors acknowledge data provided by Taiwan’s CWB Taiwan, which are available at https://rdc28.cwb.gov.tw/. This manuscript was edited by Wallace Academic Editing.
Conflicts of Interest
The authors declare no conflict of interest.
References
- Roy, C.; Kovordányi, R. Tropical cyclone track forecasting techniques: A review. Atmos. Res. 2012, 104, 40–69. [Google Scholar] [CrossRef] [Scilit]
- Wei, C.C. Improvement of typhoon precipitation forecast efficiency by coupling SSM/I microwave data with climatologic characteristics and precipitation. Weather Forecast. 2013, 28, 614–630. [Google Scholar] [CrossRef] [Scilit]
- Huang, J.C.; Yu, C.K.; Lee, J.Y.; Cheng, L.W.; Lee, T.Y.; Kao, S.J. Linking typhoon tracks and spatial rainfall patterns for improving flood lead time predictions over a mesoscale mountainous watershed. Water Resour. Res. 2012, 48, W09540. [Google Scholar] [CrossRef] [Scilit]
- Kuo, Y.C.; Lee, M.A.; Lu, M.M. Association of Taiwan’s October rainfall patterns with large-scale oceanic and atmospheric phenomena. Atmos. Res. 2016, 180, 200–210. [Google Scholar] [CrossRef] [Scilit]
- Wei, C.C.; Peng, P.C.; Tsai, C.H.; Huang, C.L. Regional forecasting of wind speeds during typhoon landfall in Taiwan: A case study of westward-moving typhoons. Atmosphere 2018, 9, 141. [Google Scholar] [CrossRef] [Scilit]
- Chen, K.S.; Wang, J.T.; Mitnik, L.M. Satellite and ground observations of the evolution of Typhoon Herb near Taiwan. Remote Sens. Environ. 2001, 75, 397–411. [Google Scholar] [CrossRef] [Scilit]
- Wei, C.C.; Roan, J. Retrievals for the rainfall rate over land using Special Sensor Microwave/Imager data during tropical cyclones: Comparisons of scattering index, regression, and support vector regression. J. Hydrometeorol. 2012, 13, 1567–1578. [Google Scholar] [CrossRef] [Scilit]
- Zhang, Y.; Stensrud, D.J.; Zhang, F. Simultaneous assimilation of radar and all-sky satellite infrared radiance observations for convection-allowing ensemble analysis and prediction of severe thunderstorms. Mon. Weather Rev. 2019, 147, 4389–4409. [Google Scholar] [CrossRef] [Scilit]
- Marshall, J.S.; Palmer, W.M.K. The distribution of raindrops with size. J. Appl. Meteorol. 1948, 5, 165–166. [Google Scholar] [CrossRef] [Scilit]
- Scofield, R.A.; Kuligowski, R.J. Status and outlook of operational satellite precipitation algorithms for extreme-precipitation events. Weather Forecast. 2003, 18, 1037–1051. [Google Scholar] [CrossRef] [Scilit]
- Smith, J.A.; Baeck, M.L.; Meierdiercks, K.L.; Miller, A.J.; Krajewski, W.F. Radar rainfall estimation for flash flood forecasting in small urban watersheds. Adv. Water Resour. 2007, 30, 2087–2097. [Google Scholar] [CrossRef] [Scilit]
- Michaelides, S.; Levizzani, V.; Anagnostou, E.; Bauer, P.; Kasparis, T.; Lane, J.E. Precipitation: Measurement, remote sensing, climatology and modeling. Atmos. Res. 2009, 94, 512–533. [Google Scholar] [CrossRef] [Scilit]
- Wei, C.C. Wavelet support vector machines for forecasting precipitation in tropical cyclones: Comparisons with GSVM, regression, and MM5. Weather Forecast. 2012, 27, 438–450. [Google Scholar] [CrossRef] [Scilit]
- Diop, C.A.; Sauvageot, H.; Mesnard, F. Partitioning the distribution function of radar reflectivity in convective storms using maximum likelihood method. Atmos. Res. 2013, 124, 123–136. [Google Scholar] [CrossRef] [Scilit]
- Ku, J.M.; Yoo, C. Calibrating radar data in an orographic setting: A case study for the typhoon Nakri in the Hallasan Mountain, Korea. Atmosphere 2017, 8, 250. [Google Scholar] [CrossRef] [Scilit]
- Woo, W.C.; Wong, W.K. Operational application of optical flow techniques to radar-based rainfall nowcasting. Atmosphere 2017, 8, 48. [Google Scholar] [CrossRef] [Scilit]
- Wei, C.C.; Hsieh, P.Y. Estimation of hourly rainfall during typhoons using radar mosaic-based convolutional neural networks. Remote Sens. 2020, 12, 896. [Google Scholar] [CrossRef] [Scilit]
- Borga, M.; Anagnostou, E.N.; Frank, E. On the use of real-time radar rainfall estimates for flood prediction in mountainous basins. J. Geophys. Res. 2000, 105, 2269–2280. [Google Scholar] [CrossRef] [Scilit]
- Gabella, M.; Joss, J.; Perona, G.; Galli, G. Accuracy of rainfall estimates by two radars in the same Alpine environment using gage adjustment. J. Geophys. Res. 2001, 106, 5139–5150. [Google Scholar] [CrossRef] [Scilit]
- Seo, D.J.; Breidenbach, J.P. Real-time correction of spatially nonuniform bias in radar rainfall data using rain gauge measurements. J. Hydrometeorol. 2002, 3, 93–111. [Google Scholar] [CrossRef] [Scilit]
- Libertino, A.; Allamano, P.; Claps, P.; Cremonini, R.; Laio, F. Radar estimation of intense rainfall rates through adaptive calibration of the Z-R relation. Atmosphere 2015, 6, 1559–1577. [Google Scholar] [CrossRef] [Scilit]
- Tang, J.; Matyas, C. A nowcasting model for tropical cyclone precipitation regions based on the TREC motion vector retrieval with a semi-Lagrangian scheme for Doppler weather radar. Atmosphere 2018, 9, 200. [Google Scholar] [CrossRef] [Scilit]
- Chen, Y.; Duan, J.; An, J.; Liu, H. Raindrop size distribution characteristics for tropical cyclones and meiyu-baiu fronts impacting Tokyo, Japan. Atmosphere 2019, 10, 391. [Google Scholar] [CrossRef] [Scilit]
- Asklany, S.A.; Elhelow, I.K.; El-Wahab, M.A. Rainfall events prediction using rule-based fuzzy inference system. Atmos. Res. 2011, 101, 228–236. [Google Scholar] [CrossRef] [Scilit]
- Wei, C.C. RBF neural networks combined with principal component analysis applied to quantitative precipitation forecast for a reservoir watershed during typhoon periods. J. Hydrometeorol. 2012, 13, 722–734. [Google Scholar] [CrossRef] [Scilit]
- Schmidhuber, J. Deep learning in neural networks: An overview. Neural Netw. 2015, 61, 85–117. [Google Scholar] [CrossRef] [Scilit]
- Lin, F.R.; Wu, N.J.; Tsay, T.K. Applications of cluster analysis and pattern recognition for typhoon hourly rainfall forecast. Adv. Meteorol. 2017, 2017, 5019646. [Google Scholar] [CrossRef] [Scilit]
- Leahy, T.P.; Llopis, F.P.; Palmer, M.D.; Robinson, N.H. Using neural networks to correct historical climate observations. J. Atmos. Ocean. Technol. 2018, 35, 2053–2059. [Google Scholar] [CrossRef] [Scilit]
- Mosavi, A.; Ozturk, P.; Chau, K.W. Flood prediction using machine learning models: Literature review. Water 2018, 10, 1536. [Google Scholar] [CrossRef] [Scilit]
- Jin, Q.; Fan, X.; Liu, J.; Xue, Z.; Jian, H. Using eXtreme Gradient BOOSTing to predict changes in tropical cyclone intensity over the Western North Pacific. Atmosphere 2019, 10, 341. [Google Scholar] [CrossRef] [Scilit]
- Wu, C.L.; Chau, K.W.; Fan, C. Prediction of rainfall time series using modular artificial neural networks coupled with data preprocessing techniques. J. Hydrol. 2010, 389, 146–167. [Google Scholar] [CrossRef] [Scilit]
- Chadwick, R.; Grimes, D. An artificial neural network approach to multispectral rainfall estimation over Africa. J. Hydrometeorol. 2012, 13, 913–931. [Google Scholar] [CrossRef] [Scilit]
- Wei, C.C. Soft computing techniques in ensemble precipitation nowcast. Appl. Soft Comput. 2013, 13, 793–805. [Google Scholar] [CrossRef] [Scilit]
- Wu, C.L.; Chau, K.W. Prediction of rainfall time series using modular soft computing methods. Eng. Appl. Artif. Intell. 2013, 26, 997–1007. [Google Scholar] [CrossRef] [Scilit]
- Kühnlein, M.; Appelhans, T.; Thies, B.; Nauß, T. Precipitation estimates from MSG SEVIRI daytime, nighttime, and twilight data with random forests. J. Appl. Meteorol. Climatol. 2014, 53, 2457–2480. [Google Scholar] [CrossRef] [Scilit]
- Wei, C.C.; You, G.J.Y.; Chen, L.; Chou, C.C.; Roan, J. Diagnosing rain occurrences using passive microwave imagery: A comparative study on probabilistic graphical models and “black box” models. J. Atmos. Ocean. Technol. 2015, 32, 1729–1744. [Google Scholar] [CrossRef] [Scilit]
- Lo, D.C.; Wei, C.C.; Tsai, N.P. Parameter automatic calibration approach for neural-network-based cyclonic precipitation forecast models. Water 2015, 7, 3963–3977. [Google Scholar] [CrossRef] [Scilit]
- He, X.; Chaney, N.W.; Schleiss, M.; Sheffield, J. Spatial downscaling of precipitation using adaptable random forests. Water Resour. Res. 2016, 52, 8217–8237. [Google Scholar] [CrossRef] [Scilit]
- Kashiwao, T.; Nakayama, K.; Ando, S.; Ikeda, K.; Lee, M.; Bahadori, A. A neural network-based local rainfall prediction system using meteorological data on the Internet: A case study using data from the Japan Meteorological Agency. Appl. Soft Comput. 2017, 56, 317–330. [Google Scholar] [CrossRef] [Scilit]
- Wei, C.C. Examining El Niño–Southern Oscillation effects in the subtropical zone to forecast long-distance total rainfall from typhoons: A case study in Taiwan. J. Atmos. Ocean. Technol. 2017, 34, 2141–2161. [Google Scholar] [CrossRef] [Scilit]
- Chiang, Y.M.; Chang, F.J.; Jou, B.J.D.; Lin, P.F. Dynamic ANN for precipitation estimation and forecasting from radar observations. J. Hydrol. 2007, 334, 250–261. [Google Scholar] [CrossRef] [Scilit]
- Wei, C.C. Simulation of operational typhoon rainfall nowcasting using radar reflectivity combined with meteorological data. J. Geophys. Res. Atmos. 2014, 119, 6578–6595. [Google Scholar] [CrossRef] [Scilit]
- Chen, T.; Guestrin, C. XGBoost: A Scalable Tree Boosting System. In KDD’16: Proceedings of the 22nd ACM SIGKDD International Conference on Knowledge Discovery and Data Mining, San Francisco, CA, USA, 13–17 August 2016; ACM—Association for Computing Machinery: New York, NY, USA, 2016; pp. 785–794. [Google Scholar]
- Just, A.C.; Carli, M.M.D.; Shtein, A.; Dorman, M.; Lyapustin, A.; Kloog, I. Correcting measurement error in satellite aerosol optical depth with machine learning for modeling PM2.5 in the Northeastern USA. Remote Sens. 2018, 10, 803. [Google Scholar] [CrossRef] [Scilit]
- Joharestani, M.Z.; Cao, C.; Ni, X.; Bashir, B.; Talebiesfandarani, S. PM2.5 prediction based on random forest, XGBoost, and deep learning using multisource remote sensing data. Atmosphere 2019, 10, 373. [Google Scholar] [CrossRef] [Scilit]
- Jia, Y.; Jin, S.; Savi, P.; Gao, Y.; Tang, J.; Chen, Y.; Li, W. GNSS-R soil moisture retrieval based on a XGboost machine learning aided method: Performance and validation. Remote Sens. 2019, 11, 1655. [Google Scholar] [CrossRef] [Scilit]
- Jin, R.; Li, X.; Che, T. A decision tree algorithm for surface soil freeze/thaw classification over China using SSM/I brightness temperature. Remote Sens. Environ. 2009, 113, 2651–2660. [Google Scholar] [CrossRef] [Scilit]
- Yuan, T.; Sun, Z.; Ma, S. Gearbox fault prediction of wind turbines based on a stacking model and change-point detection. Energies 2019, 12, 4224. [Google Scholar] [CrossRef] [Scilit]
- Lee, Y.; Han, D.; Ahn, M.H.; Im, J.; Lee, S.J. Retrieval of total precipitable water from Himawari-8 AHI Data: A comparison of random forest, extreme gradient boosting, and deep neural network. Remote Sens. 2019, 11, 1741. [Google Scholar] [CrossRef] [Scilit]
- Ko, C.M.; Jeong, Y.Y.; Lee, Y.M.; Kim, B.S. The development of a quantitative precipitation forecast correction technique based on machine learning for hydrological applications. Atmosphere 2020, 11, 111. [Google Scholar] [CrossRef] [Scilit]
- Central Weather Bureau (CWB). Meteorological Telemetry Observation: Meteorological Satellite and Weather Radar; Report of Meteorological Satellite Center: Taipei, Taiwan, 2015. [Google Scholar]
- Jou, B.J.D. Application of doppler radar data on quantitative precipitation forecasting. In The Meteorological Research and Development; Technical Report No. MOTC-CWB-95-6M-01 (in Chinese). Taiwan’s Central Weather Bureau: Taipei, Taiwan, 2006. [Google Scholar]
- Taylor, R. Interpretation of the correlation coefficient: A basic review. J. Diagn. Med Sonogr. 1990, 1, 35–39. [Google Scholar] [CrossRef] [Scilit]
- Yan, X.; Zhang, L.; Li, J.; Du, D.; Hou, F. Entropy-based measures of hypnopompic heart rate variability contribute to the automatic prediction of cardiovascular events. Entropy 2020, 22, 241. [Google Scholar] [CrossRef] [Scilit]
- Zhang, Z.; Li, Y.; Jin, S.; Zhang, Z.; Wang, H.; Qi, L.; Zhou, R. Modulation signal recognition based on information entropy and ensemble learning. Entropy 2018, 20, 198. [Google Scholar] [CrossRef] [Scilit]
- Pedregosa, F.; Varoquaux, G.; Gramfort, A.; Michel, V.; Thirion, B.; Grisel, O.; Blondel, M.; Prettenhofer, P.; Weiss, R.; Dubourg, V.; et al. Scikit-learn: Machine learning in Python. J. Mach. Learn. Res. 2011, 12, 2825–2830. [Google Scholar]
- Chollet, F. Keras: Deep Learning Library for Theano and Tensorflow. 2015. Available online: https://keras.io/ (accessed on 1 February 2020).
- Waco, D.E. Temperatures and turbulence at tropopause levels over Hurricane Beulah (1967). Mon. Weather Rev. 1970, 98, 749–755. [Google Scholar] [CrossRef] [Scilit]
- Houze, R.A.; Lee, W.; Bell, M.M. Convective contribution to the genesis of Hurricane Ophelia (2005). Mon. Weather Rev. 2009, 137, 2778–2800. [Google Scholar] [CrossRef] [Scilit]
- Houze, R.A. Clouds in tropical cyclones. Mon. Weather Rev. 2010, 138, 293–344. [Google Scholar] [CrossRef]



© 2020 by the authors. Licensee MDPI, Basel, Switzerland. This article is an open access article distributed under the terms and conditions of the Creative Commons Attribution (CC BY) license (http://creativecommons.org/licenses/by/4.0/).