Synergy of High-Resolution Radar and Optical Images Satellite for Identification and Mapping of Wetland Macrophytes on the Danube Delta
Abstract
1. Introduction
2. Materials and Methods
2.1. Study Area and Vegetation of Danube Delta
2.1.1. Study Area
2.1.2. Phragmites australis
2.1.3. Aquatic Macrophyte Vegetation
2.2. Data Set
2.2.1. Satellite Data
2.2.2. Environmental Data
2.3. Methodology
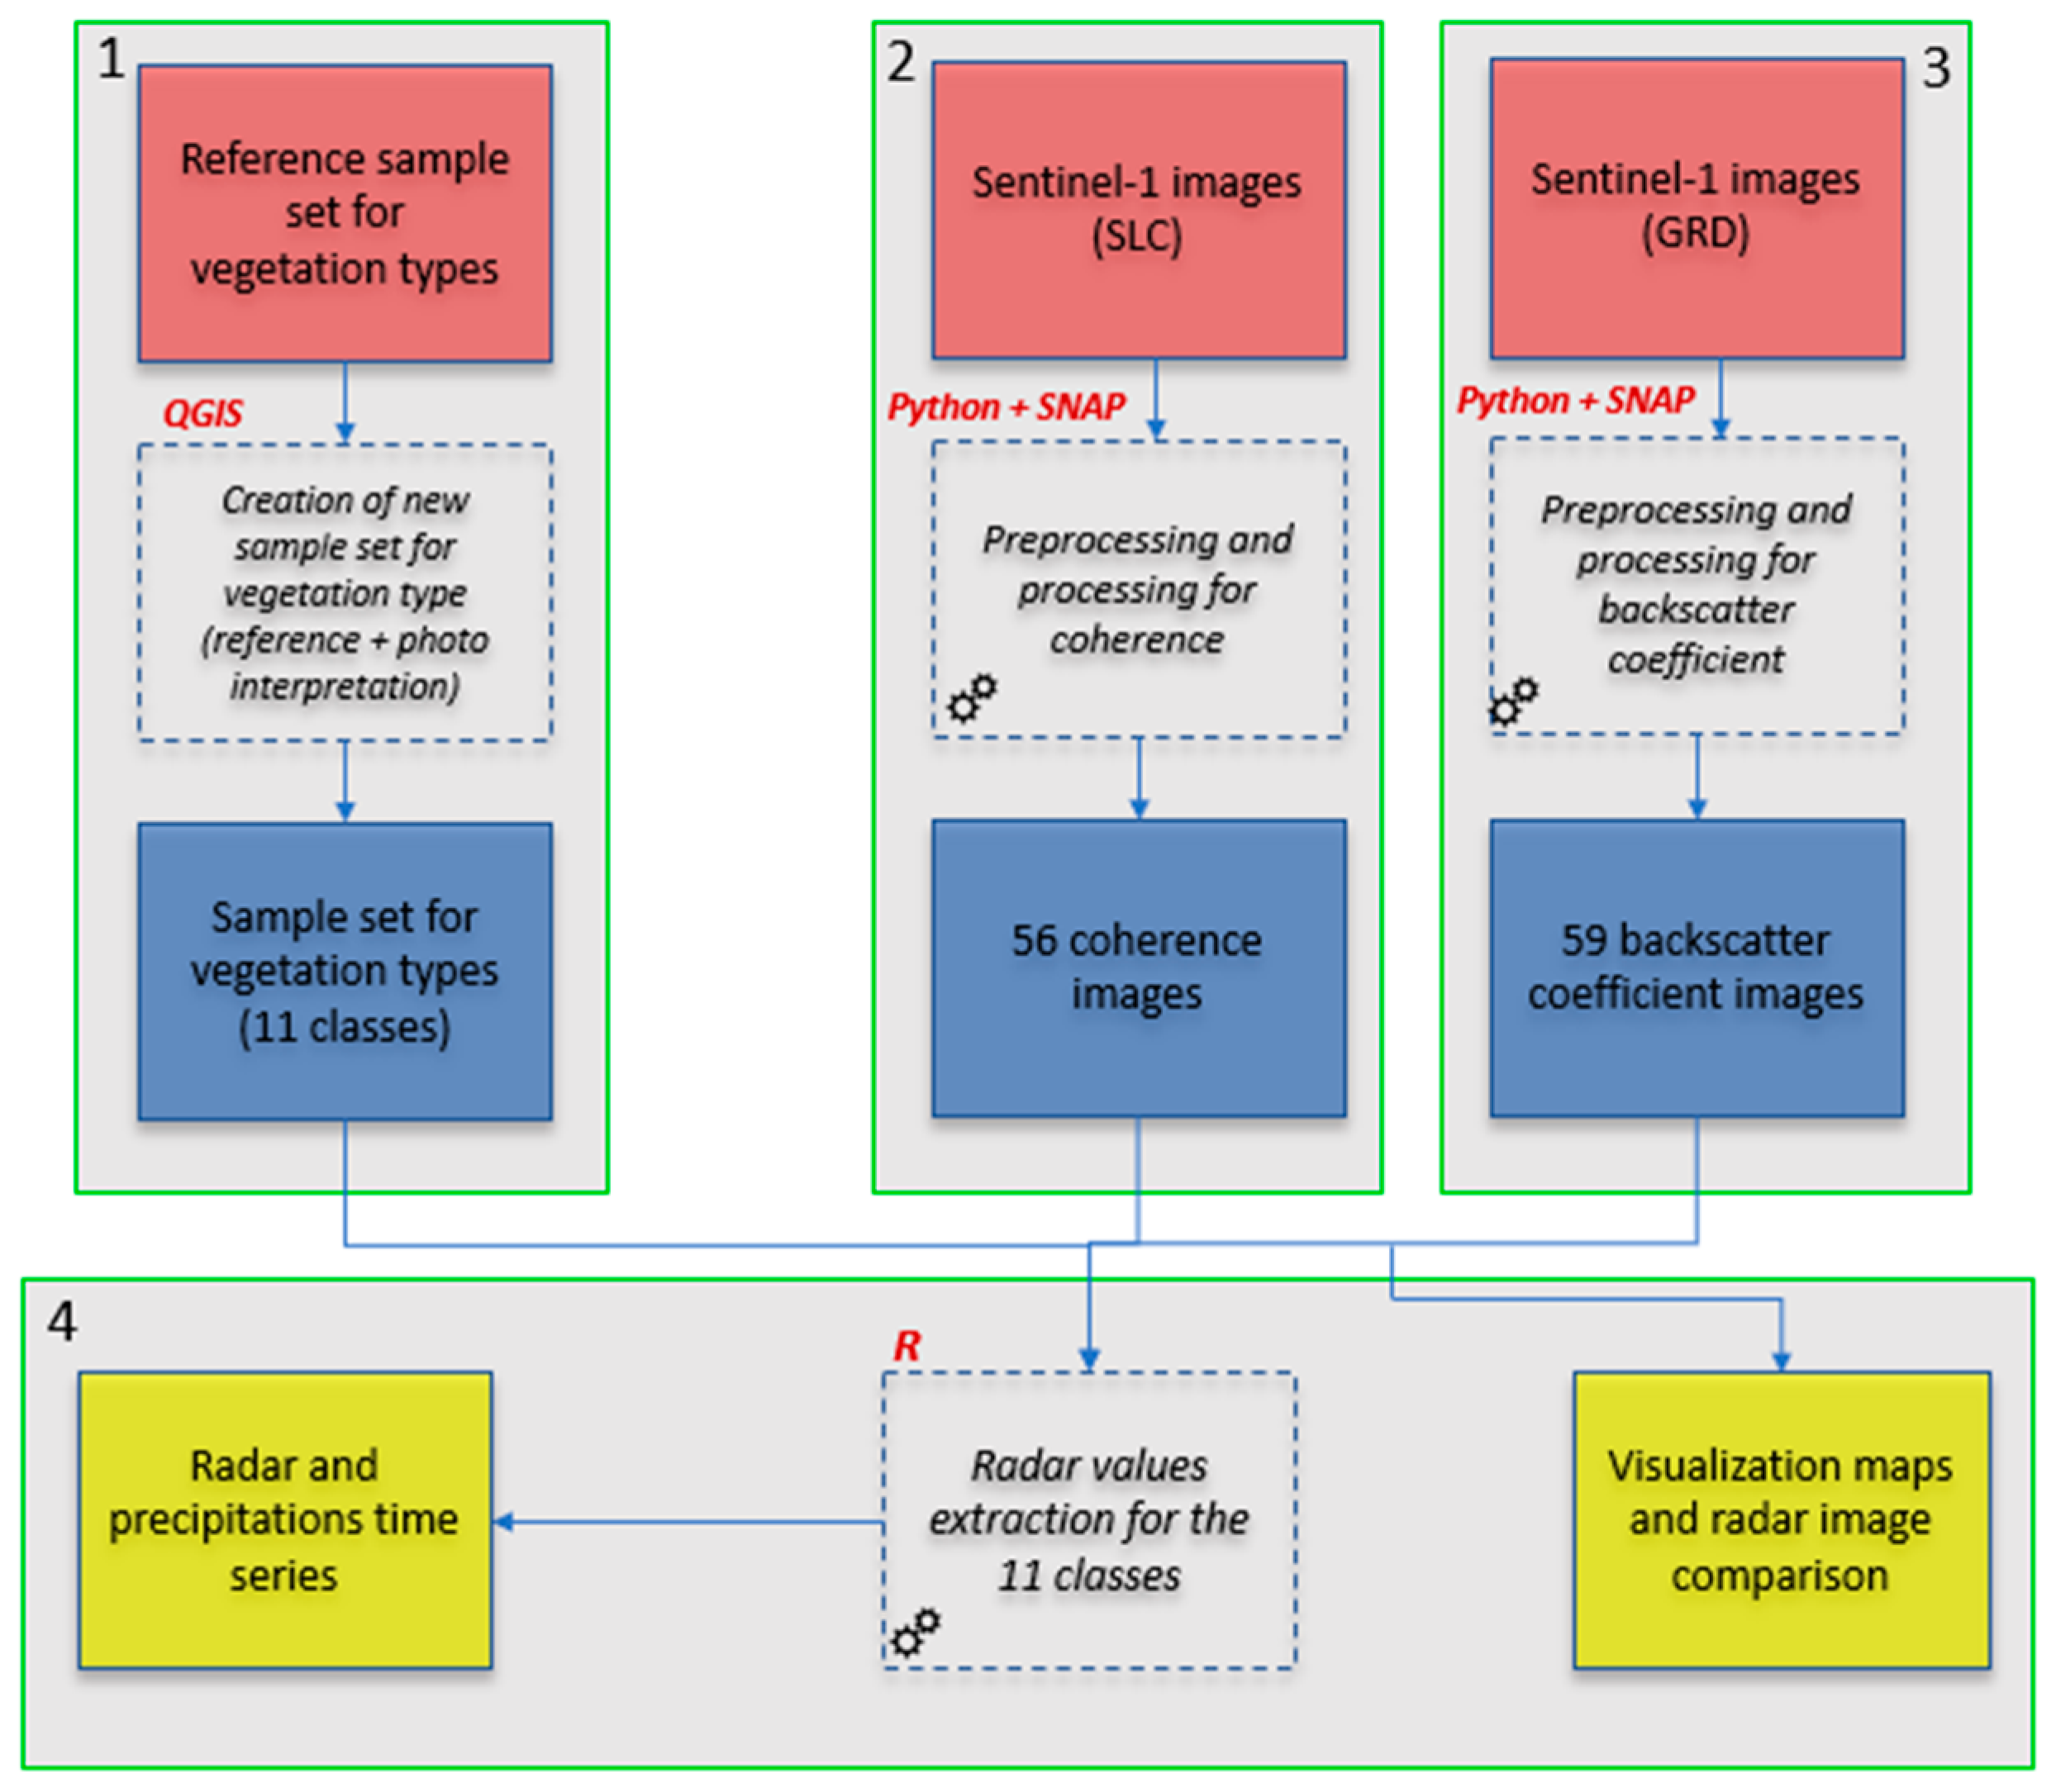
2.3.1. Backscatter Coefficient and Coherence Estimation
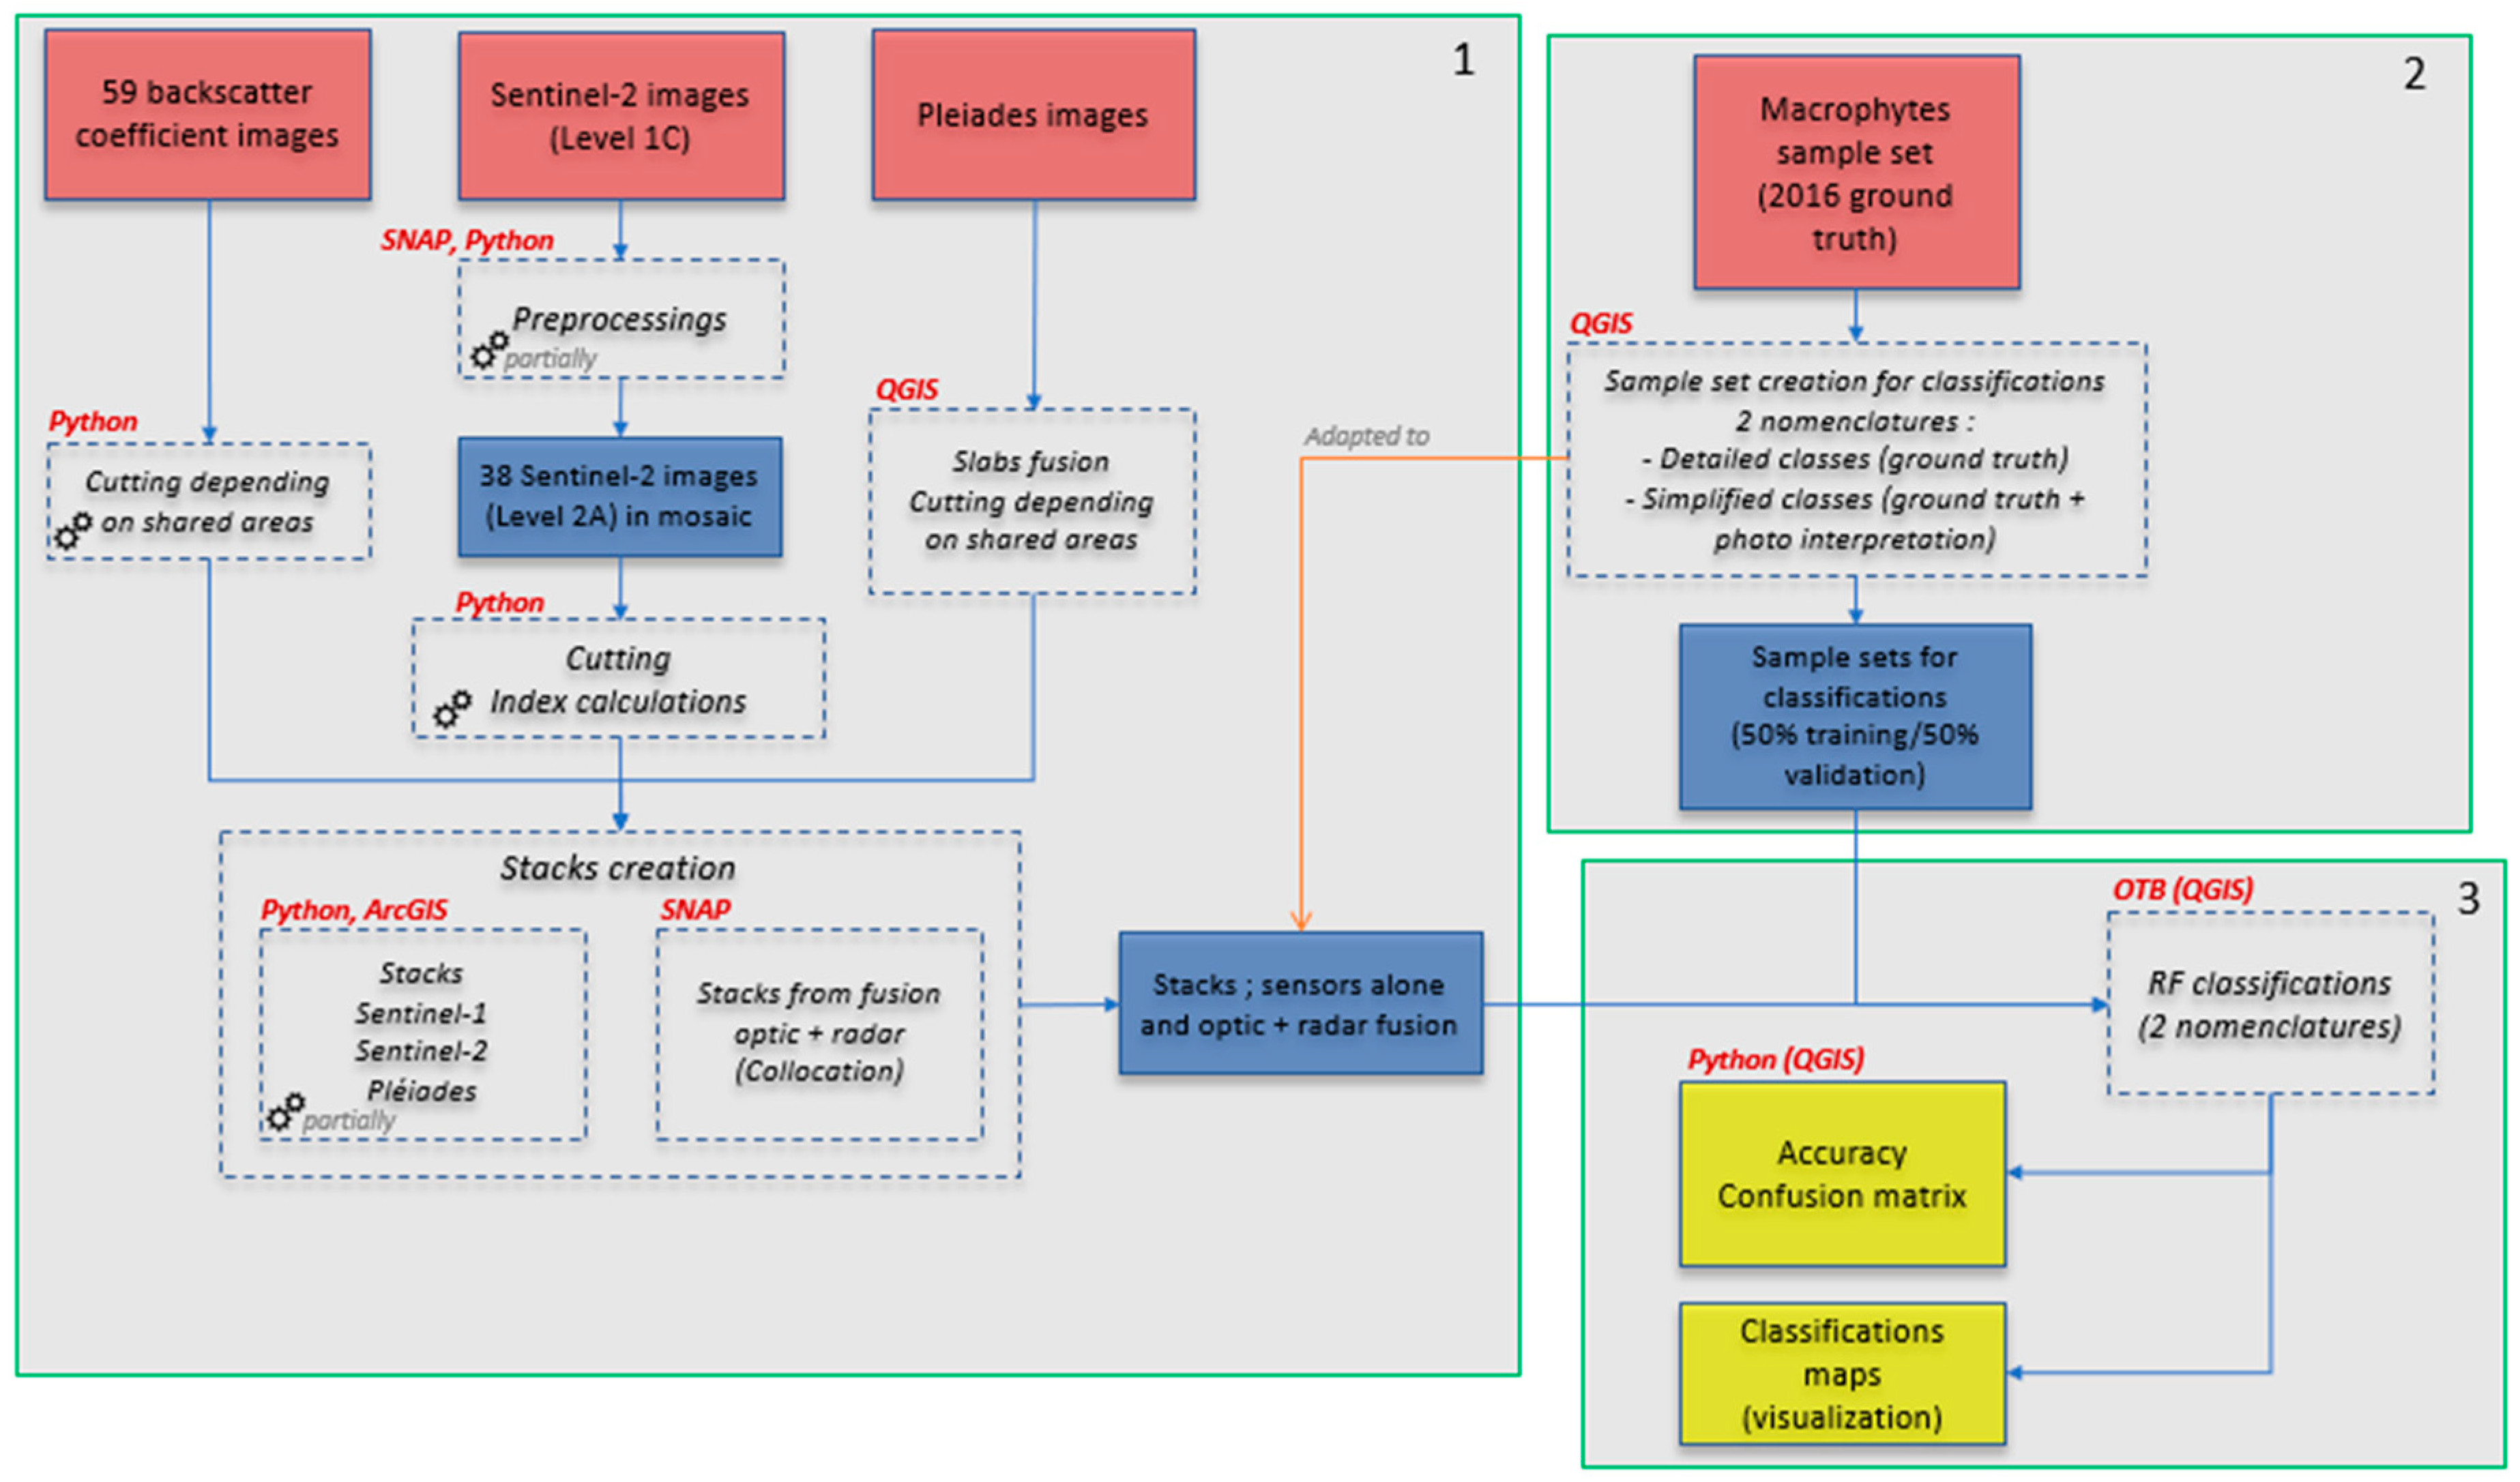
2.3.2. Machine Learning Method (Random Forest) and Classification of Macrophytes
2.3.3. Ground Reference Data Collection
2.3.4. Accuracy Assessment
3. Results
3.1. Sentinel-1 Radar Images to Differentiate the Different Classes of Phragmites australis
3.1.1. Backscattering Coefficient to Identify the Phragmites australis
3.1.2. Coherence for the Different Classes of Phragmites australis and Identification of the Cut Reed
3.2. Macrophyte Classifications
3.2.1. Nomenclature
3.2.2. Estimating Overall Accuracy
3.2.3. Estimating Producer’s Accuracy (PA), User’s accuracy (UA)
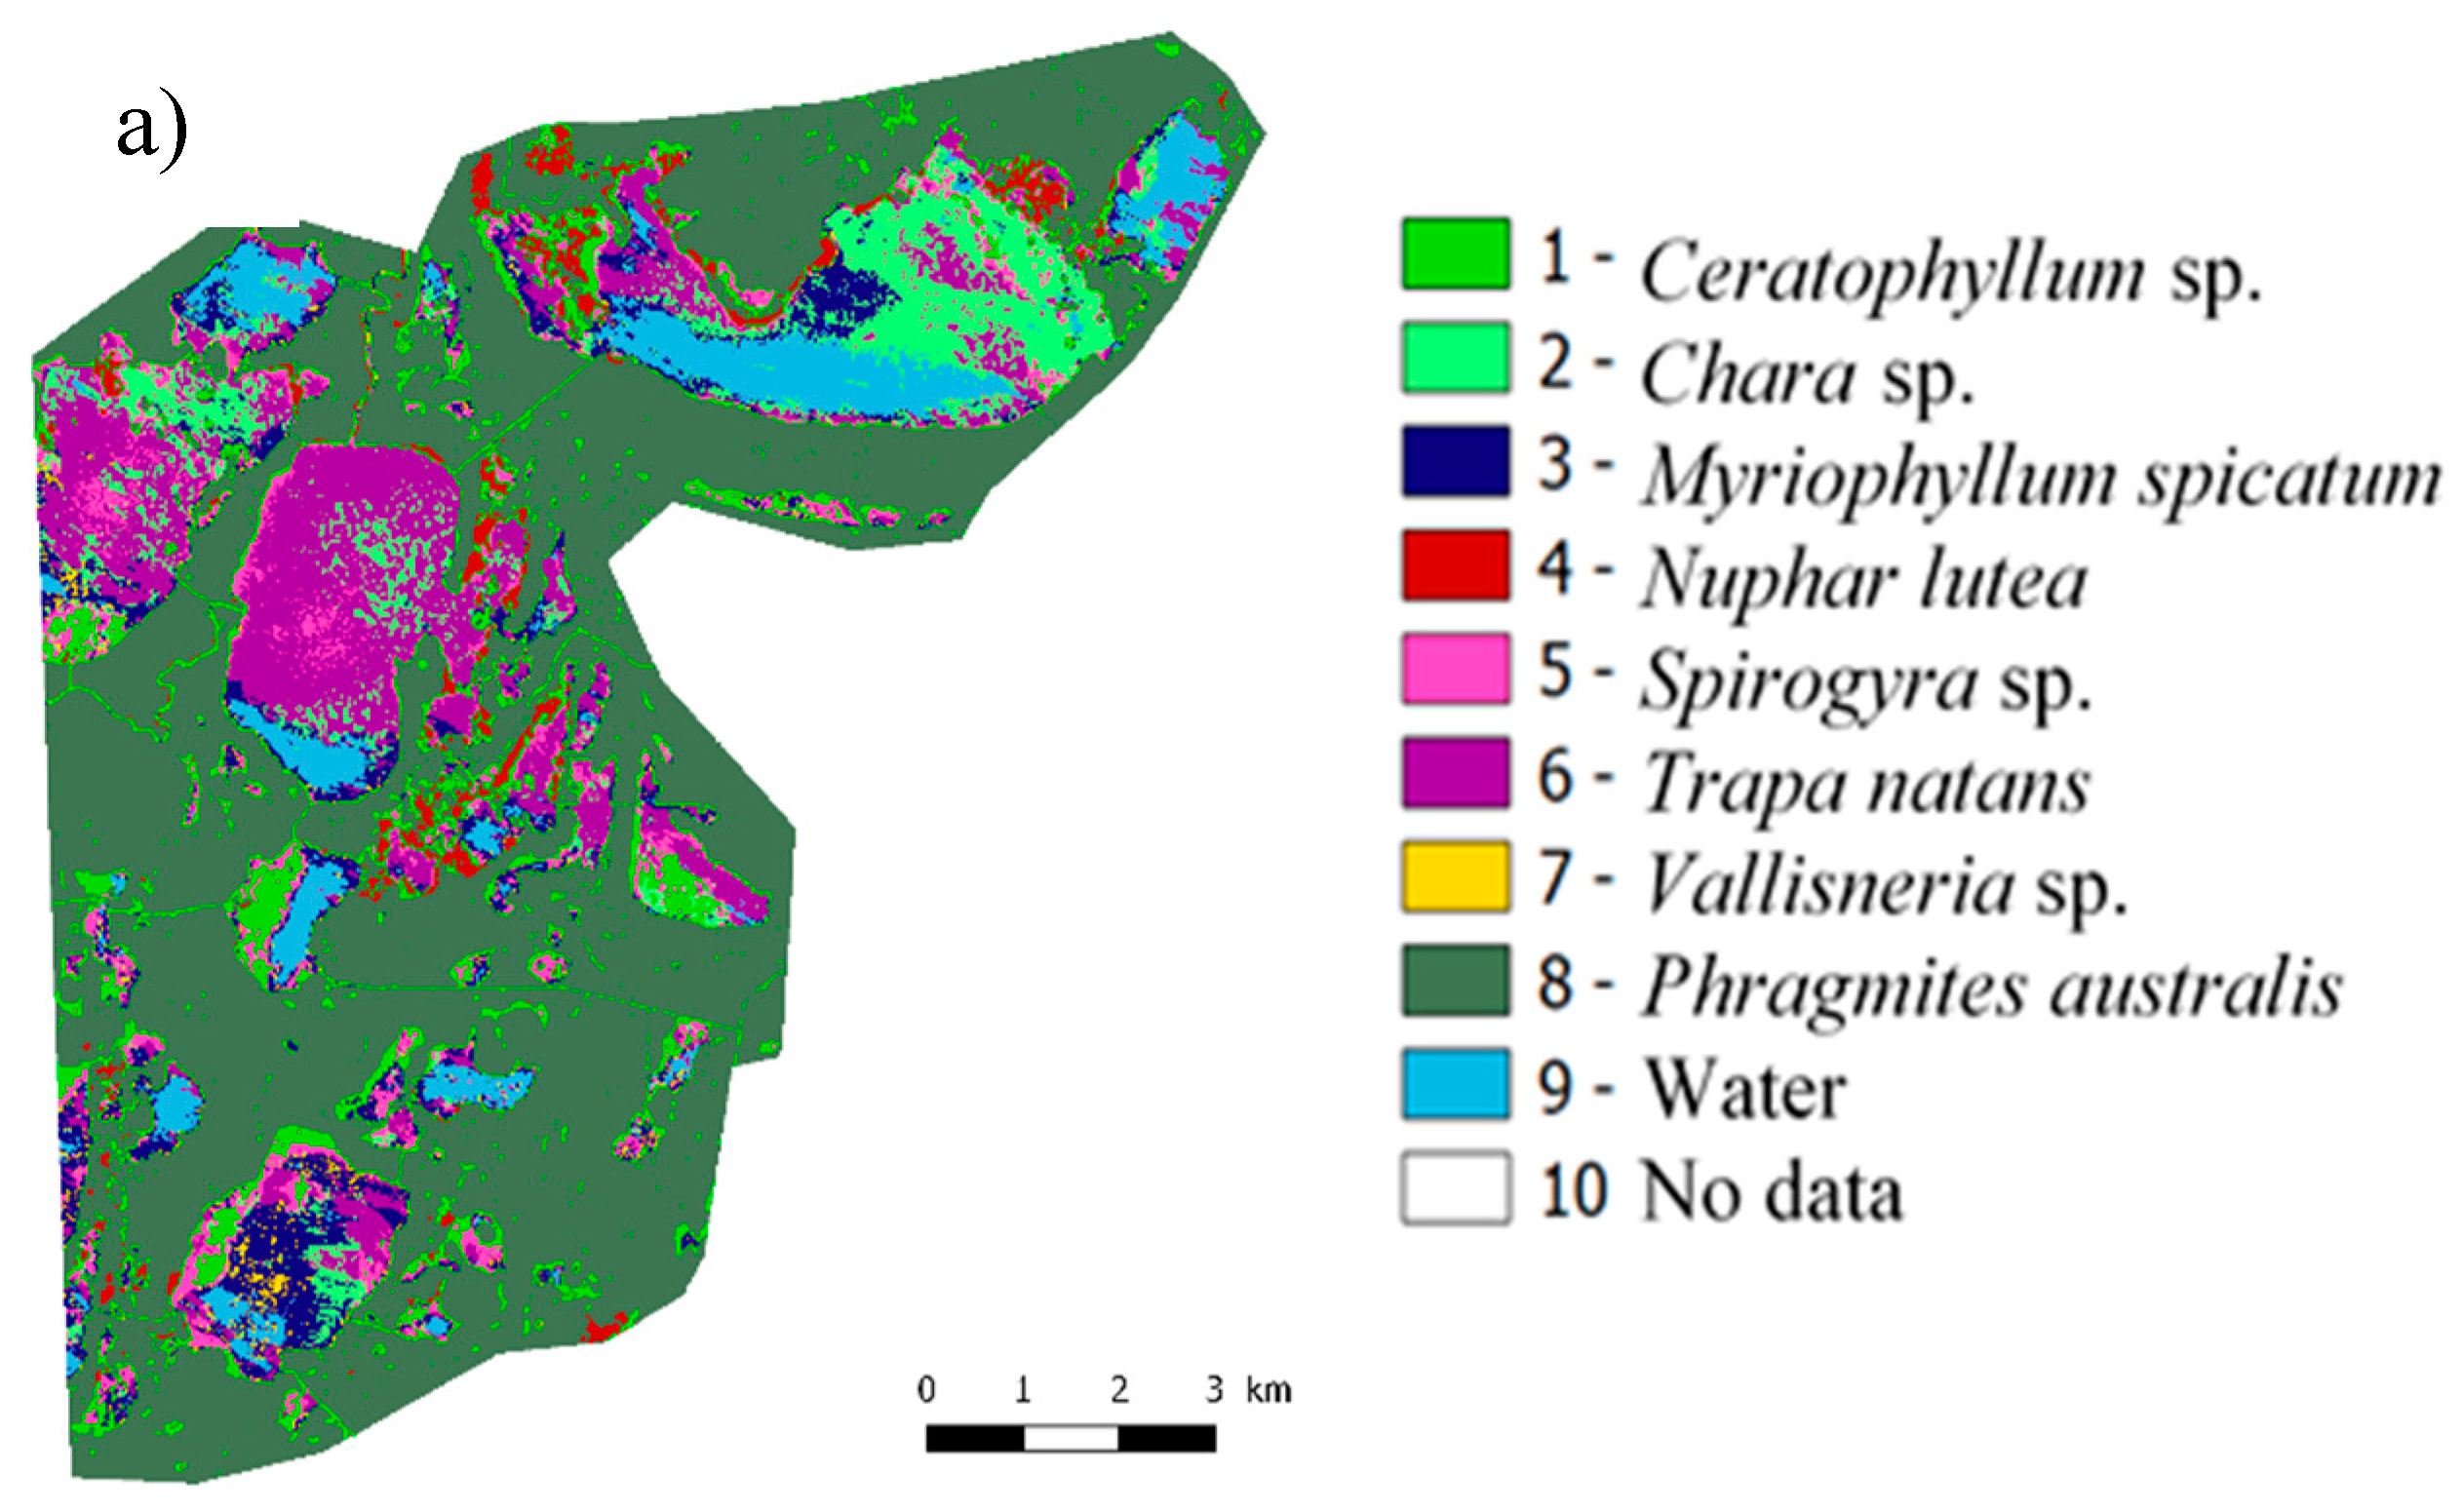
3.2.4. Mapping Macrophytes
4. Discussion
4.1. Sentinel-1 Radar Images Identified the Different Classes of Phragmites australis
4.2. Macrophyte Classifications
4.2.1. Accuracy Assessment
4.2.2. Comparison to Other Studies
4.3. Future Directions
5. Conclusions
Supplementary Materials
Author Contributions
Funding
Conflicts of Interest
References
- Mitsch, W.J.; Gosselink, J.G. Wetlands; Van Nostrand Reinhold: New York, NY, USA, 1986; 722p. [Google Scholar]
- Van der Putten, W.H. Die back of Phragmites australis in European wetlands: An overview of the European Research Programme on reed die-back and progression (1993–1994). Aquat. Bot. 1997, 59, 263–275. [Google Scholar] [CrossRef]
- RejmánkováJ, E. The role of macrophytes in wetland ecosystems. Ecol. Field Biol. 2011, 34, 333–345. [Google Scholar]
- Casanova, M.T. Using water plant functional groups to investigate environmental water requirements. Freshw. Biol. 2011, 56, 2637–2652. [Google Scholar] [CrossRef]
- Taddeo, S.; Dronova, I.; Depsky, N. Spectral vegetation indices of wetland greenness: Responses to vegetation structure, composition, and spatial distribution. Remote Sens. Environ. 2019, 234, 111467. [Google Scholar] [CrossRef]
- Jensen, D.; Cavanaugh, K.C.; Simard, M.; Okin, G.S.; Castaneda-Moya, E.; McCall, A.; Twilley, R.R. Integrating imaging spectrometer and synthetic aperture radar data for estimating wetland vegetation aboveground biomass in coastal louisiana. Remote Sens. 2019, 11, 2533. [Google Scholar] [CrossRef]
- Van Deventer, H.; Cho, M.A.; Mutanga, O. Multi-season RapidEye imagery improves the classification of wetland and dryland communities in a subtropical coastal region. ISPRS-J. Photogramm. Remote Sens. 2019, 157, 171–187. [Google Scholar] [CrossRef]
- Rapinel, S.; Fabre, E.; Dufour, S.; Arvor, D.; Mony, C.; Hubert-Moy, L. Mapping potential, existing and efficient wetlands using free remote sensing data. J. Environ. Manag. 2019, 247, 829–839. [Google Scholar] [CrossRef]
- Rupasinghe, P.A.; Chow-Fraser, P. Identification of most spectrally distinguishable phenological stage of invasive Phramites australis in Lake Erie wetlands (Canada) for accurate mapping using multispectral satellite imagery. Wetl. Ecol. Manag. 2019, 27, 513–538. [Google Scholar] [CrossRef]
- Abeysinghe, T.; Milas, A.S.; Arend, K.; Hohman, B.; Reil, P.; Gregory, A.; Vazquez-Ortega, A. Mapping invasive phragmites australis in the old woman creek estuary using UAV remote sensing and machine learning classifiers. Remote Sens. 2019, 11, 1380. [Google Scholar] [CrossRef]
- Wang, H.; Ma, M. Impacts of climate change and anthropogenic activities on the ecological restoration of wetlands in the arid regions of china. Energies 2016, 9, 166. [Google Scholar] [CrossRef]
- Niculescu, S.; Billey, A.; Talab Ou Ali, H. Random Forest Classification using Sentinel-1 and Sentinel-2 series for vegetation monitoring in the Pays de Brest (France). SPIE DIGITAL LIBRARY SPIE Remote Sens. 2018, 10783, 1078305. [Google Scholar] [CrossRef]
- Guo, M.; Li, J.; Sheng, C.; Xu, J.; Wu, L. A review of wetland remote sensing. Sensors (Basel) 2017, 17, 777. [Google Scholar] [CrossRef] [PubMed]
- Nguyen, T.T.H.; De Bie, C.A.J.M.; Ali, A.; Smaling, E.M.A.; Chu, T.H. Mapping the irrigated rice cropping patterns of the Mekong Delta, Vietnam, through hyper-temporal SPOT NDVI image analysis. Int. J. Remote Sens. 2012, 33, 415–434. [Google Scholar] [CrossRef]
- Gonzalez, E.; Gonzalez Trilla, G.; San Martin, L.; Grimson, R.; Kandus, P. Vegetation patterns in a South American coastal wetland using high-resolution imagery. J. Maps 2019, 15, 642–650. [Google Scholar] [CrossRef]
- Proenca, B.; Frappart, F.; Lubac, B.; Marieu, V.; Ygorra, B.; Bombrun, L.; Michalet, R.; Sottolichio, A. Potential of High-Resolution Pleiades Imagery to Monitor Salt Marsh Evolution After Spartina Invasion. Remote Sens. 2019, 11, 968. [Google Scholar] [CrossRef]
- McCarthy, M.J.; Radabaugh, K.R.; Moyer, R.P.; Muller-Karger, F.E. Enabling efficient, large-scale high-spatial resolution wetland mapping using satellites. Remote Sens. Environ. 2018, 208, 189–201. [Google Scholar] [CrossRef]
- Schmidt, K.S.; Skidmore, A.K. Spectral discrimination of vegetation types in a coastal wetland. Remote Sens. Environ. 2003, 85, 92–108. [Google Scholar] [CrossRef]
- Silva, T.S.F.; Costa, M.P.F.; Melack, J.M.; Novo, E.M.L.M. Remote sensing of aquatic vegetation: Theory and applications. Environ. Monit. Assess. 2008, 140, 131–145. [Google Scholar] [CrossRef]
- Morandeira, N.S.; Grings, F.; Facchinetti, C.; Kandus, P. Mapping plant functional types in floodplain wetlands: An analysis of C-band polarimetric SAR data from RADARSAT-2. Remote Sens. 2016, 8, 174. [Google Scholar] [CrossRef]
- Adam, E.; Mutanga, O.; Rugege, D. Multispectral and hyperspectral remote sensing for identification and mapping of wetland vegetation: A review. Wetl. Ecol. Manag. 2010, 18, 281–296. [Google Scholar] [CrossRef]
- Zomer, R.; Trabucco, A.; Ustin, S. Building spectral libraries for wetlands land cover classification and hyperspectral remote sensing. J. Environ. Manag. 2009, 90, 2170–2177. [Google Scholar] [CrossRef] [PubMed]
- Ozesmi, S.L.; Bauer, M.E. Satellite remote sensing of wetlands. Wetl. Ecol. Manag. 2002, 10, 381–402. [Google Scholar] [CrossRef]
- Henderson, F.M.; Lewis, A.J. Radar detection of wetland ecosystems: A review. Int. J. Remote Sens. 2008, 29, 5809–5835. [Google Scholar] [CrossRef]
- Martinis, S.; Kuenzer, C.; Wendleder, A.; Huth, J.; Twele, A.; Roth, A.; Dech, S. Comparing four operational SAR-based water and flood detection approaches. Int. J. Remote Sens. 2015, 36, 3519–3543. [Google Scholar] [CrossRef]
- White, L.; Brisco, B.; Dabboor, M.; Schmitt, A.; Pratt, A. A collection of SAR methodologies for monitoring wetlands. Remote Sens. 2015, 7, 7615–7645. [Google Scholar] [CrossRef]
- Vreugdenhil, M.; Dorigo, W.A.; Wagner, W.; De Jeu, R.A.; Hahn, S.; Van Marle, M.J. Analyzing the vegetation parameterization in the TU-Wien ASCAT soil moisture retrieval. IEEE Trans. Geosci. Remote Sens. 2016, 54, 3513–3531. [Google Scholar] [CrossRef]
- Ferrazzoli, P.; Paloscia, S.; Pampaloni, P.; Schiavon, G.; Solimini, D.; Coppo, P. Sensitivity of microwave measurements to vegetation biomass and soil moisture content: A case study. IEEE Trans. Geosci. Remote Sens. 1992, 30, 750–756. [Google Scholar] [CrossRef]
- Paloscia, S.; Macelloni, G.; Pampaloni, P.; Sigismondi, S. The potential of C- and L-band SAR in estimating vegetation biomass: The ERS-1 and JERS-1 experiments. IEEE Trans. Geosci. Remote Sens. 1999, 37, 2107–2110. [Google Scholar] [CrossRef]
- Pope, K.O.; Rejmankova, E.; Paris, J.F.; Woodruff, R. Detecting seasonal flooding cycles in marshes of the Yucatán peninsula with SIR-C polarimetric radar imagery. Remote Sens. Environ. 1997, 59, 157–166. [Google Scholar] [CrossRef]
- Niculescu, S.; Lardeux, C.; Grigoras, I.; Hanganu, J.; David, L. Synergy between LiDAR, RADARSAT-2 and SPOT-5 images for the detection and mapping of wetland vegetation in the Danube Delta. IEEE J. Sel. Top. Appl. Earth Obs. Remote Sens. 2016, 9, 3651–3666. [Google Scholar] [CrossRef]
- Niculescu, S.; Lardeux, C.; Hanganu, J. Alteration and Remediation of Coastal Wetland Ecosystems in the Danube Delta: A Remote-Sensing Approach. In Coastal Research Library; Chapter 17; Springer International Publishing: Cham, Switzerland, 2017; Volume 21, pp. 513–554. [Google Scholar] [CrossRef]
- Niculescu, S.; Ienco, D.; Hanganu, J. Application of Deep Learning of multi-temporal Sentinel-1 images for the classification of coastal vegetation zone of the Danube Delta. Int. Arch. Photogramm. Remote Sens. Spat. Inf. Sci. 2018, 42, 1311–1318. [Google Scholar] [CrossRef]
- Fu, B.; Wang, Y.; Campbell, A.; Li, Y.; Zhang, B.; Yin, S.; Xing, Z.; Jin, X. Comparison of object-based and pixel-based Random Forest algorithm for wetland vegetation mapping using high spatial resolution GF-1 and SAR data. Ecol. Indic. 2017, 73, 105–117. [Google Scholar] [CrossRef]
- Tian, S.; Zhang, X.; Tian, J.; Sun, Q. Random Forest Classification of Wetland Land covers from Multi-Sensor Data in the Arid Region of Xinjiang, China. Remote Sens. 2016, 8, 954. [Google Scholar] [CrossRef]
- Mutanga, O.; Adam, E.; Cho, M.A. High density biomass estimation for wetland vegetation using WorldView-2 imagery and random forest regression algorithm. Int. J Appl. Earth Obs. Geoinf. 2012, 18, 399–406. [Google Scholar] [CrossRef]
- Mahdianpari, M.; Salehi, B.; Mohammadimanesh, F.; Motagh, M. Random forest wetland classification using ALOS-2 L-band, RADARSAT-2 C-band, and TerraSAR-X imagery. ISPRS J. Photogramm. Remote Sens. 2017, 130, 13–31. [Google Scholar] [CrossRef]
- Berhane, T.M.; Lane, C.R.; Wu, Q.; Autrey, B.C.; Anenkhonov, O.A.; Chepinoga, V.V.; Liu, H. Decision-tree, rule-based, and random forest classification of high-resolution multispectral imagery for wetland mapping and inventory. Remote Sens (Basel) 2018, 10, 580. [Google Scholar] [CrossRef] [PubMed]
- Hanganu, J.; Dubyna, D.; Zhmud, E.; Grigoraş, I.; Menke, U.; Drost, H.; Ştefan, N.; Sârbu, I. Vegetation of the Biosphere Reserve Danube Delta—With Transboundary Vegetation Map on a 1:150.000 Scale, Danube Delta National Institute, Romania; Kholodny, M.G., Ed.; Institute of Botany and Danube Delta Biosphre Reserve, Ukraine and RIZA: Lelystad, The Netherlands, 2002. [Google Scholar]
- Oosterberg, W.; Buijse, A.D.; Coops, H.; Ibelings, B.W.; Menting, G.A.M. Ecological Gradients in the Danube Delta lakes: Present State and Man-Induced Changes; RIZA: Lelystad, The Netherlands, 2000. [Google Scholar]
- Vollenweider, R.A.; Kerekes, J. Eutrophication of Waters. Monitoring, Assessment and Control. Methoden der Kartierung von Flora und Vegetation von Süßwasserbiotopen. In Cooperative Programme on Monitoring of Inland Waters (Eutrophication Control); Environment Directorate OECD: Paris, France, 1982. [Google Scholar]
- Kohler, A. Methoden der Kartierung von Flora und Vegetation von Süßwasserbiotopen. Landschaft 1978, 10, 73–85. [Google Scholar]
- Hanganu, J.; Doroftei, M. Physical landscape—Danube delta reed beds. In The Biopolitics of the Danube Delta: Nature, History, Policies; Lexington Books: Lanham, MD, USA, 2016. [Google Scholar]
- ESA. TOPS Interferometry Tutorial; Sentinel 1 Toolbox; Array Systems Computing: 2015. Available online: http://step.esa.int/docs/tutorials/S1TBX%20TOPSAR%20Interferometry%20with%20Sentinel-1%20Tutorial_v2.pdf (accessed on 7 July 2020).
- Breiman, L. Random forests. Mach. Learn. 2001, 45, 5–32. [Google Scholar] [CrossRef]
- Houborg, R.; McCabe, M.F. A hybrid training approach for leaf area index estimation via cubist and random forests machine learning. ISPRS J. Photogramm. Remote Sens. 2018, 135, 173–188. [Google Scholar] [CrossRef]
- Belgiu, M.; Drăguţ, L. Random forest in remote sensing: A review of applications and future directions. ISPRS J. Photogramm. Remote Sens. 2016, 114, 24–31. [Google Scholar] [CrossRef]
- Wang, D.; Wan, B.; Qiu, P.; Su, Y.; Guo, Q.; Wu, X. Artificial mangrove species mapping using pléiades-1: An evaluation of pixel-based and object-based classifications with selected machine learning algorithms. Remote Sens. 2018, 10, 294. [Google Scholar] [CrossRef]
- Olofsson, P.; Foody, G.M.; Herold, M.; Stehman, S.V.; Woodcock, C.E.; Wulder, M.A. Good practices for estimating area and assessing accuracy of land change. Remote Sens. Environ. 2014, 148, 42–57. [Google Scholar] [CrossRef]
- Wulder, M.A.; White, J.C.; Magnussen, S.; McDonald, S. Validation of a largearea land cover product using purpose-acquired airborne video. Remote Sens. Environ. 2007, 106, 480–491. [Google Scholar] [CrossRef]
- ***, 2019 – Fundamentarea măsurilor de reconstrucție ecologică a lacurilor din Delta Dunării pe baza studiului dinamicii habitatelor de macrofite acvatice, 19 pagini. Raport Faza 4 / Decembrie/2019, al proiectului nr. PN 19 12 02 01 04 (coord. Jenică Hanganu) al contractului nr. 41N/2019/MCI, executant: INCDDD—Tulcea. România (publication in progress).
- Olofsson, P.; Foody, G.M.; Stehman, S.V.; Woodcock, C.E. Making better use of accuracy data in land change studies: Estimating accuracy and area and quantifying uncertainty using stratified estimation. Remote Sens. Environ. 2013, 129, 122–131. [Google Scholar] [CrossRef]
- Baghdadi, N.; Moinet, S.; Todoroff, P.; Cresson, R. Utilisation de l’imagerie radar Terrasar-X THRS pour le suivi de la coupe de canne à sucre à l’Ile de la Réunion. Revue Fr. Photogramm. Télédétect. 2014, 197, 63–75. [Google Scholar]
- Tamm, T.; Zalite, K.; Voormansik, K.; Talgre, L. Relating Sentinel-1 Interferometric Coherence to Mowing Events on Grasslands. Remote Sens. 2016, 8, 802. [Google Scholar] [CrossRef]
- Whyte, A.; Ferentinos, K.P.; Petropoulos, G.P. A new synergistic approach for monitoring wetlands using Sentinels-1 and 2 data with object-based machine learning algorithms. Environ. Model. Softw. 2018, 104, 40–54. [Google Scholar] [CrossRef]
- Clerici, N.; Valbuena Calderón, C.A.; Posada, J.M. Fusion of sentinel-1a and sentinel-2A data for land cover mapping: A case study in the lower Magdalena region, Colombia. J. Maps 2017, 13, 718–726. [Google Scholar] [CrossRef]
- Tavares, P.A.; Beltrão, N.E.S.; Guimarães, U.S.; Teodoro, A.C. Integration of Sentinel-1 and Sentinel-2 for Classification and LULC Mapping in the Urban Area of Belém, Eastern Brazilian Amazon. Sensors (Basel) 2019, 19. [Google Scholar] [CrossRef] [PubMed]
- Erinjery, J.J.; Singh, M.; Kent, R. Mapping and assessment of vegetation types in the tropical rainforests of the Western Ghats using multispectral Sentinel-2 and SAR Sentinel-1 satellite imagery. Remote Sens. Environ. 2018, 216, 345–354. [Google Scholar] [CrossRef]
- Chatziantoniou, A.; Petropoulos, G.P.; Psomiadis, E. Co-Orbital Sentinel 1 and 2 for LULC Mapping with Emphasis on Wetlands in a Mediterranean Setting Based on Machine Learning. Remote Sens. 2017, 9, 1259. [Google Scholar] [CrossRef]
- Frison, P.-L.; Kmiha, S.; Fruneau, B.; Soudani, K.; Dufrêne, E.; Koleck, T.; Villard, L.; Lepage, M.; Dejoux, J.-F.; Rudant, J.-P.; et al. Contribution of Sentinel-1 data for the monitoring of seasonal variations of the vegetation. MULTITEMP 2017, Bruges, Belgium. Available online: https://multitemp2017.vito.be/sites/multitemp2017.vito.be/files/1600-1-for_websitemultitemp_27jun17_plf.pdf (accessed on 7 June 2020).
- Talab Ou Ali, H.; Niculescu, S.; Sellin, V.; Bougault, C. Contribution of the new satellites (Sentinel-1, Sentinel-2 and SPOT-6) to the coastal vegetation monitoring in the Pays de Brest (France). In Proceedings of the SPIE, Warsaw, Poland, 2 November 2017; Volume 10421, p. 1042129. [Google Scholar]
- Marbouti, M.; Praks, J.; Antropov, O.; Rinne, E.; Leppäranta, M. A study of landfast ice with Sentinel-1 repeat-pass interferometry over the Baltic Sea. Remote Sens. 2017, 9, 833. [Google Scholar] [CrossRef]
- Dubeau, P.; King, D.J.; Unbushe, D.G.; Rebelo, L.-M. Mapping the Dabus Wetlands, Ethiopia, Using Random Forest Classification of Landsat, PALSAR and Topographic Data. Remote Sens. 2017, 9, 1056. [Google Scholar] [CrossRef]
- Lane, C.; Liu, H.; Autrey, B.; Anenkhonov, O.; Chepinoga, V.; Wu, Q. Improved Wetland Classification Using Eight-Band High Resolution Satellite Imagery and a Hybrid Approach. Remote Sens. 2014, 6, 12187–12216. [Google Scholar] [CrossRef]
- Kim, Y.; van Zyl, J. Vegetation effects on soil moisture estimation. In Proceedings of the Geoscience and Remote Sensing Symposium, Anchorage, AK, USA, 20–24 September 2004; Volume 2, pp. 800–802. [Google Scholar]


| Sensor | Type of Sensor | Bands | Spatial Resolution | Number of Images Dates of Recording |
|---|---|---|---|---|
| Sentinel-1 (GRD and SLC) | RADAR | VH VV | 10 m | 59 images 03/01/2016–29/12/2017 |
| Sentinel-2 (Level 1C) | OPTICAL | 13 bands | 10 m/20 m/60 m | 2 × 38 images 02/18/2016–12/09/2017 |
| Pléiades | OPTICAL | 5 bands | 0.7 m 0.5 m panchromatic | 3 images 08/14/2016 1 image 07/11/2017 2 images |
| 5 Phragmites australis Classes | 6 Other Classes | ||
|---|---|---|---|
| Type of Phragmites australis | Samples | Type of land cover | Samples |
| Compact reed on plaur | 30 | Urban areas | 10 |
| Compact reed on plaur/reed cut | 19 | Crops | 12 |
| Open reed on plaur | 24 | Dunes (sand) | 28 |
| Pure reed | 29 | Dunes (vegetation) | 18 |
| Reed on salinized soil | 11 | Water | 16 |
| Forest | 26 | ||
| Nomenclature | Stack | OA with Samples Validation Reed North | OA without Samples Validation Reed North | OA with Samples Validation Reed South | OA without Samples Validation Reed South |
|---|---|---|---|---|---|
| Detailed nomenclature | P + S1 | 63.82 ± 0.16 | 21,2 ± 1.2 | 78.79 ± 1.02 | 28.57 ± 1.02 |
| S1 | 73.5 ± 3.02 | 43.3 ± 2.97 | 68.36 ± 2.85 | 25.85 ± 0.99 | |
| S2 (bands) | 88.33 ± 2.48 | 69.55 ± 10.12 | 74.97 ± 1.54 | 26.41 ± 1.41 | |
| S1 + S2 (bands) | 79.08 ± 5.67 | 54.5 ± 12.33 | 70.01 ± 3.31 | 69.05 ± 4.16 | |
| S1 + S2 indices | 82.22 ± 3.71 | 60.73 ± 8.18 | 71.28 ± 1.6 | 60.27 ± 0.05 | |
| S2 (bands + indices) | 76.1 ± 7.8 | 49.31 ± 1.8 | 68.02 ± 1.23 | 62.25 ± 2.81 | |
| S1 + S2 (bands + indices) | 90.31 ± 1.2 | 80.23 ± 0.8 | 68.05 ± 4.37 | 67.72 ± 3.43 | |
| Simple Nomenclature | P (bands) | 95.87 ± 0.04 | 97.24 ± 0.04 | 88.34 ± 0.02 | 43.07 ± 0.01 |
| P + S2 (indices) | 97.56 ± 0.03 | 98.92 ± 0.02 | 91.07 ± 0.02 | 82.28 ± 0.0 | |
| P + S2 (indices) + S1 | 98.15 ± 0.02 | 98.75 ± 0.01 | 97.94 ± 0.01 | 84.36 ± 0.0 | |
| S1 | 94.57 ± 0.26 | 90.28 ± 0.25 | 78.61 ± 0.31 | 71.24 ± 0.24 | |
| S2 indices | 96.91 ± 0.29 | 94.02 ± 0.61 | 98.18 ± 0.14 | 80.03 ± 0.08 | |
| S1 + S2 indices | 94.07 ± 0.36 | 91.02 ± 0.24 | 95.77 ± 0.24 | 80.93 ± 0.22 | |
| S1 + S2 (bands + indices) | 97.02 ± 0.23 | 95.35 ± 0.02 | 98.53 ± 0.08 | 85.81 ± 0.07 | |
| S1 + S2 (bands) | 96.54 ± 0.3 | 98.24 ± 0.02 | 97.15 ± 0.22 | 81.77 ± 0.16 |
| Zone | Stack | Overall Accuracy (%) | Class | User’s Accuracy (%) | Producer’s Accuracy (%) |
|---|---|---|---|---|---|
| North | S1 + S2 | 82.22 ± 3.71 | Ceratophyllum sp. | 100 | 100 |
| Chara sp. | 26.91 ± 4.96 | 90.91 ± 16.99 | |||
| Myriophylum spicatum | 0 | 0 | |||
| Nuphar lutea | 100 | 100 | |||
| Spirogyra sp. | 100 | 61.11 ± 22.52 | |||
| Trapa natans | 100 | 16.67 ± 29.82 | |||
| Vallisneria sp. | 38.35 ± 45.08 | 66.67 ± 30.8 | |||
| Phragmites australis | 100 | 100 | |||
| Water | 100 | 97.18 ± 3.85 | |||
| P + S1 | 94.07 ± 0.36 | Nuphar lutea | 99.87 ± 0.26 | 99.49 ± 0.35 | |
| Submerged macrophytes | 85.32 ± 1.38 | 79.76 ± 1.44 | |||
| Water | 100 | 95.05 ± 0.87 | |||
| Phragmites australis | 93.19 ± 0.45 | 100 | |||
| S1 + S2 | 96.91 ± 0.29 | Nuphar lutea | 93.09 ± 2.46 | 86.22 ± 1.6 | |
| Submerged macrophytes | 82.24 ± 1.56 | 98.62 ± 0.47 | |||
| Water | 100 | 91.83 ± 0.88 | |||
| Phragmites australis | 99.44 ± 0.08 | 100 | |||
| South | S2 (bands + indices) | 98.18 ± 0.14 | Nuphar lutea | 82.52 ± 1.79 | 76.76 ± 1.96 |
| Trapa natans | 82.45 ± 2.06 | 83.71 ± 1.09 | |||
| Submerged macrophyte | 100 | 95.05 ± 0.87 | |||
| Algal bloom | 93.19 ± 0.45 | 100 | |||
| Water | 95.59 ± 2.34 | 96.14 ± 0.67 | |||
| Sediment | 98.87 ± 0.19 | 98.79 ± 0.17 | |||
| Phragmites australis. | 99.37 ± 0.07 | 99.33 ± 0.16 |
| Communities Macrophytes | Zone | Stack | User’s Accuracy (%) | Producer’s Accuracy (%) |
|---|---|---|---|---|
| Phragmites australis Detailed nomenclature | North | S1 + S2 (bands) | 100 | 100 |
| P + S1 | 92.55 ± 0.23 | 99.27 ± 0.07 | ||
| P + S2 | 91.55 ± 0.18 | 99.36 ± 0.07 | ||
| S1 + S2 (indices) | 100 | 100 | ||
| S1 | 100 | 100 | ||
| S2 (bands) | 100 | 100 | ||
| South | S2 (bands + indices) | 100 | 99.32 ± 0.95 | |
| Phragmites australis Simple nomenclature | North | S1 + S2 | 93.19 ± 0.45 | 100 |
| P + S2 (indices) | 97.44 ± 0.03 | 98.2 ± 0.02 | ||
| P+S1 | 99.52 ± 0.01 | 99.01 ± 0.01 | ||
| S2 (bands) | 100 | 100 | ||
| S2 (indices) | 99.91 ± 0.06 | 99.62 ± 0.11 | ||
| S1 | 98.05 ± 0.17 | 99.53 ± 0.11 | ||
| South | S1 + S2 | 99.50 ± 0.06 | 99.99 ± 0.02 | |
| P + S1 | 99.43 ± 0.01 | 97.81 ± 0.01 | ||
| S2 (indices) | 99.89 ± 0.02 | 99.72 ± 0.1 | ||
| S1 | 98.30 ± 0.09 | 96.39 ± 0.31 | ||
| Nuphar lutea Detailed nomenclature | North | S1 + S2 | 100 | 100 |
| S2 (bands) | 100 | 100 | ||
| P + S2 (indices) | 99.87 ± 0.26 | 99.49 ±0.35 | ||
| Nuphar lutea Simple nomenclature | North | S1 + S2 | 99.87 ± 0.26 | 99.49 ± 0.35 |
| South | S2 (bands + indices) | 94.14 ± 1.45 | 89.7 ± 1.43 | |
| S2 (bands) | 90.15 ± 1.54 | 96.83 ± 0.87 | ||
| S1 + S2 | 90.54 ± 1.6 | 97.24 ± 0.81 | ||
| Submerged macrophytes Detailed nomenclature | North | S1 + S2 | 100 | 100 |
| P + S2 (indices) | 99.87 ± 0.26 | 99.49 ± 0.35 | ||
| S2 (bands) | 100 | 100 | ||
| S2 (bands + indices) | 100 | 100 | ||
| Ceratophyllum sp. Detailed nomenclature | North | S1 + S2 | 100 | 100 |
| P + S1 | 99.87 ± 0.26 | 99.49 ± 0.35 | ||
| S2 (bands + indices) | 100 | 100 | ||
| S2 (bands) | 100 | 100 | ||
| Trapa natans Simple nomenclature | South | S1 + S2 (indices) | 92.11 ± 0.67 | 84.37 ± 1.07 |
| S2 (bands + indices) | 91.57 ± 2.27 | 91.93 ± 0.82 | ||
| S2 (indices) | 82.45 ± 2.06 | 83.71 ± 1.09 |
© 2020 by the authors. Licensee MDPI, Basel, Switzerland. This article is an open access article distributed under the terms and conditions of the Creative Commons Attribution (CC BY) license (http://creativecommons.org/licenses/by/4.0/).
Share and Cite
Niculescu, S.; Boissonnat, J.-B.; Lardeux, C.; Roberts, D.; Hanganu, J.; Billey, A.; Constantinescu, A.; Doroftei, M. Synergy of High-Resolution Radar and Optical Images Satellite for Identification and Mapping of Wetland Macrophytes on the Danube Delta. Remote Sens. 2020, 12, 2188. https://doi.org/10.3390/rs12142188
Niculescu S, Boissonnat J-B, Lardeux C, Roberts D, Hanganu J, Billey A, Constantinescu A, Doroftei M. Synergy of High-Resolution Radar and Optical Images Satellite for Identification and Mapping of Wetland Macrophytes on the Danube Delta. Remote Sensing. 2020; 12(14):2188. https://doi.org/10.3390/rs12142188
Chicago/Turabian StyleNiculescu, Simona, Jean-Baptiste Boissonnat, Cédric Lardeux, Dar Roberts, Jenica Hanganu, Antoine Billey, Adrian Constantinescu, and Mihai Doroftei. 2020. "Synergy of High-Resolution Radar and Optical Images Satellite for Identification and Mapping of Wetland Macrophytes on the Danube Delta" Remote Sensing 12, no. 14: 2188. https://doi.org/10.3390/rs12142188
APA StyleNiculescu, S., Boissonnat, J.-B., Lardeux, C., Roberts, D., Hanganu, J., Billey, A., Constantinescu, A., & Doroftei, M. (2020). Synergy of High-Resolution Radar and Optical Images Satellite for Identification and Mapping of Wetland Macrophytes on the Danube Delta. Remote Sensing, 12(14), 2188. https://doi.org/10.3390/rs12142188


