Article

Understanding the Land Surface Phenology and Gross Primary Production of Sugarcane Plantations by Eddy Flux Measurements, MODIS Images, and Data-Driven Models

1
Ministry of Education Key Laboratory of Biodiversity Science and Ecological Engineering, Institute of Biodiversity Science, Fudan University, Shanghai 200433, China
2
Department of Microbiology and Plant Biology, University of Oklahoma, Norman, OK 73019, USA
3
Embrapa Meio Ambiente, Jaguariúna CEP 13918-110, SP, Brazil
4
Agriculture Research Service, Sugarcane Research Unit, United States Department of Agriculture, Houma, LA 70360, USA
*
Author to whom correspondence should be addressed.
Remote Sens. 2020, 12(14), 2186; https://doi.org/10.3390/rs12142186
Submission received: 17 June 2020 / Revised: 3 July 2020 / Accepted: 6 July 2020 / Published: 8 July 2020

Abstract

:
Sugarcane (complex hybrids of Saccharum spp., C4 plant) croplands provide cane stalk feedstock for sugar and biofuel (ethanol) production. It is critical for us to analyze the phenology and gross primary production (GPP) of sugarcane croplands, which would help us to better understand and monitor the sugarcane growing condition and the carbon cycle. In this study, we combined the data from two sugarcane EC flux tower sites in Brazil and the USA, images from the Moderate Resolution Imaging Spectroradiometer (MODIS) sensor, and data-driven models to study the phenology and GPP of sugarcane croplands. The seasonal dynamics of climate, vegetation indices from MODIS images, and GPP from two sugarcane flux tower sites (GPPEC) reveal the temporal consistency in sugarcane phenology (crop calendar: green-up dates and harvesting dates) as estimated by the vegetation indices and GPPEC data. The Land Surface Water Index (LSWI) is shown to be useful to delineate the phenology of sugarcane croplands. The relationship between the sugarcane GPPEC and the Enhanced Vegetation Index (EVI) is stronger than the relationship between the GPPEC and the Normalized Difference Vegetation Index (NDVI). We ran the Vegetation Photosynthesis Model (VPM), which uses the light use efficiency (LUE) concept and is driven by climate data and MODIS images, to estimate the daily GPP at the two sugarcane sites (GPPVPM). The seasonal dynamics of the GPPVPM and GPPEC at the two sites agreed reasonably well with each other, which indicates that VPM is a powerful tool for estimating the GPP of sugarcane croplands in Brazil and the USA. This study clearly highlights the potential of combining eddy covariance technology, satellite-based remote sensing technology, and data-driven models for better understanding and monitoring the phenology and GPP of sugarcane croplands under different climate and management practices.

Graphical Abstract

1. Introduction

Sugarcane (complex hybrids of Saccharum spp.) is one of the major cash crops in the world [1]. It accounts for 70% of the world’s sugar production [2] and is also a major source of biomass feedstock for biofuel (ethanol) production [3,4]. Sugarcane is the largest crop produced in the world in terms of biomass. According to the agricultural statistics data from the United Nations Food and Agricultural Organization (FAO), 25.98 million ha of sugarcane produced 1.84 billion tons of sugarcane in 2017. Brazil and the United States of America (USA) were the top 1st and 9th producer countries of sugarcane in the world during the period 1994–2017 (Figure S1), accounting for approximately 50% and 2% of the harvested sugarcane area in 2017, respectively (Figure S2).
Gross primary production (GPP), ecosystem respiration (ER), and net ecosystem exchange (NEE) are the major carbon flux components in the terrestrial carbon cycle. The carbon fluxes of sugarcane plantations have large uncertainty across the spatial and temporal scales, driven by climate change [5], agricultural management practices [6,7,8,9,10], and land use change [11,12]. Therefore, there is a need to observe and predict the phenology and carbon fluxes of sugarcane plantations under diverse weather and crop management practices with in situ measurement, remote sensing, and biogeochemical models across various temporal and spatial scales.
The eddy covariance (EC) technique has been widely used to measure the NEE between the land and the atmosphere, which is then partitioned into GPP and ER based on day and night-time fluxes [13]. The measured NEEEC data and estimated EREC and GPPEC data have been used as standard or reference data for the assessment of vegetation phenology and biogeochemical models that estimate these CO2 fluxes across site, regional, and global scales [14,15]. To date, only a small number of EC tower sites have been operated to measure the CO2 fluxes of sugarcane plantations [16,17,18,19,20,21].
Remote sensing data are extensively used to track crop phenology or land surface phenology [22,23,24], estimate CO2 fluxes across space and time [25,26], and scale up carbon fluxes across spatial scales [27,28]. Many studies have developed and applied light use efficiency (LUE) models that use vegetation indices (VI) from optical images and climate data to estimate the daily GPP of vegetation [29,30,31,32,33]. A number of studies compared GPP data from the LUE models with GPPEC data estimated from EC flux tower sites [32,34,35]. These studies showed that the maximum light use efficiency parameter is essential for estimating the GPP in LUE models. The Vegetation Photosynthesis Model (VPM) calculates the daily GPP (GPPVPM) as the product of the light absorbed by chlorophyll in the canopy (APARchl) and the light use efficiency [36]. The VPM model has been run to estimate the daily GPP at many EC flux tower sites [37,38,39,40,41,42,43,44,45,46]. To our limited knowledge, very few studies reported information on the phenology and GPP of sugarcane fields [47], and the VPM model has not been evaluated for sugarcane plantations yet. Therefore, there is a need to evaluate the VPM model at individual sugarcane EC flux tower sites, which is a critical step before we use it to estimate sugarcane GPP over years across site, regional, and global scales.
This study has three objectives: (1) to assess the potential of vegetation indices (NDVI, EVI, LSWI) in understanding the land surface phenology and physiology of sugarcane crop at individual site, (2) to evaluate the VPM model’s effectiveness at estimating the GPP of sugarcane croplands at individual sites, and (3) to quantify the effect of climate and management practices on the GPP of sugarcane croplands at individual sites over several years.

2. Materials and Methods

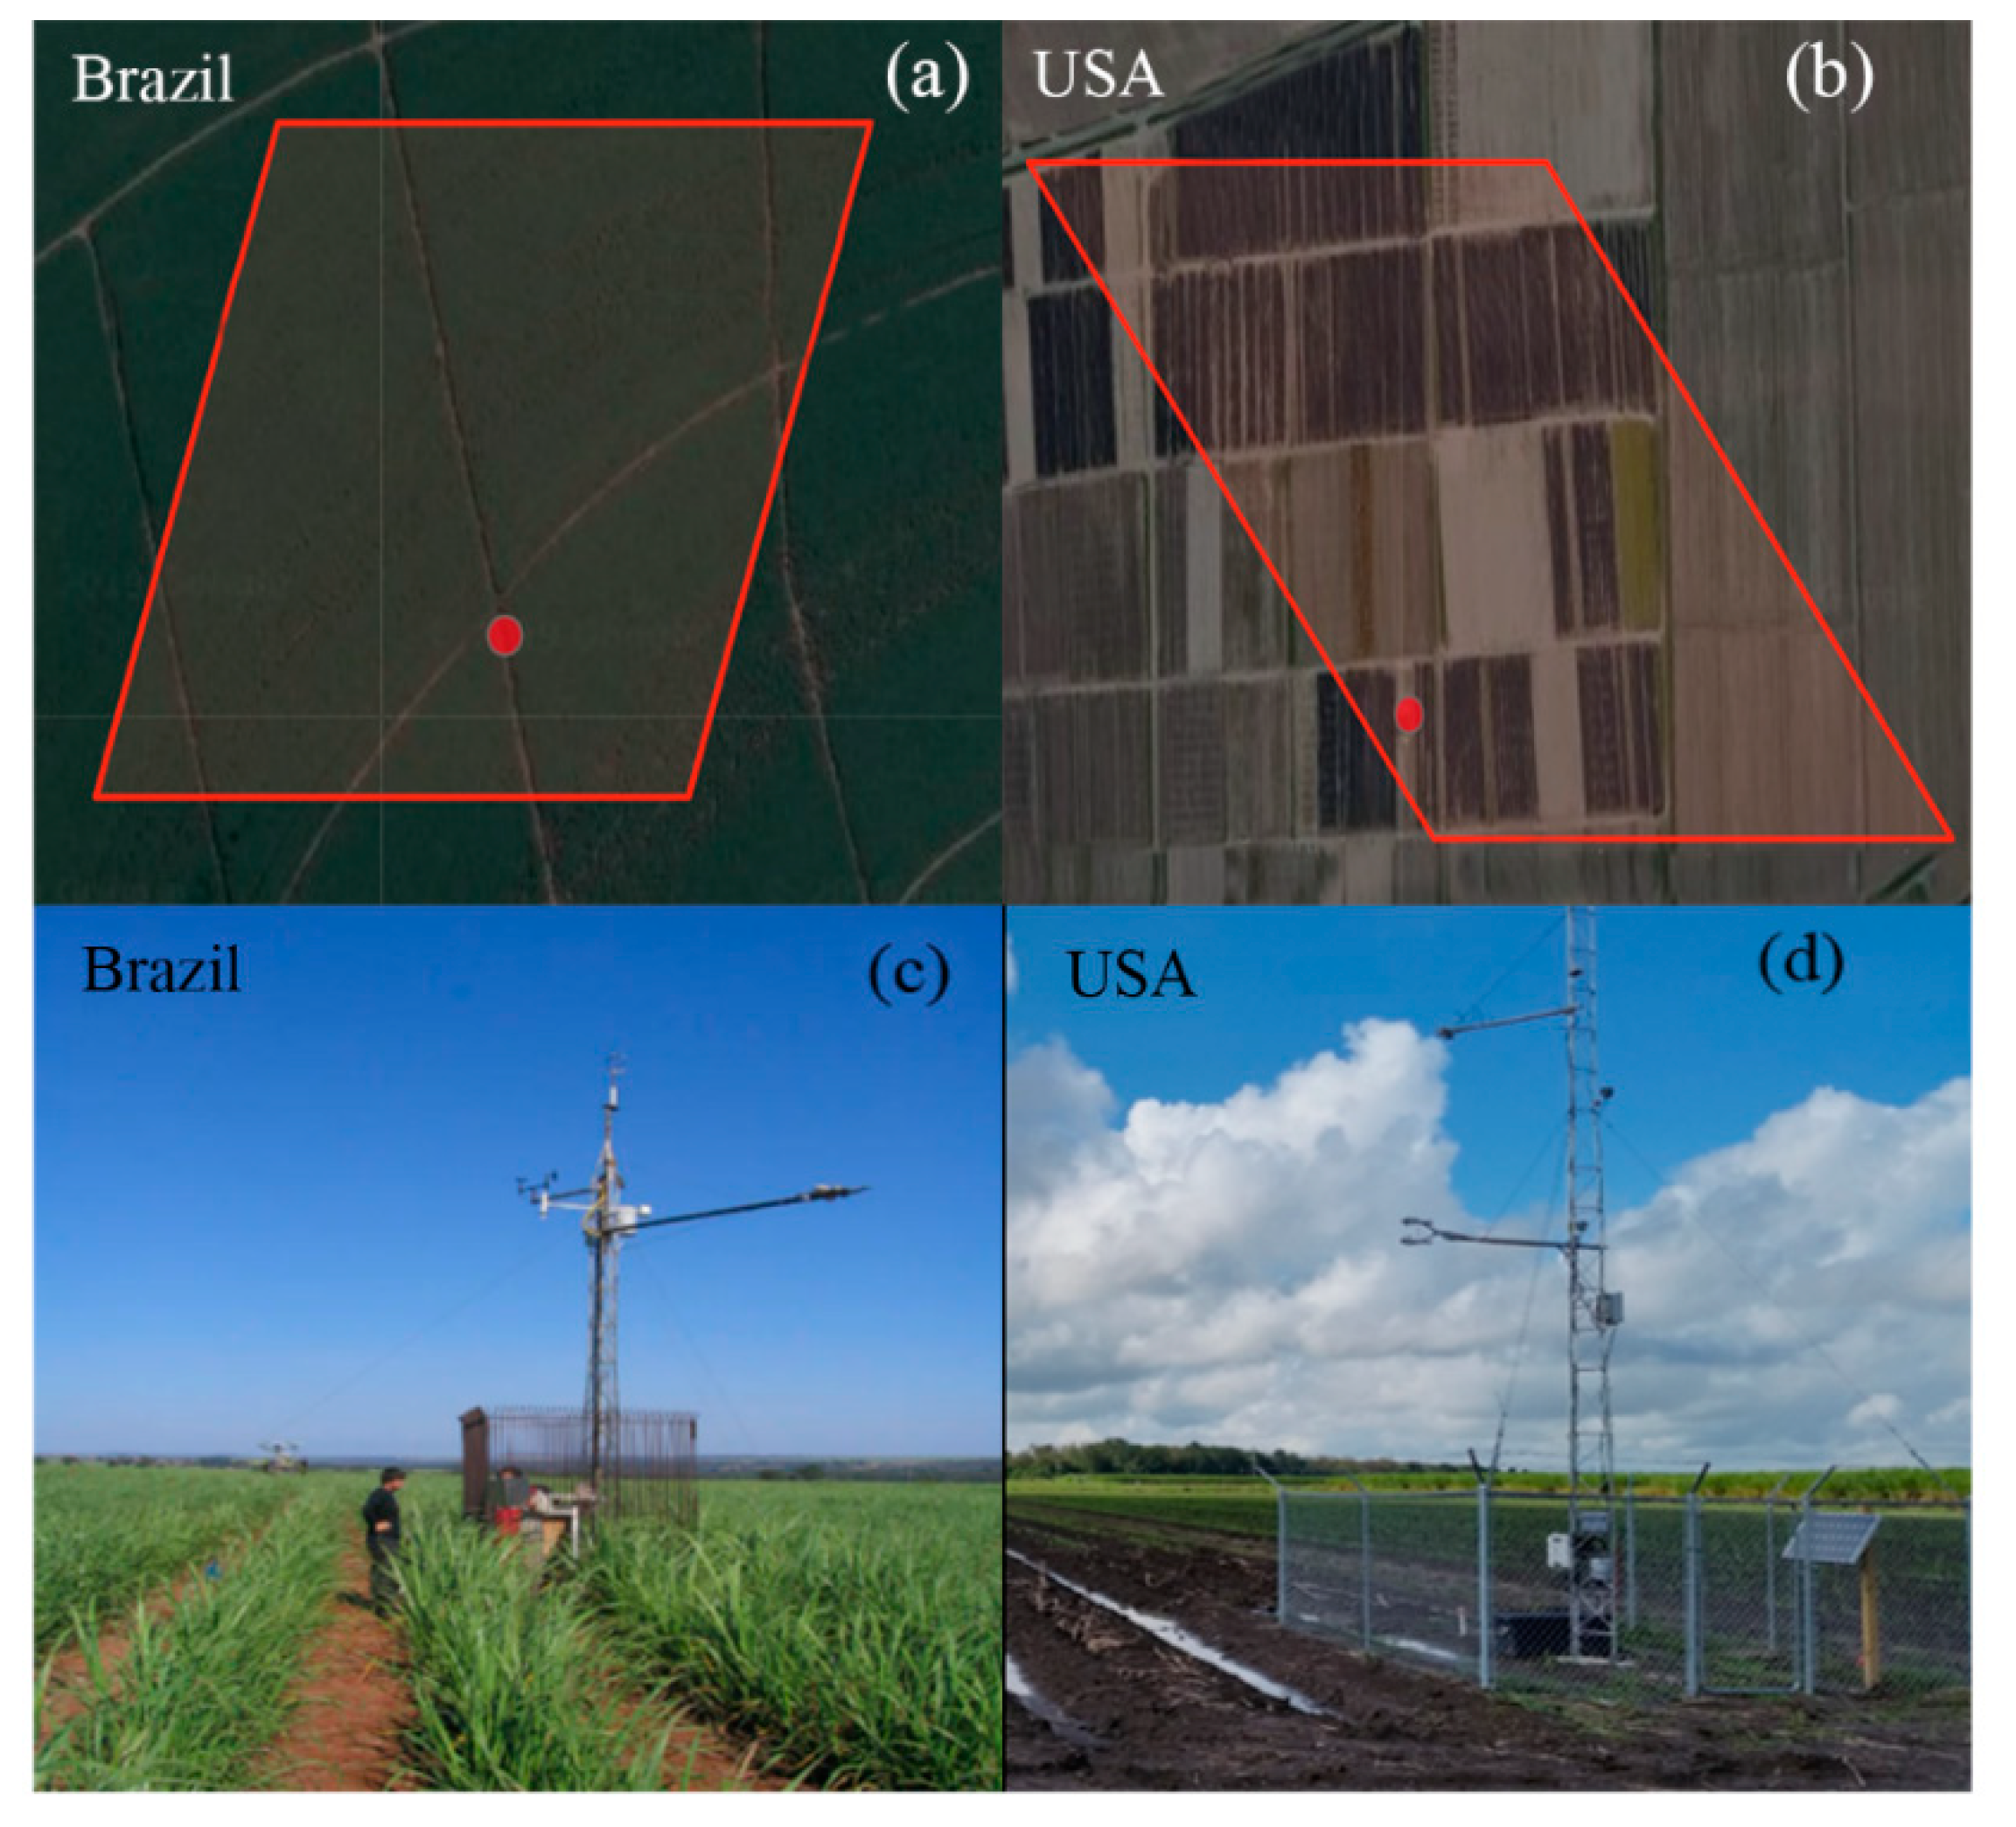
2.1. The Description of Study Sites

One sugarcane plantation in southern Brazil and one sugarcane plantation in Louisiana, USA, were used in this study (Figure 1) based on the availability, quality, and quantity of the EC flux data, and the detailed sugarcane planting history at these two sites during the period 2000–2018 is shown in Table S1.

2.1.1. The Sugarcane Plantation Site in Sao Paulo, Brazil (USR)

The sugarcane plantation EC flux tower site (21.6366°S, 47.7897°W) is located at Luiz Antonio municipality, São Paulo State, Brazil [18]. Sugarcane varieties (SP81-3250, SP83-2847, and RB86-7515) were planted in this site over years. The site is 552 m high above sea level and its soil type is sandy soil. The soil and sugarcane stalk yields were representative of southern Brazil [48,49]. The canopy height reached approximately 5 m when sugarcane was at the peak of its growing season. The distance between the sugarcane planting rows was 1.4 m. The sugarcane plantation field (>400 ha) has a gentle slope of <2%, and the close-by vegetation includes pasture, citrus fruit orchards, and savanna woodland [49]. Sugarcane is a multi-year ratoon crop, and on average sugarcane fields in the region have a cropping cycle comprising one plant crop and four ratoon (regrowth) crops [18,49]. At the USR site, the sugarcane plantation was planted in 2003 and replanted in 2007, one year less than the average because a low cane stalk yield was observed in the 2007 harvest (day of the year 149). The detailed agricultural practices can be found in the publication [18].

2.1.2. The Sugarcane Plantation Site in Louisiana, USA

The sugarcane plantation site (29.6341°N, 90.8349°W) is located at the Ardoyne Farm in Schriever, Louisiana, USA, and is managed by the USDA-ARS Sugarcane Research Unit. The HoCP 04-83’ variety (reg. no. CV-181, PI 687221) of sugarcane plantation was selected in this site. This site (100 ha) has a long-term (50 yr) history of continuous sugarcane production. The study site is bordered to the north, east, south, and west by 1200, 1320, 360, and 2000 m of continuous sugarcane production fields. The field is graded to 0.2% toward the south. Sugarcane plant rows are spaced at 1.83 m apart. The soil type is Cancienne silty clay loam (Fluvaquentic Epiaquepts). The sugarcane plants usually green up in April and are harvested by December (Figure S3) [50].

2.2. Climate and CO2 Flux Data from the Two Sugarcane EC Flux Tower Sites

2.2.1. The Sugarcane Plantation Site in Sao Paulo, Brazil (USR)

At the site, a closed-path instrument was used to measure the CO2 flux. The EC flux tower’s height is 9 m. A detailed description of the EC flux tower measurements was given in a previous publication [18]. The GPP was calculated as the difference between the observed NEE and the ecosystem respiration (ER) during daylight hours, which was estimated by a model that uses the exponential relationships between air temperature and nighttime CO2 fluxes (ER) [51]. We aggregated the half-hourly photosynthetically active radiation (PAR) and CO2 flux data into the daily sum data. We further averaged the daily climate and carbon flux data to 8-day period data. In this study, the climate and CO2 flux data of the whole sugarcane growing season in 2005–2007 at this site was used. The daily daytime mean air temperature was defined as the average temperature over the period that has PAR values larger than 10 µmol m−2 s−1.

2.2.2. The Sugarcane Plantation Site in Louisiana, USA

At this site, an integrated open-path infrared gas analyzer was instrumented with the tower [16]. The calculation of the GPP, nighttime ER, and daytime ER with the fitted exponential equations followed the same procedure as the previous study [51]. We used a similar method to aggregate the daily and 8-day period data from the half-hour data, as was done for the Brazil site. In this study, we used the data of the entire sugarcane growing season in 2017 at this site.

2.3. MODIS Land Surface Reflectance Data and Calculation of Vegetation Indices during 2000–2018

The MODIS instruments onboard both the Terra and Aqua satellites acquire images with different spatial resolutions and 36 spectral brands. Seven spectral bands were primarily used for vegetation and land surface measurements, including blue (459–479 nm), green (545–565 nm), red (620–670 nm), near infrared (841–875 nm, 1230–1250 nm), and shortwave infrared (1628–1652 nm, 2105–2155 nm).
The MOD09A1 Collection 6 product provides 8-day estimates of surface reflectance of seven spectral bands at 500 m spatial resolution. A detailed description of MOD09A1 is given at https://lpdaac.usgs.gov/products/mod09a1v006/. The MOD09A1 data are available in the Google Earth Engine (GEE), a powerful satellite image editing platform [52,53]. After the data quality control of the MOD09A1 files, we used land surface reflectance data to calculate the Normalized Difference Vegetation Index (NDVI), Enhanced Vegetation Index (EVI), and Land Surface Water Index (LSWI) (Equations (1)–(3)). The algorithm documented in the previous publication [54] was used to gap fill the bad quality NDVI and EVI observations. We used times series MODIS data for these two sugarcane sites during 2000–2018, based on the geographical sites (latitude and longitude) of the sugarcane sites. The seasonal and interannual variation of three vegetation indexes during 2000–2018 for these two sugarcane sites is shown in Figure S4.
N D V I = N I R R e d N I R + R e d ,
  E V I = 2.5 × N I R R e d N I R + 6 × R e d 7.5 × B l u e + 1 ,
  L S W I = N I R S W I R N I R + S W I R .

2.4. NCEP Climate Data

The National Centers for Environmental Prediction (NCEP) - Department of Energy (DOE) NCEP/DOE Reanalysis-2 climate dataset was used in our global simulation of VPM model published in Scientific Data paper [55]. The daily climate variables (air temperature, precipitation, and downward shortwave radiation) were downscaled to 500 m using a nonlinear spatial interpolation method [56]. In this study, we used the same climate data for the global VPM simulations and used the daily minimum, mean, and maximum air temperature (°C), precipitation (mm), and downward shortwave radiation (W m−2) for the pixels covering the two sugarcane sites. The 8-day climate data were obtained by calculating the averages of the minimum, mean, and maximum air temperature, precipitation, and downward shortwave radiation over an 8-day period, which is the same temporal resolution as the MODIS data product. A previous study [57] showed a comparison between the NCEP radiation data with in situ radiation measurements at 37 AmeriFlux sites and reported a bias correction factor of 0.8. In this study, we applied this factor to adjust the radiation data. Many studies have indicated that PAR is just a proportion of the SR, and the conversion from SR to PAR ranges from 0.45 to 0.50 [58,59,60]. In this study, we use the mean PAR/SR ratio (0.48) as the conversion ratio [61]. The seasonal dynamics and interannual variation in air temperature (°C), precipitation (mm day−1), and PAR (mol m−2 day−1) during 2000–2018was shown in Figure S5.

2.5. VPM Model and Simulation

2.5.1. VPM Model

The VPM model estimates the daily GPP by multiplying the amount of PAR absorbed by chlorophyll in the crop canopy (APARchl) and the light use efficiency [37,38]. The model equations are the following:
G P P = ε g × A P A R c h l ,
  A P A R c h l = F P A R c h l × P A R .
The fraction of PAR absorbed by chlorophyll in the canopy (FPARchl) is estimated as a linear function of EVI [55]:
F P A R c h l = 1.25 × ( E V I 0.1 ) .
The effects of air temperature and water on the maximum light use efficiency (ε0) are calculated as:
ε g   = ε 0 × T s c a l a r × W s c a l a r .
The parameters εg and ε0 refer to the light use efficiency and maximum light use efficiency (μmol CO2 μmol−1 photosynthetic photon flux density (PPFD) or g C mol−1 PPFD), respectively. The Wscalar and Tscalar scalars represent the effects of air temperature and water on the light use efficiency of vegetation, respectively. The maximum light use efficiency (LUE) parameter values are obtained from a literature survey and/or analysis of NEE, GPP, and PAR data from CO2 EC flux tower sites [62]. In this study, we used 0.075 mol of CO2 mol−1 PPFD (0.9 g C mol−1 PPFD) as the parameter ε0 for sugarcane (C4 plant), based on the findings of an early study of the CO2 uptake and quantum yield of photosynthesis in different sugarcane clones at leaf scale [63]. In that study, the authors investigated how leaf nitrogen content affects the quantum yield at the leaf scale for a variety of sugarcane plants, and they found that quantum yield is a linear function of leaf nitrogen content and reached 0.075 mol of CO2 mol−1 PPFD when the leaf nitrogen content is the largest value in the experiment. In this study, we assume that this quantum yield value at the leaf scale is the maximum LUE parameter at the ecosystem scale.
We calculated the effect of the air temperature on photosynthesis (Tscalar) using Equation (6):
T s c a l a r = ( T T m i n ) ( T T m a x ) [ ( T T m i n ) ( T T m a x ) ] ( T T o p t ) 2 .
In Equation (8), Tmin, Topt, and Tmax are the minimum, optimal, and maximum air temperature of photosynthesis, respectively. The Tmin and Tmax parameters for these two sugarcane sites were set to be −1 °C and 48 °C, using the same parameter values of the cropland biome in the publication [55]. The site-specific optimum air temperature (Topt) parameter was estimated by the relationship between the GPPEC or vegetation index (NDVI, EVI) and the daily mean air temperature and daytime mean air temperature. This procedure was already used to estimate the optimum air temperature parameter in studying the carbon fluxes of paddy rice fields [64] and grasslands [65]. According to the results in Section 3.2, the Topt parameter value is approximately ~25 °C (both GPP-based and VI-based) at the Brazil sites and ~28 °C (GPP-based) or ~25 °C (VI-based) at the USA site.
We calculated the effect of water on photosynthesis (Wscalar) and this was estimated by the LSWI, and the maximum LSWI during the plant growing season is assumed to be the LSWImax:
W s c a l a r = 1 + L S W I 1 + L S W I m a x .

2.5.2. VPM Simulations with the Climate Data from the EC Flux Tower Sites

We used the climate data from the EC flux tower sites to run the VPM simulations (GPPVPM-Site). The half-hourly air temperature and PAR data were aggregated to daily and 8-day datasets for the model simulation. The resultant GPPVPM-Site data were compared with the GPPEC data.

2.5.3. VPM Simulations with Climate Data from the NCEP Dataset during 2000–2018

We used the NCEP reanalysis 2 dataset to run VPM simulations (GPPVPM-NCEP) [55]; see Section 2.4 for more details. We calculated and analyzed the resultant GPP data (GPPVPM-NCEP) and quantified the effect of weather on the GPP of sugarcane croplands during 2000–2018 at these two sugarcane sites.

2.6. MODIS GPP and NPP Data Product (MOD17)

The MOD17A2 Gross and Net Primary Productivity (GPP/NPP) product provides daily GPP estimates, and the product uses the light-use efficiency model (PSN) [56]. A description of the MOD17A2 product is given in the website https://lpdaac.usgs.gov/products/mod17a2hv006/. We used the time series GPP data (GPPMOD17A2) for these two sugarcane sites during 2000–2018. In this study, we compared the GPPMOD17A2 with the GPPEC, GPPVPM-Site, and GPPVPM-NCEP. The seasonal dynamics and interannual variation of the GPPMOD17A2 during 2000-2018 for two sugarcane sites is shown in Figure S6.

3. Results

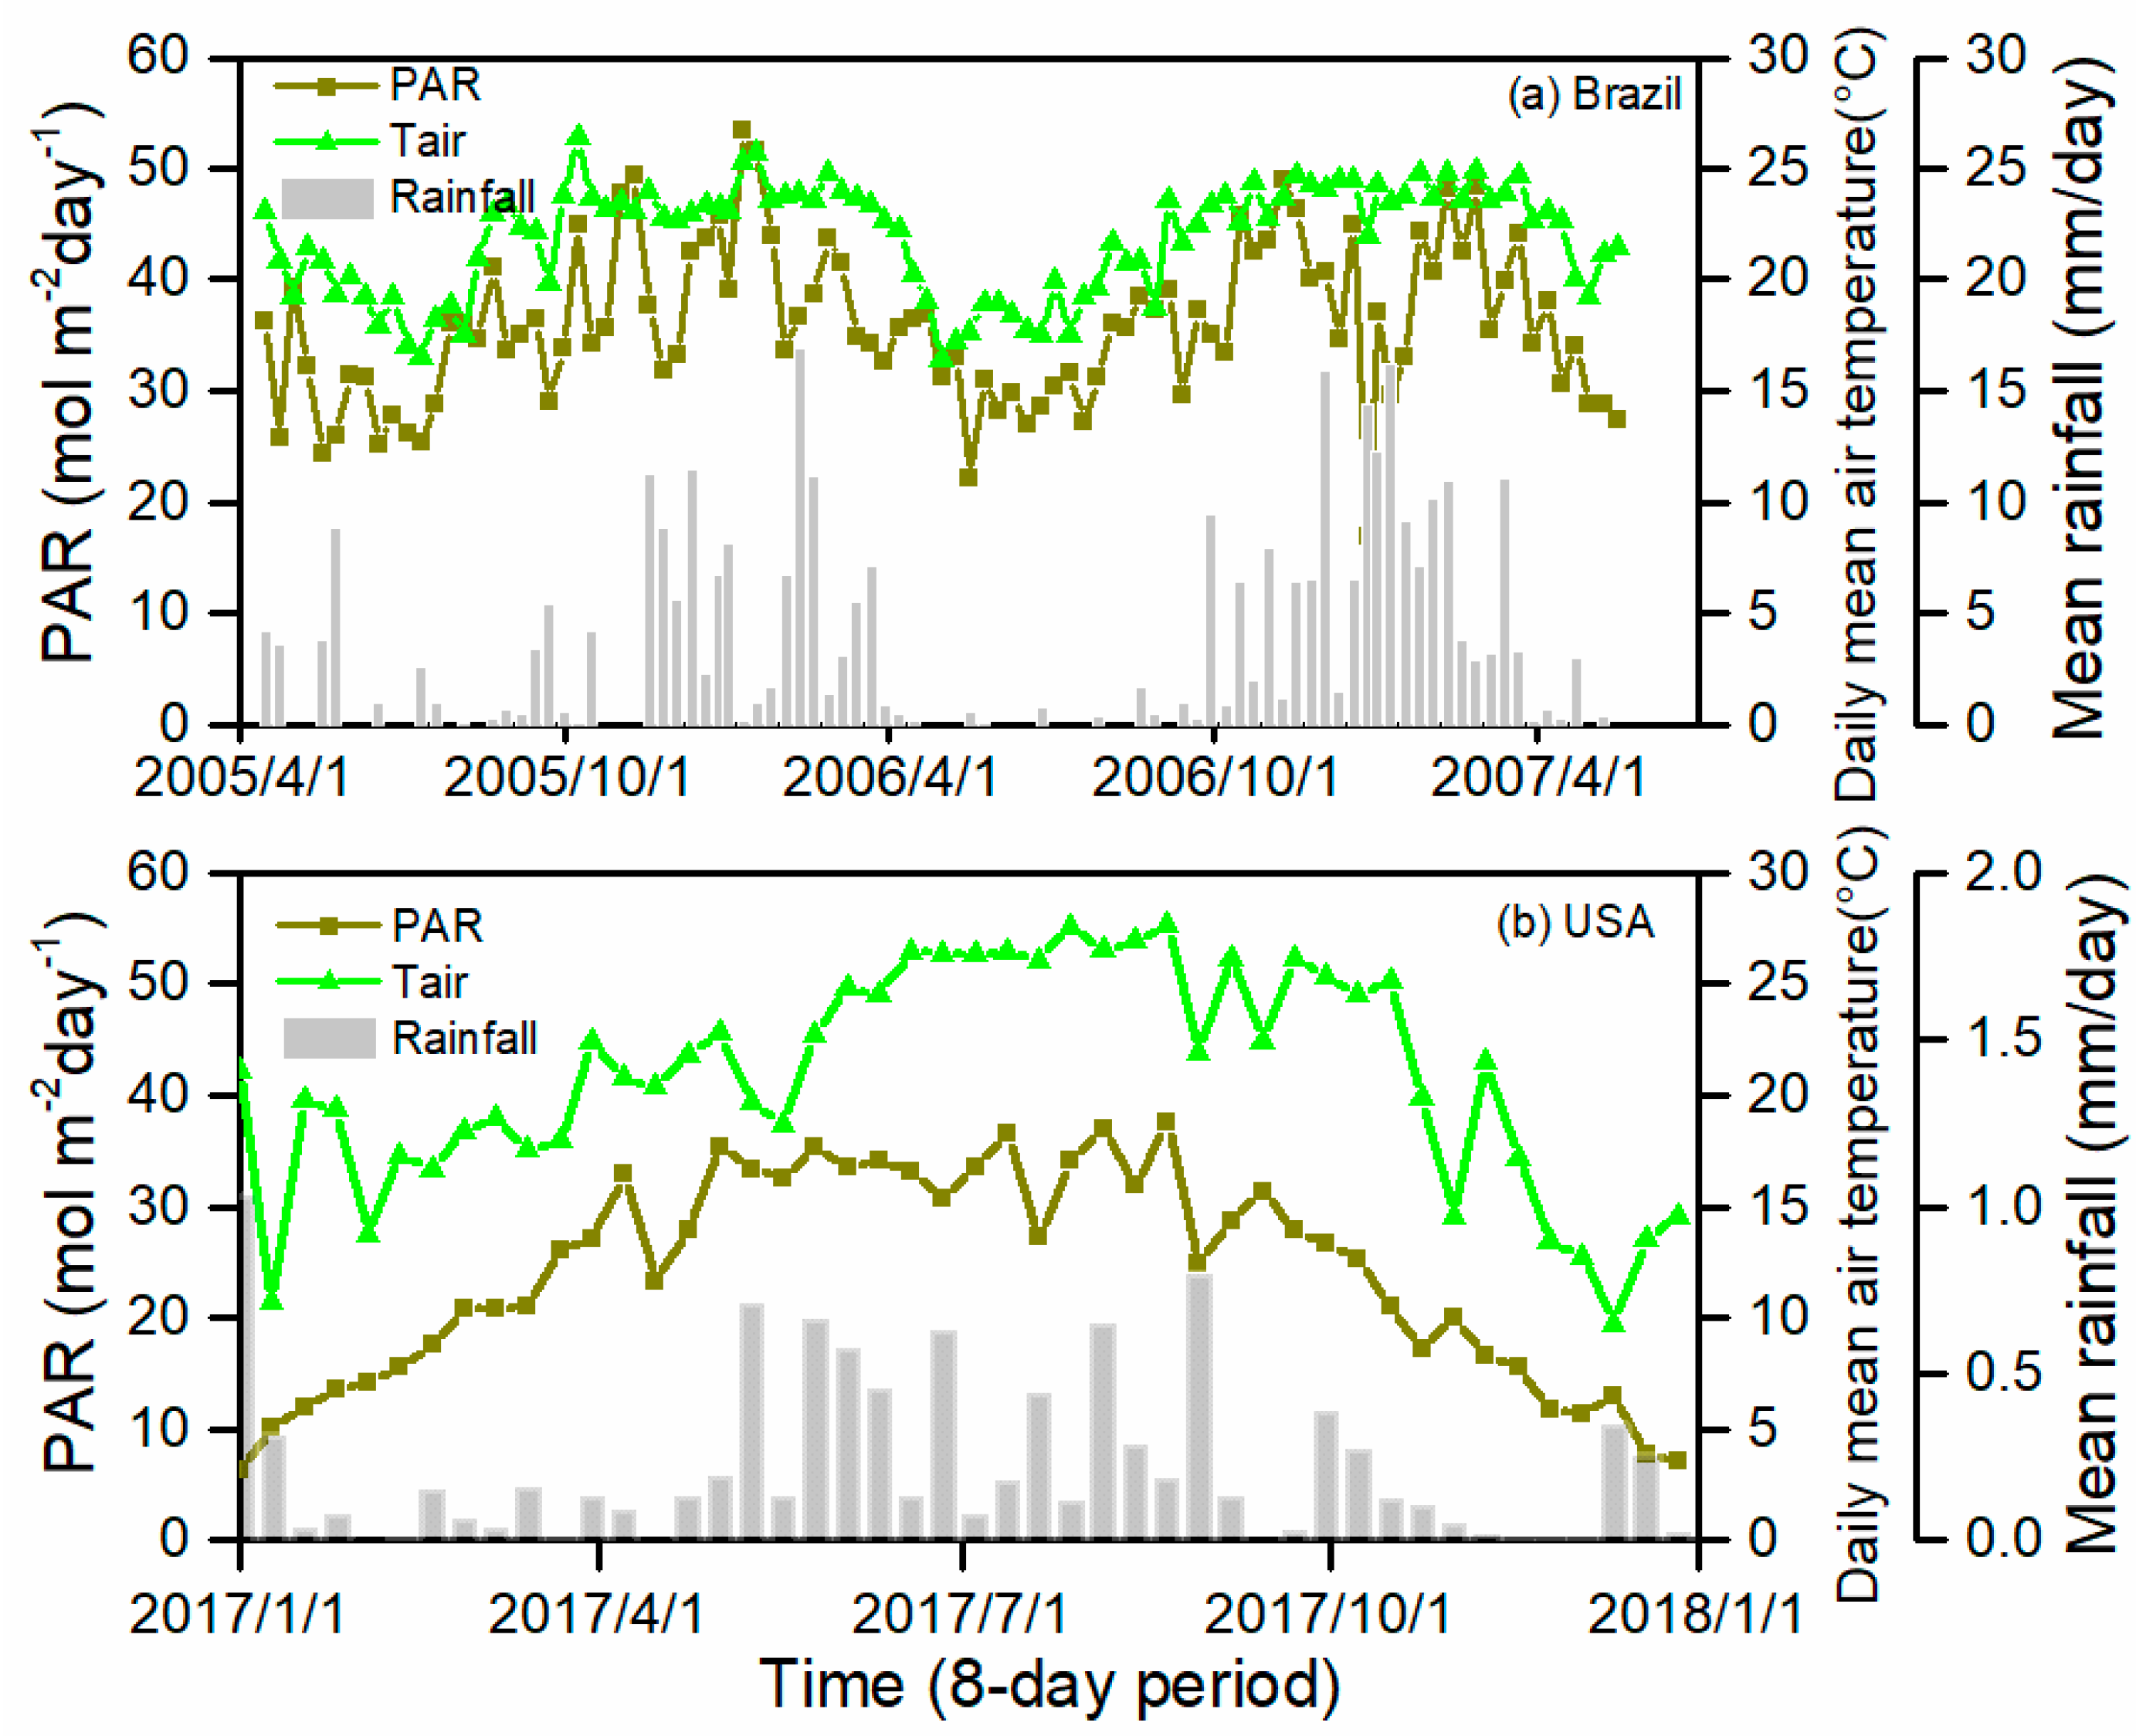
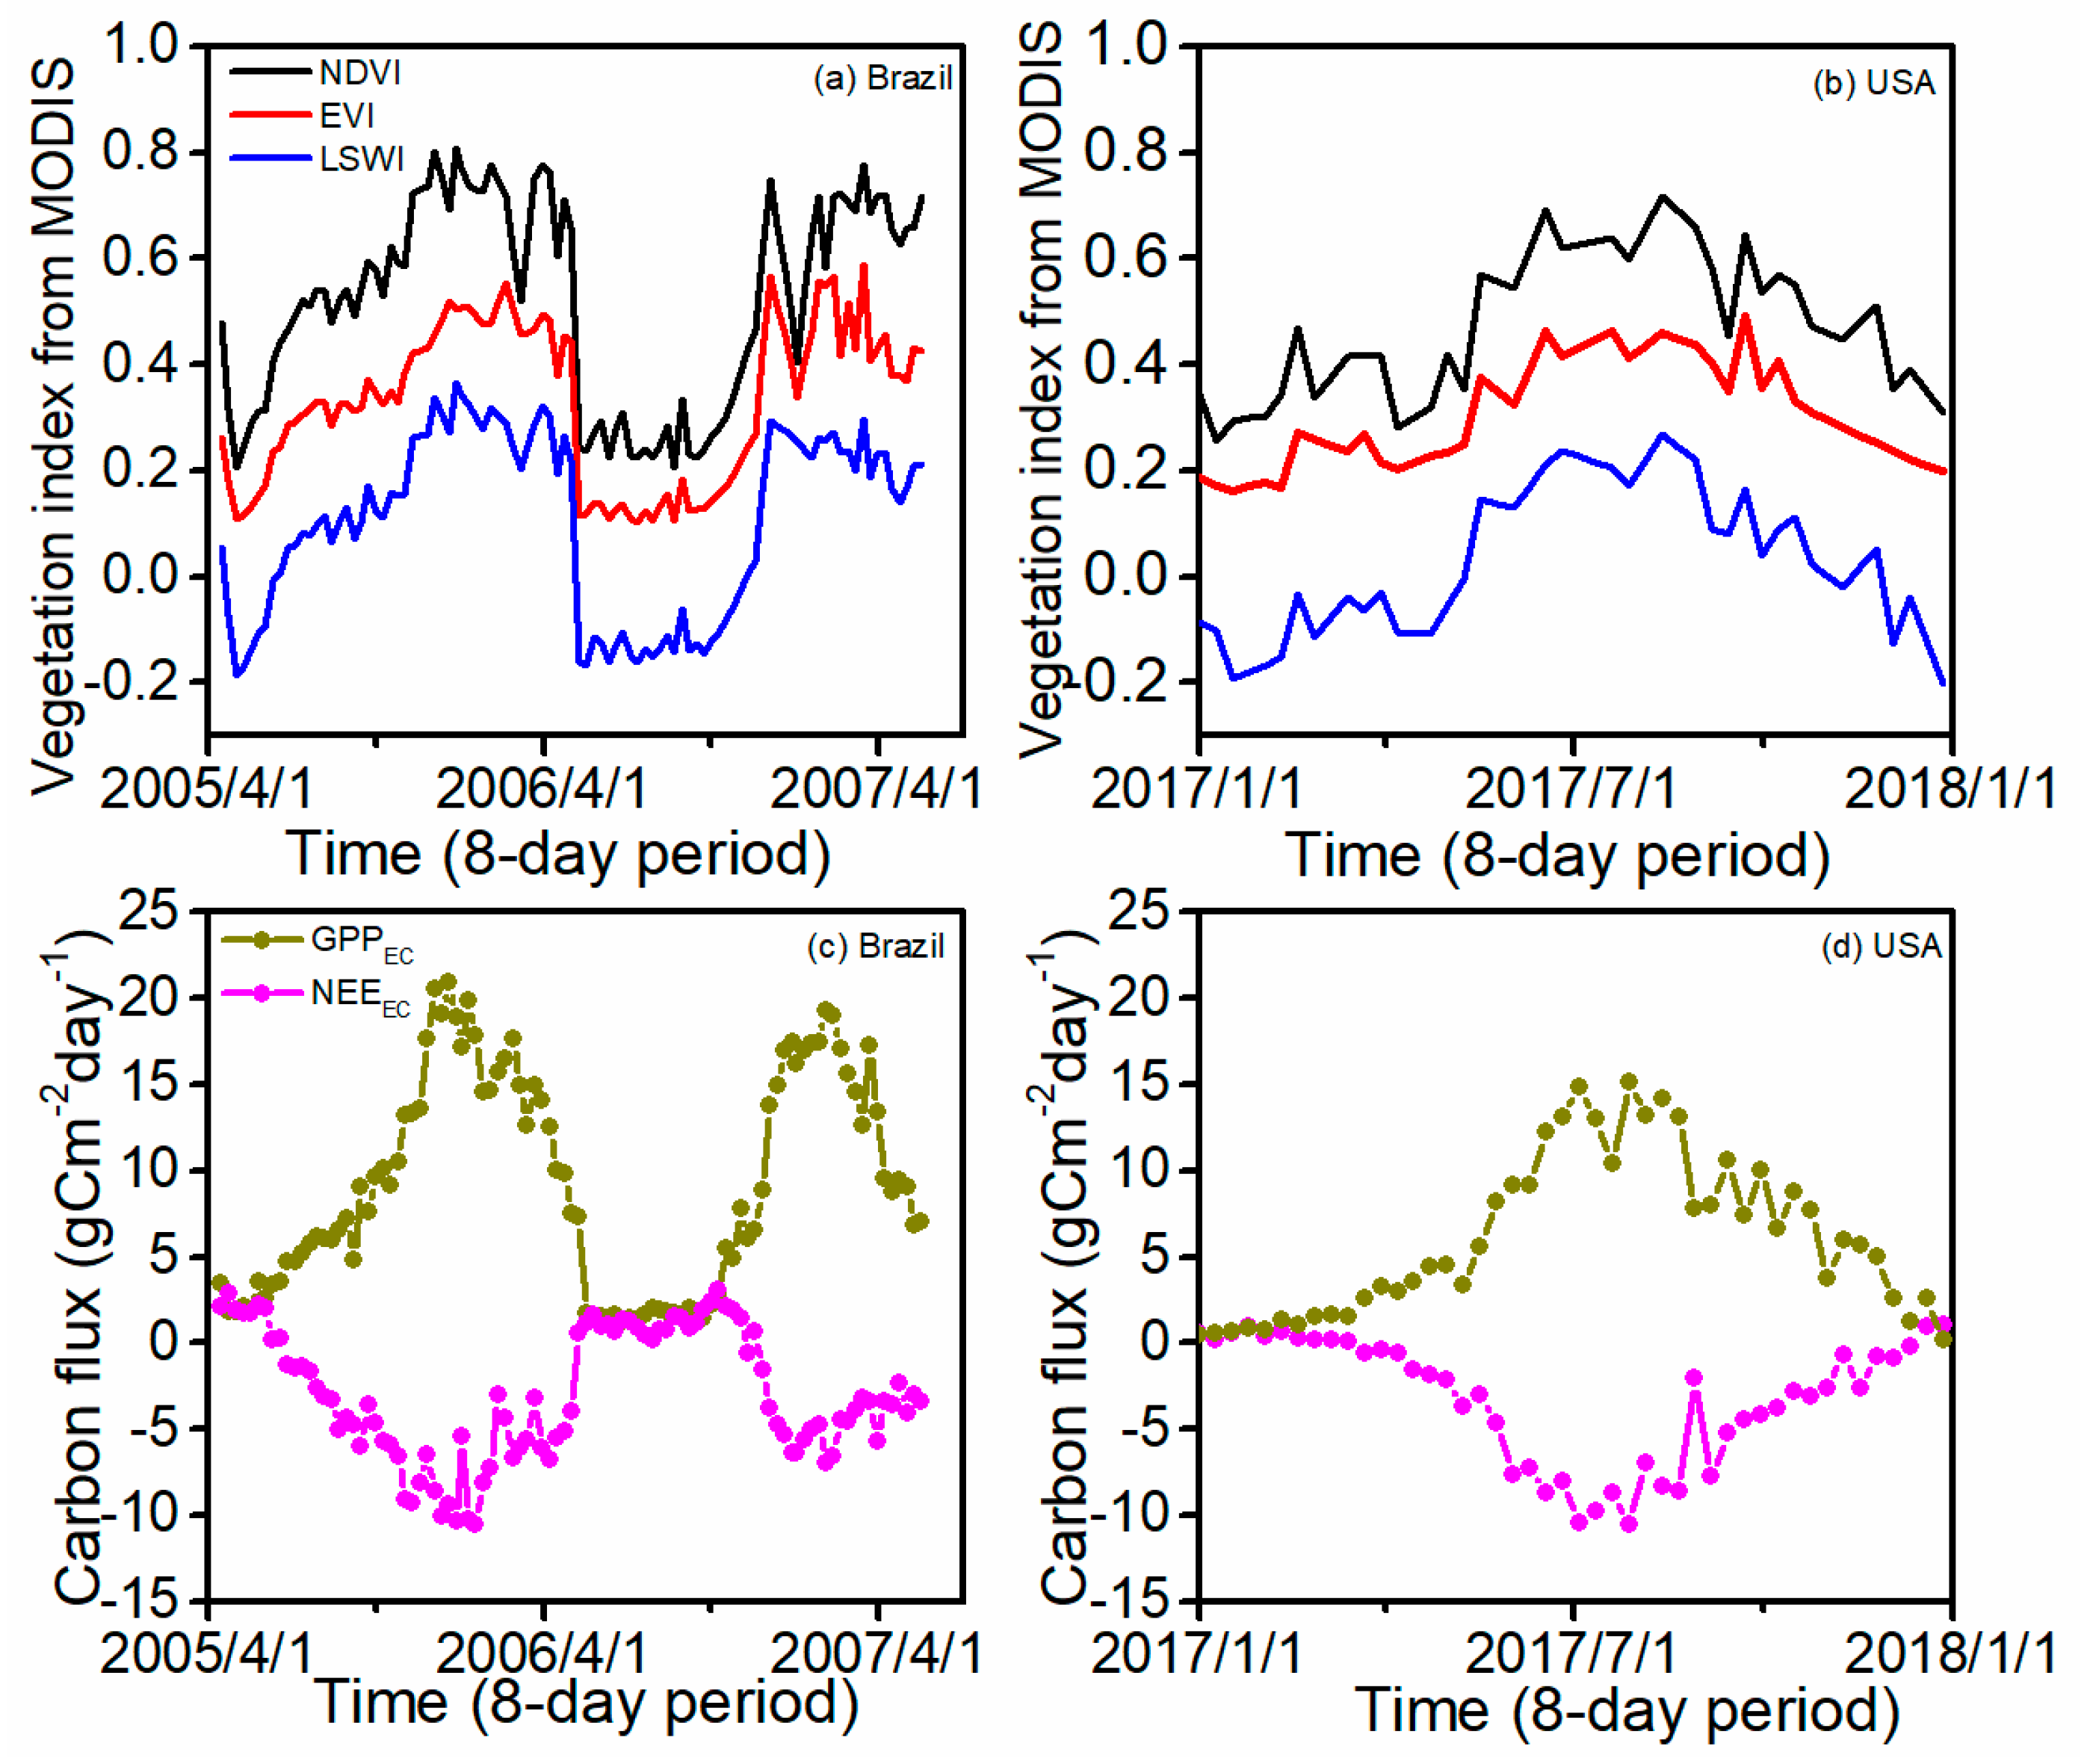
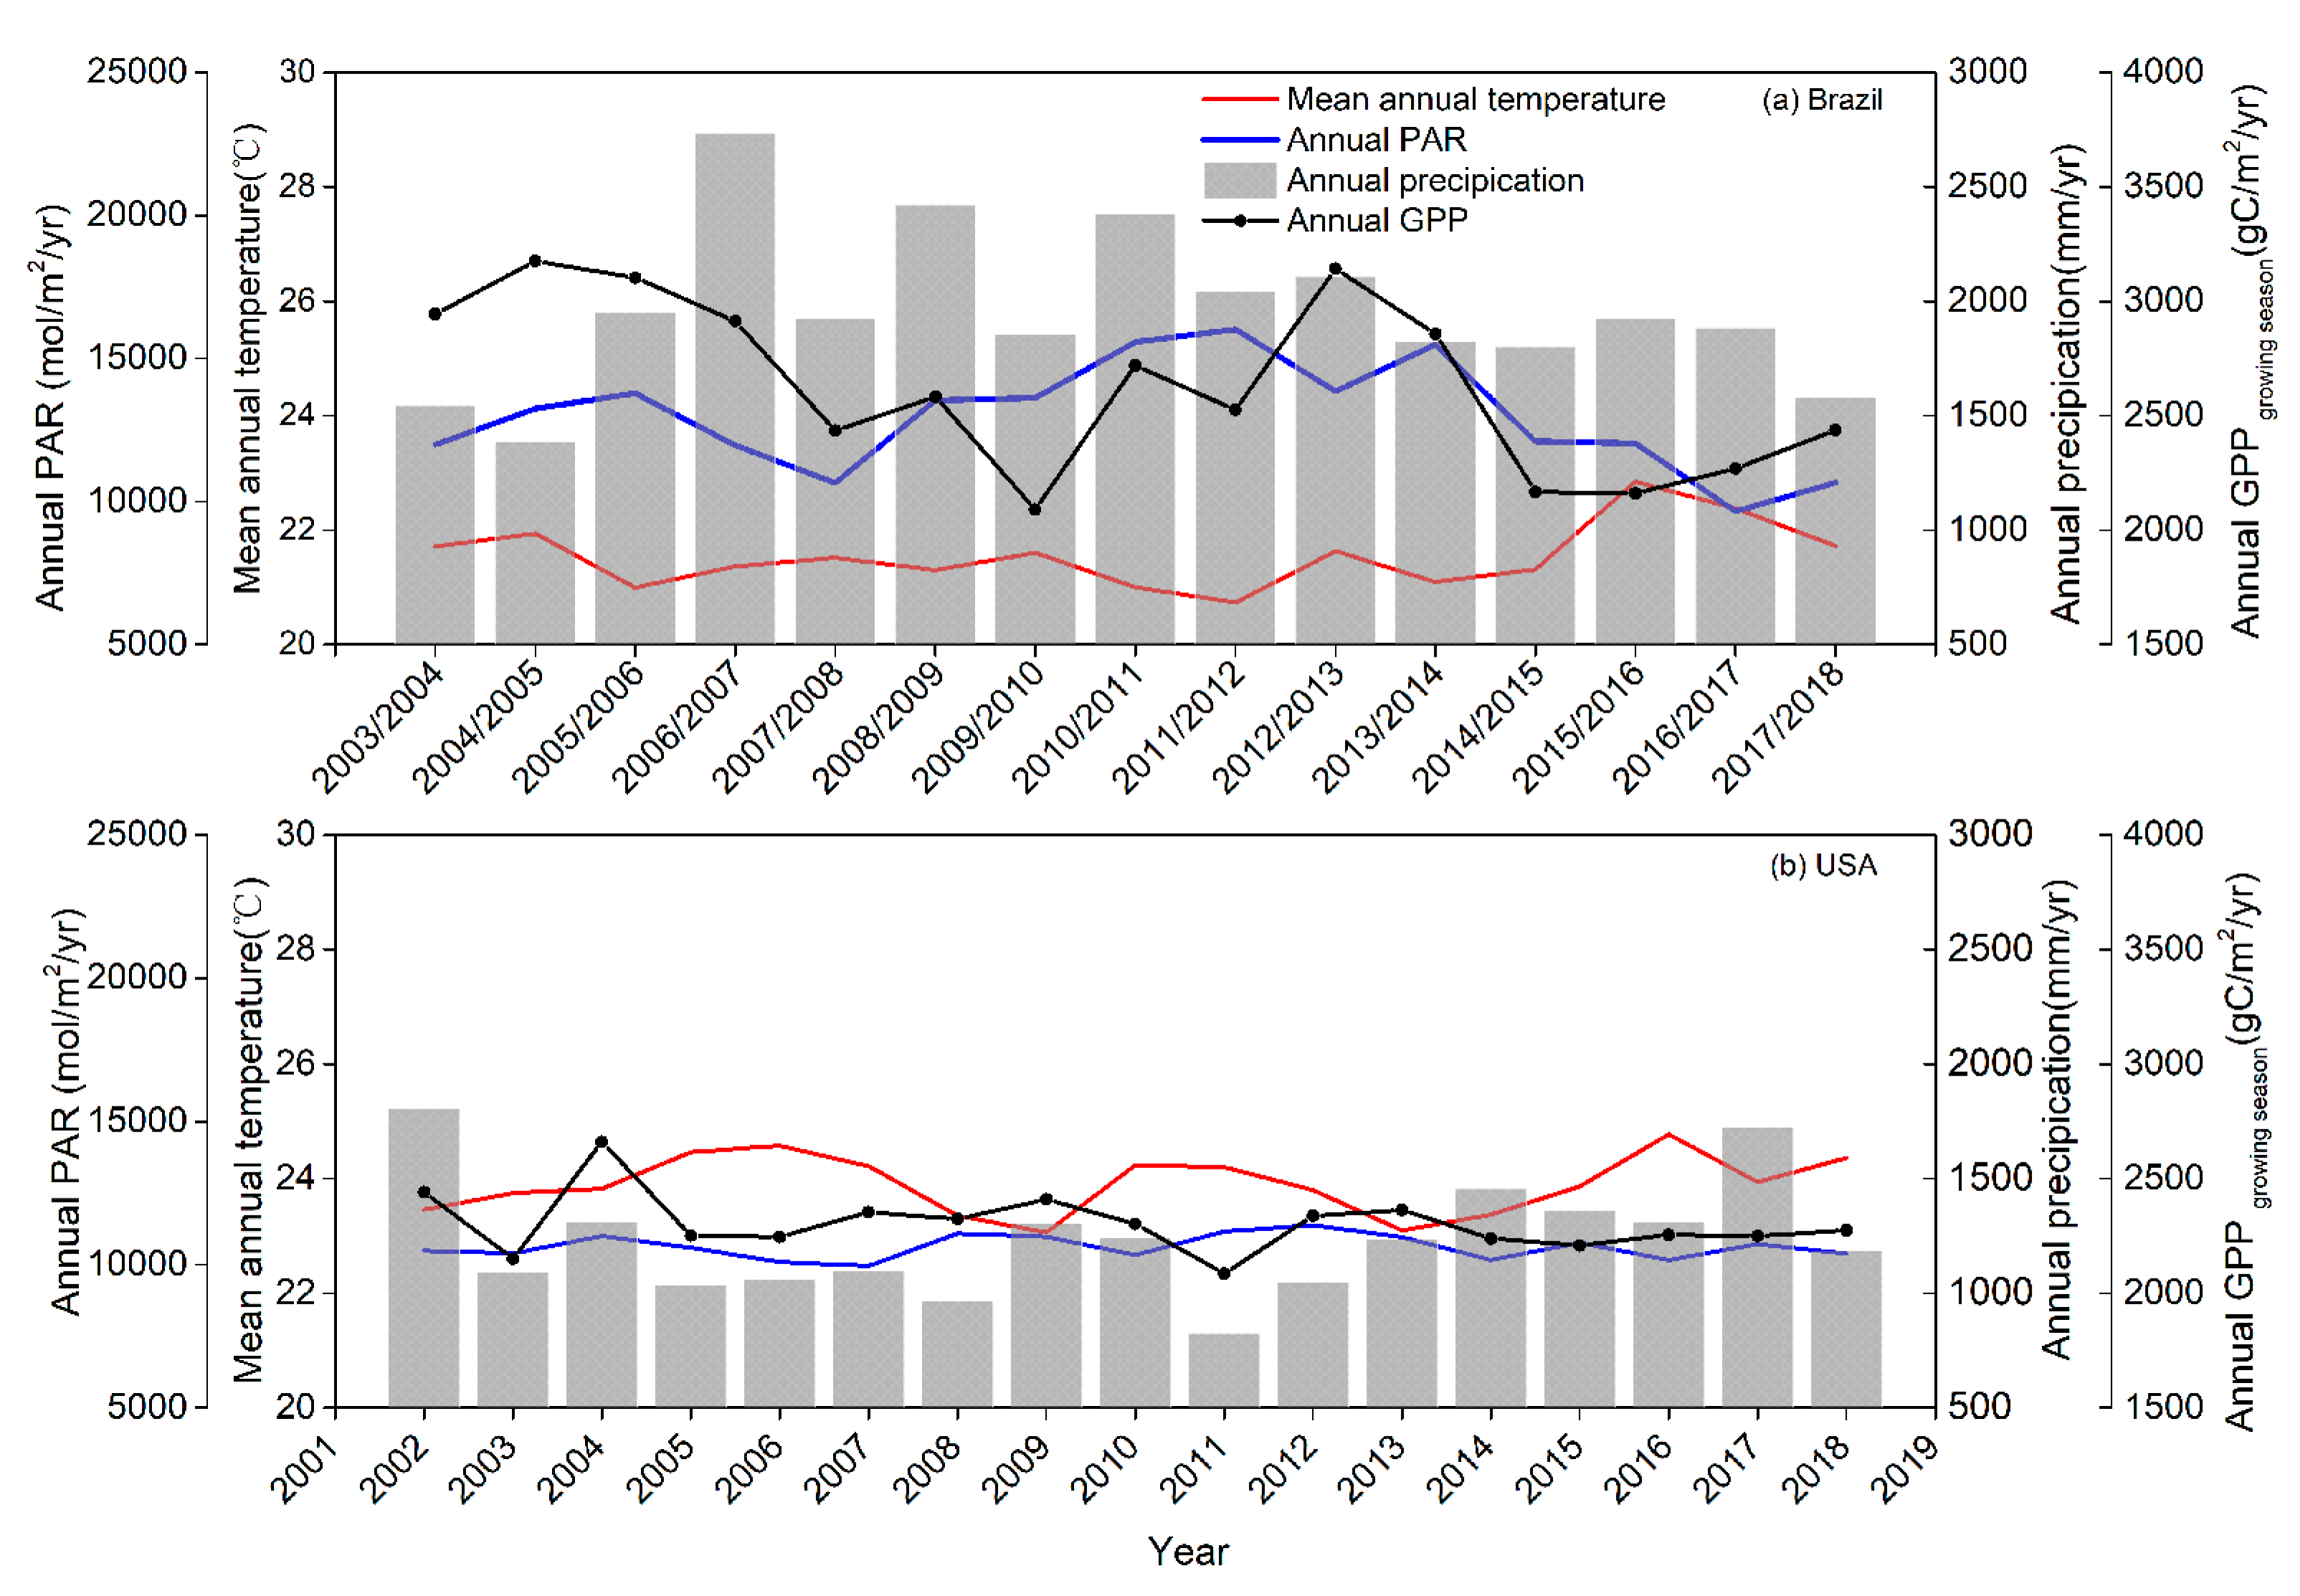
3.1. The Seasonal Dyanmics of Climate, Vegetation Indices, and GPP at the Two Sugarcane Tower Sites

Figure 2 shows that the seasonal dynamics of the daily mean air temperature, PAR, and rainfall at the two sugarcane sites over several years. The Brazil site has wet and dry seasons, and the daily mean air temperature is above 15°C over the year (Figure 2a). The USA site has a temperate climate and a moderately cold winter (Figure 2b). The seasonal dynamics of the PAR, air temperature, and rainfall were similar, with the peaks in mid-summer at the site (Figure 2b).
The land surface phenology (LSP) includes the start of the growing season (SOS), the end of growing season (EOS), and the growing season length (GSL). The seasonal dynamics of the vegetation indices (NDVI, EVI, and LSWI) at the two sites reveals the LSP metrics in terms of the canopy structure and the process of crop development during the growth season (Figure 3a,b). At the Brazil site, the vegetation indices started to green up and rise rapidly in May 2005, reaching their maximum value in December 2005, then suddenly dropped to <0.4 (NDVI), <0.1 (EVI), and <0 (LSWI) by May 2006 (Figure 3a). The sugarcane plants were harvested while the sugarcane plant leaves were still green. Using the criteria of EVI > 0.1 and LSWI > 0, the VI-based start of the growing season (SOS) was in mid-May 2005. Using the criteria of EVI < 0.1 and LSWI < 0, the end of the growing season (EOS) was in May 2006. The growing season length (GSL) was approximately 12 months. New sugarcane plants were planted in 2006, and the NDVI, EVI, and LSWI increased again in October 2006 and reached their peak by February in 2007 (Figure 3a). At the USA site, the vegetation indices started to rise rapidly in late April, reached their maximum value by August, and gradually dropped to <0.4, <0.1, and <0 by December 2017, respectively (Figure 3b). Using the same criteria (EVI > 0.1, LSWI > 0; EVI < 0.1, LSWI < 0), the VI-based SOS and EOS of sugarcane at the USA site were April and December, respectively, and the GSL was about 8 months. The differences in the VI-based SOSVI, EOSVI, and GSLVI between these two sites are largely determined by the air temperature and management practice (e.g., harvest time) (Figure 2).
The seasonal dynamics of NEEEC and GPPEC at the two sites reveal the phenology of sugarcane croplands from the perspective of ecosystem function (Figure 3c,d). At the Brazil site, the GPPEC rose steadily in May 2005, when the GPPEC was larger than 1 g C m−2 day−1; it had a maximum level in December 2005 and decreased to zero by May 2006 (Figure 3c). Using the criterion of GPP >= 1 g C/m2/day, the GPP-based SOS of the sugarcane was in mid-May in 2005 and the EOS was in May 2006, which corresponds well with the growing season delineated by the vegetation indices. The GPPEC started to increase again after the onset of the rainy season in October 2006 [18] and reached the maximum in February of 2007 (Figure 3c). At the USA site, the GPPEC rose rapidly in April (GPPEC larger than 1 g C m−2 day−1), had a maximum value in August, and decreased to zero by December (Figure 3d). Using the criterion of GPP ≥ 1 g C/m2/day, the GPP-based sugarcane growing season at the USA site ranged from April (SOS) to December (EOS) (Figure 3d), which corresponds well with the growing season by the vegetation indices (Figure 3b). The growing season length (GSL) of the sugarcane, defined as the number of days with a GPPEC larger than 1 g C m−2 day−1, lasted approximately 12 months at the Brazil site and 8months at the USA site. The differences in the GPP-based SOSGPP, EOSGPP, and GSLGPP between these two sites are largely determined by the air temperature and management practice (e.g., harvest time) (Figure 2)

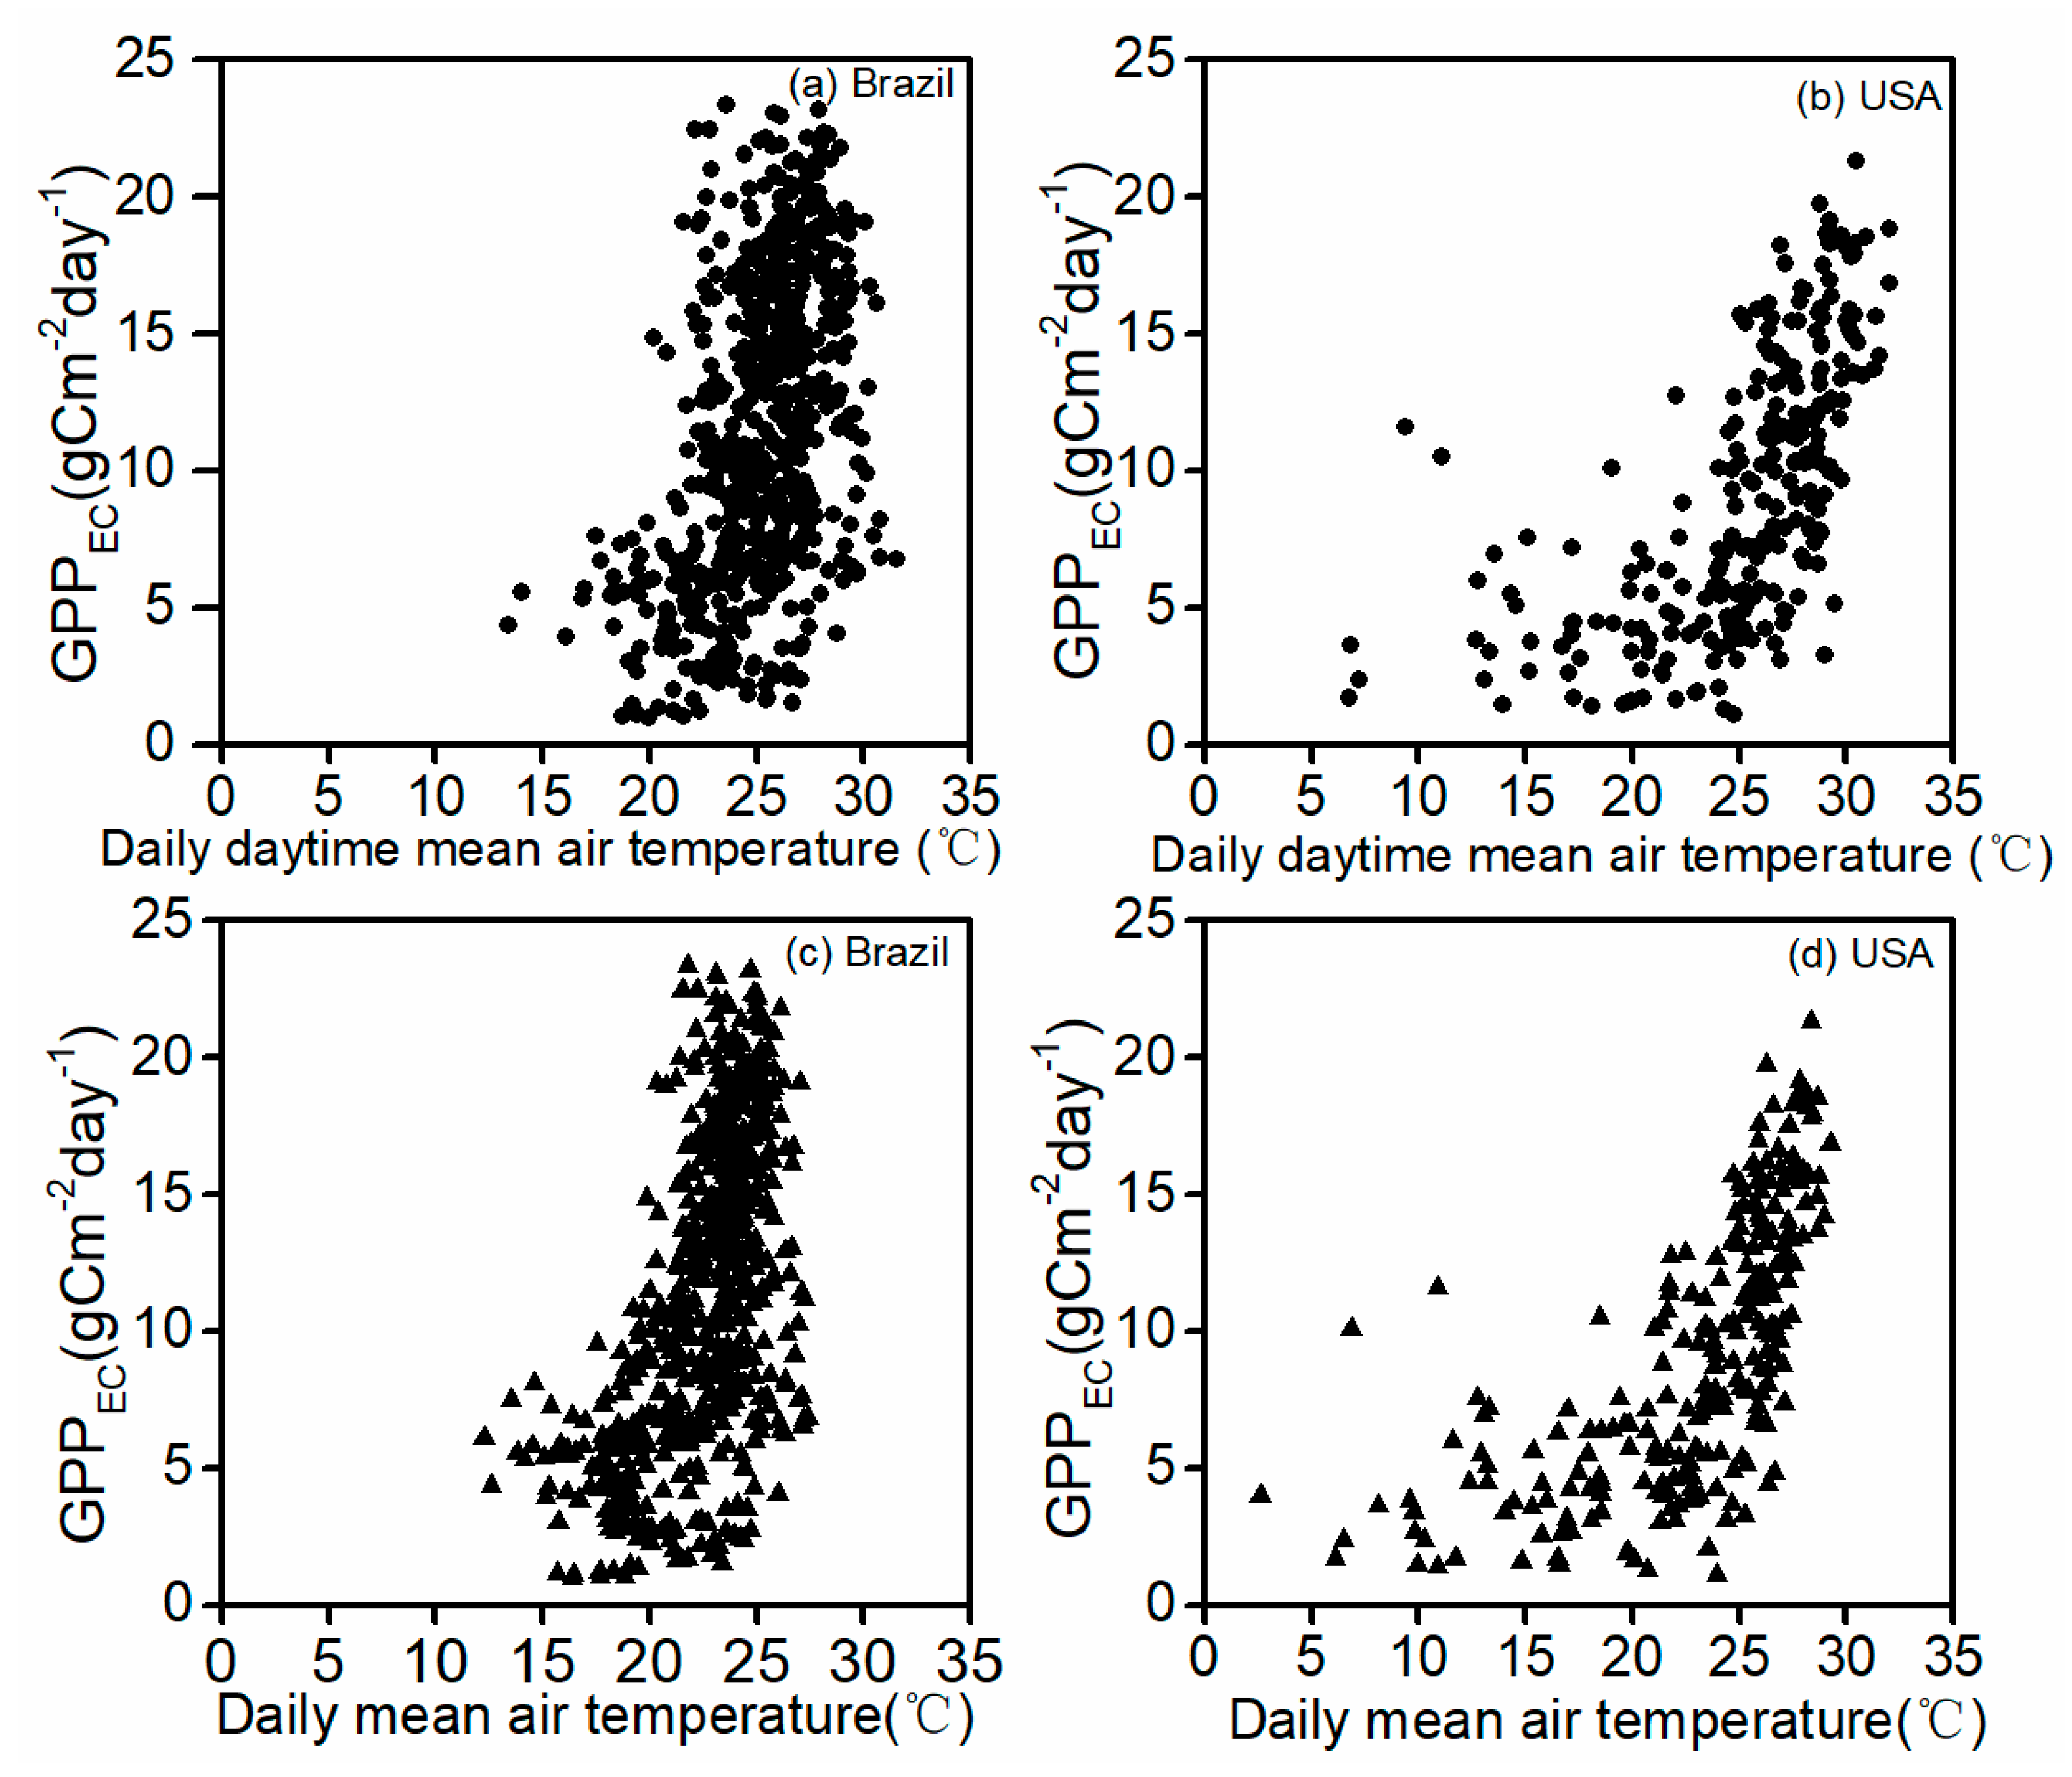
3.2. Estimation of the Site-Specific Optimum Air Tmeperature (Topt) for GPP at the Two Sugarcane Sites

We assessed the biophysical performance of the vegetation indices at the sugarcane sites in terms of the GPP dynamics. Figure 4 shows the correlation between the GPPEC and vegetation indices (NDVI and EVI) during the sugarcane growing seasons at the two sites. The GPPEC has slightly stronger linear relationships with EVI (R2 = 0.68 at the Brazil site and R2 = 0.79 at the USA site) than with the NDVI (R2 = 0.52 at the Brazil site and R2 = 0.76 at the USA site) (Figure 4). The slightly lower R2 values at the Brazil sugarcane sites is in part attributed to the effect of frequent cloud cover and shadow on vegetation indices during the rainy season, as evidenced by the relatively large variation in the vegetation indices (Figure 2a).
We evaluated the effects of air temperature on the GPPEC by the relationships between the GPPEC and the daily daytime mean air temperature and daily mean air temperature at the two sites (Figure 5). At the Brazil site, the GPPEC increased as the daily daytime mean air temperature or daily mean air temperature increased and reached its plateau at ~25 °C (Figure 5a,c). At the USA site, the GPPEC increased as the daily daytime mean air temperature or daily mean air temperature increased and reached its plateau at 28 °C (Figure 5b,d).
We further investigated the effect of air temperature (daily daytime mean air temperature, daily mean air temperature) on the vegetation indices (NDVI and EVI) (Figure 6). The NDVI and EVI rose with the daily daytime mean air temperature and reached their plateau at 25 °C at the Brazil location and 25 °C for the USA location (Figure 6a,b). The NDVI and EVI were positively correlated with the daily mean air temperature and reached their plateau at 25 °C at the Brazil site and 28°C at the USA site (Figure 6c,d).
For simulations of the VPM model (see Section 3.3), the optimum air temperature (Topt) at the Brazil site is set at 25 °C (both GPP-based and EVI-based) and the optimum air temperature (Topt) at the USA site is set 28 ° C (GPP-based) or 25 °C (EVI-based), respectively, as part of a model sensitivity test.

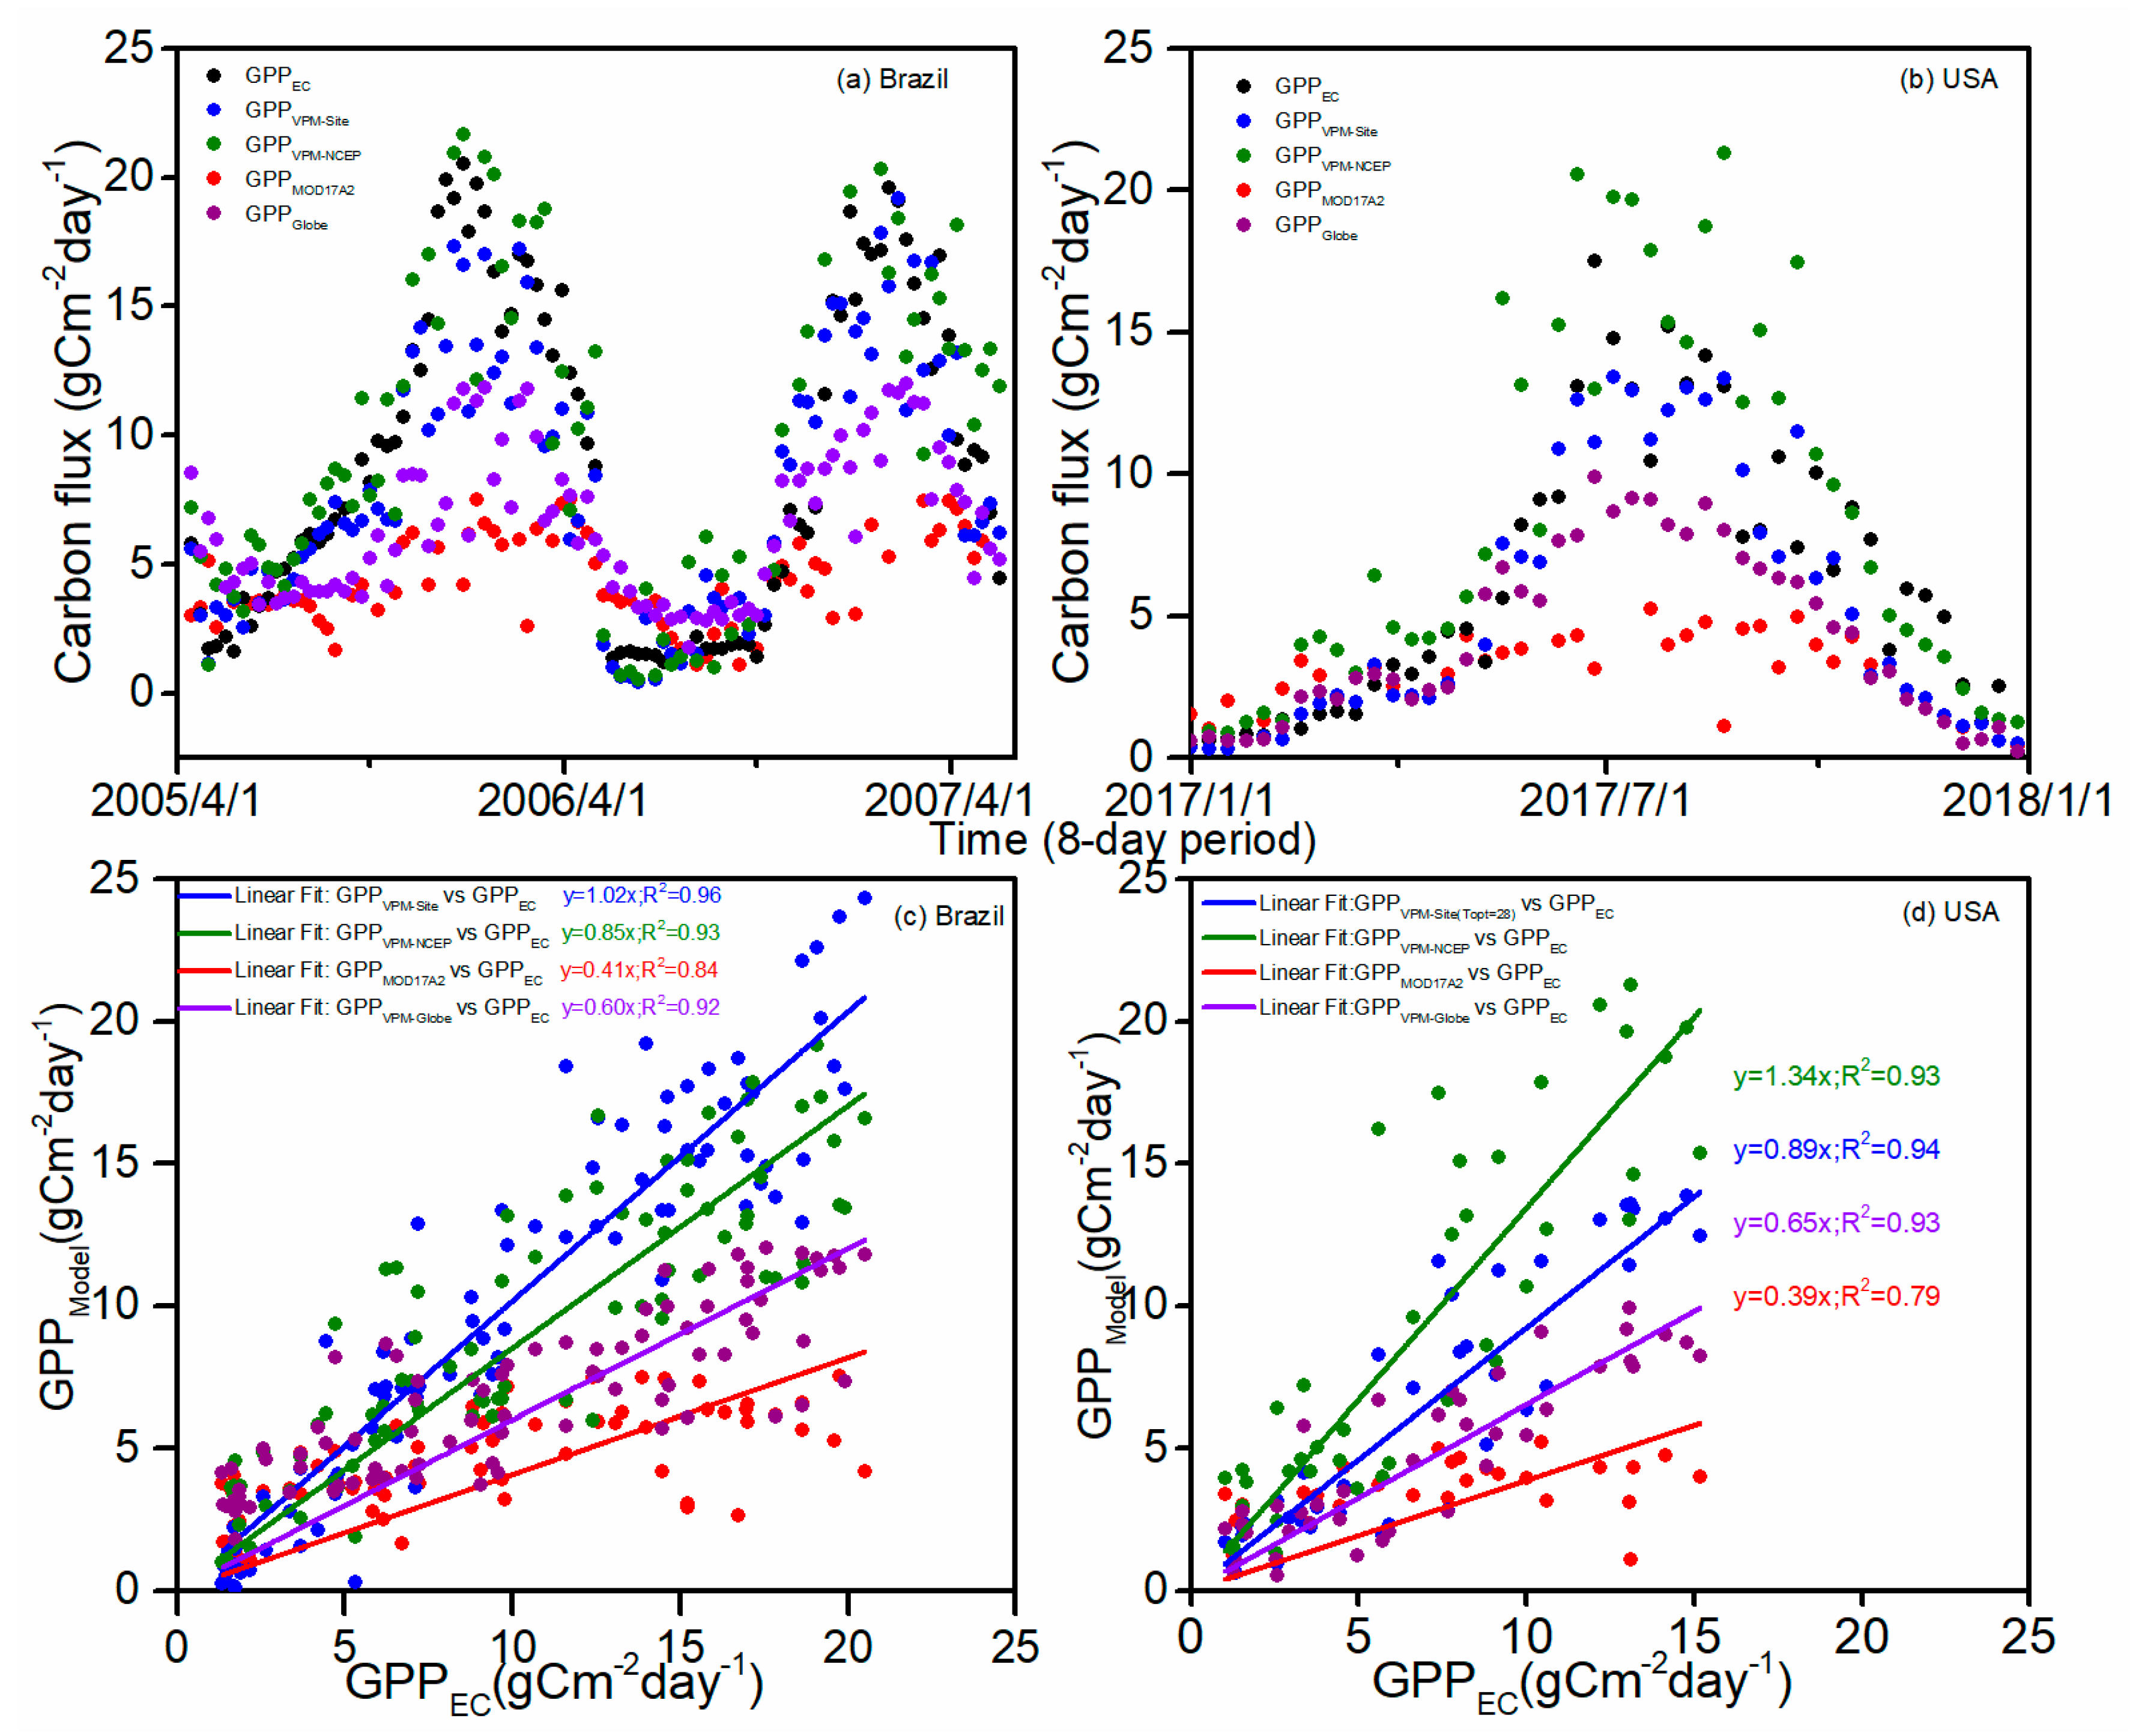
3.3. Seasonal Dynamics of GPP as Simulated by the VPM Model with the Climate Data from the EC Flux Tower Sites (GPPVPM-Site)

The seasonal dynamics of the GPPEC and GPPVPM-Site at the two sites agreed reasonably well with each other (Figure 7). At the Brazil site, the GPPVPM-Site increased rapidly in May 2005, maximized in December 2005, and fell below 1 g C m−2day−1 by May 2006 after the harvesting of the sugarcane (Figure 7a). The GPPVPM-Site remained very small from May to October in 2006, and then rose in October and decreased by May in 2007 (Figure 7a). At the USA site, the GPPVPM-Site increased from April, reached maximum its value at August, and dropped by late December. The maximum daily GPPVPM-Site was slightly lower than the GPPEC for July–August (Figure 7b).
There are strong linear relationships between the GPPEC and GPPVPM-Site in the sugarcane growing seasons at the two sites (Figure 7c,d). The linear regression models between the GPPEC and GPPVPM-Site indicate discrepancy at the Brazil site (2%) and the USA site (25°C, −9%; 28°C, −11%). The seasonal sum of GPPVPM-Site during the growing season defined by the GPPEC at the Brazil site during 2005/2006 and 2006/2007 was 3968 and 2868 g C m−2 yr−1, approximately 1.67% lower than the sum of the GPPEC in 2005/2006 (4035 g C m−2 yr−1) and 0.95% higher than the sum of the GPPEC in 2006/2007 (2841 g C m−2 yr−1) (Table 1). The seasonal sum of the GPPVPM-Site during the growing season defined by LSWI at the Brazil site during 2005/2006 and 2006/2007 was 3913 and 2776 g C m−2 yr−1, approximately 1.01% higher than the sum of the GPPEC in 2005/2006 (3873 g C m−2 yr−1) and 4.53% higher than the sum of GPPEC in 2006/2007 (2656 g C m−2 yr−1). The seasonal sum of the GPPVPM-Site during the growing season defined by the GPPEC at the USA site in 2017 was between 1979 g C m−2 yr−1 (25 °C) and 1976 g C m−2 yr−1 (28 °C), or 10.06~10.17% lower than the sum of the GPPEC (2200 g C m−2 yr−1). The seasonal sum of the GPPVPM-Site during the growing season defined by LSWI at the USA site in 2017 was between 1699 g C m−2 yr−1 (25 °C) and 1709 g C m−2 yr−1(28 °C), or 9.68~10.25% lower than the sum of the GPPEC (1893 g C m−2 yr−1) (Table 1).

3.4. Interannual Variation in GPP as Simulated by the VPM Model with NCEP Climate Data (GPPVPM-NCEP)

The seasonal dynamics and interannual variation in GPPVPM-NCEP from the VPM model with the NCEP climate data at the two sites during 2000–2018 reflects the effect of climate (drought) on the sugarcane GPP (Figure 8). We calculate the annual GPPVPM-NECP of sugarcane plantations as the sum of all the GPP data with GPPVPM ≥1 g Cm−2 day−1. At the Brazil site, the GPPVPM-NCEP in strong El Nino years (2009/2010) was the lowest during 2000–2018. At the USA site, the GPPVPM-NCEP had relatively small interannual variations in 2000–2018 (Figure 8b).
Table S2 shows the total GPP estimated by the VPM model and NCEP climate data (GPPVPM-NCEP) during the sugarcane growing season from 2000–2018 at the two sites. The total GPPVPM-NCEP at the Brazil site varied from 2090 g C m−2 yr−1 in 2009/2010 to 3176 g C m−2 yr−1 in 2005/2006, which is closely related to climate variation, especially annual PAR (Figure 9a). The total GPPVPM-NCEP at the USA site ranged from 2607 g C m−2 yr−1 in 2011 to 3327 g C m−2 yr−1 in 2004.

4. Discussion

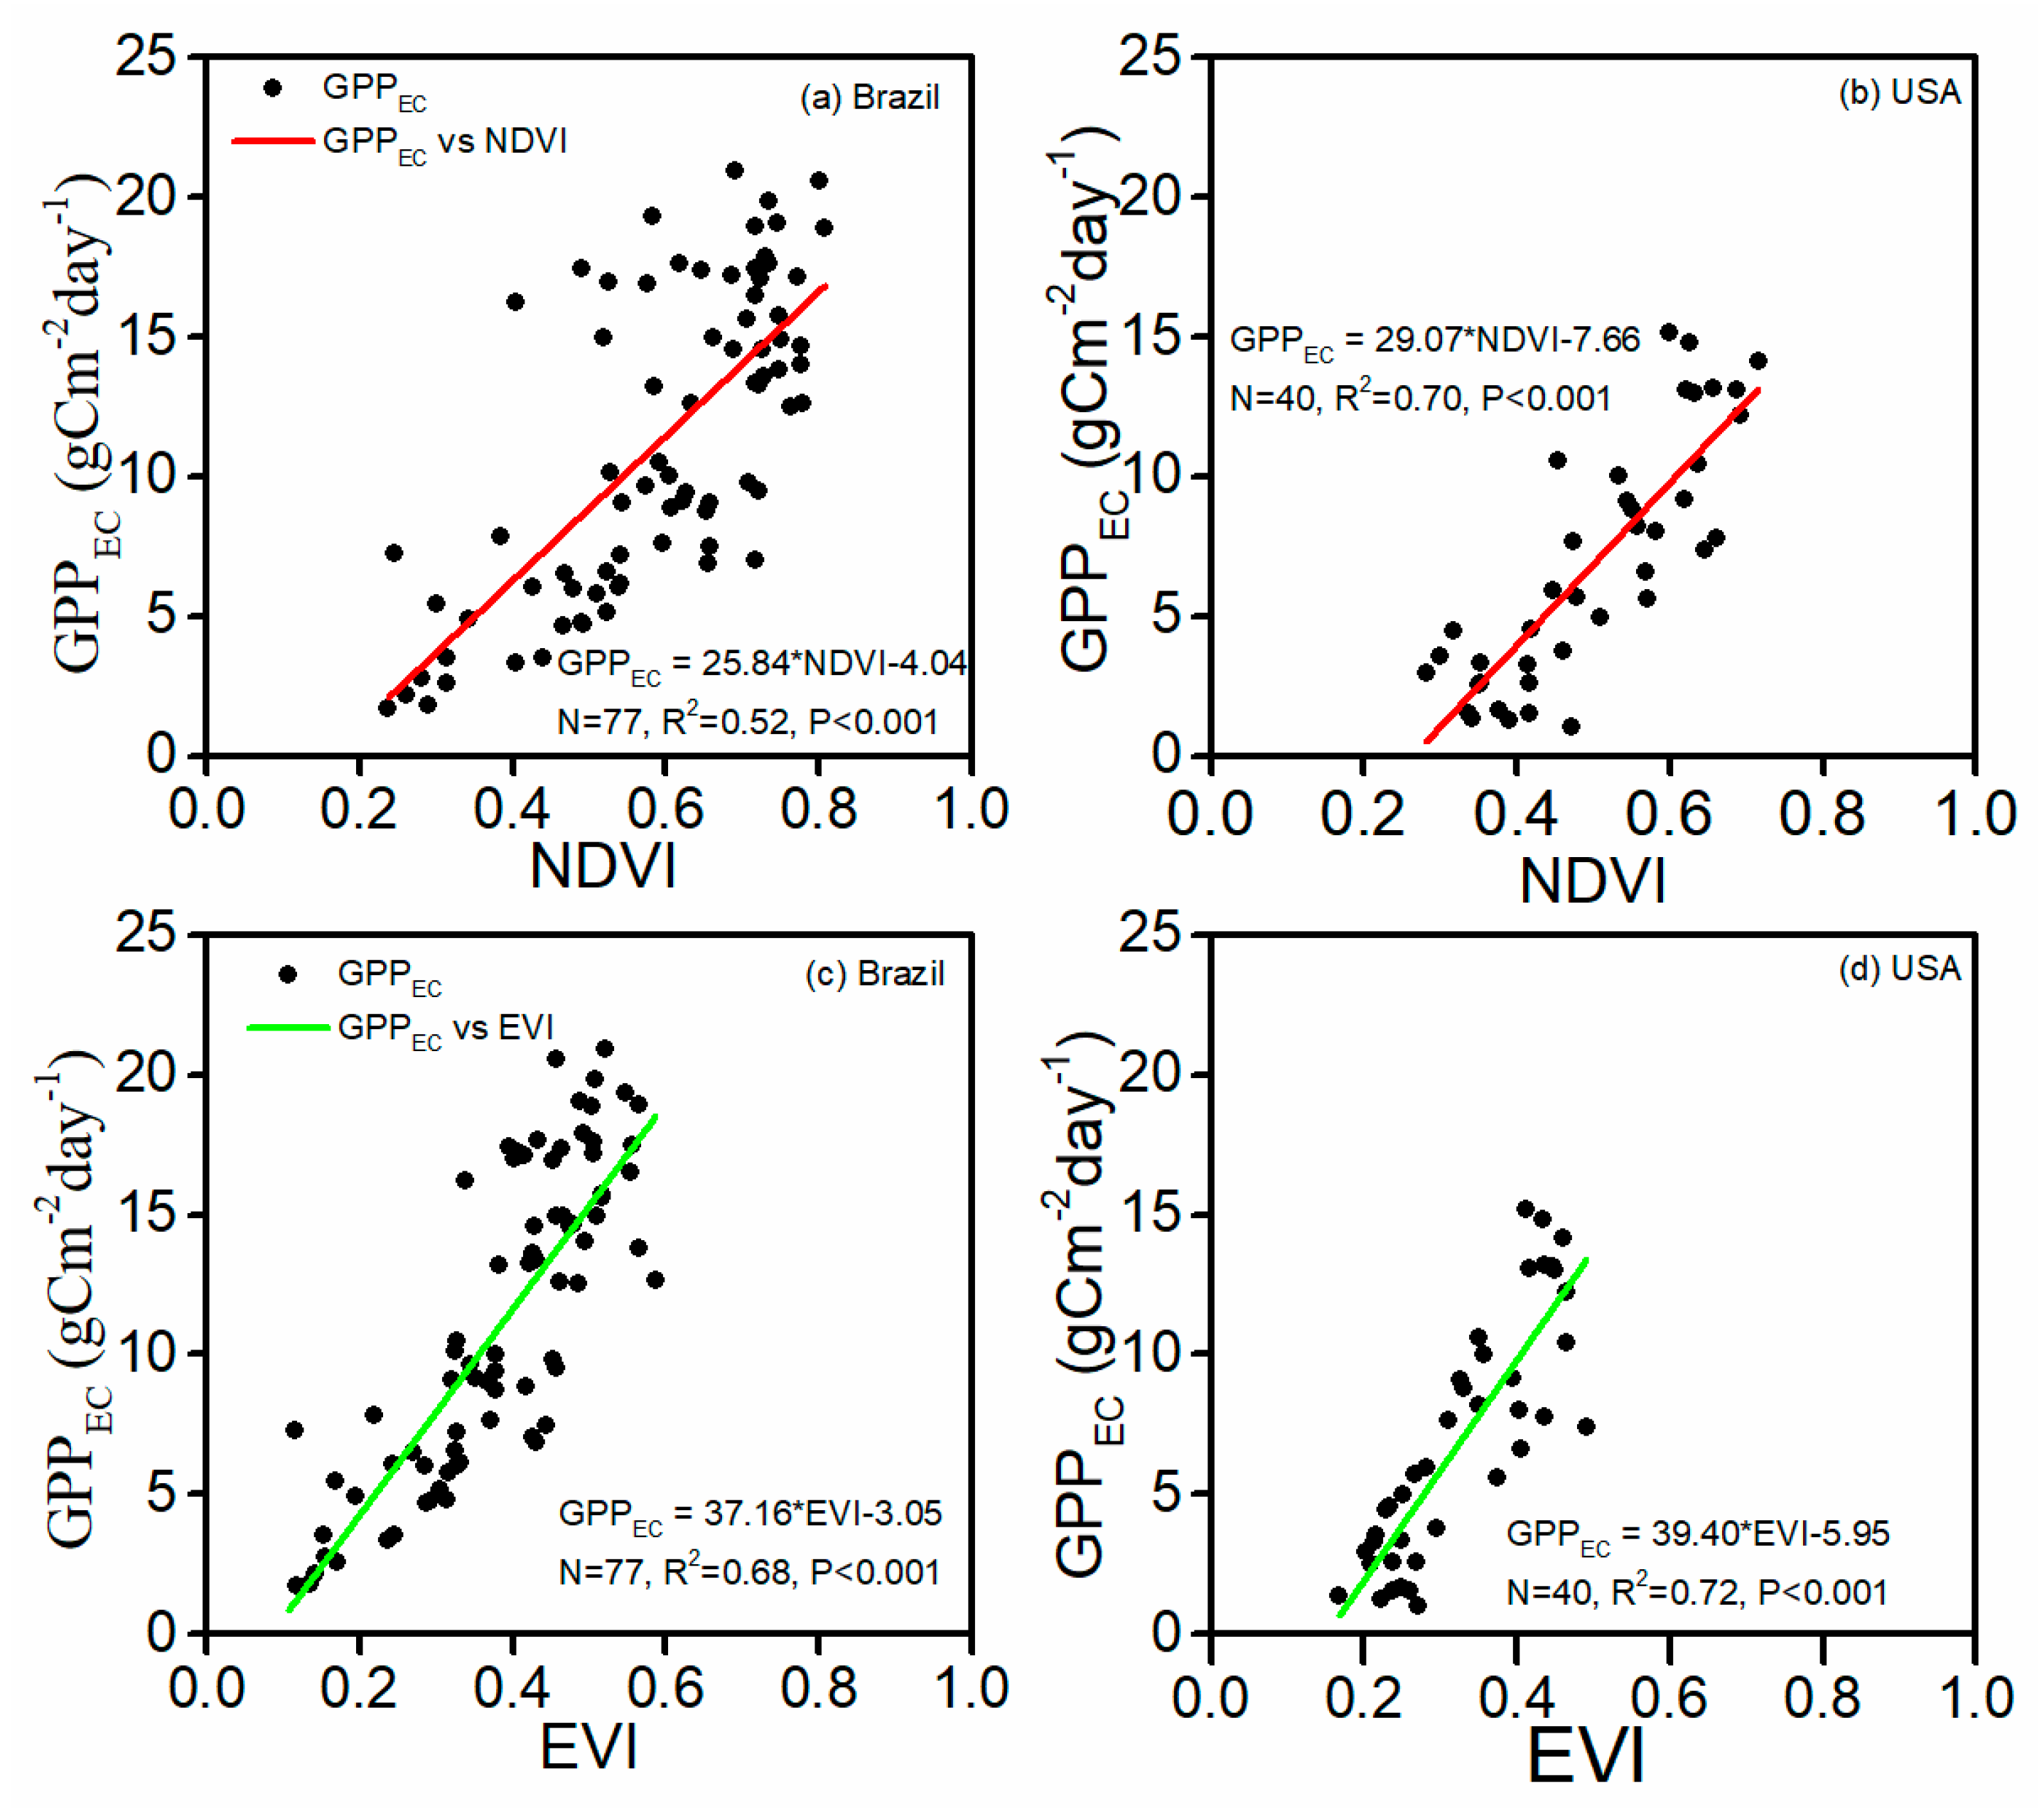
4.1. Biophysical Performance of Vegetation Indices for the Sugarcane Plantations

Satellite-based vegetation indices (VIs), including greenness-associated VIs (e.g., NDVI, EVI) and water-associated VIs (e.g., NDWI or LSWI) [66,67,68], have been used as proxies for several biochemical and biophysical variables including leaf area index, canopy chlorophyll content, and gross primary production [69]. Our results show that at the sugarcane croplands, the linear relationship between the GPPEC and EVI is slightly stronger than that between the GPPEC and NDVI. Similar results were reported in other studies of paddy rice fields [44], maize croplands [42], grasslands [41], and forests [36,37,38].
Crop phenology or calendar information (e.g., planting date, harvest date) are useful for crop management, crop yield estimation, and carbon cycle study [70,71]. Several studies used reflectance and vegetation indices data to track or classify the sugarcane area over several years and predict the cane stalk yield [72,73,74,75,76,77]. Time series MODIS-derived EVI data were used to classify sugarcane croplands in Brazil [72]. The land surface phenology of croplands can be tracked and delineated by the seasonal dynamics of vegetation indices (NDVI, EVI, and/or LSWI) from the perspective of ecosystem structure (leaf area index, greenness) [38,39]. Our study shows that NDVI, EVI, and LSWI track the phenological dynamics of sugarcane croplands. According to the detailed information on sugarcane cultivation history at the two sites [16,18,50,78], the fields have been used to grow sugarcane for at least a few decades (Table S1). The time series vegetation index data from MODIS during 2000–2018 (Figure S4) show that the LSWI dropped to <0 when the sugarcane fields were at the harvest stage at both the sites, which clearly showed that in the fall/winter season the date after the first negative LSWI values (<0) corresponds to the harvesting date or the ending date in the plant growing season. As shown in Figure 3 and Figure S4, the LSWI-based algorithms accurately identified the harvest dates at the Brazil site and the USA site. This is consistent with our previous studies that used the LSWI to delineate phenological metrics [42,44,79]. In addition, the land surface phenology of croplands can also be tracked and delineated by the seasonal dynamic of GPPEC and NEEEC data at the EC flux tower sites from the perspective of ecosystem function (physiology) [36,37,41]. Our study shows that GPPEC tracks well the carbon uptake period using a simple criterion (GPPEC ≥ 1 g C /m2/day). It is important to note that this study demonstrates the temporal consistency in the land surface phenology derived from these two approaches.

4.2. A Comparison of GPP Estimates from Multiple Data Products (GPPEC, GPPVPM-Site, GPPVPM-NCEP, GPPMOD17A2, and GPPVPM-Globe)

The simulations of the LUE-based GPP models driven by in situ climate and known C3 or C4 maximum LUE parameters were assessed at multiple crop EC flux tower sites [44,45,80,81,82]. The results of this study show that our VPM model has a good performance in modelling the GPP of sugarcane croplands when using a C4 maximum LUE parameter, site-specific Topt parameter, and local climate data (GPPVPM-Site) or global climate data (GPPVPM-NCEP). Several global GPP datasets derived from satellite-based LUE models are also available to the community, including the Terra/MODIS Gross and Net Primary Production (GPP/NPP) data product (MOD17A2) [56,83] and the GPP dataset from VPM simulations (GPPVPM-globe) [55]. We compared the seasonal dynamic of the GPPEC, GPPVPM-Site, GPPVPM-NCEP, GPPMOD17A2, and GPPVPM-Globe at the two sites (Figure 10). The GPPMOD17A2 was much lower than the GPPEC, GPPVPM-Site, and GPPVPM-Globe during the plant growing season at the two sites (Figure 10a,b). The scatterplots of GPPMOD17A2, GPPVPM-Site, GPPVPM-NCEP, and GPPVPM-Globe versus the GPPEC over the plant growing seasons at the two sites showed strong linear correlations between the GPPEC and other GPP estimates (Figure 10c,d). Using the GPPEC as reference, the GPPMOD17A2 underestimated the GPP by 61% at the USA site and 59% at the Brazil site. The GPPVPM-Globe underestimated the GPP by 35% at the USA site and 40% at the Brazil site. The large underestimation by the global data products (GPPMOD17A2 and GPPVPM-Globe) at the two sites can be attributed to the maximum LUE parameter used in the global simulations. For the MOD17A2 GPP/NPP product, the C3 maximum LUE parameter was used in its model simulation, as the land cover map using (MCD12C1 C55) does not separate the C3 and C4 crops. For the GPPVPM-Globe product [55], the VPM simulations used a mix of C3 and C4 maximum LUE parameters for croplands and the land cover maps (MCD12C1, C55). The maximum LUE parameter values of the C4 plants are substantially higher than those of the C3 plants [84]. The results from this study clearly highlight the urgent need for developing annual maps of C3 and C4 crops so that model simulations can use the appropriate C3 or C4 maximum LUE parameter (ε0) for specific crop function types. Such comparison analyses also suggest that the global GPP data products to estimate the sugarcane GPP at local and regional scales should be used cautiously.

4.3. Sources of Errors and Uncertainty in Predicted GPPVPM-site at Sugarcane EC Flux Tower Sites

VPM simulations at the two sugarcane sites have several sources of error or uncertainty, including in situ climate datasets, time series MODIS vegetation indices, model parameters, and land cover types within the MODIS image pixels and the footprint of EC flux tower sites. The maximum LUE parameter values are estimated by various estimation methods and directly affect GPP simulations at the ecosystem level [85,86]. Several previous in situ studies have reported that the LUE varied under rain-fed and irrigated conditions—for example, for sugarcane varieties in Sri Lanka, the LUE parameter ranged between 1.63 and 2.09 g dry biomass MJ-1 under irrigated and between 0.71 and 1.03 g dry biomass MJ−1 under rain-fed conditions [87]. Another publication reported that the maximum LUE for sugarcane at tropical region in Australia ranges from 1.7 g dry biomass MJ−1 [88] to 2.0 g dry biomass MJ−1 [89]. One field experiment in Brazil showed that maximum LUE parameter ranged between 1.74 and 2.28 g C MJ−1 (0.85–1.12 g C mol−1 PPFD) [90]. In the above-mentioned papers, the LUE was calculated using the linear regression between the cumulative radiation intercepted and the aboveground dry weight. In addition, many studies analyzed the PAR and gross primary production data to estimate the maximum LUE parameter (LUEGPP) [21]. In the above publication, the LUEAGB or LUEGPP parameter at two sugarcane sites in Hawaii, USA, were 0.88 ± 0.02 g C MJ−1 (0.43 ± 0.01 g C mol−1 PPFD) or 1.24 ± 0.22 g C MJ−1 (0.61 ± 0.11 g C mol−1 PPFD) at the site located at a low altitude and 0.75 ± 0.01 g C MJ−1 (0.37 ± 0.01 g Cmol−1 PPFD) or 1.15 ± 0.15 g C MJ−1 (0.56 ± 0.07 g Cmol−1 PPFD) at the site located at a high altitude. Different LUE definitions should be considered a source of errors associated with satellite-based GPP estimates. In our study, the maximum LUE parameter at the Brazil site and the USA site was set to 0.9 g Cmol−1 PPFD, which was slightly lower than the maize crop (0.92 g Cmol−1 PPFD), another C4 crop in China [79]. The range value of the maximum LUE parameter for sugarcane cropland indicates the need for the evaluation of the maximum LUE parameter over diverse sugarcane croplands in the world under different climate conditions and management practices.

5. Conclusions

This is the first case study that combines in situ data from sugarcane EC flux towers and satellite (MODIS) images to estimate the GPP of sugarcane croplands using the VPM model. The sensitivity analyses between the GPPEC and vegetation indices (NDVI and EVI) at the two sites provide new insight into the biophysical performance of vegetation indices. The sensitivity analysis between the GPPEC and temperature variables, including the mean daily air temperature, mean daytime air temperature, land surface temperature, and the analysis between the EVI and temperature variables at the two sites provides a reasonable method for finding the optimum air temperature values at individual sites, which may improve VPM model simulations at the landscape scale. The results demonstrate that the VPM model performs well in estimating the GPP seasonal dynamics at the two sugarcane sites. The maximum LUE parameter value in this study (0.9 g C mol−1 PPFD) is reasonable for applying the VPM model at these sugarcane croplands. The linked analyses of the flux data (GPPEC) from the EC flux tower sites, predicted GPP (GPPVPM-Site) with in-situ climate data from the EC flux tower site, and predicted GPP (GPPVPM-NCEP) with the NCEP climate data clearly demonstrates the feasibility of the VPM model to estimate and predict sugarcane physiological parameters in different climate systems. Additional evaluations of the VPM model at other sugarcane EC flux tower sites are still needed, which would contribute to a better understanding of the potential sources of errors and uncertainty in the simulations of the VPM model.

Supplementary Materials

The following are available online at https://www.mdpi.com/2072-4292/12/14/2186/s1, Figure S1: Averaged sugarcane production from the top 10 producer countries in the world (Data source: FAO, averaged values over the period of 1994-2017); Figure S2: Annual harvested area, production and yield of sugarcane in Brazil and USA during1961- 2017; Figure S3: Sugarcane production cycle at the Louisiana site, USA; Figure S4: Interannual variation of three vegetation indices from MODIS during 2000-2018 at the two sugarcane plantation sites. (a) Brazil site; (b) Louisiana site, USA; Figure S5: Interannual variation of climate data (air temperature, PAR and precipitation) during 2000-2018 at the two sugarcane plantation sites, derived from NCEP-DOE Reanalysis 2. (a) Brazil site; (b) Louisiana site, USA; Figure S6: Interannual variation of GPP data from the MODIS MOD17A2 product during 2000-2018 at the two sugarcane plantation sites. (a) Brazil site; (b) Louisiana site, USA. Table S1: A detailed information on sugarcane planting history at the two sugarcane sites during 2000-2018; Table S2: A summary of annual precipitation, mean annual air temperature, annual PAR from NCEP Reanalysis-2 climate data, and GPP estimated from the VPM model with NCEP Reanalyssi-2 climate data (GPPVPM-NCEP) during the sugarcane plant growing season at the sugarcane flux tower sites in Brazil and USA.

Author Contributions

F.X. and X.X. conceived the study. O.M.R.C. and P.M.W.J. provided in-situ data. F.X. did data analysis and VPM model simulation. X.X., O.M.R.C. and P.M.W.J. contributed to data processing, analysis and visualization. F.X. and X.X. wrote the first draft and O.M.R.C., P.M.W.J., H.G., J.M., B.L., and B.Z. read and revised the drafts. All authors have read and agreed to the published version of the manuscript.

Funding

This study (in situ data collection) was partially funded by Brazil Embrapa (Project 03.15.00.117.00) and the United States Department of Agriculture (USDA) Agricultural Research Service, Sugarcane Research Unit in Houma, LA, as part of project 6052-13210-001-00D. The USDA is an equal opportunity provider and employer. This research at the field site in Louisiana was a contribution from the Long-Term Agroecosystem Research (LTAR) network. LTAR is supported by the USDA. This study (data analysis and modeling) was supported in part by research grants from and USDA National Institute of Food and Agriculture (2020-67104-30935) and NASA ‘Geostationary Carbon Cycle Observatory (GeoCarb) Mission’ (80LARC17C0001).

Acknowledgments

We thank the reviewers for their time, effort, and comments on the early version of the manuscript.

Conflicts of Interest

The authors declare no conflict of interest.

References

  1. McCormick, A.J.; Watt, D.A.; Cramer, M.D. Supply and demand: Sink regulation of sugar accumulation in sugarcane. J. Exp. Bot. 2009, 60, 357–364. [Google Scholar] [CrossRef]
  2. Lakshmanan, P.; Geijskes, R.J.; Aitken, K.S.; Grof, C.L.P.; Bonnett, G.D.; Smith, G.R. Sugarcane biotechnology: The challenges and opportunities. Vitr. Cell. Dev. Biol. Plant 2005, 41, 345–363. [Google Scholar] [CrossRef]
  3. Dar, R.A.; Dar, E.A.; Kaur, A.; Phutela, U.G. Sweet sorghum-a promising alternative feedstock for biofuel production. Renew. Sustain. Energy Rev. 2018, 82, 4070–4090. [Google Scholar] [CrossRef]
  4. Chandel, A.K.; da Silva, S.S.; Carvalho, W.; Singh, O.V. Sugarcane bagasse and leaves: Foreseeable biomass of biofuel and bio-products. J. Chem. Technol. Biotechnol. 2012, 87, 11–20. [Google Scholar] [CrossRef]
  5. Da Silva, F.C.; Diaz-Ambrona, C.G.H.; Buckeridge, M.S.; Souza, A.; Barbieri, V.; Dourado Neto, D. Sugarcane and climate change: Effects of CO2 on potential growth and development. In Proceedings of the IV International Symposium on Applications of Modelling as an Innovative Technology in the Agri-Food-Chain: Model-It, Madrid, Spain, 31 December 2008; pp. 331–336. [Google Scholar]
  6. Silva-Olaya, A.; Cerri, C.E.P.; La Scala, N., Jr.; Dias, C.T.D.S.; Cerri, C.C. Carbon dioxide emissions under different soil tillage systems in mechanically harvested sugarcane. Environ. Res. Lett. 2013, 8, 015014. [Google Scholar] [CrossRef] [Green Version]
  7. Galdos, M.V.; Cerri, C.C.; Lal, R.; Bernoux, M.; Feigl, B.; Cerri, C.E.P. Net greenhouse gas fluxes in Brazilian ethanol production systems. Glob. Chang. Biol. Bioenergy 2010, 2, 37–44. [Google Scholar] [CrossRef]
  8. La Scala, N.; De Figueiredo, E.B.; Panosso, A.R. A review on soil carbon accumulation due to the management change of major Brazilian agricultural activities. Braz. J. Biol. 2012, 72, 775–785. [Google Scholar] [CrossRef] [Green Version]
  9. Bordonal, R.D.; de Figueiredo, E.B.; La Scala, N. Greenhouse gas balance due to the conversion of sugarcane areas from burned to green harvest, considering other conservationist management practices. GCB Bioenergy 2012, 4, 846–858. [Google Scholar] [CrossRef]
  10. Chalco Vera, J.; Valeiro, A.; Posse, G.; Moises Acreche, M. To burn or not to burn: The question of straw burning and nitrogen fertilization effect on nitrous oxide emissions in sugarcane. Sci. Total Environ. 2017, 587, 399–406. [Google Scholar] [CrossRef]
  11. Alkimim, A.; Clarke, K.C. Land use change and the carbon debt for sugarcane ethanol production in Brazil. Land Use Policy 2018, 72, 65–73. [Google Scholar] [CrossRef] [Green Version]
  12. Egeskog, A.; Freitas, F.; Berndes, G.; Sparouek, G.; Wirsenius, S. Greenhouse gas balances and land use changes associated with the planned expansion (to 2020) of the sugarcane ethanol industry in Sao Paulo, Brazil. Biomass Bioenergy 2014, 63, 280–290. [Google Scholar] [CrossRef]
  13. Baldocchi, D. Assessing ecosystem carbon balance: Problems and prospects of the eddy covariance technique. Glob. Chang. Biol. 2003, 9, 478–492. [Google Scholar] [CrossRef] [Green Version]
  14. Running, S.W.; Baldocchi, D.D.; Turner, D.P.; Gower, S.T.; Bakwin, P.S.; Hibbard, K.A. A global terrestrial monitoring network integrating tower fluxes, flask sampling, ecosystem modeling and EOS satellite data. Remote Sens. Environ. 1999, 70, 108–127. [Google Scholar] [CrossRef]
  15. Fernandez-Martinez, M.; Yu, R.; Gamon, J.; Hmimina, G.; Filella, I.; Balzarolo, M.; Stocker, B.; Penuelas, J. Monitoring Spatial and Temporal Variabilities of Gross Primary Production Using MAIAC MODIS Data. Remote Sens. 2019, 11, 874. [Google Scholar] [CrossRef] [Green Version]
  16. Runkle, B.R.; Rigby, J.R.; Reba, M.L.; Anapalli, S.S.; Bhattacharjee, J.; Krauss, K.W.; Liang, L.; Locke, M.A.; Novick, K.A.; Sui, R. Delta-flux: An eddy covariance network for a climate-smart lower Mississippi basin. Agric. Environ. Lett. 2017, 2, 1–5. [Google Scholar] [CrossRef]
  17. Da Rocha, A.E.Q.; de Souza, J.L.; Junior, R.A.F.; Lyra, G.B.; Endres, L.; Lyra, G.B. Water vapour and carbon dioxide fluxes in sugarcane grown in megathermal humid climate in Northeastern Brazil. Aust. J. Crop. Sci. 2018, 12, 755. [Google Scholar] [CrossRef]
  18. Cabral, O.M.; Rocha, H.R.; Gash, J.H.; Ligo, M.A.; Ramos, N.P.; Packer, A.P.; Batista, E.R. Fluxes of CO2 above a sugarcane plantation in Brazil. Agric. For. Meteorol. 2013, 182, 54–66. [Google Scholar] [CrossRef] [Green Version]
  19. Pakoktom, T.; Chaichana, N.; Phattaralerphong, J.; Sathornkich, J. Carbon Use Efficiency of the First Ratoon Cane by Eddy Covariance Technique. Int. J. Environ. Sci. Dev. 2013, 4, 488. [Google Scholar] [CrossRef]
  20. Denmead, O.T.; MacDonald, B.C.T.; White, I.; Griffith, D.W.T.; Bryant, G.; Naylor, T.; Wilson, S.R. Evaporation and carbon dioxide exchange by sugarcane crops. Sugar Cane Int. 2009, 27, 231–236. [Google Scholar]
  21. Anderson, R.G.; Tirado-Corbala, R.; Wang, D.; Ayars, J.E. Long-rotation sugarcane in Hawaii sustains high carbon accumulation and radiation use efficiency in 2nd year of growth. Agric. Ecosyst. Environ. 2015, 199, 216–224. [Google Scholar] [CrossRef] [Green Version]
  22. Moon, M.; Zhang, X.Y.; Henebry, G.M.; Liu, L.L.; Gray, J.M.; Melaas, E.K.; Friedl, M.A. Long-term continuity in land surface phenology measurements: A comparative assessment of the MODIS land cover dynamics and VIIRS land surface phenology products. Remote Sens. Environ. 2019, 226, 74–92. [Google Scholar] [CrossRef]
  23. Piao, S.L.; Liu, Q.; Chen, A.P.; Janssens, I.A.; Fu, Y.S.; Dai, J.H.; Liu, L.L.; Lian, X.; Shen, M.G.; Zhu, X.L. Plant phenology and global climate change: Current progresses and challenges. Glob. Chang. Biol. 2019, 25, 1922–1940. [Google Scholar] [CrossRef] [PubMed]
  24. Yang, W.; Kobayashi, H.; Wang, C.; Shen, M.G.; Chen, J.; Matsushit, B.; Tang, Y.H.; Kim, Y.; Bret-Harte, M.S.; Zona, D.; et al. A semi-analytical snow-free vegetation index for improving estimation of plant phenology in tundra and grassland ecosystems. Remote Sens. Environ. 2019, 228, 31–44. [Google Scholar] [CrossRef]
  25. Pillai, N.D.; Nandy, S.; Patel, N.R.; Srinet, R.; Watham, T.; Chauhan, P. Integration of eddy covariance and process-based model for the intra-annual variability of carbon fluxes in an Indian tropical forest. Biodivers. Conserv. 2019, 28, 2123–2141. [Google Scholar] [CrossRef]
  26. You, Y.F.; Wang, S.Y.; Ma, Y.X.; Wang, X.Y.; Liu, W.H. Improved modeling of gross primary productivity of Alpine Grasslands on the Tibetan Plateau using the biome-BGC model. Remote Sens. 2019, 11, 1287. [Google Scholar] [CrossRef] [Green Version]
  27. Andrefouet, S.; Payri, C. Scaling-up carbon and carbonate metabolism of coral reefs using in-situ data and remote sensing. Coral Reefs 2001, 19, 259–269. [Google Scholar] [CrossRef]
  28. Song, T.; Wang, S.Q.; Gao, J.X.; Han, Y.W.; Soc, I.C. A study on the scaling-up of CO2 fluxes at haibei Station based on GIS and RS technologies. In Proceedings of the International Conference on Environmental Science and Information Application Technology, Wuhan, China, 4–5 July 2009; pp. 455–461. [Google Scholar]
  29. Brogaard, S.; Runnstrom, M.; Seaquist, J.W. Primary production of Inner Mongolia, China, between 1982 and 1999 estimated by a satellite data-driven light use efficiency model. Glob. Planet. Chang. 2005, 45, 313–332. [Google Scholar] [CrossRef]
  30. Sims, D.A.; Rahman, A.F.; Cordova, V.D.; El-Masri, B.Z.; Baldocchi, D.D.; Flanagan, L.B.; Goldstein, A.H.; Hollinger, D.Y.; Misson, L.; Monson, R.K.; et al. On the use of MODIS EVI to assess gross primary productivity of North American ecosystems. J. Geophys. Res. Biogeosci. 2006, 111. [Google Scholar] [CrossRef] [Green Version]
  31. Lin, S.; Li, J.; Liu, Q.; Huete, A.; Li, L. Effects of forest canopy vertical stratification on the estimation of gross primary production by remote sensing. Remote Sens. 2018, 10, 1329. [Google Scholar] [CrossRef] [Green Version]
  32. Madani, N.; Kimball, J.S.; Running, S.W. Improving Global Gross Primary Productivity Estimates by Computing Optimum Light Use Efficiencies Using Flux Tower Data. J. Geophys. Res. Biogeosci. 2017, 122, 2939–2951. [Google Scholar] [CrossRef]
  33. Shi, Y.; Xu, X.; Du, H.; Zhou, G.; Zhou, Y.; Mao, F.; Li, X.; Zhu, D. Estimation of gross primary production in Moso bamboo forest based on light-use efficiency derived from MODIS reflectance data. Int. J. Remote Sens. 2018, 39, 210–231. [Google Scholar] [CrossRef]
  34. Zhou, Y.L.; Wu, X.C.; Ju, W.M.; Chen, J.M.; Wang, S.Q.; Wang, H.M.; Yuan, W.P.; Black, T.A.; Jassal, R.; Ibrom, A.; et al. Global parameterization and validation of a two-leaf light use efficiency model for predicting gross primary production across FLUXNET sites. J. Geophys. Res. Biogeosci. 2016, 121, 1045–1072. [Google Scholar] [CrossRef]
  35. Zhu, H.J.; Lin, A.W.; Wang, L.C.; Xia, Y.; Zou, L. Evaluation of MODIS gross primary production across multiple biomes in China using eddy covariance flux data. Remote Sens. 2016, 8, 395. [Google Scholar] [CrossRef] [Green Version]
  36. Xiao, X.M.; Hollinger, D.; Aber, J.; Goltz, M.; Davidson, E.A.; Zhang, Q.Y.; Moore, B. Satellite-based modeling of gross primary production in an evergreen needleleaf forest. Remote Sens. Environ. 2004, 89, 519–534. [Google Scholar] [CrossRef]
  37. Xiao, X.M.; Zhang, Q.Y.; Braswell, B.; Urbanski, S.; Boles, S.; Wofsy, S.; Berrien, M.; Ojima, D. Modeling gross primary production of temperate deciduous broadleaf forest using satellite images and climate data. Remote Sens. Environ. 2004, 91, 256–270. [Google Scholar] [CrossRef]
  38. Xiao, X.M.; Zhang, Q.Y.; Hollinger, D.; Aber, J.; Moore, B. Modeling gross primary production of an evergreen needleleaf forest using modis and climate data. Ecol. Appl. 2005, 15, 954–969. [Google Scholar] [CrossRef] [Green Version]
  39. Xiao, X.M.; Zhang, Q.Y.; Saleska, S.; Hutyra, L.; De Camargo, P.; Wofsy, S.; Frolking, S.; Boles, S.; Keller, M.; Moore, B. Satellite-based modeling of gross primary production in a seasonally moist tropical evergreen forest. Remote Sens. Environ. 2005, 94, 105–122. [Google Scholar] [CrossRef]
  40. Li, Z.Q.; Yu, G.R.; Xiao, X.M.; Li, Y.N.; Zhao, X.Q.; Ren, C.Y.; Zhang, L.M.; Fu, Y.L. Modeling gross primary production of alpine ecosystems in the Tibetan Plateau using MODIS images and climate data. Remote Sens. Environ. 2007, 107, 510–519. [Google Scholar] [CrossRef]
  41. Wu, W.X.; Wang, S.Q.; Xiao, X.M.; Yu, G.R.; Fu, Y.L.; Hao, Y.B. Modeling gross primary production of a temperate grassland ecosystem in Inner Mongolia, China, using MODIS imagery and climate data. Sci. China Ser. D Earth Sci. 2008, 51, 1501–1512. [Google Scholar] [CrossRef]
  42. Kalfas, J.L.; Xiao, X.M.; Vanegas, D.X.; Verma, S.B.; Suyker, A.E. Modeling gross primary production of irrigated and rain-fed maize using MODIS imagery and CO2 flux tower data. Agric. For. Meteorol. 2011, 151, 1514–1528. [Google Scholar] [CrossRef] [Green Version]
  43. Wang, Z.; Xiao, X.; Yan, X. Modeling gross primary production of maize cropland and degraded grassland in northeastern China. Agric. For. Meteorol. 2010, 150, 1160–1167. [Google Scholar] [CrossRef]
  44. Xin, F.F.; Xiao, X.M.; Zhao, B.; Miyata, A.; Baldocchi, D.; Knox, S.; Kang, M.; Shim, K.M.; Min, S.; Chen, B.Q.; et al. Modeling gross primary production of paddy rice cropland through analyses of data from CO2 eddy flux tower sites and MODIS images. Remote Sens. Environ. 2017, 190, 42–55. [Google Scholar] [CrossRef] [Green Version]
  45. Kang, X.M.; Wang, Y.F.; Chen, H.; Tian, J.Q.; Cui, X.Y.; Rui, Y.C.; Zhong, L.; Kardol, P.; Hao, Y.B.; Xiao, X.M. Modeling carbon fluxes using multi-temporal MODIS imagery and CO2 eddy flux tower data in Zoige alpine wetland, south-west China. Wetlands 2014, 34, 603–618. [Google Scholar] [CrossRef]
  46. Kang, X.M.; Yan, L.; Zhang, X.D.; Li, Y.; Tian, D.S.; Peng, C.H.; Wu, H.D.; Wang, J.Z.; Zhong, L. Modeling gross primary production of a typical coastal wetland in China using MODIS time series and CO2 eddy flux tower data. Remote Sens. 2018, 10, 708. [Google Scholar] [CrossRef] [Green Version]
  47. Singh, D. Generation and evaluation of gross primary productivity using Landsat data through blending with MODIS data. Int. J. Appl. Earth Obs. Geoinf. 2011, 13, 59–69. [Google Scholar] [CrossRef]
  48. Marin, F.R.; Jones, J.W.; Royce, F.; Suguitani, C.; Donzeli, J.L.; Wander Filho, J.P.; Nassif, D.S. Parameterization and evaluation of predictions of DSSAT/CANEGRO for Brazilian sugarcane. Agron. J. 2011, 103, 304–315. [Google Scholar] [CrossRef]
  49. Cabral, O.M.; Rocha, H.R.; Gash, J.H.; Ligo, M.A.; Tatsch, J.D.; Freitas, H.C.; Brasilio, E. Water use in a sugarcane plantation. GCB Bioenergy 2012, 4, 555–565. [Google Scholar] [CrossRef] [Green Version]
  50. White, P.M.; Webber, C.L.; Viator, R.P.; Aita, G. Sugarcane biomass, dry matter, and sucrose availability and variability when grown on a bioenergy feedstock production cycle. BioEnergy Res. 2018, 12, 55–67. [Google Scholar] [CrossRef]
  51. Reichstein, M.; Tenhunen, J.D.; Roupsard, O.; Ourcival, J.M.; Rambal, S.; Dore, S.; Valentini, R. Ecosystem respiration in two Mediterranean evergreen Holm Oak forests: Drought effects and decomposition dynamics. Funct. Ecol. 2002, 16, 27–39. [Google Scholar] [CrossRef] [Green Version]
  52. Campos-Taberner, M.; Moreno-Martinez, A.; Garcia-Haro, F.J.; Camps-Valls, G.; Robinson, N.P.; Kattge, J.; Running, S.W. Global estimation of biophysical variables from Google Earth Engine platform. Remote Sens. 2018, 10, 1167. [Google Scholar] [CrossRef] [Green Version]
  53. Kumar, L.; Mutanga, O. Google Earth Engine applications since inception: Usage, trends, and potential. Remote Sens. 2018, 10, 1509. [Google Scholar] [CrossRef] [Green Version]
  54. Zhang, Y.; Xiao, X.; Jin, C.; Dong, J.; Zhou, S.; Wagle, P.; Joiner, J.; Guanter, L.; Zhang, Y.; Zhang, G.; et al. Consistency between sun-induced chlorophyll fluorescence and gross primary production of vegetation in North America. Remote Sens. Environ. 2016, 183, 154–169. [Google Scholar] [CrossRef] [Green Version]
  55. Zhang, Y.; Xiao, X.; Wu, X.; Zhou, S.; Zhang, G.; Qin, Y.; Dong, J. A global moderate resolution dataset of gross primary production of vegetation for 2000–2016. Sci. Data 2017, 4, 170165. [Google Scholar] [CrossRef] [PubMed] [Green Version]
  56. Zhao, M.; Heinsch, F.A.; Nemani, R.R.; Running, S.W. Improvements of the MODIS terrestrial gross and net primary production global data set. Remote Sens. Environ. 2005, 95, 164–176. [Google Scholar] [CrossRef]
  57. Jin, C.; Xiao, X.M.; Wagle, P.; Griffis, T.; Dong, J.W.; Wu, C.Y.; Qin, Y.W.; Cook, D.R. Effects of in-situ and reanalysis climate data on estimation of cropland gross primary production using the Vegetation Photosynthesis Model. Agric. For. Meteorol. 2015, 213, 240–250. [Google Scholar] [CrossRef] [Green Version]
  58. Papaioannou, G.; Papanikolaou, N.; Retalis, D.J.T.A. Relationships of photosynthetically active radiation and shortwave irradiance. Theor. Appl. Climatol. 1993, 48, 23–27. [Google Scholar] [CrossRef]
  59. Pinker, R.T.; Zhao, M.; Wang, H.; Wood, E.F. Impact of satellite based PAR on estimates of terrestrial net primary productivity. Int. J. Remote Sens. 2010, 31, 5221–5237. [Google Scholar] [CrossRef]
  60. Tsubo, M.; Walker, S. Relationships between photosynthetically active radiation and clearness index at Bloemfontein, South Africa. Theor. Appl. Climatol. 2005, 80, 17–25. [Google Scholar] [CrossRef]
  61. McCree, K.J. Test of current definitions of photosynthetically active radiation against leaf photosynthesis data. Agric. Meteorol. 1972, 10, 443–453. [Google Scholar] [CrossRef]
  62. Xiangming, X. Light absorption by leaf chlorophyll and maximum light use efficiency. IEEE Trans. Geosci. Remote Sens. 2006, 44, 1933–1935. [Google Scholar] [CrossRef]
  63. Meinzer, F.C.; Zhu, J. Nitrogen stress reduces the efficiency of the C-4 CO2 concentrating system, and therefore quantum yield, in Saccharum (sugarcane) species. J. Exp. Bot. 1998, 49, 1227–1234. [Google Scholar] [CrossRef]
  64. Raich, J.W.; Rastetter, E.B.; Melillo, J.M.; Kicklighter, D.W.; Steudler, P.A.; Peterson, B.J.; Grace, A.L.; Moore, B.; Vorosmarty, C.J. Potential net primary productivity in South-America-application of a global model. Ecol. Appl. 1991, 1, 399–429. [Google Scholar] [CrossRef] [Green Version]
  65. Chang, Q.; Xiao, X.; Wu, X.; Doughty, R.; Jiao, W.; Bajgain, R.; Qin, Y.; Wang, J.J.E.R.L. Estimating site-specific optimum air temperature and assessing its effect on the photosynthesis of grasslands in mid-to high-latitudes. Environ. Res. Lett. 2020, 15, 034064. [Google Scholar] [CrossRef]
  66. Doughty, R.; Xiao, X.; Wu, X.; Zhang, Y.; Bajgain, R.; Zhou, Y.; Qin, Y.; Zou, Z.; McCarthy, H.; Friedman, J. Responses of gross primary production of grasslands and croplands under drought, pluvial, and irrigation conditions during 2010–2016, Oklahoma, USA. Agric. Water Manag. 2018, 204, 47–59. [Google Scholar] [CrossRef]
  67. Zhou, Y.; Xiao, X.; Zhang, G.; Wagle, P.; Bajgain, R.; Dong, J.; Jin, C.; Basara, J.B.; Anderson, M.C.; Hain, C. Quantifying agricultural drought in tallgrass prairie region in the US Southern Great Plains through analysis of a water-related vegetation index from MODIS images. Agric. For. Meteorol. 2017, 246, 111–122. [Google Scholar] [CrossRef]
  68. Zhang, Y.; Xiao, X.M.; Zhou, S.; Ciais, P.; McCarthy, H.; Luo, Y.Q. Canopy and physiological controls of GPP during drought and heat wave. Geophys. Res. Lett. 2016, 43, 3325–3333. [Google Scholar] [CrossRef] [Green Version]
  69. Wagle, P.; Xiao, X.M.; Suyker, A.E. Estimation and analysis of gross primary production of soybean under various management practices and drought conditions. ISPRS J. Photogramm. Remote Sens. 2015, 99, 70–83. [Google Scholar] [CrossRef] [Green Version]
  70. Mulianga, B.; Bégué, A.; Clouvel, P.; Todoroff, P. Mapping cropping practices of a sugarcane-based cropping system in Kenya using remote sensing. Remote Sens. 2015, 7, 14428–14444. [Google Scholar] [CrossRef] [Green Version]
  71. Chen, C.; Li, D.; Gao, Z.Q.; Tang, J.W.; Guo, X.F.; Wang, L.L.; Wan, B.C. Seasonal and Interannual Variations of Carbon Exchange over a Rice-Wheat Rotation System on the North China Plain. Adv. Atmospheric Sci. 2015, 32, 1365–1380. [Google Scholar] [CrossRef]
  72. Xavier, A.C.; Rudorff, B.F.; Shimabukuro, Y.E.; Berka, L.M.S.; Moreira, M.A. Multi-temporal analysis of MODIS data to classify sugarcane crop. Int. J. Remote Sens. 2006, 27, 755–768. [Google Scholar] [CrossRef]
  73. Rudorff, B.F.T.; Adami, M.; De Aguiar, D.A.; Gusso, A.; Da Silva, W.F.; De Freitas, R.M. Temporal series of EVI/MODIS to identify land converted to sugarcane. In Proceedings of the IEEE International Geoscience and Remote Sensing Symposium, Cape Town, South Africa, 12–17 July 2009; pp. IV-252–IV-255. [Google Scholar]
  74. Rahman, M.R.; Islam, A.; Rahman, M.A.J.P.P. NDVI derived sugarcane area identification and crop condition assessment. Plan Plus 2004, 1, 1–12. [Google Scholar]
  75. Mulianga, B.; Bégué, A.; Simoes, M.; Todoroff, P. Forecasting regional sugarcane yield based on time integral and spatial aggregation of MODIS NDVI. Remote Sens. 2013, 5, 2184–2199. [Google Scholar] [CrossRef] [Green Version]
  76. Abdel-Rahman, E.; Ahmed, F. The application of remote sensing techniques to sugarcane (Saccharum spp. hybrid) production: A review of the literature. Int. J. Remote Sens. 2008, 29, 3753–3767. [Google Scholar] [CrossRef]
  77. Zhou, Z.; Huang, J.; Wang, J.; Zhang, K.; Kuang, Z.; Zhong, S.; Song, X. Object-oriented classification of sugarcane using time-series middle-resolution Remote Sensing data based on adaboost. PLoS ONE 2015, 10, e0142069. [Google Scholar] [CrossRef] [Green Version]
  78. White, P.M.; Viator, R.P.; Webber, C.L.; Eggleston, G. Potential losses of Soil nutrients and energy content on the complete removal of sugarcane leaf material as a biomass feedstock. Sugar Tech 2018, 20, 40–49. [Google Scholar] [CrossRef]
  79. Yan, H.; Fu, Y.L.; Xiao, X.; Huang, H.Q.; He, H.; Ediger, L. Modeling gross primary productivity for winter wheat-maize double cropping System using MODIS time series and CO2 eddy flux tower data. Agric. Ecosyst. Environ. 2009, 129, 391–400. [Google Scholar] [CrossRef]
  80. He, M.Z.; Zhou, Y.L.; Ju, W.M.; Chen, J.M.; Zhang, L.; Wang, S.Q.; Saigusa, N.; Hirata, R.; Murayama, S.; Liu, Y.B. Evaluation and improvement of MODIS gross primary productivity in typical forest ecosystems of East Asia based on eddy covariance measurements. J. For. Res. 2013, 18, 31–40. [Google Scholar] [CrossRef]
  81. Sims, D.; Rahman, A.; Cordova, V.; Elmasri, B.; Baldocchi, D.; Bolstad, P.; Flanagan, L.; Goldstein, A.; Hollinger, D.; Misson, L. A new model of gross primary productivity for North American ecosystems based solely on the enhanced vegetation index and land surface temperature from MODIS. Remote Sens. Environ. 2008, 112, 1633–1646. [Google Scholar] [CrossRef]
  82. Sjöström, M.; Zhao, M.; Archibald, S.; Arneth, A.; Cappelaere, B.; Falk, U.; de Grandcourt, A.; Hanan, N.; Kergoat, L.; Kutsch, W.; et al. Evaluation of MODIS gross primary productivity for Africa using eddy covariance data. Remote Sens. Environ. 2013, 131, 275–286. [Google Scholar] [CrossRef]
  83. Zhao, M.; Running, S.W.; Nemani, R.R. Sensitivity of Moderate Resolution Imaging Spectroradiometer (MODIS) terrestrial primary production to the accuracy of meteorological reanalyses. J. Geophys. Res. Biogeosci. 2006, 111. [Google Scholar] [CrossRef] [Green Version]
  84. Ehleringer, J.R.; Sage, R.F.; Flanagan, L.B.; Pearcy, R.W. Climate change and the evolution of C4 photosynthesis. Trends Ecol. Evol. 1991, 6, 95–99. [Google Scholar] [CrossRef]
  85. Xiao, J.F.; Davis, K.J.; Urban, N.M.; Keller, K.; Saliendra, N.Z. Upscaling carbon fluxes from towers to the regional scale: Influence of parameter variability and land cover representation on regional flux estimates. J. Geophys. Res. Biogeosci. 2011, 116, 15. [Google Scholar] [CrossRef] [Green Version]
  86. Sanchez, M.L.; Pardo, N.; Perez, I.A.; Garcia, M.A. GPP and maximum light use efficiency estimates using different approaches over a rotating biodiesel crop. Agric. For. Meteorol. 2015, 214, 444–455. [Google Scholar] [CrossRef] [Green Version]
  87. De Silva, A.; De Costa, W. Growth and radiation use efficiency of sugarcane under irrigated and rain-fed conditions in Sri Lanka. Sugar Tech 2012, 14, 247–254. [Google Scholar] [CrossRef]
  88. Robertson, M.; Wood, A.; Muchow, R. Growth of sugarcane under high input conditions in tropical Australia. I. Radiation use, biomass accumulation and partitioning. Field Crops Res. 1996, 48, 11–25. [Google Scholar] [CrossRef]
  89. Muchow, R.C.; Evensen, C.I.; Osgood, R.V.; Robertson, M.J. Yield accumulation in irrigated sugarcane: II. Utilization of intercepted radiation. Agron. J. 1997, 89, 646–652. [Google Scholar] [CrossRef]
  90. Schwerz, F.; Medeiros, S.L.P.; Elli, E.F.; Eloy, E.; Sgarbossa, J.; Caron, B.O. Plant growth, radiation use efficiency and yield of sugarcane cultivated in agroforestry systems: An alternative for threatened ecosystems. Anais da Academia Brasileira de Ciências 2018, 90, 3265–3283. [Google Scholar] [CrossRef] [Green Version]
Figure 1. The longitude and latitude position information of the two sugarcane eddy covariance (EC) flux tower sites (red dot) and surrounding landscapes with one respective 500 m Moderate Resolution Imaging Spectroradiometer (MODIS) pixel (red polygon). (a,c), the USR site, Brazil; (b,d), the Louisiana site, USA.
Remotesensing 12 02186 g001
Figure 2. The seasonal variation in the daily mean air temperature (oC), rainfall, and photosynthetically active radiation (PAR) at the two sugarcane EC tower sites (8-day interval). (a) Brazil site, 2005–2007; (b) Louisiana site, USA, 2017.
Remotesensing 12 02186 g002
Figure 3. The seasonal variation in vegetation indices (Normalized Difference Vegetation Index (NDVI), Enhanced Vegetation Index (EVI), and Land Surface Water Index (LSWI)) derived from the MODIS images and the measured NEEEC and the estimated GPPEC at the two sugarcane EC tower sites (8-day interval). (a,c), Brazil site, 2005–2007; (b,d), Louisiana site, USA, 2017.
Remotesensing 12 02186 g003
Figure 4. The connections between the estimated gross primary production(GPPEC)and two vegetation indices (NDVI, EVI) within the entire sugarcane growing season at the two sugarcane EC tower sites. (a,c), Brazil site, 2005–2007; (b,d), Louisiana, USA, 2017.
Remotesensing 12 02186 g004
Figure 5. The relationships between the estimated gross primary production (GPPEC), daily daytime mean air temperature, and daily mean air temperature within the sugarcane growing seasons at the two sugarcane EC tower sites. (a,c), Brazil site, 2005–2007; (b,d), Louisiana, USA site, 2017.
Remotesensing 12 02186 g005
Figure 6. The correlations between the vegetation indices (NDVI and EVI), daytime mean air temperature, daily mean air temperature, and daytime land surface temperature within the entire sugarcane growing seasons at the two sugarcane EC tower sites. (a,c), Brazil site, 2005–2007; (b,d), Louisiana, USA site, 2017.
Remotesensing 12 02186 g006
Figure 7. The seasonal variation in the estimated gross primary production (GPPEC) and predicted gross primary production (GPPVPM-Site) at the two sugarcane EC tower sites. (a,c), Brazil site, 2005–2007; (b,d), Louisiana, USA site, 2017.
Remotesensing 12 02186 g007
Figure 8. Interannual variation in simulated daily gross primary production (GPPVPM-NCEP) (g C m−2 day−1) from the Vegetation Photosynthesis Model (VPM) model with NCEP climate data at the two sugarcane EC tower sites during 2000–2018. (a) Brazil site; (b) Louisiana, USA site.
Remotesensing 12 02186 g008
Figure 9. Interannual variation in the annual mean air temperature (oC), annual precipitation (mm yr−1), annual PAR (mol m−2 yr−1), and annual GPP as predicted by the VPM model with the NCEP climate data (GPPVPM-NCEP, g C m−2 yr−1) during the plant growing season at two sugarcane plantation sites. (a) Brazil site; (b) Louisiana, USA site.
Remotesensing 12 02186 g009
Figure 10. A comparison of the seasonal variation in the estimated GPPEC and predicted GPPVPM-Site, GPPVPM-NCEP, GPPMOD17A2, and GPPVPM-Globe at the two sugarcane EC tower sites. (a,c), Brazil site, 2005−2007; (b,d), Louisiana, USA site, 2017.
Remotesensing 12 02186 g010
Table 1. A summary of the estimated gross primary production (GPPEC) and predicted GPPVPM-Site at the sugarcane EC tower sites in Brazil and USA during the growing season defined by GPPEC and LSWI, respectively. GPPEC represents the seasonal sum of the estimated GPP from the sugarcane EC flux tower sites; GPPVPM-Site represents the seasonal sum of the predicted GPP from the VPM model; a and b are the seasonal sum the GPPVPM-Site at the USA site when Topt = 25 °C and Topt = 28 °C, respectively. GPP%RE represents the relative error, calculated as [(GPPVPM-Site − GPPEC)/GPPEC] × 100.
SitesThe growing season
(GPPEC1 g cm−2day−1)
GPPEC (g cm−2 yr−1)GPPVPM-Site (g cm−2yr−1)GPP%RE
Brazil Site2005/5/25–2006/5/174035.603968.45−1.67
2006/9/30–2007/5/172841.622868.590.95
USA Site2017/2/10–2017/12/11 a2200.881979.47−10.06
2017/2/10–2017/12/11 b2200.881976.89−10.17
SitesThe growing season
(LSWI0)
GPPEC (g cm−2yr−1)GPPVPM-Site (g cm−2yr−1)GPP%RE
Brazil Site2005/6/18–2006/5/13873.653913.041.01
2006/9/30–2007/5/172656.272776.704.53
USA Site2017/5/17–2017/11/25 a1893.161699.05−10.25
2017/5/17–2017/11/25 b1893.161709.79−9.68

