Improving on MODIS MCD64A1 Burned Area Estimates in Grassland Systems: A Case Study in Kansas Flint Hills Tall Grass Prairie


Abstract
1. Introduction
2. Materials and Methods
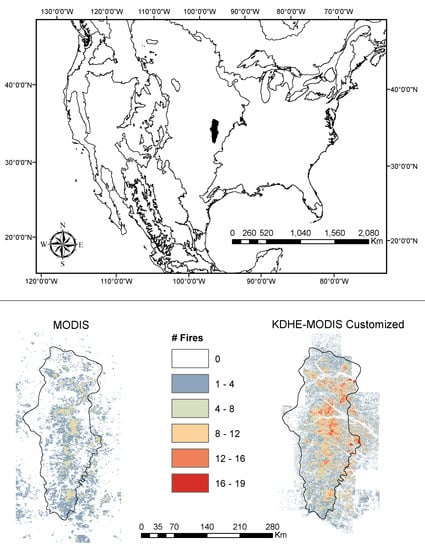
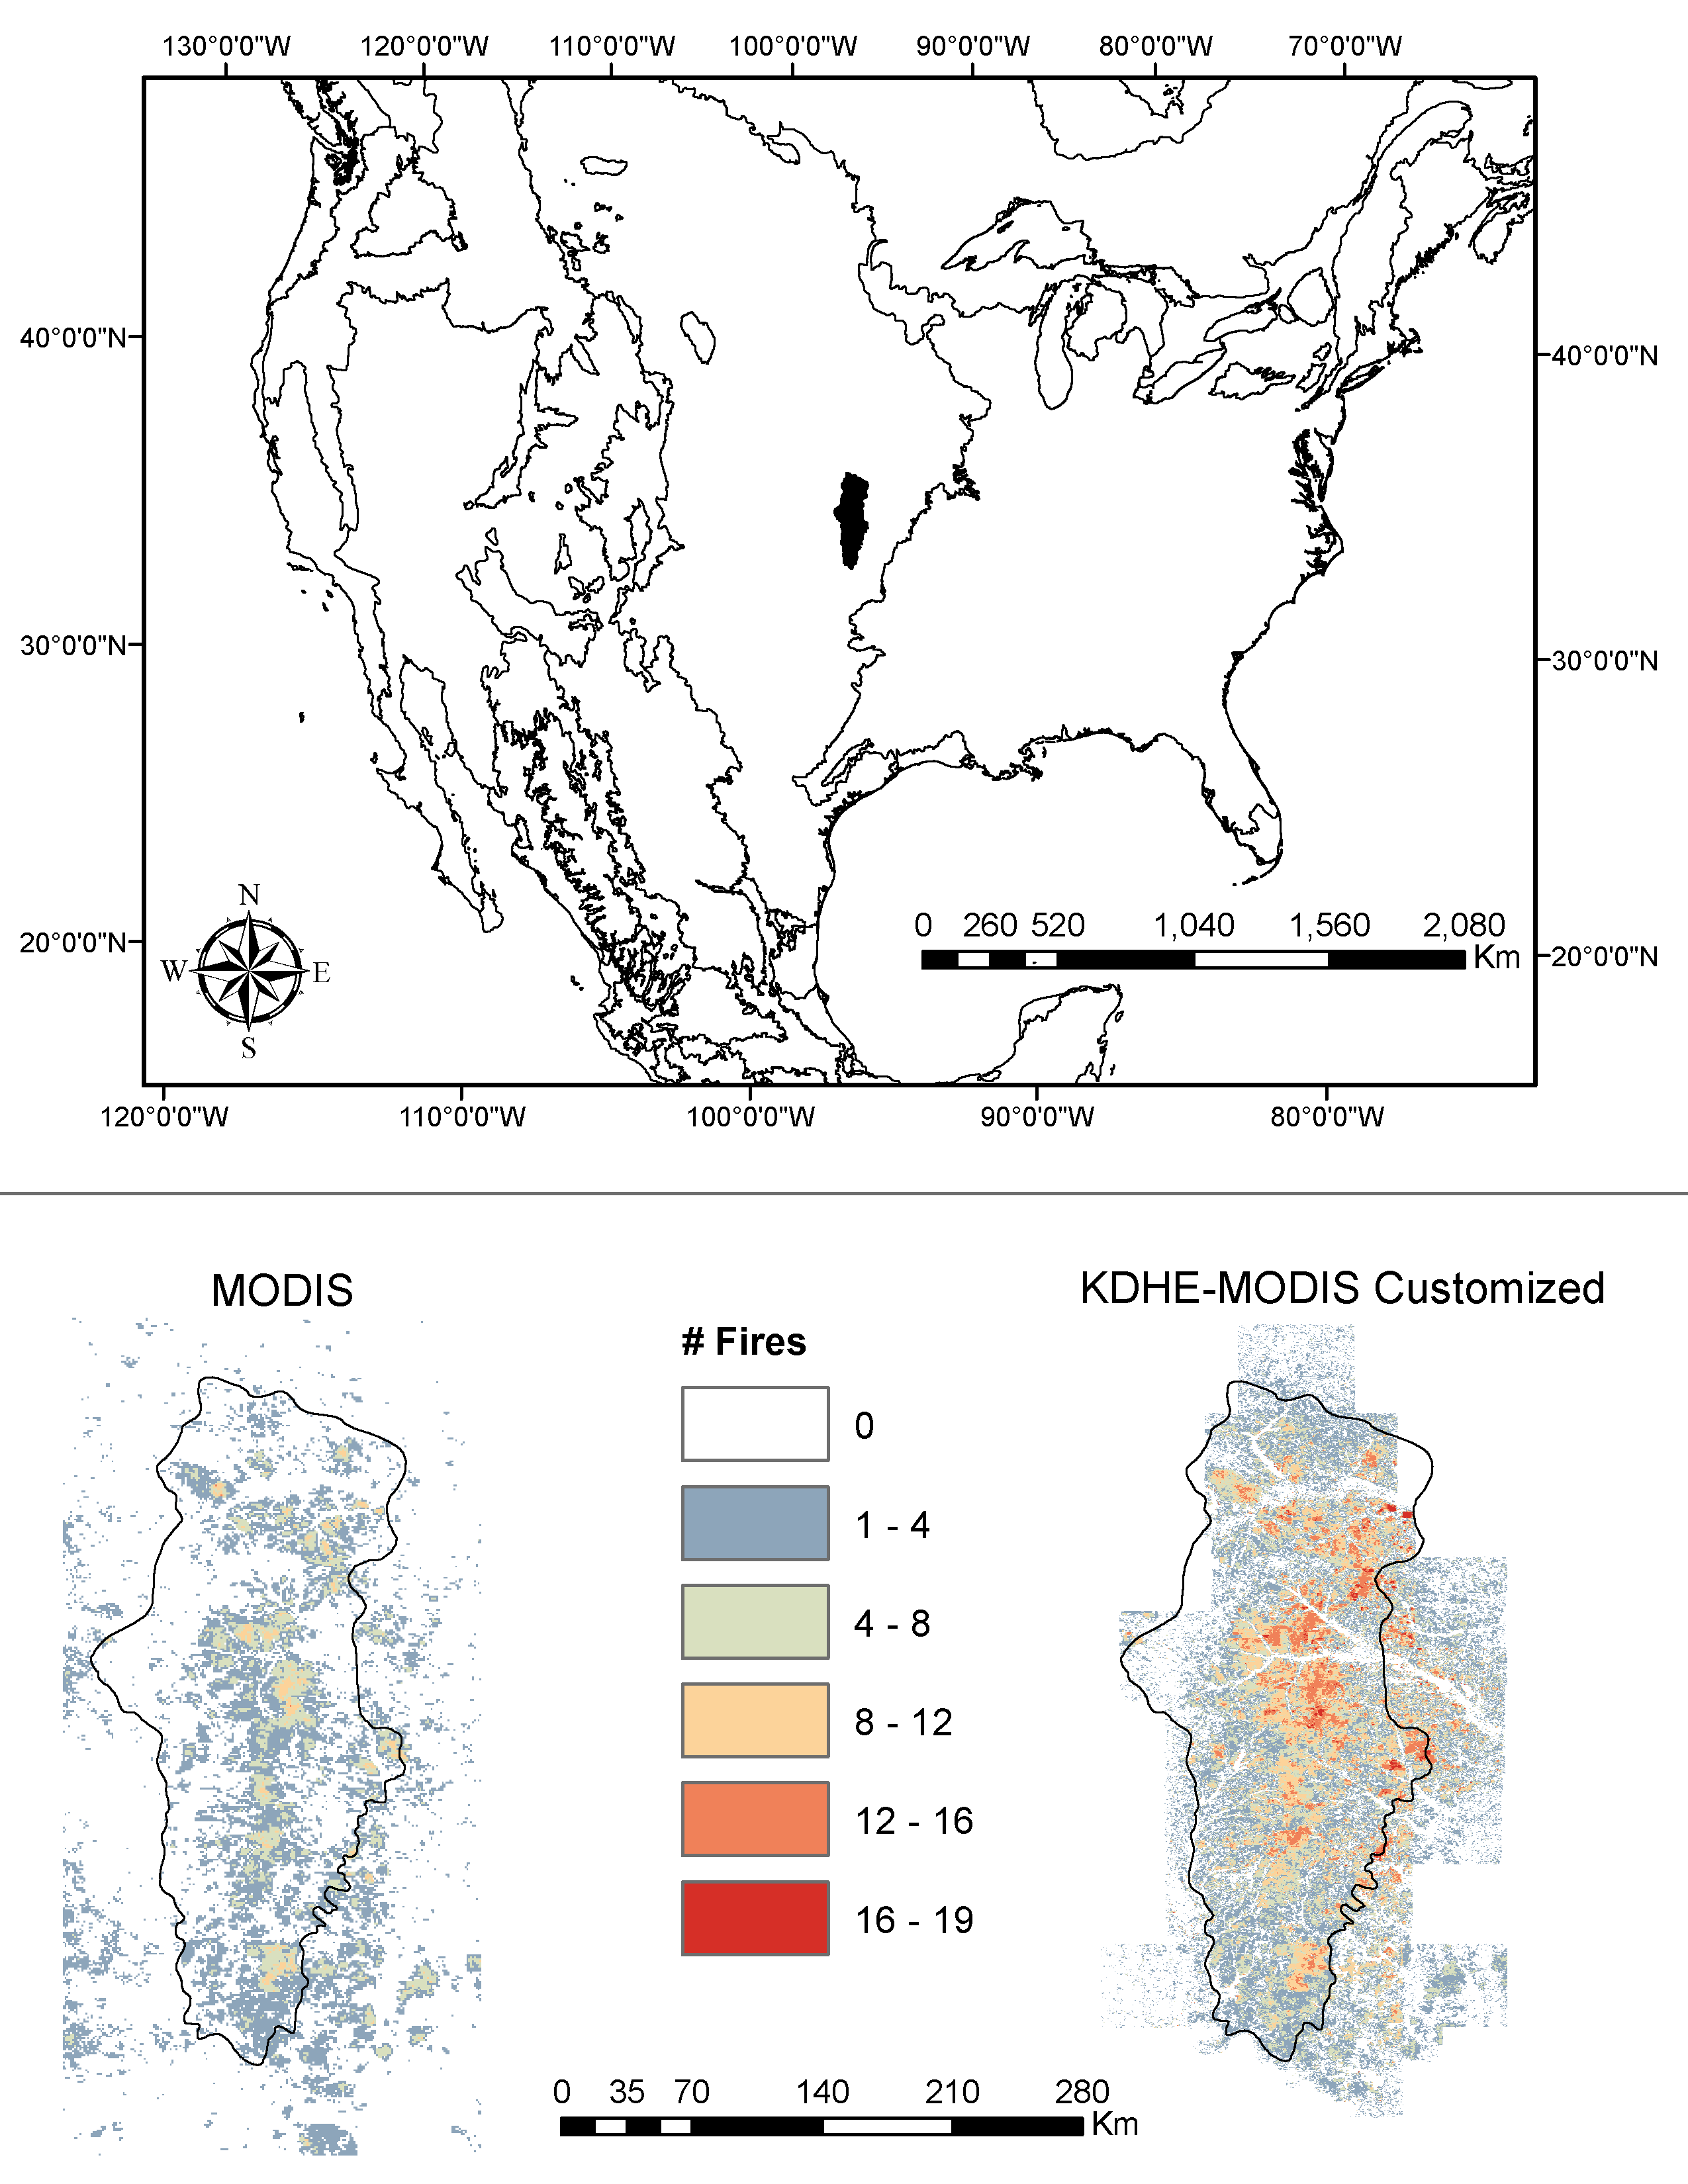
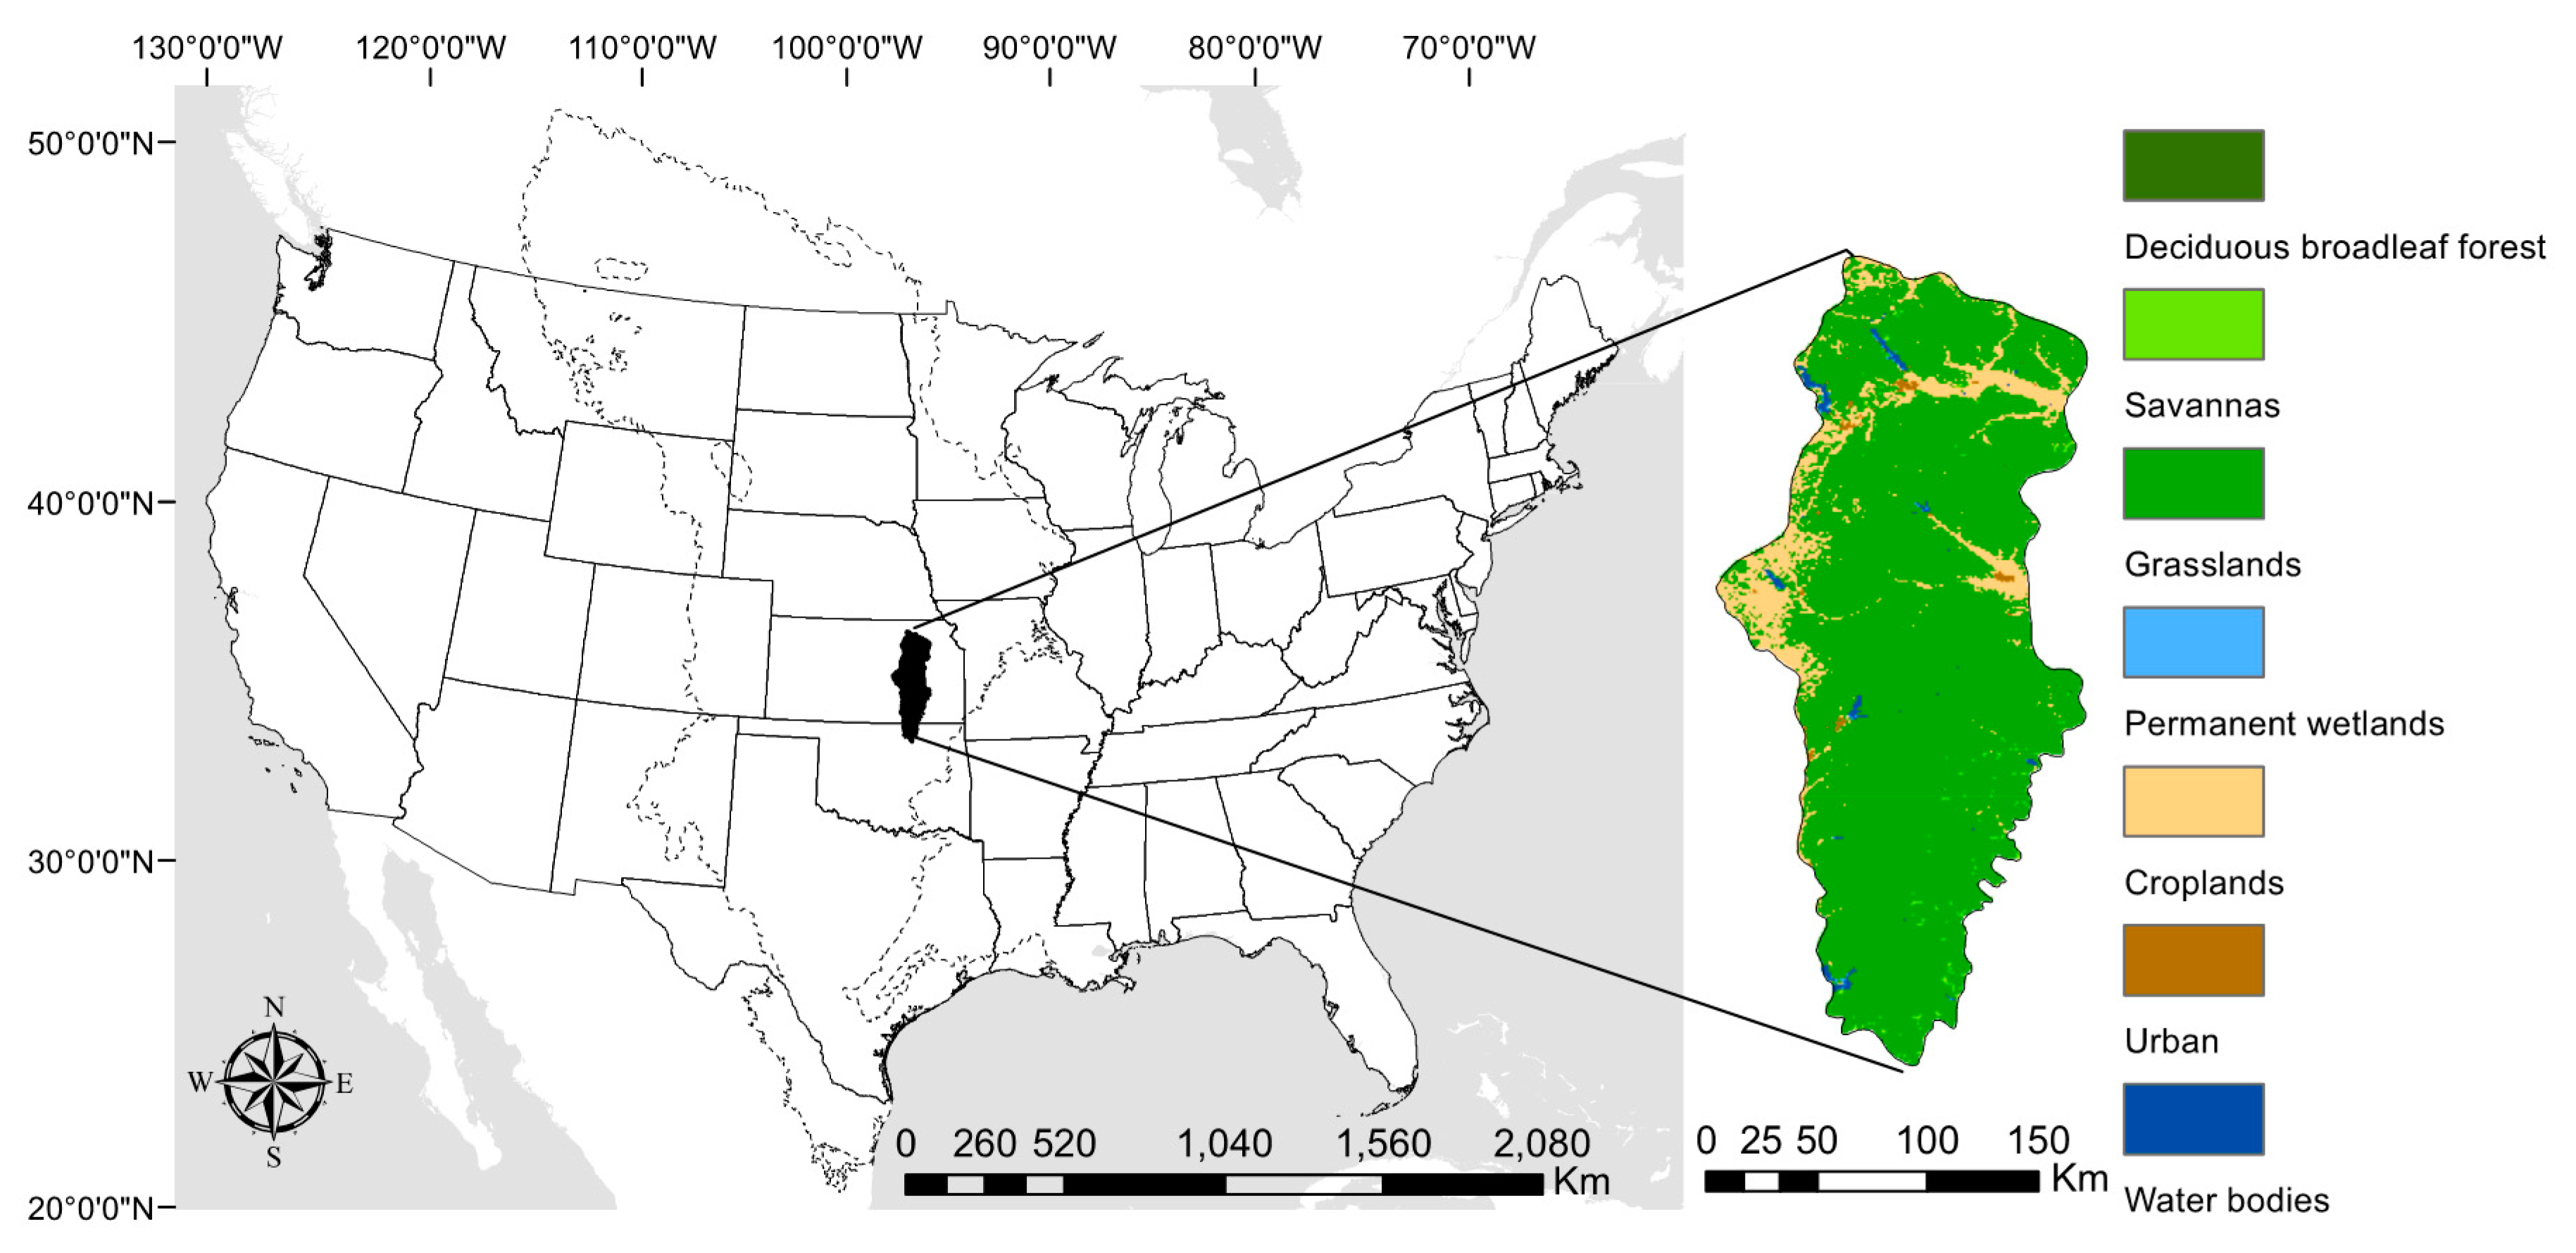
2.1. Study Area
2.2. Fire Data
2.3. Data Analysis
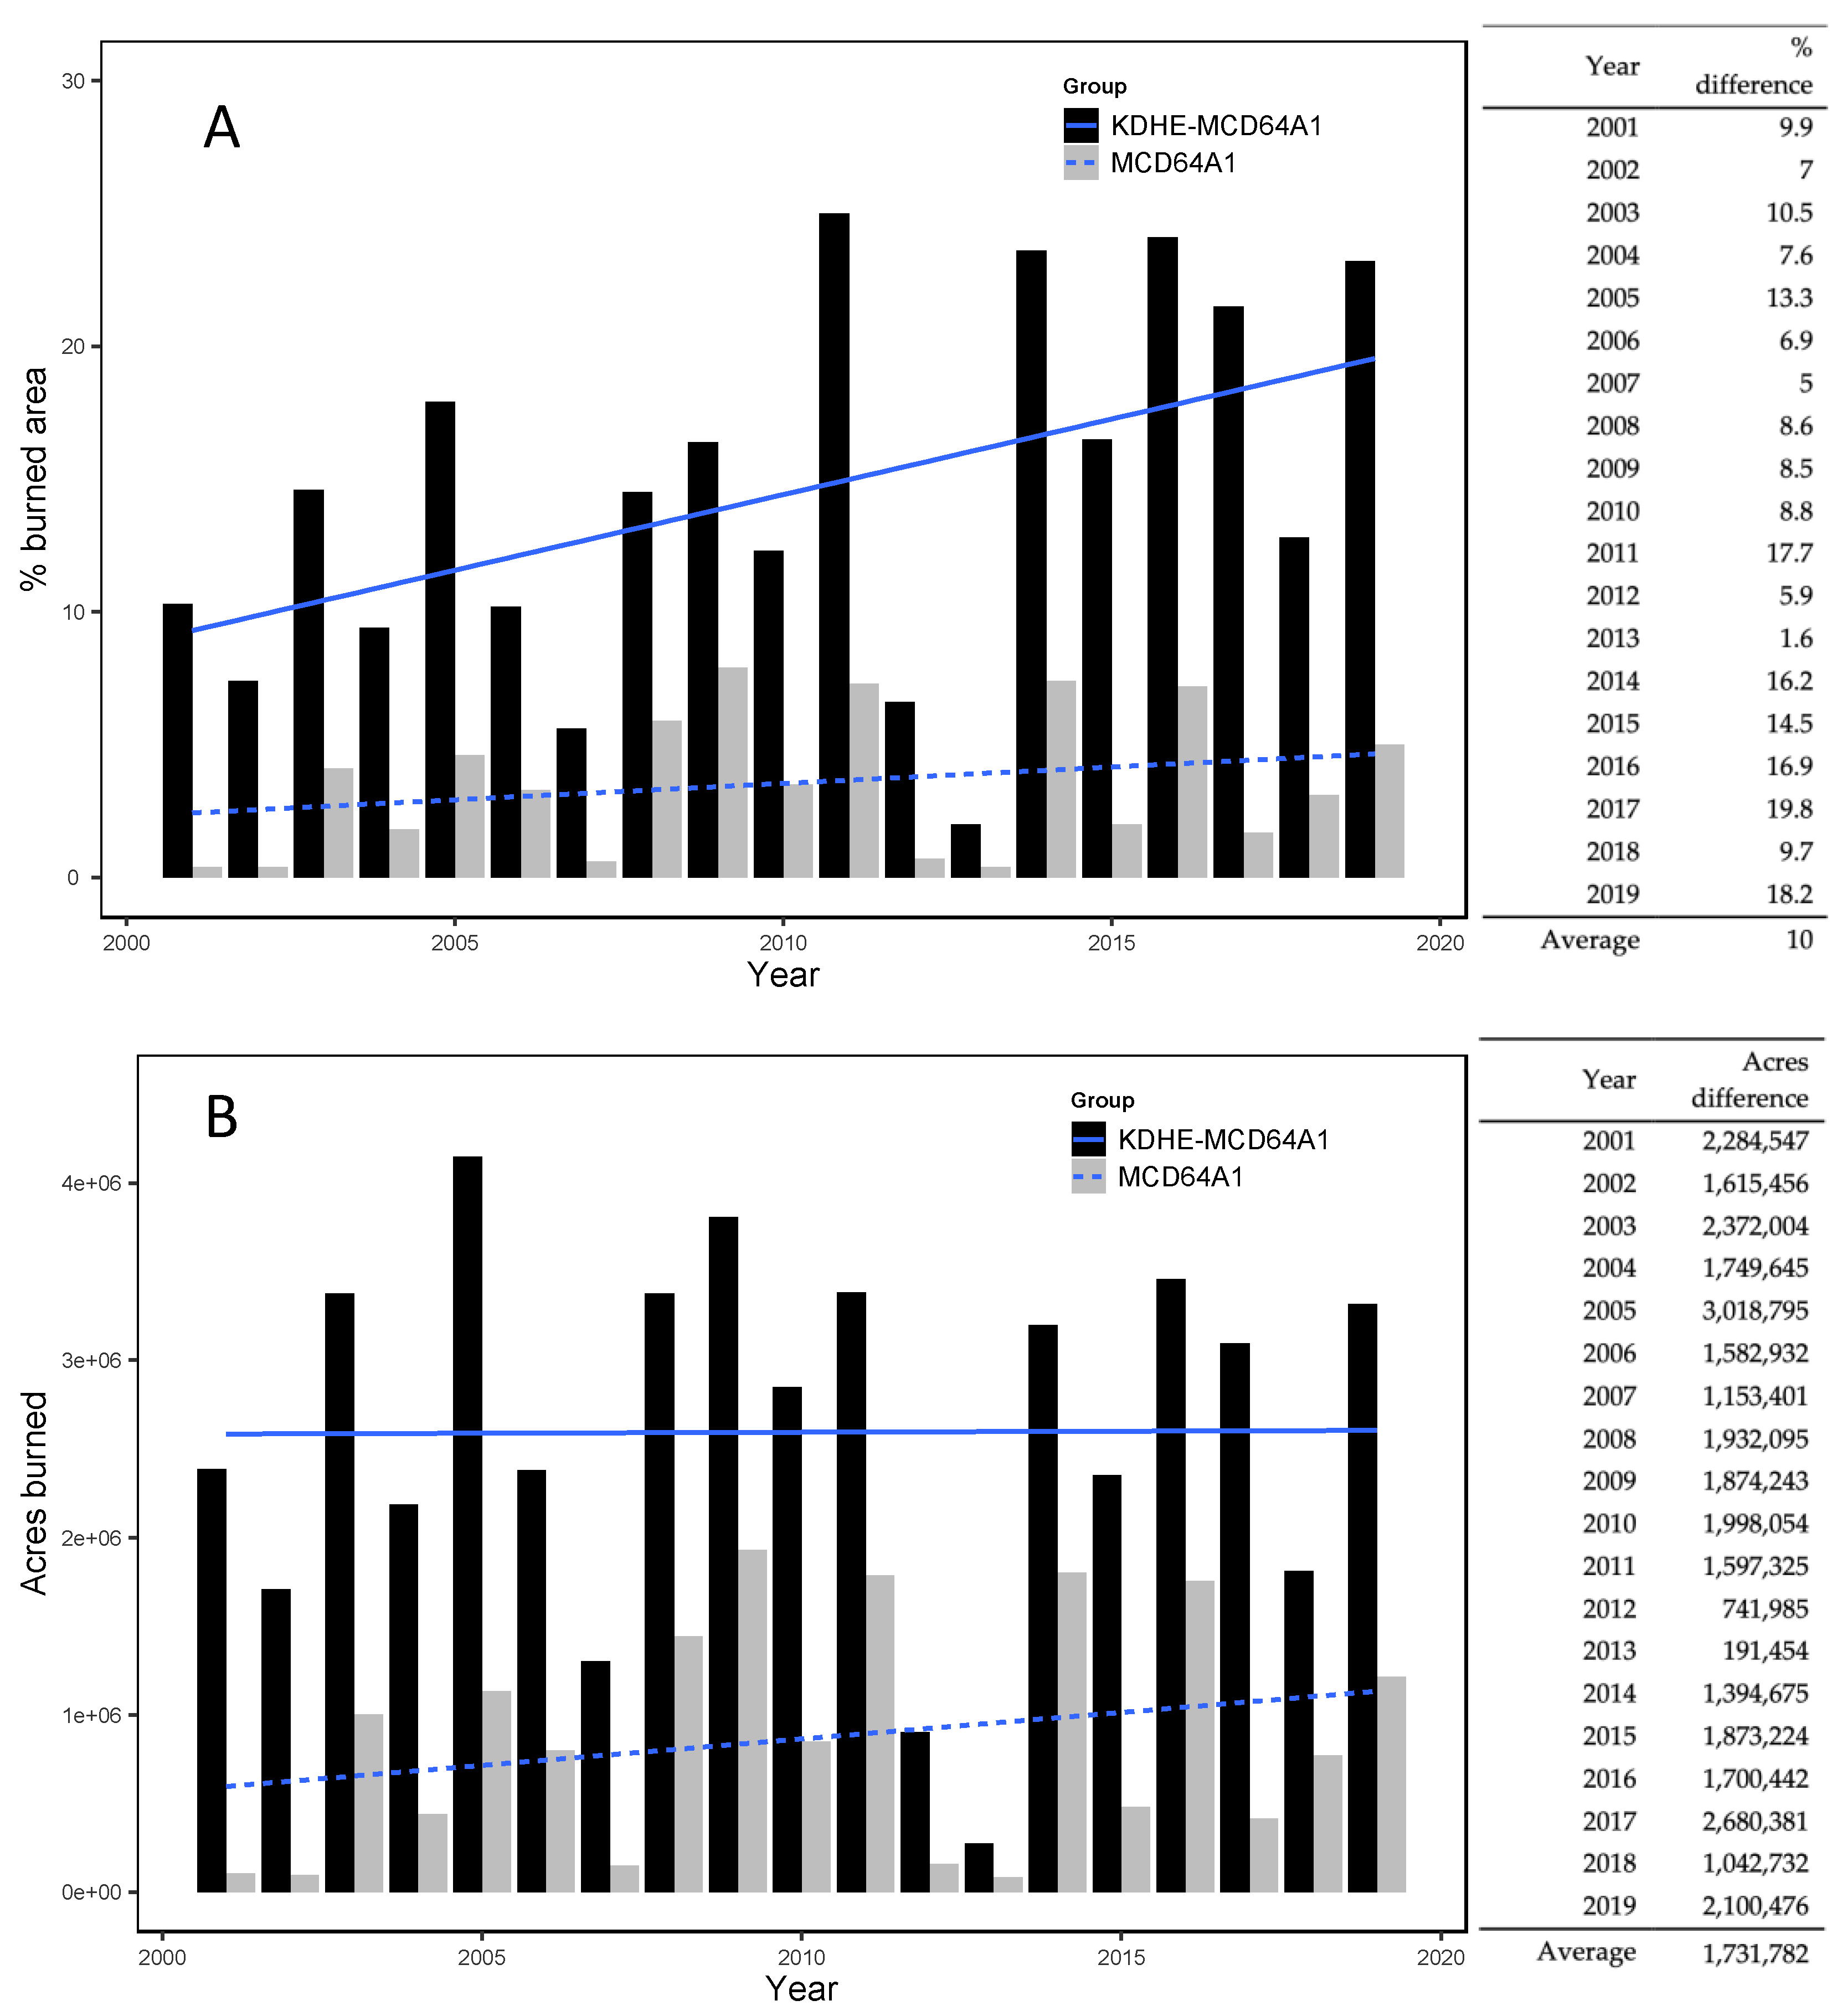
3. Results
4. Discussion
5. Conclusions
Author Contributions
Funding
Acknowledgments
Conflicts of Interest
References
- Hawbaker, T.J.; Vanderhoof, M.K.; Schmidt, G.L.; Beal, Y.-J.; Picotte, J.J.; Takacs, J.D.; Falgout, J.T.; Dwyer, J.L. The landsat burned area algorithm and products for the conterminous united states. Remote Sens. Environ. 2020, 244, 111801. [Google Scholar] [CrossRef]
- Xia, J.; Chen, J.; Piao, S.; Ciais, P.; Luo, Y.; Wan, S. Terrestrial carbon cycle affected by non-uniform climate warming. Nat. Geosci. 2014, 7, 173–180. [Google Scholar] [CrossRef]
- Akimoto, H. Global air quality and pollution. Science 2003, 302, 1716–1719. [Google Scholar] [CrossRef] [PubMed]
- Hollmann, R.; Merchant, C.J.; Saunders, R.; Downy, C.; Buchwitz, M.; Cazenave, A.; Chuvieco, E.; Defourny, P.; de Leeuw, G.; Forsberg, R.; et al. The esa climate change initiative: Satellite data records for essential climate variables. Bull. Am. Meteorol. Soc. 2013, 94, 1541–1552. [Google Scholar] [CrossRef]
- Yifang, B.; Gong, P.; Gini, C. Global land cover mapping using earth observation satellite data: Recent progresses and challenges. ISPRS J. Photogramm. Remote Sens. 2015, 103, 1–6. [Google Scholar]
- Fornacca, D.; Ren, G.; Xiao, W. Performance of three modis fire products (mcd45a1, mcd64a1, mcd14ml), and esa fire_cci in a mountainous area of northwest yunnan, china, characterized by frequent small fires. Remote Sens. 2017, 9, 1131. [Google Scholar] [CrossRef]
- Miller, J.R.; Turner, M.G.; Smithwick, E.A.H.; Dent, C.L.; Stanley, E.H. Spatial extrapolation: The science of predicting ecological patterns and processes. Bioscience 2004, 54, 310–320. [Google Scholar] [CrossRef]
- Justice, C.O.; Giglio, L.; Korontzi, S.; Owens, J.; Morisette, J.T.; Roy, D.; Descloitres, J.; Alleaume, S.; Petitcolin, F.; Kaufman, Y. The modis fire products. Remote Sens. Environ. 2002, 83, 244–262. [Google Scholar] [CrossRef]
- Roteta, E.; Bastarrika, A.; Padilla, M.; Storm, T.; Chuvieco, E. Development of a sentinel-2 burned area algorithm: Generation of a small fire database for sub-saharan africa. Remote Sens. Environ. 2019, 222, 1–17. [Google Scholar] [CrossRef]
- Hawbaker, T.J.; Radeloff, V.C.; Syphard, A.D.; Zhu, Z.; Stewart, S.I. Detection rates of the modis active fire product in the united states. Remote Sens. Environ. 2008, 112, 2656–2664. [Google Scholar] [CrossRef]
- Pausas, J.G.; Keeley, J.E. Abrupt climate-independent fire regime changes. Ecosystems 2014, 17, 1109–1120. [Google Scholar] [CrossRef]
- Bond, W.J.; Keeley, J.E. Fire as a global ’herbivore’: The ecology and evolution of flammable ecosystems. Trends Ecol. Evol. 2005, 20, 387–394. [Google Scholar] [CrossRef] [PubMed]
- Archibald, S. Managing the human component of fire regimes: Lessons from africa. Phil. Trans. R. Soc. B 2016, 371. [Google Scholar] [CrossRef] [PubMed]
- Nolan, R.H.; Boer, M.M.; Collins, L.; Resco de Dios, V.; Clarke, H.; Jenkins, M.; Kenny, B.; Bradstock, R.A. Causes and consequences of eastern australia’s 2019–20 season of mega-fires. Glob. Chang. Biol. 2020, 26, 1039–1041. [Google Scholar] [CrossRef] [PubMed]
- Bradstock, R.A.; Nolan, R.; Collins, L.; Resco de Dios, V.; Clarke, H.; Jenkins, M.E.; Kenny, B.; Boer, M.M. A broader perspective on the causes and consequences of eastern australia’s 2019–20 season of mega-fires: A response to adams et al. Glob. Chang. Biol. 2020, 26, e8–e9. [Google Scholar] [CrossRef] [PubMed]
- Adams, M.A.; Shadmanroodposhti, M.; Neumann, M. Causes and consequences of eastern australia’s 2019–20 season of mega-fires: A broader perspective. Glob. Chang. Biol. 2020, 3756–3758. [Google Scholar] [CrossRef] [PubMed]
- Maleki, K.; Lafleur, B.; Leduc, A.; Bergeron, Y. Modelling post-disturbance successional dynamics of the canadian boreal mixedwoods. Forests 2020, 11, 3. [Google Scholar] [CrossRef]
- Tsela, P.; Wessels, K.; Botai, J.; Archibald, S.; Swanepoel, D.; Steenkamp, K.; Frost, P. Validation of the two standard modis satellite burned-area products and an empirically-derived merged product in south africa. Remote Sens. 2014, 6, 1275–1293. [Google Scholar] [CrossRef]
- Boschetti, L.; Eva, H.; Brivio, P.A.; Grégoire, J.M. Lessons to be learned from the comparison of three satellite-derived biomass burning products. Geophys. Res. Lett. 2004, 31, 1–4. [Google Scholar] [CrossRef]
- Giglio, L.; Loboda, T.; Roy, D.P.; Quayle, B.; Justice, C.O. An active-fire based burned area mapping algorithm for the modis sensor. Remote Sens. Environ. 2009, 113, 408–420. [Google Scholar] [CrossRef]
- Fernandes, P.M.; Botelho, H.S. A review of prescribed burning effectiveness in fire hazard reduction. Int. J. Wildland Fire 2003, 12, 117–128. [Google Scholar] [CrossRef]
- KDHE. Available online: https://www.Kdheks.Gov/bar/air-monitor/flinthills.html (accessed on 30 June 2020).
- Giglio, L.; Boschetti, L.; Roy, D.P.; Humber, M.L.; Justice, C.O. The collection 6 modis burned area mapping algorithm and product. Remote Sens. Environ. 2018, 217, 72–85. [Google Scholar] [CrossRef] [PubMed]
- Baker, K.R.; Koplitz, S.N.; Foley, K.M.; Avey, L.; Hawkins, A. Characterizing grassland fire activity in the flint hills region and air quality using satellite and routine surface monitor data. Sci. Total Environ. 2019, 659, 1555–1566. [Google Scholar] [CrossRef] [PubMed]
- Ratajczak, Z.; Nippert, J.B.; Briggs, J.M.; Blair, J.M. Fire dynamics distinguish grasslands, shrublands and woodlands as alternative attractors in the central great plains of north america. J. Ecol. 2014, 102, 1374–1385. [Google Scholar] [CrossRef]
- Mohler, R.; Goodin, D. Mapping burned areas in the flint hills of kansas and oklahoma, 2000–2010. Great Plains Res. 2012, 22, 15–25. [Google Scholar]
- Briggs, J.M.; Gibson, D.J. Effect of fire on tree spatial patterns in a tallgrass prairie landscape. Bull. Torrey Bot. Club 1992, 119, 300–307. [Google Scholar] [CrossRef]
- Twidwell, D.; Bielski, C.H.; Scholtz, R.; Fuhlendorf, S.D. Advancing fire ecology in 21st century rangelands. Rangeland Ecol. Manage. in press. [CrossRef]
- Briggs, J.M.; Knapp, A.K.; Blair, J.M.; Heisler, J.L.; Hoch, G.A.; Lett, M.S.; McCarron, J.K. An ecosystem in transition: Causes and consequences of the conversion of mesic grassland to shrubland. Bioscience 2005, 55, 243–254. [Google Scholar] [CrossRef]
- Leis, S.A.; Blocksome, C.E.; Twidwell, D.; Fuhlendorf, S.D.; Briggs, J.M.; Sanders, L.D. Juniper invasions in grasslands: Research needs and intervention strategies. Rangelands 2017, 39, 64–72. [Google Scholar] [CrossRef]
- Fick, S.E.; Hijmans, R.J. Worldclim 2: New 1-km spatial resolution climate surfaces for global land areas. Int. J. Climatol. 2017, 37, 4302–4315. [Google Scholar] [CrossRef]
- Scholtz, R.; Fuhlendorf, S.D.; Archer, S.R. Climate–fire interactions constrain potential woody plant cover and stature in north american great plains grasslands. Global Ecol. Biogeogr. 2018, 27, 936–945. [Google Scholar] [CrossRef]
- Omernik, J.M. Level 3 Ecoregions of the Continental United States; Corvallis Environmental Research Laboratory, US Environmental Protection Agency: Corvallis, OR, USA, 1995.
- Gorelick, N.; Hancher, M.; Dixon, M.; Ilyushchenko, S.; Thau, D.; Moore, R. Google earth engine: Planetary-scale geospatial analysis for everyone. Remote Sens. Environ. 2017, 202, 18–27. [Google Scholar] [CrossRef]
- R Development Core Team. R: A Language and Environment for Statistical Computing, 3.2.2; R Foundation for Statistical Computing: Vienna, Austria, 2017. [Google Scholar]
- Hijmans, R.J.; van Etten, J.J. Raster: Geographic data analysis and modeling. R Package Version 2015, 2, 3–40. [Google Scholar]
- Pontius, R., Jr.; Santacruz, A. Differ: Metrics of difference for comparing pairs of maps or pairs of variables. R Package Version 0.0-6. Available online: https://rdrr.io/cran/diffeR/ (accessed on 30 June 2020).
- Rollins, M.G. Landfire: A nationally consistent vegetation, wildland fire, and fuel assessment. Int. J. Wildland Fire 2009, 18, 235–249. [Google Scholar] [CrossRef]
- Knapp, E.E.; Estes, B.L.; Skinner, C.N. Ecological Effects of Prescribed Fire Season: A Literature Review and Synthesis for Managers; PSW-GTR-224; United States Department of Agriculture Forest Service, Pacific Southwest Research Station: Albany, CA, USA, 2009.
- Giglio, L.; Schroeder, W.; Hall, J.V.; Justice, C.O. Modis collection 6 active fire product user’s guide revision A; University of Maryland: College Park, MD, USA, 18 March 2015. [Google Scholar]
- Jones, M.O.; Allred, B.W.; Naugle, D.E.; Maestas, J.D.; Donnelly, P.; Metz, L.J.; Karl, J.; Smith, R.; Bestelmeyer, B.; Boyd, C.; et al. Innovation in rangeland monitoring: Annual, 30 m, plant functional type percent cover maps for u.S. Rangelands, 1984–2017. Ecosphere 2018, 9, e02430. [Google Scholar] [CrossRef]
- Andela, N.; Morton, D.; Giglio, L.; Chen, Y.; van der Werf, G.; Kasibhatla, P.; DeFries, R.; Collatz, G.; Hantson, S.; Kloster, S. A human-driven decline in global burned area. Science 2017, 356, 1356–1362. [Google Scholar] [CrossRef]
- Pettorelli, N.; Safi, K.; Turner, W. Satellite remote sensing, biodiversity research and conservation of the future. Philos. Trans. R. Soc. B Biol. Sci. 2014, 369. [Google Scholar] [CrossRef]
- Luque, S.; Pettorelli, N.; Vihervaara, P.; Wegmann, M. Improving biodiversity monitoring using satellite remote sensing to provide solutions towards the 2020 conservation targets. Methods Ecol. Evol. 2018, 9, 1784–1786. [Google Scholar] [CrossRef]


© 2020 by the authors. Licensee MDPI, Basel, Switzerland. This article is an open access article distributed under the terms and conditions of the Creative Commons Attribution (CC BY) license (http://creativecommons.org/licenses/by/4.0/).
Share and Cite
Scholtz, R.; Prentice, J.; Tang, Y.; Twidwell, D. Improving on MODIS MCD64A1 Burned Area Estimates in Grassland Systems: A Case Study in Kansas Flint Hills Tall Grass Prairie. Remote Sens. 2020, 12, 2168. https://doi.org/10.3390/rs12132168
Scholtz R, Prentice J, Tang Y, Twidwell D. Improving on MODIS MCD64A1 Burned Area Estimates in Grassland Systems: A Case Study in Kansas Flint Hills Tall Grass Prairie. Remote Sensing. 2020; 12(13):2168. https://doi.org/10.3390/rs12132168
Chicago/Turabian StyleScholtz, Rheinhardt, Jayson Prentice, Yao Tang, and Dirac Twidwell. 2020. "Improving on MODIS MCD64A1 Burned Area Estimates in Grassland Systems: A Case Study in Kansas Flint Hills Tall Grass Prairie" Remote Sensing 12, no. 13: 2168. https://doi.org/10.3390/rs12132168
APA StyleScholtz, R., Prentice, J., Tang, Y., & Twidwell, D. (2020). Improving on MODIS MCD64A1 Burned Area Estimates in Grassland Systems: A Case Study in Kansas Flint Hills Tall Grass Prairie. Remote Sensing, 12(13), 2168. https://doi.org/10.3390/rs12132168