Article

An Adaptive and Extensible System for Satellite-Based, Large Scale Burnt Area Monitoring in Near-Real Time

German Aerospace Center (DLR), German Remote Sensing Data Center (DFD), Münchener Str. 20, 82234 Oberpfaffenhofen, Germany
*
Author to whom correspondence should be addressed.
Remote Sens. 2020, 12(13), 2162; https://doi.org/10.3390/rs12132162
Submission received: 1 June 2020 / Revised: 26 June 2020 / Accepted: 30 June 2020 / Published: 6 July 2020

Abstract

:
In the case of ongoing wildfire events, timely information on current fire parameters is crucial for informed decision making. Satellite imagery can provide valuable information in this regard, since thermal sensors can detect the exact location and intensity of an active fire at the moment the satellite passes over. This information can be derived and distributed in near-real time, allowing for a picture of current fire activity. However, the derivation of the size and shape of an already affected area is more complex and therefore most often not available within a short time frame. For urgent decision making though, it would be desirable to have this information available in near-real time, and on a large scale. The approach presented here works fully automatic and provides perimeters of burnt areas within two hours after the satellite scene acquisition. It uses the red and near-infrared bands of mid-resolution imagery to facilitate continental-scale monitoring of recently occurred burnt areas. To allow for a high detection capacity independent of the affected vegetation type, segmentation thresholds are derived dynamically from contextual information. This is done by using a Morphological Active Contour approach for perimeter determination. The results are validated against semi-automatically derived burnt areas for five wildfire incidents in Europe. Furthermore, these results are compared with three widely used burnt area datasets on a country-wide scale. It is shown that a high detection quality can be reached in near real-time. The large-scale inter-comparison shows that the results coincide with 63% to 76% of the burnt area in the reference datasets. While these established datasets are only available with a time lag of several months or are created by using manual interaction, the presented approach produces results in near-real time fully automatically. This work is therefore supposed to represent a valuable improvement in wildfire related rapid damage assessment.

Graphical Abstract

1. Introduction

Forest fire is a natural phenomenon that has always played a significant role in the evolution of ecosystems, influencing ecological patterns and processes on a global scale. This includes vegetation distribution and structure, as well as the carbon cycle [1]. In both boreal and temperate forests as well as in tropical biota, it represents a major influencing factor [2,3,4]. Within fire prone ecosystems. The vegetation communities adapt well to fire incidences. This results in ecologically beneficial effects, such as increased species heterogeneity [5]. Yet, at the same time, wildfires are regarded to be one of the most devastating natural hazards globally. They pose a threat to human lives and property, and can lead to the irreversible destruction of ecosystems. Wildfires have also been found to contribute to the greenhouse effect through CO2 emissions, thus fostering climate change [6,7]. Historically developed fire regimes are expected to change in the future, which further increases the requirement for fire management worldwide [1].
Timely and accurate information on ongoing wildfire activity is a crucial requirement for effective decision making regarding firefighting counter measures. From a remote sensing perspective, the usage of near-real time thermal anomaly data poses the most valuable foundation for the assessment of current fire activity. In combination with fire spread modeling tools and fire danger rating methodologies, fire fighters can gain important insight into the current extent and possible spatial development of a specific fire [8]. Subsequent to this course of action, which happens while the fire poses an imminent threat, the derivation of the exact perimeter of the affected area usually happens after the fire has ceased. Information on the spatial extent of actually affected areas represent an important input parameter for statistically based mid-term and long-term decision making, regarding environmental and mitigation policies. Satellite imagery represents a highly useful source for wildfire monitoring, due to its capabilities regarding spatial and temporal coverage. The derivation of burnt areas from satellite imagery has been a field of ongoing research for decades. Common approaches make use of the circumstance that losses in vegetation cause a decrease in near-infrared (NIR) reflectance values. In addition, the subsequent dryness can be received in the short-wave infrared (SWIR) wavelength. Contemporary analysis methods can be categorized as being either rule-based, using spectral information in combination with specific thresholds, or approaches based on machine learning [9].
Global datasets on burnt area perimeters derived from remote sensing data are provided by National Aeronautics and Space Administration (NASA) and European Space Agency (ESA) to support ecological planning and to foster fire related research [10,11,12,13]. These datasets, however, are only available with a considerable time lag of several months, since data from an extensive time period after the fire occurrence are used for the generation of the product. This time range is required to facilitate analyses concerning various effects related to fire, next to the estimation of the perimeter.
The derivation of burnt areas over large study regions has been found to be a difficult task, due to variations in the state of the surface and the ones introduced by the sensor [14]. Phenomena such as clouds and cloud shadows prohibit the derivation of meaningful surface features at reflective wavelengths [15]. For the derivation of burnt areas, shadowing can even lead to false detections, since shadows and burnt areas are difficult to differentiate in the optical domain. This difficulty is due to the fact that both kinds of phenomena are highly variable regarding size, shape and resulting spectral response of the ground surface. A valid means to discriminate both phenomena, however, is to make use of the differing temporal dynamics: while burnt areas are persistent for some time until the vegetation regrows, atmospherically induced effects such as shadow casting by dense clouds or shadowing by thin cirrus clouds change considerably with time. A reliable way of extracting burnt areas with rather little risk for false detections is therefore to monitor an area of interest over a period of time. An extended time series of several weeks to months was proposed to derive burnt areas from Moderate-resolution Imaging Spectroradiometer (MODIS) data [16]. Pixels appearing to represent burnt areas can thereby be checked in subsequent scenes. They can be removed from the output in case their spectral signature indicates live vegetation again in subsequent scenes, thus signalizing that the detection was in fact the effect of shadowing. In addition, imagery with missing information due to cloud coverage can be completed with data from other points in time. The resulting product features a high completeness with low false detection rates.
Available burnt area datasets, such as NASA MCD64A1 and the ESA Fire_cci 5.1 global Burnt Area (BA) product, use extensive time series analysis in order to derive burnt area perimeters [10,11,12,13]. For long term statistical analysis, this inherent time lag between data acquisition and a readily available product is often tolerable. However, for providing means for rapid damage assessment, burnt area information is required to be available within a short period of time, ideally while the fire is still burning. The aforementioned thermal anomaly data are usually available in near-real time, but come with features that are disadvantageous for some use cases. Firstly, the detections only represent a snapshot in time, depicting the situation on the Earth’s surface in the moment of the satellite overpass. If the fire is covered by clouds or by smoke, or if no satellite is covering the desired region at a specific point in time, the fire is missed. Secondly, it is error-prone to deduce the affected area size from an active fire pixel, since such a pixel only indicates that a fire occurred somewhere inside the covered area, and not that the whole area of the pixel has been affected. Thirdly, the rate of false detections in active fire data is usually high, since thermal anomalies can also be caused by industrial facilities or water sun glint. Still, it could be shown that active fire data can serve as a helpful approximation for burnt area derivation [17]. The authors found, however, that the rate of missed burnt areas is high at least for specific biomes, such as the high-tree-cover sub-region of southern Africa.
Burnt area perimeter information, featuring a much faster distribution cycle than the burnt area datasets mentioned above, is provided by Joint Research Center of the European Commission (JRC) through the European Forest Fire Information System (EFFIS) project [18]. This dataset features burnt area perimeters of fires which have occurred over the past days, or even on the current day. However, these data are not generated fully automatically, and require human interaction. Burnt area products are therefore only generated during working hours. Therefore, the data are not updated during the night or on the weekends. Additionally, the data are only available for Europe, Northern Africa and the Middle East.
A comprehensive burnt area dataset in near-real time has so far not been available. Yet, there is a demand for timely information supporting rapid damage assessment in the case of ongoing wildfires. To address this issue, a fully automated processing chain has been developed, implemented and tested at German Aerospace Center (DLR). It allows for automatic monitoring of continent-scale regions regarding fire activity and produces accurate burnt area perimeters in near-real time, within two hours after the sensor data becomes available. While factors such as cloud coverage, the existence of smoke plumes, etc. negatively influence the data quality, the goal is to provide spatial burnt area information as accurate as possible while the fire is still ongoing or quickly after the fire has ceased. The methodology was designed to be applicable globally in varying ecosystems. It has minimal requirements regarding input data, in order to be utilizable with a variety of satellite sensors. The processing chain is in operational use at DLR, utilizing AQUA/TERRA MODIS and Sentinel-3A/B Ocean and Land Color Instrument (OLCI) data to monitor the area of Europe, Northern Africa and the Middle East twice a day.
The presented method exploits, at its core, the synergetic effects of data from the red/NIR and the thermal wavelength in order to derive burnt area information. Substantial work in this regard has been performed by [19,20] for the boreal forest of Canada. Later on, this methodology was used by [21,22] to analyze fires in California/USA. The study presented in this paper uses a related approach, but focusses on near-real time application and proposes a derivation of contextual thresholds using Morphological Active Contours.
Due to the increased timeliness of the generated data, this development represents a valuable support for rapid damage estimation of ongoing forest fires. Yet, this work is not intended to replace existing, established datasets, but to fill the gap regarding the up-to-dateness of available burnt area data.
In order to investigate the performance of the developed algorithm in different climatic and geographical regions with different vegetation types, the results are validated using semi-automatically derived burnt area perimeters for different European study regions, prepared by the Copernicus Emergency Mapping Service (EMS). Furthermore, an inter-comparison has been performed with three established large-scale burnt area products, produced by NASA, ESA and JRC.

2. Materials and Methods

In this chapter, the developed methodology for burnt area derivation is described in detail. It is also shown how the processing chain based on this methodology is currently operated at DLR. The chapter concludes with an explanation of terms and methods for evaluating the quality of the generated products.

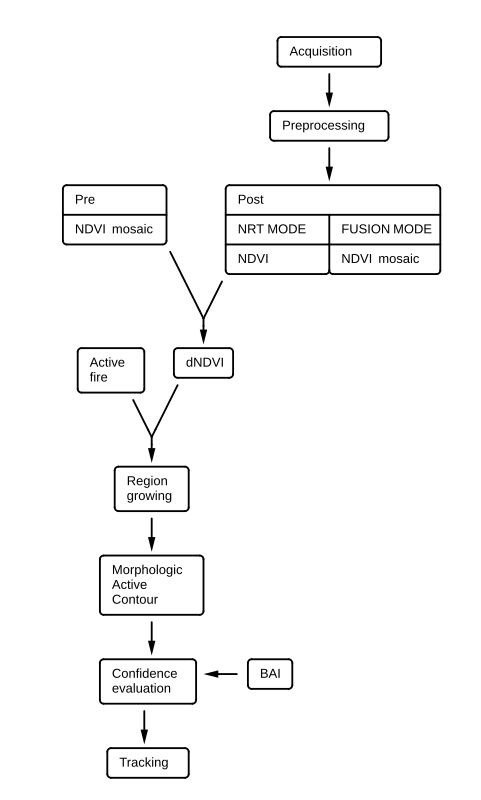
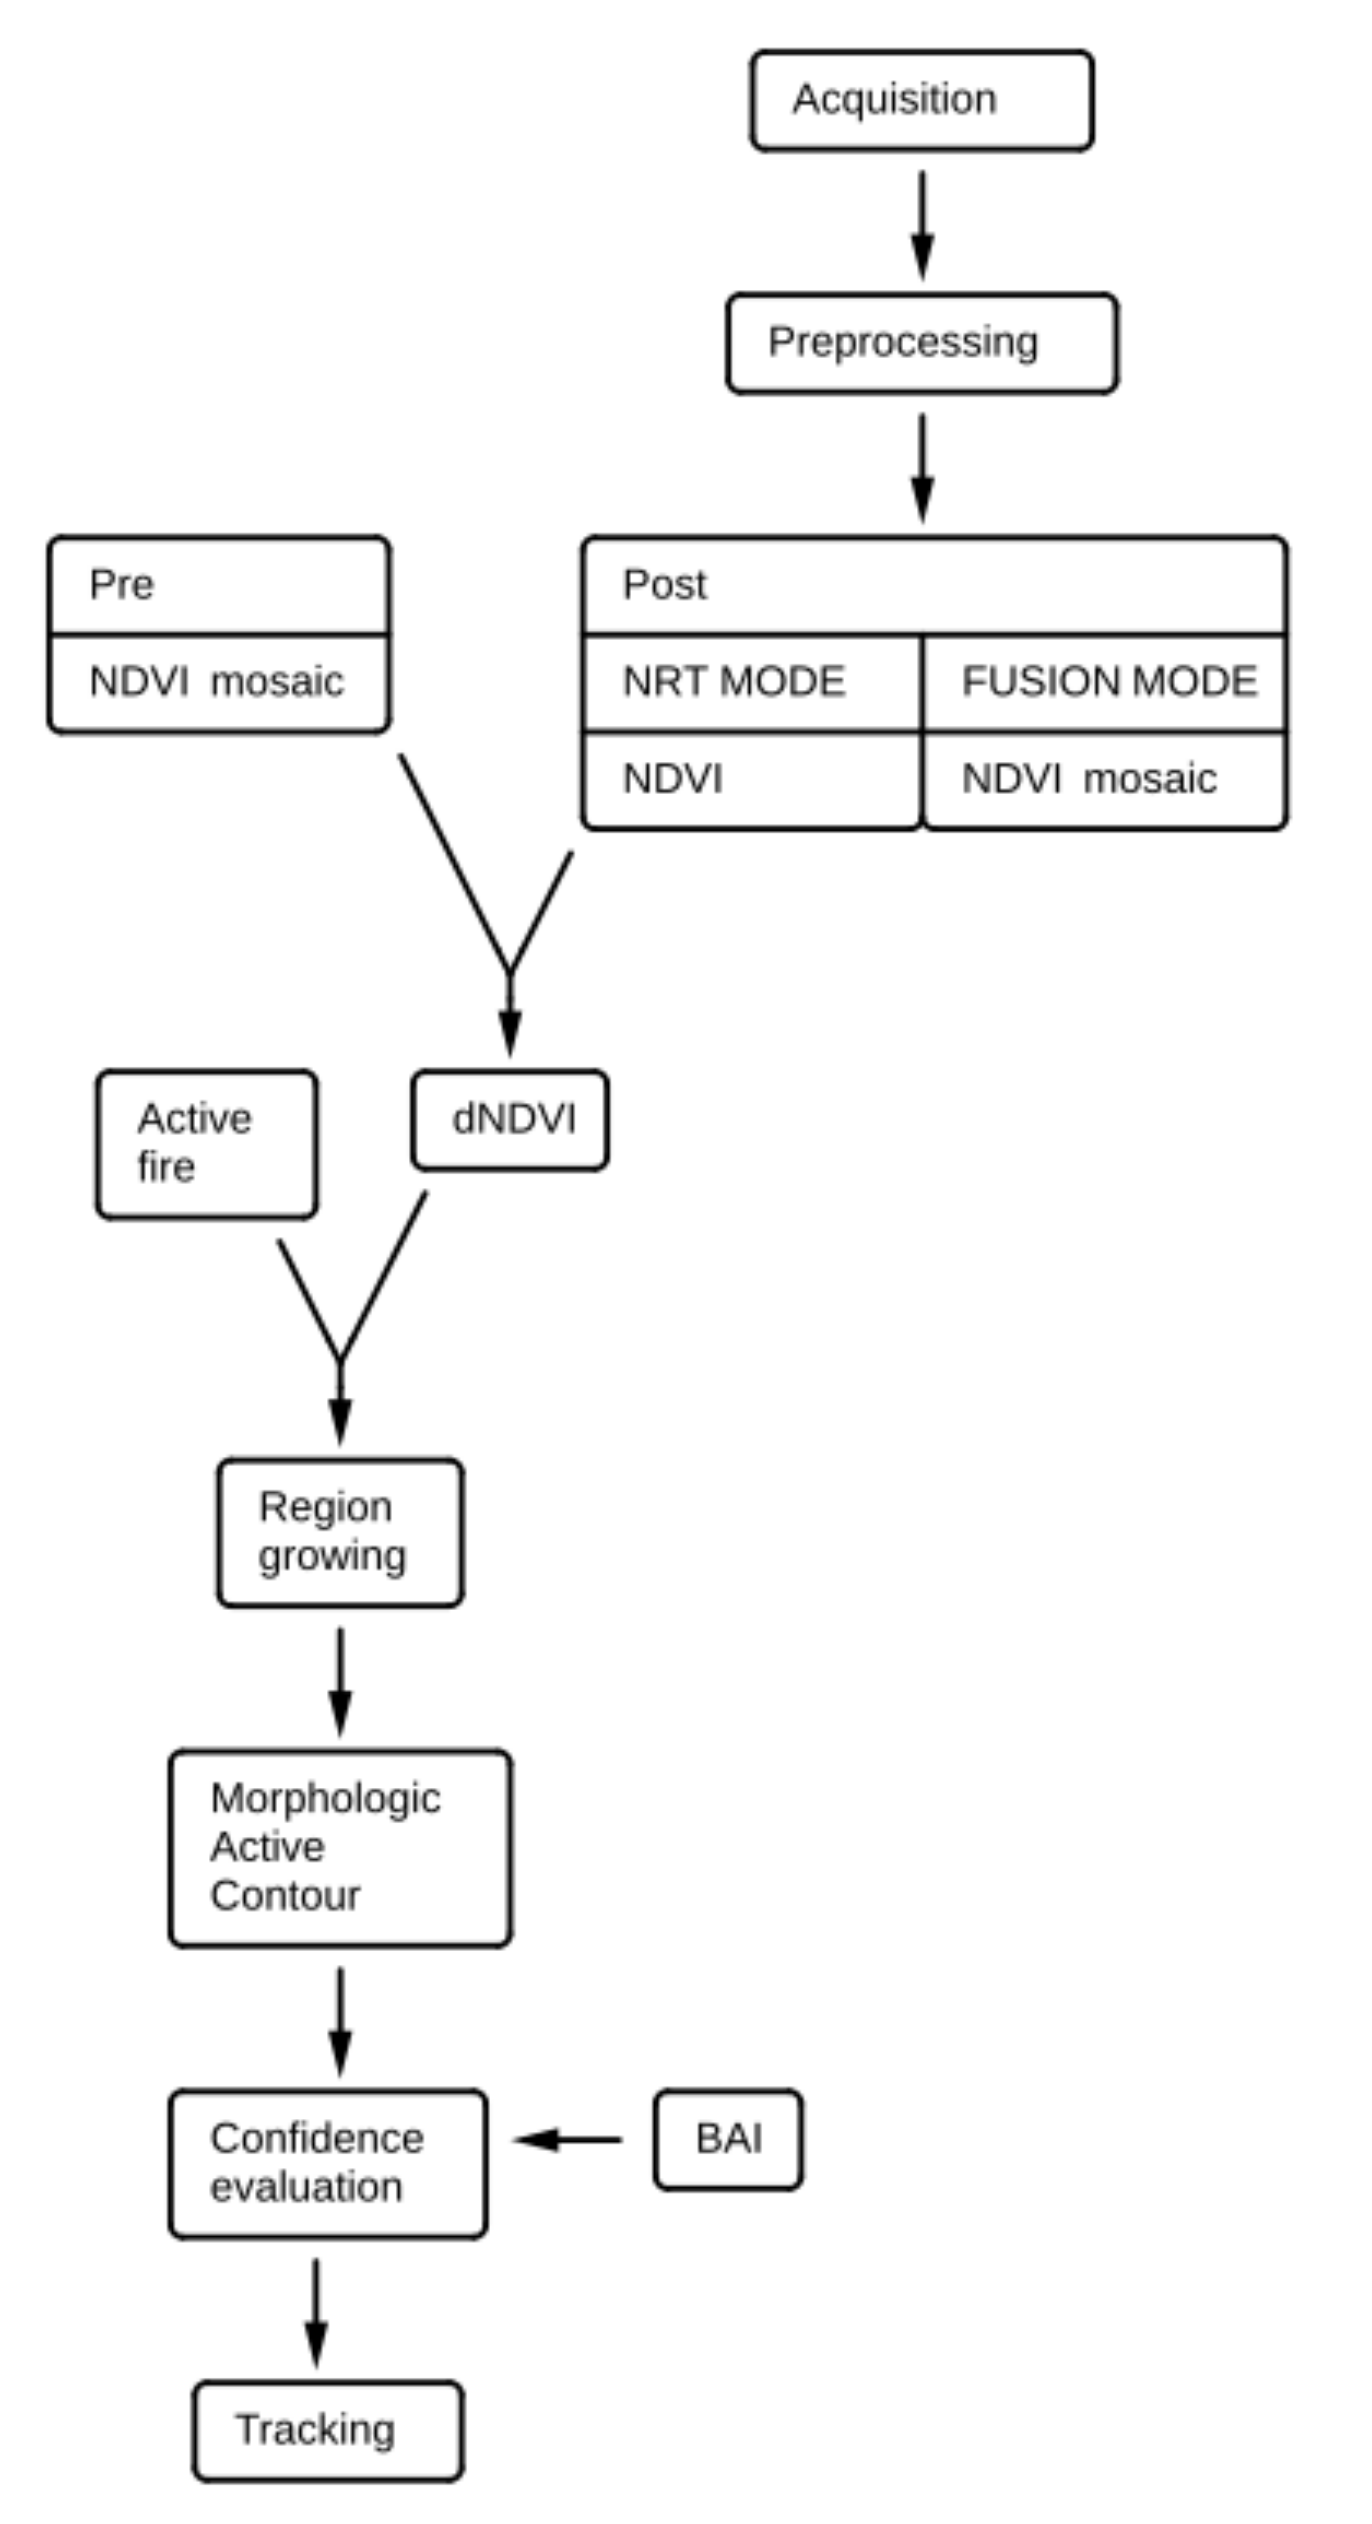
2.1. Description of the Methodology

The presented method aims at being applicable with a variety of optical satellite sensors. This is achieved through a confinement to only red and NIR band data, which are available for the majority of optical sensors. Thermal anomaly locations are used as auxiliary data. While top of atmosphere (TOA) band information can be utilized, the detection quality increases when the input data are processed to surface reflectance beforehand. Since several input sensors can be utilized side by side, the timeliness of product availability is significantly improved compared to a single sensor system.
Furthermore, the methodology was also designed to be applicable irrespective of geographical regions of interest. e.g., it is utilizable for a variety of ecosystems and vegetation types. This is achieved through the avoidance of fixed thresholds. In classification approaches using such fixed thresholds, information is categorized using radiometric ranges which have been derived beforehand, either statistically or empirically. This allows for a precise calibration of a model based on the respective input data. However, the derived thresholds are tied to the specific input data source, and need to be adapted to the desired use case. A reliable identification of burnt areas based on fixed thresholds thus requires a finely tuned model corresponding to the utilized sensor. This task has recently been approached with machine learning techniques, usually in combination with considerable quantities of training data. Methodologies such as Random Forests [23], Support Vector Machines [24] and Deep Learning classifiers [25] have been applied in this regard. In contrast, the presented approach dynamically defines required thresholds from contextual information. It utilizes the Morphological Active Contours methodology, which iteratively approximates the actual burnt area perimeter until an optimal outcome is achieved [26]. In addition to the red and NIR band information, the system requires auxiliary data in the form of thermal anomaly locations as well as a cloud mask. Land use/land cover (LULC) data can optionally be used to filter certain usage classes (such as industrial facilities) and thereby enhance product quality.
Figure 1 depicts the process for burnt area derivation step by step.

2.1.1. Acquisition and Preprocessing

In its current implementation at DLR, the processing chain utilizes data from the MODIS and Sentinel-3 OLCI sensors. The usage of several other sensors would also be possible, as described in the discussion section.
MODIS data are received by DLR through its reception facilities in Oberpfaffenhofen and Neustrelitz/Germany. The raw data stream is processed to a level 0 product, from which a level 1B TOA reflectance product is derived through the NASA MOD02 algorithm [27]. Subsequently, active fire pixels are derived using the NASA MOD14A1 processor [28]. The level 1B TOA reflectance product is atmospherically corrected using default atmospheric parameters (through the NASA CREFL tool [29]). It is then transferred to the ETRS89 Lambert azimuthal equal area (LAEA) projection. The resulting product is radiometrically equivalent to the MYD09_L1B/MOD09_L1B collection 6 dataset provided by NASA [30], featuring a spatial resolution of 250 m for the red and NIR band. A cloud mask is generated at 1 km resolution using the IMAPP algorithm from the University of Wisconsin, which is built upon the NASA MOD06 methodology [31]. The resulting raster is projected to LAEA and re-sampled to match the 250 m resolution of the red and NIR band.
Sentinel-3 data are not acquired directly, but downloaded from the EUMETSAT CODA website in near-real time instead [32]. The Sentinel-3A and 3B satellites both carry two optical sensors (OLCI and SLSTR, the Sea and Land Surface Temperature Radiometer), of which the first one is utilized because of the superior spatial resolution of 300 m, opposed to 500 m for SLSTR [33]. Since the level 2 product is not available in NRT, the level 1 full resolution product is used (S3A/B_OL_1_EFR). No cloud mask is available for this product, but it includes a layer of quality flags, one of them indicating the brightness level of each pixel. This information is extracted and used for a remedy cloud mask. This implies, however, that also areas covered by snow may be interpreted as clouds. The grid data are projected to LAEA, and is used as an input without an atmospheric correction.

2.1.2. Preparation of Index Mosaics

For the generation of the pre scene mosaic, the algorithm is configured to consider scenes from the past 30 days. This setting allows for the consideration of a reasonable high number of pre scenes in order to generate a cloud-free composite. Longer time ranges would implicate increasing difficulties due to vegetation shifts caused by seasonality.
All available pre scenes are filtered using a cloud mask as well as land use/land cover (LULC) information in order to remove pixels representing clouds or an undesired land usage class.
In addition to cloud pixels, also cloud shadows are removed in order to prevent false detections. This is done using a fixed size buffer zone around cloud pixels to remove locations possibly superimposed by a cloud shadow. This fixed size has been set to a range of 1250 m, derived empirically from MODIS imagery during the testing period of August 2017. This approach, however, must be regarded to be suboptimal since the actual position and size of a cloud shadow varies with the solar zenith angle and the height of the cloud. In addition, the current approach removes both shadowed and valid pixels. Possible enhancements are discussed in the respective Section 4.
For LULC information, the current CORINE dataset of 2018 [34] is used for the region of Europe, extended with data from the NASA MCD12Q1 product [35] for Northern Africa and the Middle East in the current implementation. Both datasets have been re-sampled from their original resolution (100 m in case of CORINE and 500 m regarding MCD12Q1, respectively) to match the resolution of the utilized MODIS and Sentinel-3 OLCI input data, using nearest neighbor interpolation. Pixels representing a land cover class irrelevant for burnt area estimation are masked out, in order to avoid possible false detections. This could happen due to the heat signature of industrial facilities or through water sun glint. The excluded classes comprise all urban and industrial areas, as well as the ones related to water. Classes related to vegetation, such as forests and grasslands, but also anthropogenic uses such as pastures and agricultural areas are preserved.
Subsequently, the red and NIR channel information is used to calculate the Normalized Difference Vegetation Index (NDVI; [36], Equation (1)) for each filtered scene. The NDVI is a well-known, vegetation related index. It is utilized to identify rapid, fire-induced decreases in vegetation fitness through a change detection approach ( N D V I d i f f , Equation (2)). The index has been extensively used for burnt area discrimination [37] and has been successfully applied in a variety of studies, many of them in the Mediterranean region [38]. Significant decreases in NDVI values have been found to be well correlated with recently burnt surfaces by [37,39], due to the sensitivity of the index to chlorophyll absorption.
N D V I = N I R R e d N I R + R e d
N D V I d i f f = N D V I p o s t N D V I p r e
Optionally, the system can utilize the Normalized Burn Ratio (NBR) index ([40], see Equations (3) and (4)) instead of the NDVI. This index features superior capabilities for burnt area discrimination compared to the NDVI [41]. It uses information from a SWIR (short-wave infrared) band instead of the red band. However, many optical mid-resolution sensors, such as Sentinel-3A/B-OLCI, do not feature a SWIR channel. MODIS offers a SWIR band only in a reduced resolution compared to the red and NIR bands. In this study, input data are used from MODIS and Sentinel-3, so the NBR is not utilized for the mentioned reasons.
N B R = N I R S W I R N I R + S W I R
N B R d i f f = N B R p o s t N B R p r e
Each result is subsequently co-registered to the (post) satellite scene to be analyzed. Consecutively, these results are merged together to produce a single, co-registered, cloud free pre-mosaic of NDVI values. This merging approach suffers from reflectance values being affected by the differing lighting conditions and acquisition angles as described by the Bidirectional reflectance distribution function (BRDF). Nevertheless, since a normalized ratio is considered instead of individual bands, a directional correction is already incorporated, because the effects are similar in both bands [42]. This is discussed further on in this study (cf. Section 4). The merging is done separately for each type of input source; no combination of data from different sensors is performed. Otherwise, in case of differing resolutions of the sensors (as is the case for MODIS and Sentinel-3 OLCI), this would implicate the re-sampling of imagery and, consecutively, the loss of spatial accuracy.
Equivalent to the pre scenes, filtering and NDVI calculation are also undertaken for the post scene.
The proposed algorithm can be operated in two modes: NRT (near real-time) mode and fusion mode. For the latter, a second mosaic is built from a set of post scenes, instead of using a single scene. This implies that the processing in fusion mode can only be invoked after a specified period of time, when new imagery becomes available. In fusion mode, the NDVI-results of several post scenes are combined into a post-mosaic, in a way that pixels featuring a low NDVI value are superimposed by newer pixels if they show a higher NDVI value. This is mainly done in order to mitigate undesired effects in the NRT results, caused by cloud shadows and smoke plumes. Both phenomena will influence the NDVI and will consecutively possibly lead to overestimations of the burnt area.
Using fusion mode when new data becomes available, however, allows the system to perform refinements of the initial results. The same input scene is processed repeatedly in subsequent days, enhanced with additional information from subsequent scenes. Initial NRT results can thus be replaced by ever more robust and accurate versions.
The analysis of the pre and post information allows a change detection analysis between the hitherto existing situation and possible newly evolved burnt areas. This approach also ensures that only newly occurred burnt areas are detected.

2.1.3. Generation of Differential Index Information

The next step is the calculation of the differential NDVI ( N D V I d i f f , Equation (2)), in order to measure the magnitude of the change between pre and post information. To generate the basis for the burnt area perimeter derivation, both the N D V I d i f f and N D V I p o s t are re-scaled to a range of 0 to 1. They are multiplied subsequently in order to generate a difference image.

2.1.4. Determination of Regions of Interest

The algorithm uses active fire locations as starting points for the burnt area perimeter determination. The current implementation at DLR uses fire locations derived from MODIS data. In addition, NRT data are also utilized from the Visible Infrared Imaging Radiometer Suite (VIIRS) sensor on Suomi National Polar-orbiting Partnership (SUOMI NPP) and on National Oceanic and Atmospheric Administration (NOAA-20), through the NASA Fire Information for Resource Management System (FIRMS) website [43]. Since the VIIRS sensor features a higher spatial resolution compared to MODIS (375 m at nadir, opposed to 1000 m of the MODIS sensor), this considerably improves the burnt area detection completeness. In order to prohibit false detections caused by the thermal signature of industrial facilities, active fire pixels are excluded where the differential NDVI indicates no sign of an occurred burning ( N D V I d i f f 0 . 0 ).
The process continues with the identification of regions of interest within the generated difference image. This is done in order to facilitate the determination of specific threshold values for each burning site. A region growing methodology is used for that purpose. The extent of each region is defined by the presence of thermal anomaly locations which occurred during the past seven days. Each region grows outward, starting from an active fire seed pixel as long as at least 5% of the border pixels overlap with such active fire locations. If this is no longer the case, the region keeps growing in each direction for a distance equal to 50% of the current regions width and height, respectively. This continuation of the growth enables the complete assessment of a burnt area, even if it is intersected by a road or a river. It also ensures that a sufficient amount of pixels of both conditions, the ones affected by the burning as well as unaffected ones, are included within the current region, which is required for the subsequent segmentation.

2.1.5. Derivation Burnt Area Perimeters through Morphological Snakes

To extract the accurate shape of the burnt area perimeter, the system uses an approach based on Morphological Snakes. The term refers to a family of methods used for image segmentation. These methods operate similar to traditional Active Contour approaches, which are described in [26,44,45], but are regarded to be faster and numerically more stable [46,47]. This is due to the fact that, while Active Contour approaches work by solving partial differential equations, Morphological Snakes rely on morphological operators over a binary array. The methodology presented here uses an implementation named Morphological Active Contours without Edges (MorphACWE). The algorithm generates a dynamically growing curve, originating at a set of initial points. As these curves grow and converge, the algorithm performs a statistical analysis of the scene pixels located inside and outside the curves during each iteration. It stops as soon as the curve boundary represents an optimal discrimination between both pixel groups regarding their average values. An implementation of a related methodology, Active Contour Level Sets, has been applied successfully to assess burnt area perimeters [48]. The method has also been used for crop field size quantification [49].
The Morphological Active Contours algorithm is applied successively onto each identified region of interest. By that, a dynamic threshold can be determined from the active fire seed points of that specific burnt area. The dynamic curve is therefore able to adapt to the region of interest in an optimized way, and allows the derivation of an accurate perimeter even if the burn severity is low.
The process is visualized in Figure 2 for an exemplary study site in Northern Portugal, in summer 2016. The figure shows the initial curve starting at the active fire seed points, as well as the curves evolution after 10, 25 and 50 iteration steps, respectively.
Several tests are performed to ensure that the determined burnt area is not a false detection. The first test refers to the severity of the burning, stating that the mean decrease in vegetation fitness must exceed a certain threshold ( N D V I d i f f 0 . 1 ). Consecutively, it is checked whether the size of the identified burnt area satisfies a certain ratio constraint when compared with the number of comprised active fires. This constraint is set to a minimum of one active fire per 10,000 ha. This setting corresponds to one MODIS active fire pixel in a 10 × 10 grid of pixels in the 1 km resolution thermal-infrared wavelength, which is used for the active fire detection.

2.1.6. Confidence evaluation

For every derived burnt area, a confidence value is determined to allow for an estimation of the reliability of the result, given as a value between 0 and 100. Four input factors are considered: The first one makes use of the Burn Area Index (BAI [37], see Equation (5)) of the post scene.
B A I = 1 ( 0 . 1 R e d ) 2 + ( 0 . 06 N I R ) 2
This index has been designed to be sensitive regarding the spectral signal of charcoal and ashes. It was found to allow for a clear differentiation between burnt and un-burnt surfaces, yet it also shows a high variability depending on fire severity [39].
Unlike in the case of the NDVI, no post mosaic is generated for the BAI in fusion mode. This is due to the fact that the index is not normalized and hence the combination of index values from different scenes does not yield meaningful results. In fusion mode, there might thus be less valid BAI pixels present than NDVI pixels. The available BAI values are rescaled to a range of 0 to 1, with the scale factor being dependent on the magnitude of the input data range. The confidence factor is the average of these values. For the second input, the average of the re-scaled N D V I d i f f corresponding to the determined burnt area pixels is used, indicating the intensity of loss of vegetation fitness. The third input is the ratio of present thermal anomaly locations in relation to the total pixel number of the burnt area. Finally, the solar azimuth angle is used, which is calculated from the satellite overpass date end time time as well as the center coordinate of the current region. If the acquisition angle is below 30, shadowing will prohibit optimal quality of the results. To reflect this, a value of 0.5 is assigned to this factor. If the conditions are convenient, however, this value is set to 1. The final confidence value is calculated by averaging the four input values and multiplying the result by 100.

2.1.7. Final Steps and Tracking

In a concluding step, the grid-based result is transferred to a vectorial polygon representation. If the current region of interest yields several burnt area polygons, these are stored together in the form of a multi-polygon, in order to represent a common fire event. Several metadata attributes are added to this result, such as affected area in hectares. A notable, automatically generated information is the unique ID for each identified burnt area. For this, a database of recent detections is consulted to check for intersections. If an intersection with a previously determined perimeter is found within a time range of 14 days, the current detection is interpreted to represent an evolution of a previously existing burnt area, and is therefore assigned the same ID as the found record. This procedure enables a tracking of burnt area growth over time.

2.2. Validation Procedure

To investigate the performance of the developed algorithm in different climatic and geographical regions with different vegetation types, three different analyses are performed. The first two assess the detection accuracy of the results, while the third one investigates the timeliness. As study regions, the five most affected European countries were selected: Spain, Portugal, Italy, Greece and France [50]. Each analysis is carried out for both NRT and fusion mode. The evaluation is performed with different sensors, to show the flexibility of the method. As a study period, the month of August, 2017 was selected because Southern Europe experienced an extraordinarily high level of fire activity at the time.
For the first analysis, the results are validated against all burnt area mapping products prepared by the Copernicus Emergency Mapping Service, which are available for the study site and study period.
Secondly, to gain insights on a larger temporal and spatial scale, an inter-comparison is performed with reference datasets produced by NASA, ESA and JRC. This comparison is conducted over the entire area of the aforementioned European countries Spain, Portugal, Italy, Greece and France for the month of August 2017. A minimal mapping unit of 150 ha has been introduced to account for differing spatial resolutions in the utilized sensor data sources. The burnt area polygons were merged and dissolved for each data source over the whole month, in order to compare the final output regardless of the mapping date.
Thirdly, a day-to-day inter-comparison has been performed regarding the development of one specific burnt area, with daily JRC EFFIS BA data as a reference. The respective fire occurred in the community of Catalonia, south of the city of Lleida, at the end of June 2019. It was one of the biggest burnt areas throughout Europe during the year of 2019 [18].
All study regions, references and analyzed time ranges have been listed in Table 1.
The results are compared against the reference datasets, regarding three criteria:
  • True positives: The percentage of true positives (TP) refers to the area classified by the presented methodology as well as the reference data as being burnt, in comparison to the total burnt area size in the reference.
  • False negatives: Analogously, the term false negatives (FN) refers to the total area which was not classified as burnt by the presented methodology, but was classified as such in the reference. The size of this area is set in relation to the total burnt area size in the reference.
  • False positives: The term of false positives (FP) addresses the total area classified as burnt in the DLR result, but not classified as such in the reference area. The number is given in relation to the total burnt area size in the reference.
The fourth criterion, which represents the true negatives (TN), refers to the percentage of area neither classified as being burnt by the presented methodology, nor by the reference data. Since the total size of un-burnt area greatly predominates the total size of burnt area, this true negative percentage is implicitly very close to 100 percent. This is, however, mostly due to the size of the study region and does not represent a meaningful value in this case. The same applies to the overall accuracy [41]. These measures have therefore been omitted in the results section.

3. Results

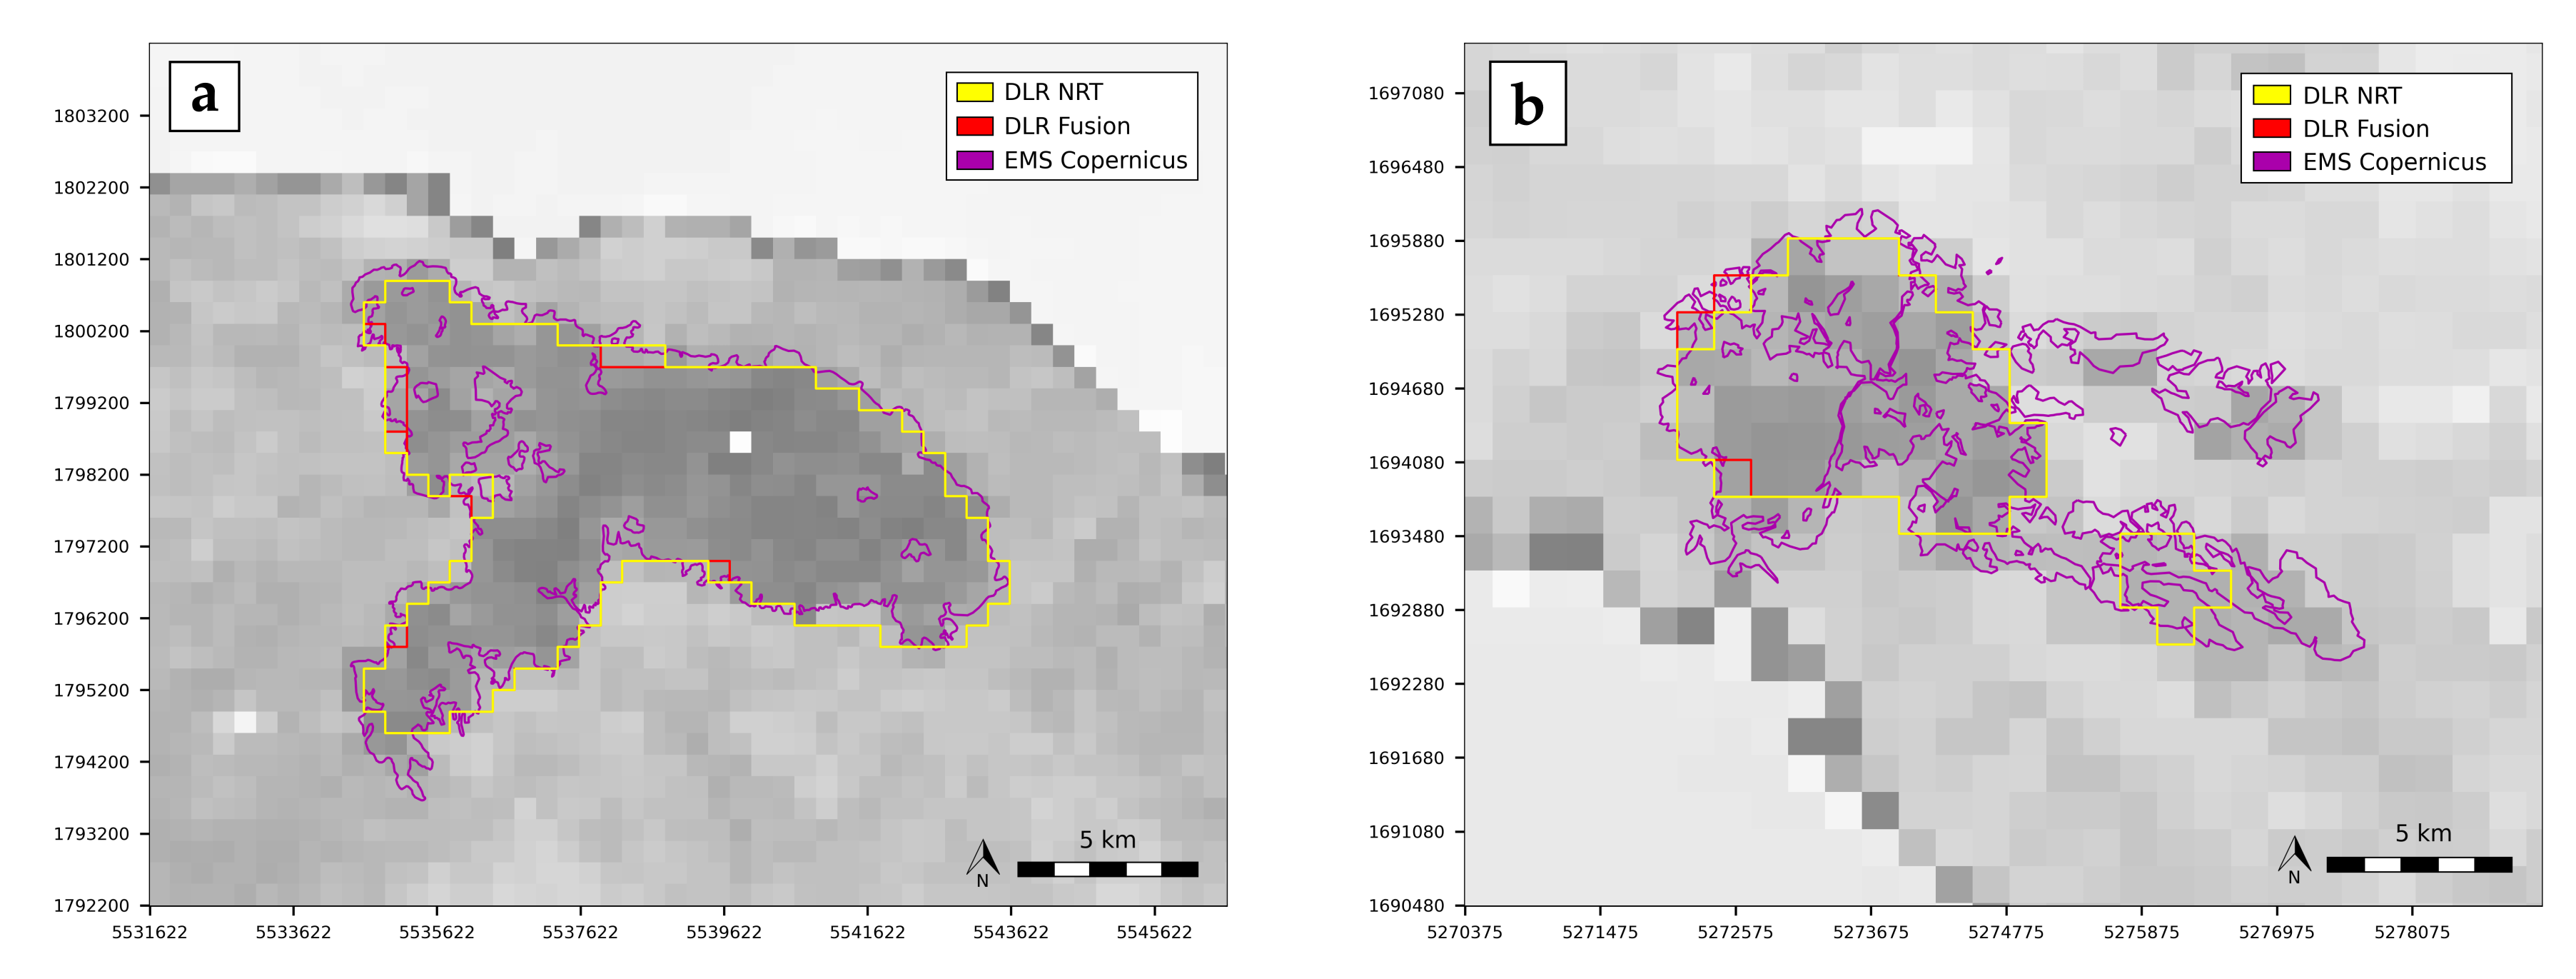
3.1. Single Incident Analysis

Table 2 shows the results of the validation against Copernicus EMS data, for the five study areas of Jaen, Corsica, Kalamos, Zakynthos and Leon. For each study area, the true positives, false negatives and false positives are listed, both for NRT and fusion mode. The results were derived using Sentinel-3A OLCI data. A visualization of two of the analyzed study regions is given in Figure 3. It depicts the DLR NRT and fusion results as well as the Copernicus EMS reference data for the regions of Zakynthos and Kalamos, Greece. The NIR band of a Sentinel-3 post scene, acquired shortly after the fire, is used as a background.

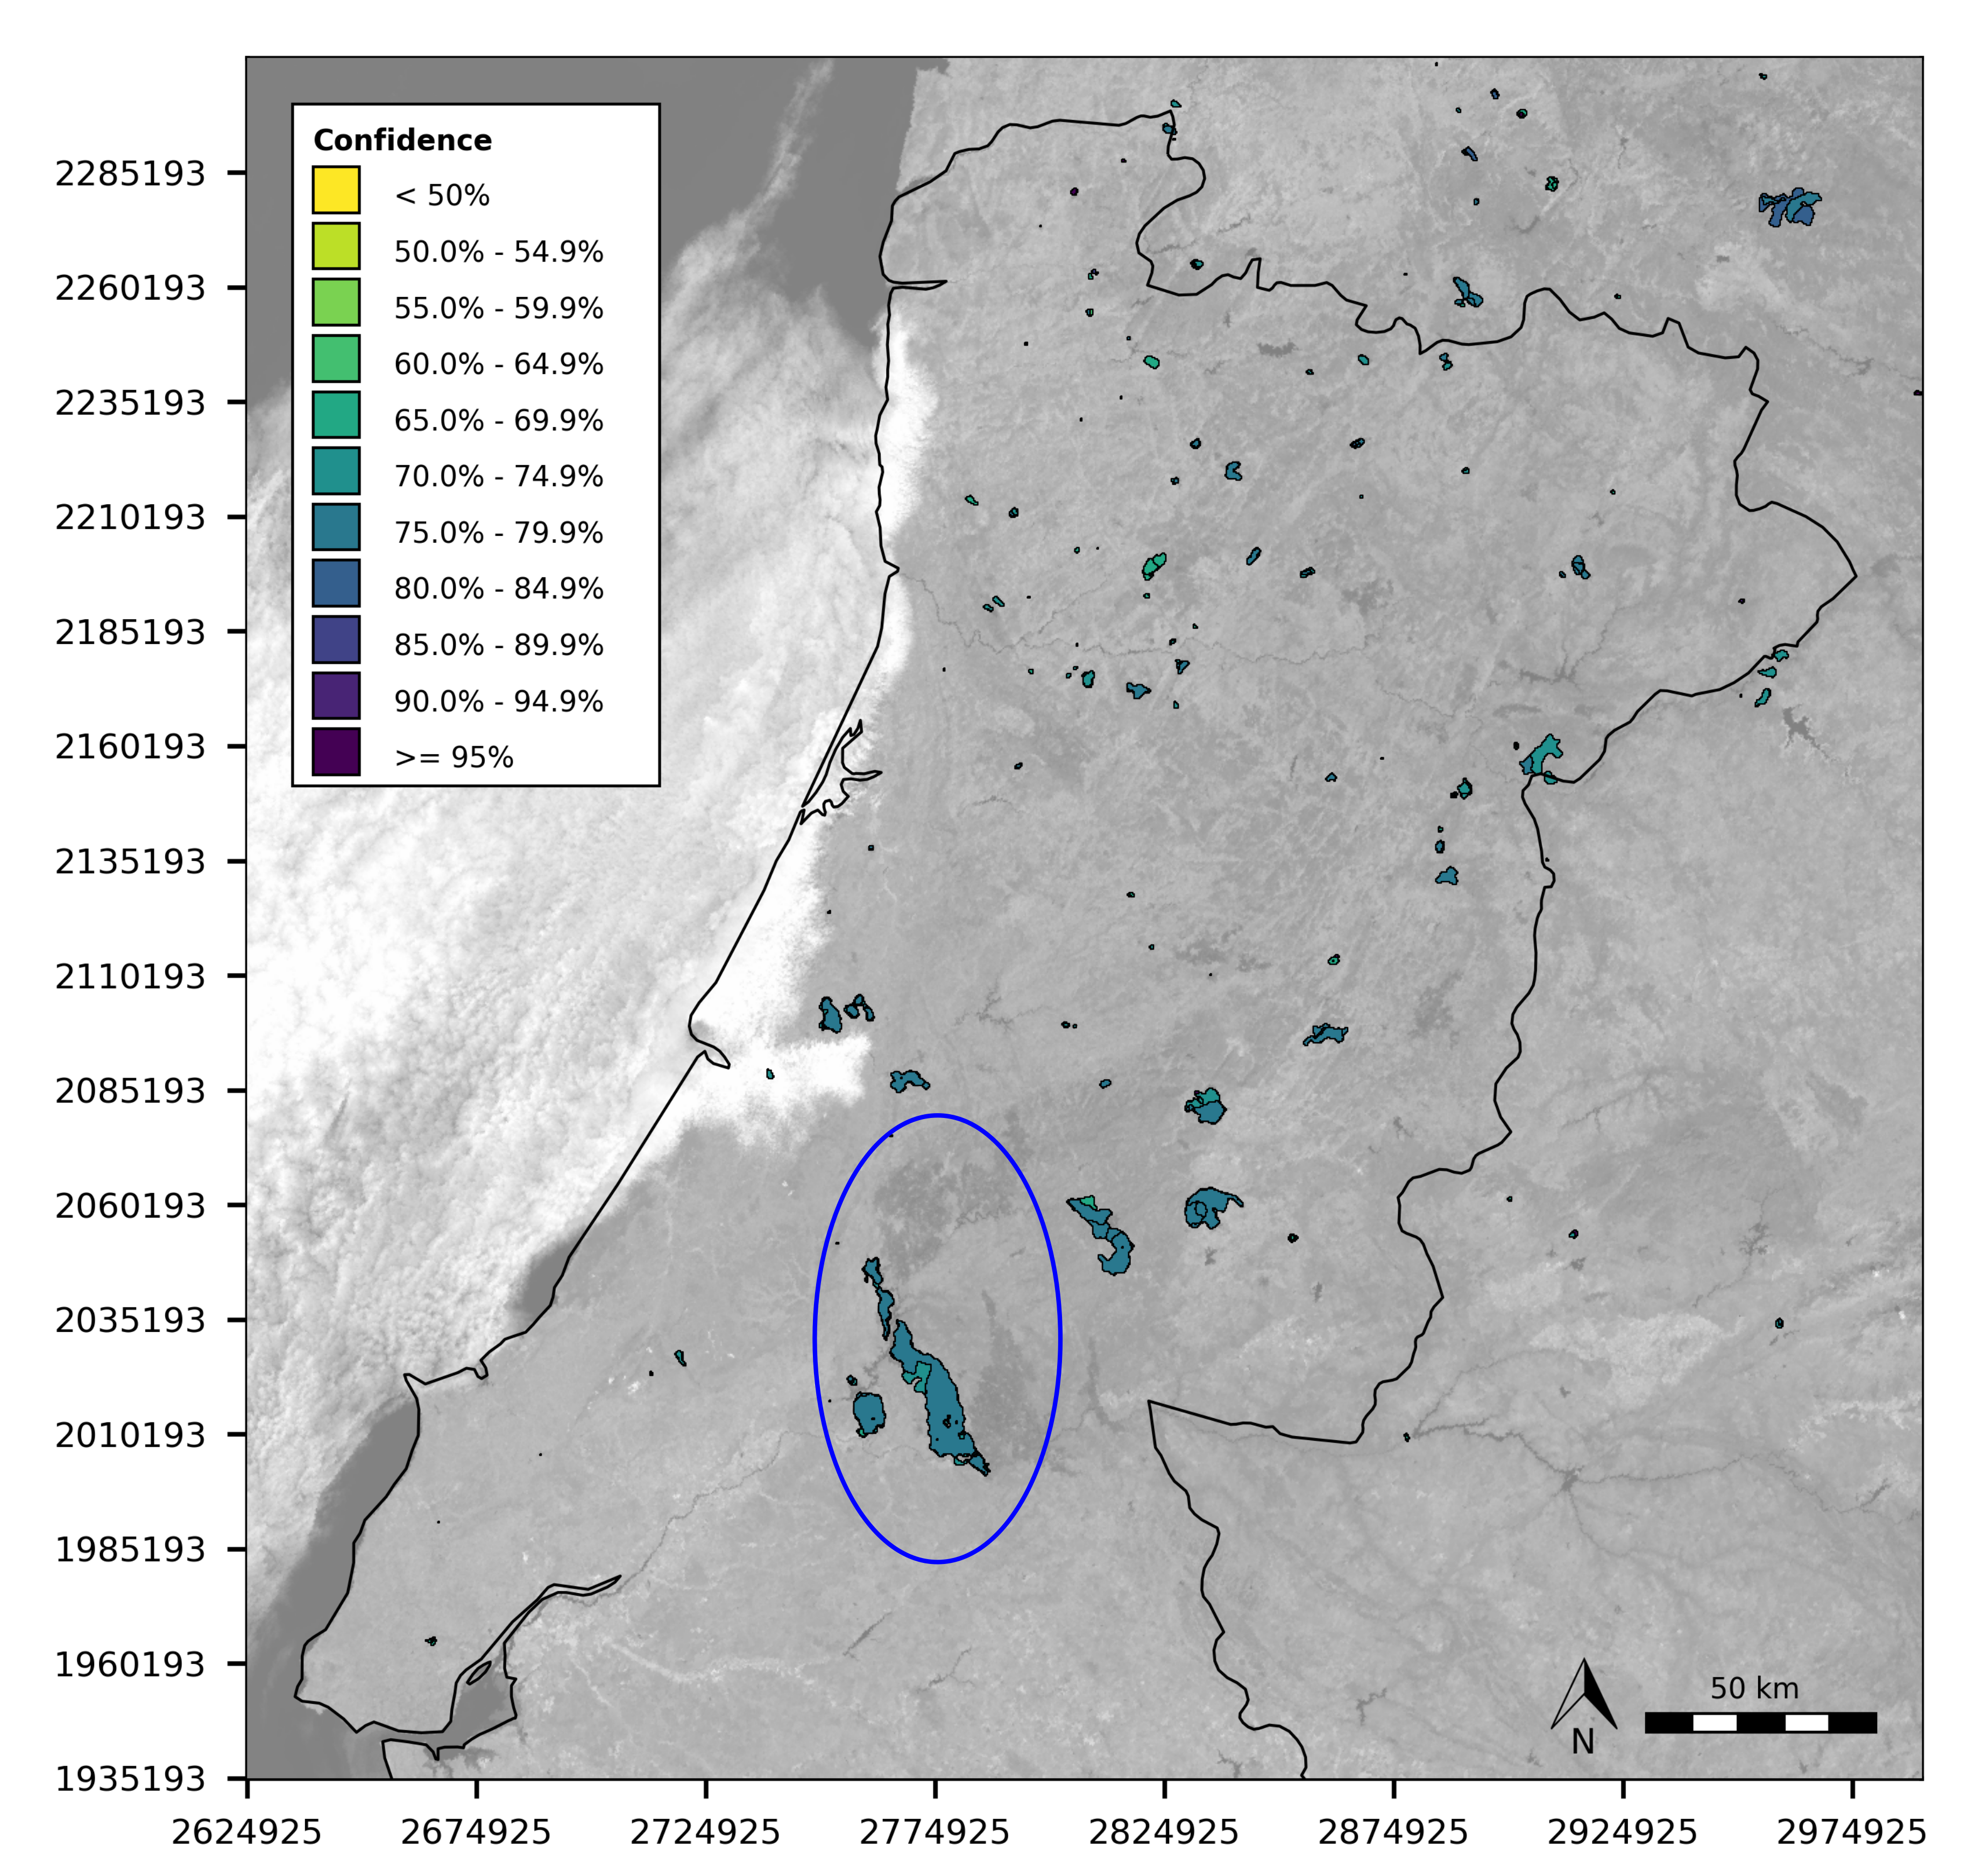
3.2. Large Scale Analysis

Figure 4 shows the burnt areas derived from Sentinel-3 OLCI data for Northern Portugal, regarding the testing period of August 2017. The color grading indicates the level of confidence assigned to each polygon. The elliptical shape marks a region where three large fires occurred during the summer season of 2017, two of them happening in June and July. They can be identified by the darker shade of gray within the highlighted region. The algorithm correctly only reports the burnt area occurring in August.
Table 3 lists the results of the comparison with three large-scale, long-term datasets. JRC EFFIS BA data are derived semi-automatically, while the MCD64A1 and Fire_cci 5.1 BA datasets are generated through an automated approach based on a time-series. The rightmost column shows the results for a combination of these reference datasets, where all BA polygons were merged and the overlapping regions were dissolved. The numbers in brackets represent the quantity of polygons contained in the reference datasets. For the DLR products, this number indicates the quantity of polygons intersecting those in the reference dataset.

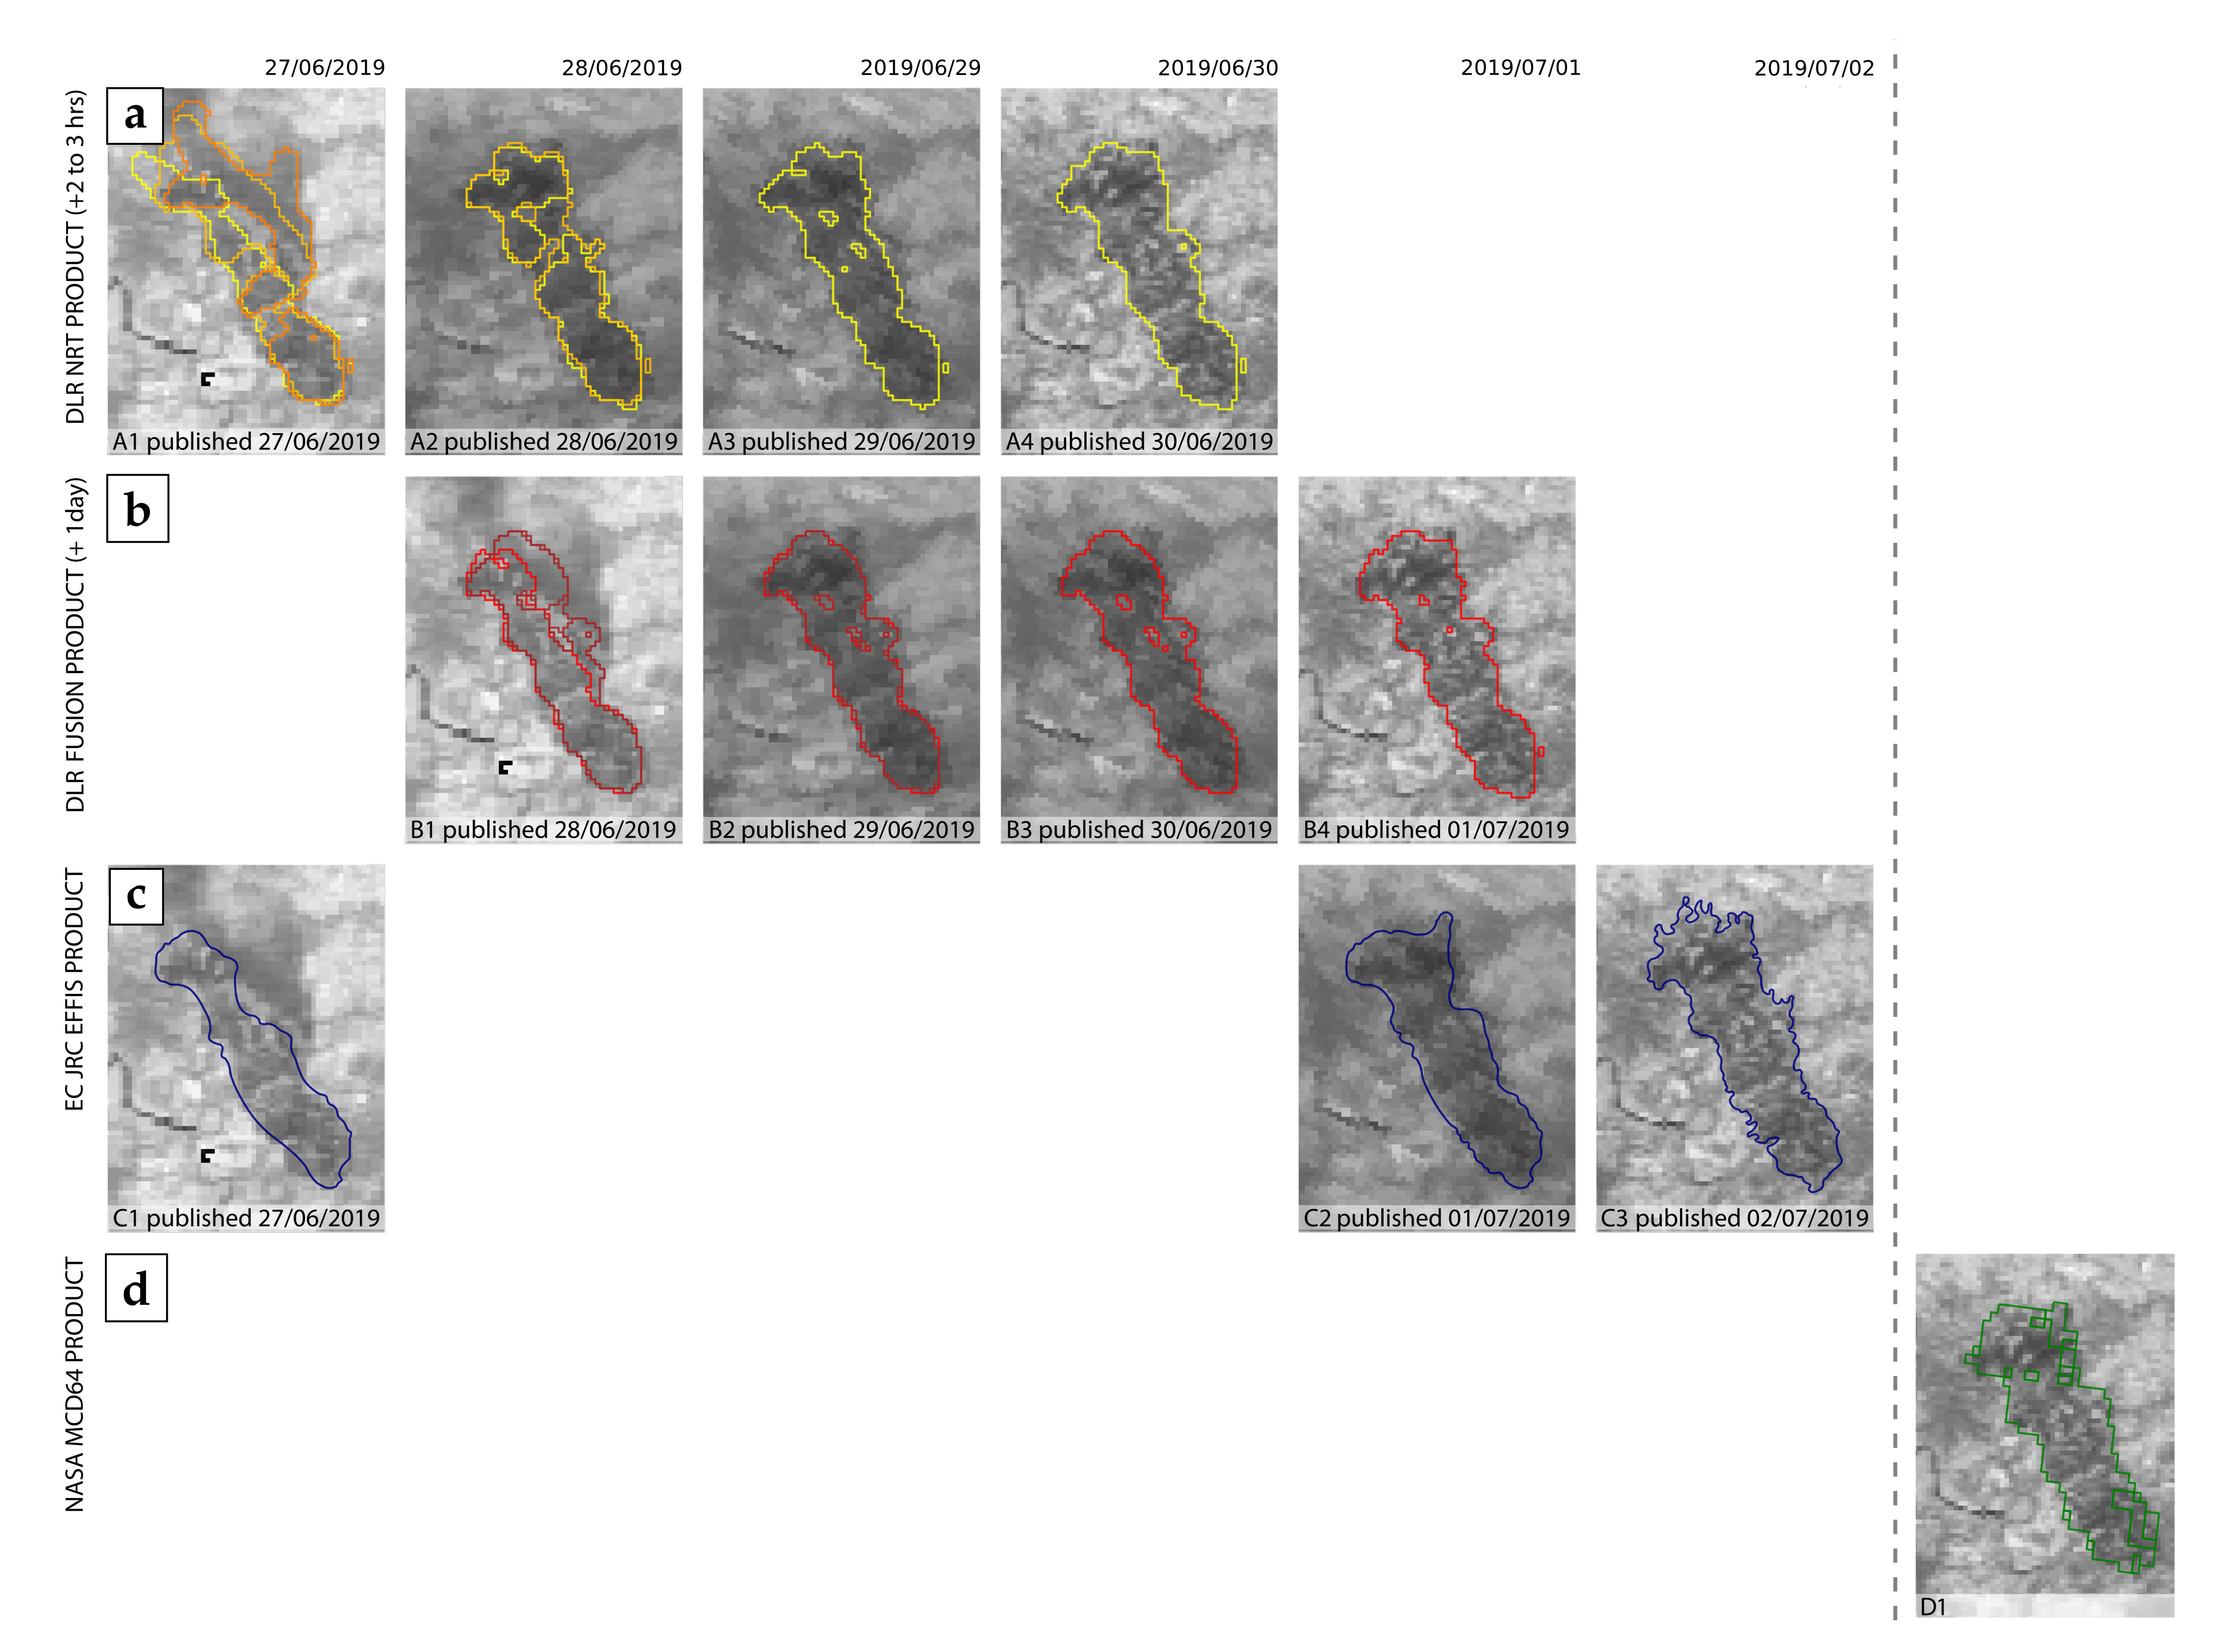
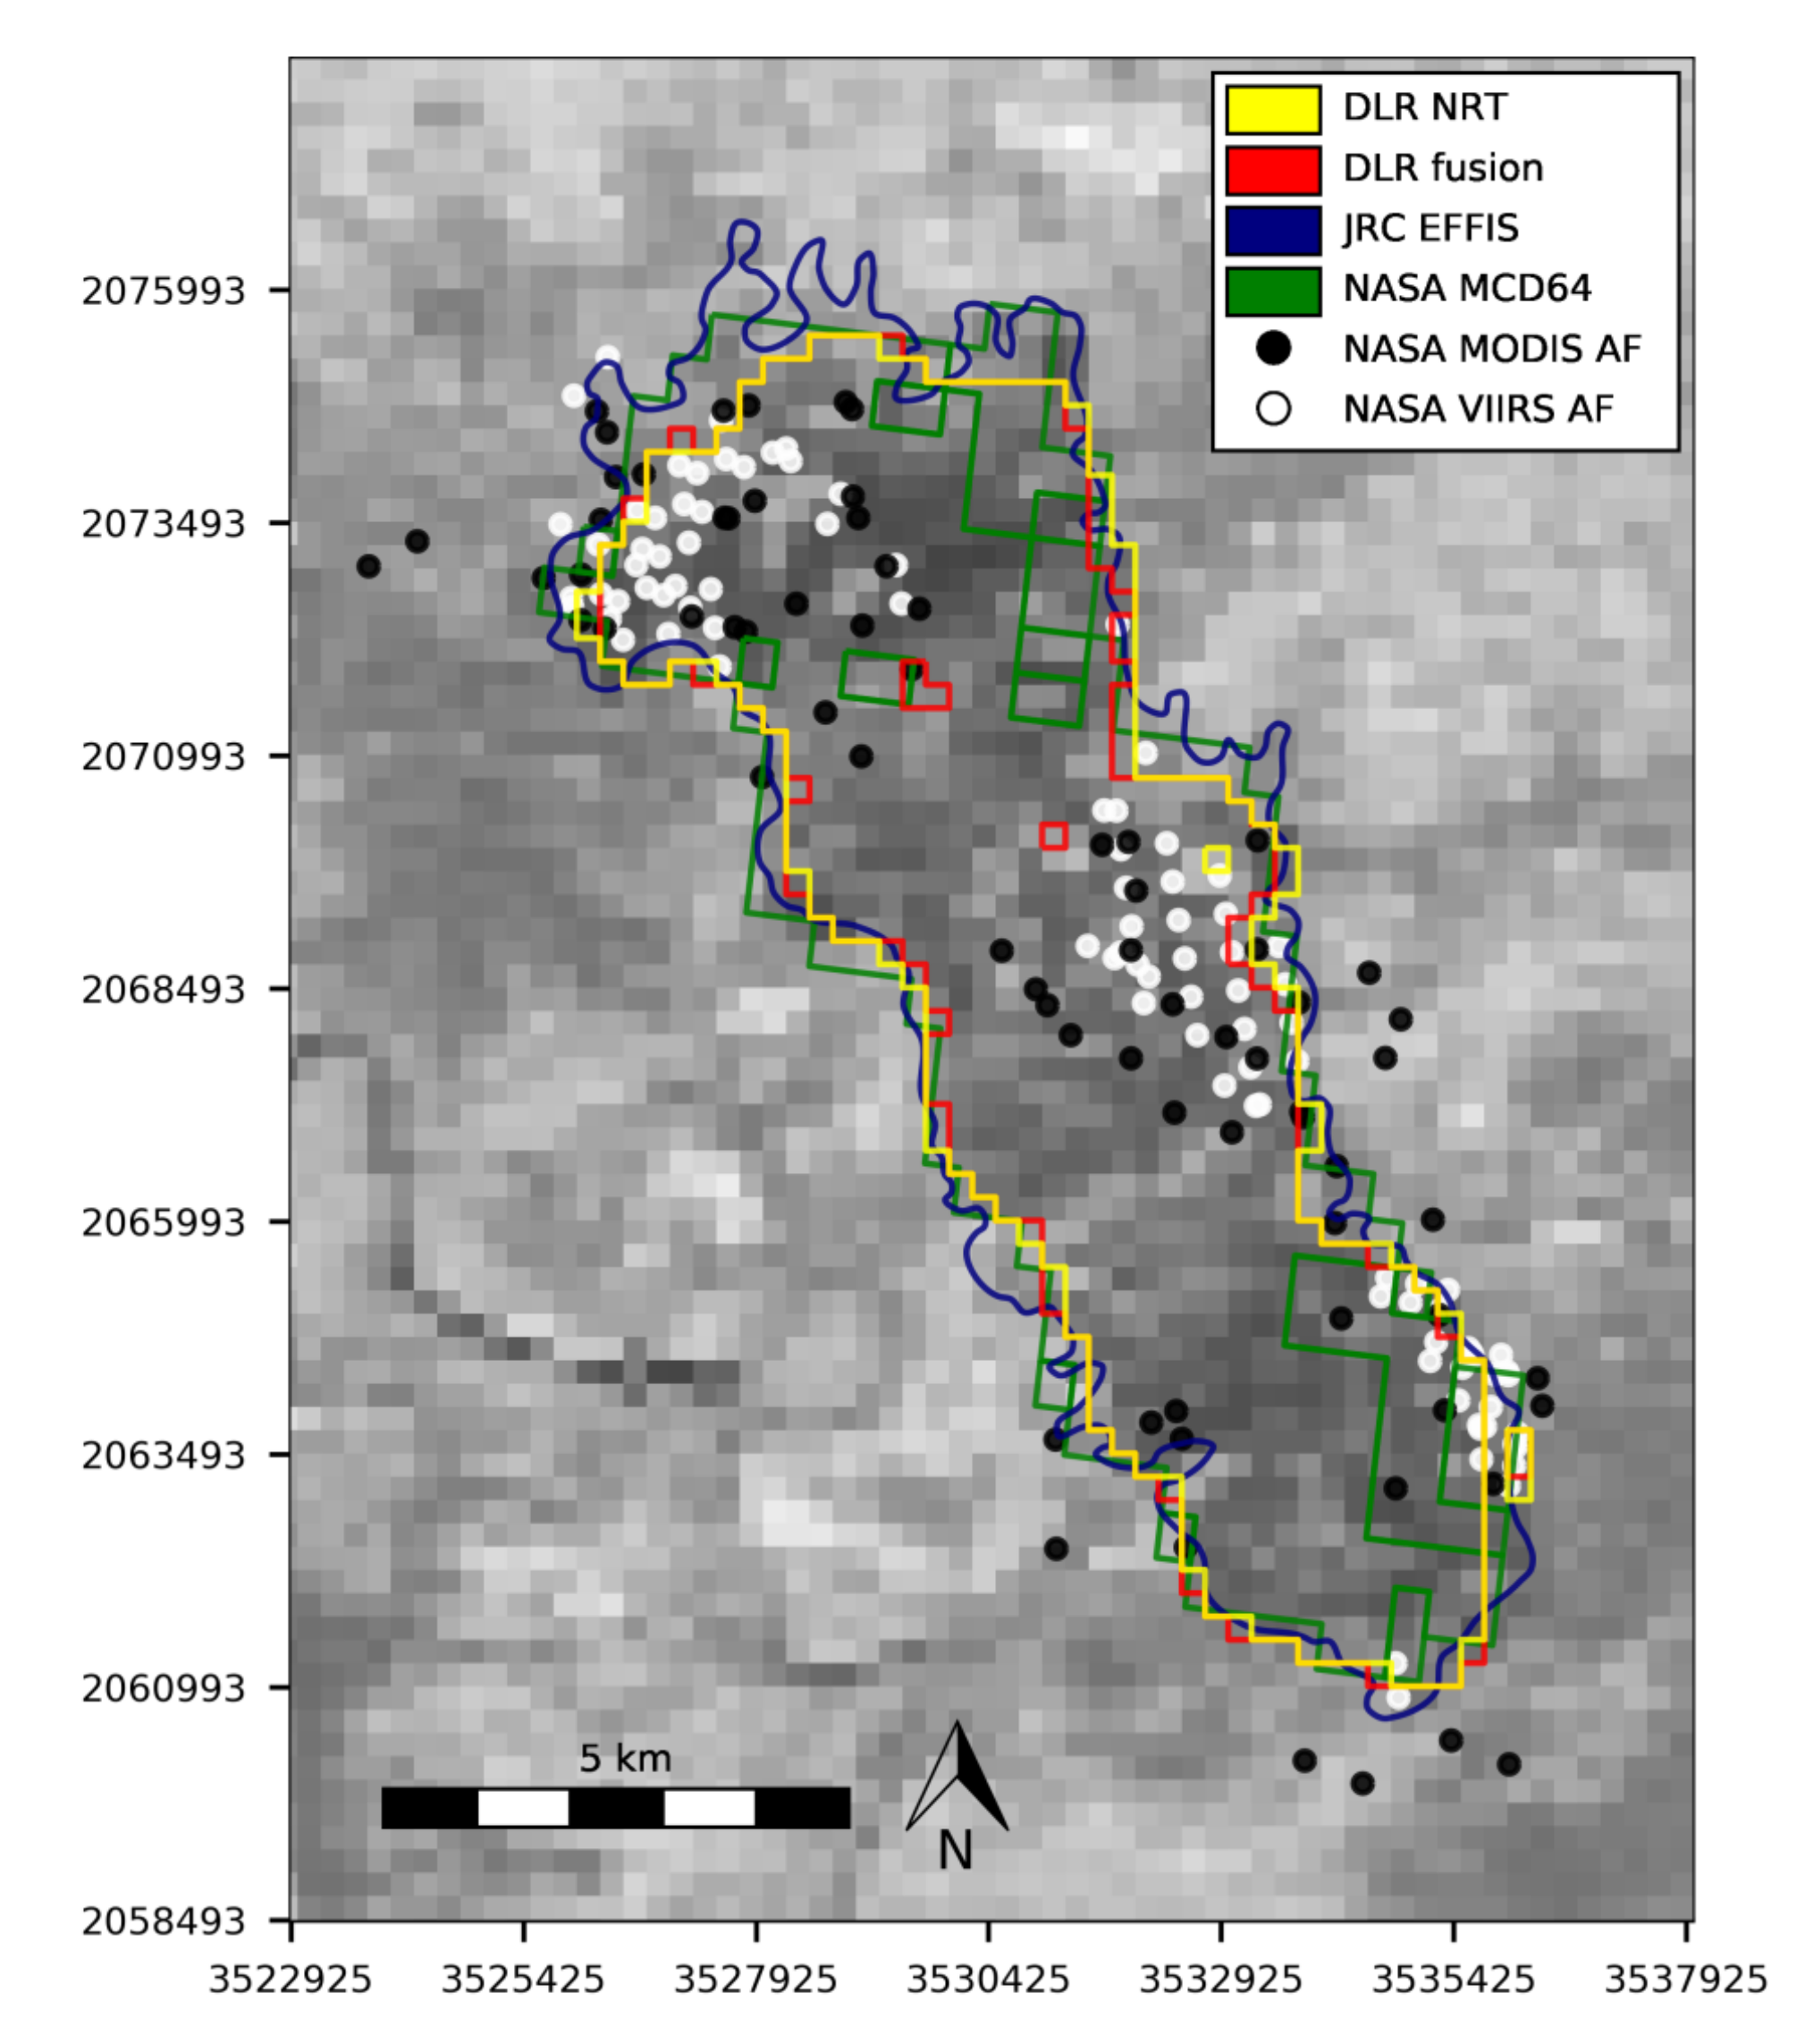
3.3. Timeliness Analysis

Figure 5 depicts the development of a burnt area in Catalonia, Spain, over several consecutive days in June 2019. Each column shows burnt area perimeters available from a specific dataset on a given day, with the NIR band of an AQUA/TERRA MODIS overpass in close temporal proximity to the detection used as a background. The first two rows show the burnt area perimeter results derived with the presented methodology (both NRT and fusion mode). In NRT mode (row a), only a single post scene is used for the BA generation. When several overpasses are available for the same day, the results are shown with differing colors. For fusion mode (row b), a post scene mosaic is generated, consisting of data from the respective day and the day after. This represents the output when a refinement is performed one day after the actual acquisition. Row (c) features the results from JRC EFFIS BA. This dataset includes one initial shape and two refinements; the latter having been made available after the fire has ceased. The NASA MCD64A1 result was only available with a delay of two months. The respective burnt area perimeter is contained in the MCD64A1v006 product of June 2019, which was published in September 2019. It is included as a reference for visual comparison.
The final perimeters of each dataset are depicted in Figure 6, to facilitate the direct comparison of the accuracy. This figure also shows the MODIS and VIIRS active fire locations, which represent the seed locations for the perimeter derivation using the presented methodology.

3.4. Operational Details of the Current Implementation

The current implementation of the processing chain allows for a complete burnt area monitoring for the area of Europe, Northern Africa and the Middle East twice per day, using Sentinel-3A/B and AQUA/TERRA MODIS input data. On average, 47 Sentinel-3A/B tiles and 6 partial AQUA/TERRA overpasses are analyzed per day, covering the whole area of Europe. The processing time for a single Sentinel-3 OLCI tile is typically in the range of 15 to 20 min on a single core of a current Computer Processing Unit (CPU). This includes the preprocessing of the original NetCDF format into a regularly spaced and projected GeoTIFF grid file. The analysis of a complete MODIS overpass usually takes about two hours. The parallelization of all processing steps is currently under development, which will speed up the process significantly. The final output is generated in the form of ESRI Shapefiles in Lambert Azimuthal Equal Area (LAEA) projection.

4. Discussion

In order to perform a robust validation of the presented methodology, accurate ground truth data of burnt area perimeters would be required for an extensive geographical region (such as continental-scale) over a significant range of time. Since such reference data are not available, two different approaches have been taken in this study to circumvent this shortcoming:
Firstly, quality checked BA data has been utilized, which was derived from high resolution optical data by the Copernicus EMS. These data are considered to be as close to actual ground truth information as possible. While it represents an excellent reference, it is not available on a large spatial or temporal scale, but is only prepared for specific incidents when the mapping service has been activated. For the applied study region and time range, EMS data for five incidents are available (cf. Section 3.1).
Secondly, to further allow conclusions regarding a larger spatial and temporal scale, three reference datasets were used for an inter-comparison, namely the MCD64A1 product by NASA, the Fire_cci 5.1 BA product by ESA and EFFIS BA data by JRC (cf. Section 3.2). It is important to recognize that the utilized reference datasets differ considerably regarding the total size and distribution of identified burnt area. This is due to the fact that the datasets are based on different methodologies and use differing data sources. The numbers in Table 3 illustrate this heterogeneity: while the amount of total burnt area is similar to some degree in the reference datasets, this number increases significantly for the combined and dissolved variant. This indicates that there is a distinguished variability in the spatial distribution of detected burnt area. As a result of the mentioned circumstances, none of the utilized reference datasets should be regarded to represent actual ground truth.
A comparison of several available burnt area datasets, including NASA MCD64A1, was performed by [51]. The authors compared the provided data against manually digitized burnt area perimeters. It was found that the commission error ratio was above 40% and omission error ratio was above 65% for all analyzed products. These error margins also lead to serious implications regarding the results of the inter-comparison presented in the results chapter (Section 3). It must be assumed that a significant amount of uncertainty is introduced to the analysis results by false positives and negatives included in the reference datasets. If a burnt area is detected in a region where the respective reference dataset does not feature a detection (false positive), it cannot be said for sure if the derived result is actually wrong, or if the area is just missing in the reference data. Analogous implications exist for false negatives. Furthermore, the differing resolutions and required coordinate system transformations of the utilized reference datasets introduce inaccuracies, which affect the comparison results regarding overlapping area. Yet, the comparison with these established datasets is considered to yield valuable insight regarding the quality of the generated products. All three mentioned datasets are available on continental scale and feature burnt area data for an extensive time range of several years to even decades in the case of MCD64A1. This comprehensiveness offers a rich basis for inter-comparison on a larger spatial and temporal scale, which would be impossible using actual ground truth data. Especially the NASA product has been used for burnt area inter-comparison in research studies, e.g., by [52,53] for fire activity in the Brazilian Savannas, and is thus regarded to represent a reliable data source, while considering the mentioned restrictions.
The results for the single incident analysis (cf. Section 3.1, Table 2) show that NRT as well as fusion mode are capable of producing satisfactory results, with true positives ranging between 52.6% and 90.5%. Of the five testing sites, best results were yielded for the fire in Kalamos/Greece, which is depicted in Figure 3 on the left side. In this case, the burnt area forms an extensive and contiguous shape, so that the differing resolutions of the DLR results and the reference data have only little influence. Another situation is shown on the right side, for the study site of Zakynthos/Greece. Here, the total area is composed of multiple small-scale regions, which can only be distinguished using high resolution data. When a mid-resolution optical sensor is utilized, as is the case here, this fragmented structures lead to mixed pixels which are not marked as burnt area by the presented methodology. Next to the area fragmentation, the absence of active fire information has been found to be the most important cause of false negatives, as was the case for the study site of Leon/Spain. However, even rather sparse and unevenly distributed active fire locations are sufficient to derive accurate burnt area perimeters, as can be seen in Figure 6. Furthermore, false negatives are also caused by burnt areas which are too small to be detected by a mid-resolution sensor. The minimum required size has been found to be at least three pixels, corresponding to 18.75 ha for MODIS and 27 ha for Sentinel-3 OLCI, respectively.
Regarding the country-wide inter-comparison, the presented methodology also shows a good performance (cf. Table 3). When comparing DLR NRT results with the JRC EFFIS dataset, the true positives account for 75.9%. A similar value of 74.7% is gained regarding the NASA MCD64A1 dataset. The number of reference polygons intersected by DLR NRT data accounts for 85.8% for the EFFIS reference, and 80.6% regarding MCD64A1. The comparison with the ESA Fire_cci 5.1 BA data yields lower values compared to the first two references. The analysis shows a percentage of 62.9% regarding overlapping area (true positives). 65.6% of Fire_cci 5.1 BA polygons are intersected by DLR NRT data. The values for fusion mode show a very similar performance compared with NRT mode, regarding true positives. False positives are reduced by several percent.
However, false positives are noticeably high, both for NRT and fusion mode. The DLR results contain a considerable size of burnt area not present in the reference datasets. The single incident analysis shows no anomalies regarding the extent of single burnt areas, so the high values are not an effect of general spatial overestimation. Instead, the DLR NRT and fusion datasets contain a significantly higher number of polygons than the EFFIS and MCD64A1 datasets. Regarding Fire_cci 5.1 BA, these numbers are more leveled. When checking the DLR data against a combined version of the three reference datasets (cf. Table 3, rightmost column), the percentages of false positives are considerably lower (39.2% for NRT and 36.1% for fusion mode). This indicates that DLR burnt area detections, which are categorized as false positive regarding a specific reference, might actually be contained in at least one of the other reference datasets, and could therefore be correct. A source for the discrepancies between the datasets might be the different approaches regarding agricultural burning.
However, regarding NRT mode, false positives could also be a result of cloud shadowing. Should an active fire seed pixel be located within a shadowed area, the size of the derived burnt area is prone to be overestimated. To mitigate this problem, cloud shadows are, to this point, removed using a buffer zone of a fixed size. However, the actual extent of such shadows varies greatly with the season, the time of day, as well as with the height of the clouds above the surface. Developments using a hill shadowing method based on a Digital Elevation Model (DEM) and the solar zenith angle have so far not yielded satisfactory results, since the discrimination between shadow-related false detections and actual, shadowed burnt areas remains a difficult problem in NRT processing. When using the fusion mode, a pixel featuring a low N D V I p o s t is replaced if subsequent scenes feature a higher N D V I p o s t value for that location. The effect of shadowing is therefore efficiently mitigated.
Another problem arises through differing lighting conditions and acquisition angles, which is inherent in the generation of the pre and post mosaics. This shortcoming could only be overcome using an extensive time series approach. The BRDF product proposed by [54] requires at least seven cloud-free observations during a 16-day period. Since the presented method is targeted at NRT processing, this approach is not feasible. However, the utilized NVDI implicitly contains a directional correction because the BRDF effects are similar in the two incorporated bands [42].
To allow a better placement of the presented results, the following Table 4 compares the utilized reference datasets with one another. The EFFIS BA dataset, for example, features 74.4% true positives when MCD64A1 is used as a reference, and 54.7% regarding Fire_cci 5.1 BA. These numbers are in accordance with results acquired with the presented methodology.
Regarding timeliness analysis, Figure 5 shows that an accurate result regarding the burnt area perimeter can be achieved through NRT mode, within two hours after the satellite overpass. Smoke columns will, however, lead to overestimations and thus decrease the product quality (see Figure 5, sub-figure A1). If the fire has already ceased and no smoke is visible in the imagery, NRT mode produces similar results to the fusion mode. This can be seen when comparing Figure 5, sub-figures A2 and B1. While the system is primarily designed for burnt area detection in NRT, when time is of the essence, the possibility to perform refinements as soon as new data becomes available represents a valuable feature. Error sources such as smoke plumes and cloud shadows can thus be reduced. It has to be noted, however, that the amount of true positives is also slightly decreased regarding the country-wide analysis. A time range of six days has been used for the post mosaic generation in this study. It is assumed that the spectral reflectance of the burnt area already started to normalize even in this short time range, at least for specific biomes.
Current and future testing aims at raising the completeness of the output by introducing deep learning technologies. The implementation will operate by using the burnt area polygons created with the described methodology in combination with a convolutional neural network (CNN). The model is trained on the current scene with hitherto detected burnt areas, which are featuring a high (>65%) confidence value. The model is then applied to the scene in order to additionally identify regions which have formerly been neglected due to lack of active fire locations. This approach is supposed to further enhance the product completeness and therefore the overall quality.
The advantage of the presented methodology lies not only in the availability of BA products in near real-time, but also in its adaptability to a variety of sensors. This is due to the fact that only a minimal set of input data is sufficient. As a consequence, a high temporal resolution is possible when monitoring wildfire activity, even on continental scale. Mid-resolution optical sensors featuring red and NIR channels, such as Advanced Very High Resolution Radiometer (AVHRR) and VIIRS, can be used without adaptation of the implementation. The utilization of high resolution Sentinel-2 MultiSpectral Instrument (MSI) is possible as well, although its low temporal resolution makes it unsuited for near-real time monitoring. Tests are currently undertaken with hyper-spectral sensors, such as the DLR Earth Sensing Imaging Spectrometers (DESIS) instrument [55] onboard the International Space Station (ISS), which provides test data for the future Environmental Mapping and Analysis Program (EnMap) mission [56].

5. Conclusions

The goal of this study is to develop a fully automatic methodology for burnt area monitoring on a continental scale in near-real time. The system is furthermore intended to be applicable to the majority of current optical mid-resolution sensors. This work does not aim to replace existing, established datasets, but addresses a shortage regarding the timeliness of currently available burnt area data. So far, automatically generated, continental-scale datasets are only available with a considerable time lag of several months. In case of semi-automatical derivation, burnt area perimeters are not generated at night or during weekends. The derivation of accurate perimeters in near-real time represents a challenge regarding implementation effort, output accuracy and processing speed. Yet, it could be shown that the developed processing chain can derive burnt area perimeters of satisfying accuracy within two hours after the satellite scene acquisition. Two sensors, MODIS and Sentinel-3 OLCI, have been used in this study to demonstrate the method’s transferability. Next to results being produced in near real-time, the system also offers the functionality to perform refinements as soon as new sensor data becomes available. The performance has been shown to be comparable with established datasets; although, as mentioned above, these references are either not available in NRT, or they are not operating fully automatic. True positives range between 91% to 53% for semi-automatically derived single incident validation data, and 63% to 76% when comparing to large-scale reference datasets. In conclusion, the presented methodology allows for continental-scale, multi-satellite burnt area monitoring in near-real time and thus represents a valuable improvement for wildfire related rapid damage assessment.

Author Contributions

Conceptualization, M.N., S.P. and T.R.; data curation, M.N.; formal analysis, M.N.; methodology, M.N.; project administration, T.R.; software, M.N.; validation, M.N.; visualization, M.N.; writing—original draft, M.N.; writing—review and editing, S.P. and T.R. All authors have read and agreed to the published version of the manuscript.

Funding

This research received no external funding.

Conflicts of Interest

The authors declare no conflict of interest.

References

  1. Bowman, D.; Balch, J.; Artaxo, P.; Bond, W.; Carlson, J.; Cochrane, M.; D’Antonio, C.; DeFries, R.; Doyle, J.; Harrison, S. Fire in the Earth system. Science 2009, 324, 481–484. [Google Scholar] [CrossRef] [PubMed]
  2. Viegas, D.; Ribeiro, L.; Viegas, M.; Pita, L.; Rossa, C. Impacts of fire on society: Extreme fire propagation issues. In Earth Observation of Wildland Fires in Mediterranean Ecosystems; Springer: Berlin/Heidelberg, Germany, 2009; pp. 97–109. [Google Scholar]
  3. Flannigan, M.; Stocks, B.; Weber, M. Fire regimes and climatic change in Canadian forests. In Fire and Climatic Change in Temperate Ecosystems of the Western Americas; Springer: New York, NY, USA, 2003; pp. 97–119. [Google Scholar]
  4. Kasischke, E.; Stocks, B. Fire, Climate Change, and Carbon Cycling in the Boreal Forest; Springer Science & Business Media: New York, NY, USA, 2012; Volume 138. [Google Scholar]
  5. Jørgensen, S. Ecosystem Ecology; Academic Press: Cambridge, MA, USA, 2009. [Google Scholar]
  6. Withey, K.; Berenguer, E.; Palmeira, A.; Espírito-Santo, F.; Lennox, G.; Silva, C.; Aragão, L.; Ferreira, J.; França, F.; Malhi, Y.; et al. Quantifying immediate carbon emissions from El Niño-mediated wildfires in humid tropical forests. Philos. Trans. R. Soc. B Biol. Sci. 2018, 373, 20170312. [Google Scholar] [CrossRef] [Green Version]
  7. Surawski, N.; Sullivan, A.; Roxburgh, S.; Polglase, P. Estimates of greenhouse gas and black carbon emissions from a major Australian wildfire with high spatiotemporal resolution. J. Geophys. Res. Atmos. 2016, 121, 9892–9907. [Google Scholar] [CrossRef]
  8. Wotton, B. Interpreting and using outputs from the Canadian Forest Fire Danger Rating System in research applications. Environ. Ecol. Stat. 2009, 16, 107–131. [Google Scholar] [CrossRef]
  9. Chuvieco, E.; Mouillot, F.; van der Werf, G.; San Miguel, J.; Tanasse, M.; Koutsias, N.; García, M.; Yebra, M.; Padilla, M.; Gitas, I. Historical background and current developments for mapping burned area from satellite earth observation. Remote Sens. Environ. 2019, 225, 45–64. [Google Scholar] [CrossRef]
  10. Giglio, L.; Boschetti, L.; Roy, D.; Humber, M.; Justice, C. The Collection 6 MODIS burned area mapping algorithm and product. Remote Sens. Environ. 2018, 217, 72–85. [Google Scholar] [CrossRef]
  11. Giglio, L.; Justice, C.; Boschetti, L.; Roy, D. MCD64A1 MODIS/TERRA + AQUA Burned Area Monthly l3 Global 500 m Sin Grid v006 [Data Set]; NASA EOSDIS Land Processes DAAC: Sioux Falls, SD, USA, 2015. [Google Scholar]
  12. Chuvieco, E.; Pettinari, M.; Lizundia-Loiola, J.; Storm, T.; Padilla Parellada, M. ESA Fire Climate Change Initiative (Fire_cci): MODIS Fire_cci Burned Area Pixel Product, version 5.1; Centre for Environmental Data Analysis: Didcot, UK, 2018. [Google Scholar] [CrossRef]
  13. Lizundia-Loiola, J.; Otón, G.; Ramo, R.; Chuvieco, E. A spatio-temporal active-fire clustering approach for global burned area mapping at 250 m from MODIS data. Remote Sens. Environ. 2020, 236, 111493. [Google Scholar] [CrossRef]
  14. Roy, D.; Jin, Y.; Lewis, P.; Justice, C. Prototyping a global algorithm for systematic fire-affected area mapping using MODIS time series data. Remote Sens. Environ. 2005, 97, 137–162. [Google Scholar] [CrossRef]
  15. Zhang, H.; Roy, D.; Yan, L.; Li, Z.; Huang, H.; Vermote, E.; Skakun, S.; Roger, J.-C. Characterization of Sentinel-2A and Landsat-8 top of atmosphere, surface, and nadir BRDF adjusted reflectance and NDVI differences. Remote Sens. Environ. 2018, 215, 482–494. [Google Scholar] [CrossRef]
  16. Roy, D.; Lewis, P.; Justice, C. Burned area mapping using multi-temporal moderate spatial resolution data—A bi-directional reflectance model-based expectation approach. Remote Sens. Environ. 2002, 83, 263–286. [Google Scholar] [CrossRef]
  17. Giglio, L.; Loboda, T.; Roy, D.; Quayle, B.; Justice, C. An active-fire based burned area mapping algorithm for the MODIS sensor. Remote Sens. Environ. 2009, 113, 408–420. [Google Scholar] [CrossRef]
  18. San-Miguel-Ayanz, J.; Schulte, E.; Schmuck, G.; Camia, A.; Strobl, P.; Libertà, G.; Giovando, C.; Boca, R.; Sedano, F.; Kempeneers, P.; et al. Comprehensive monitoring of wildfires in europe: The European Forest Fire Information System (EFFIS). In Approaches to Managing Disaster—Assessing Hazards, Emergencies and Disaster Impacts; Tiefenbacher, J., Ed.; IntechOpen: London, UK, 2012; pp. 87–105. ISBN 978-953-51-0294-6. [Google Scholar]
  19. Fraser, R.; Li, Z.; Cihlar, J. Hotspot and NDVI differencing synergy (HANDS): A new technique for burned area mapping over boreal forest. Remote Sens. Environ. 2000, 74, 362–376. [Google Scholar] [CrossRef]
  20. Li, Z.; Nadon, S.; Cihlar, J.; Stocks, B. Satellite-based mapping of Canadian boreal forest fires: Evaluation and comparison of algorithms. Int. J. Remote Sens. 2000, 21, 3071–3082. [Google Scholar] [CrossRef]
  21. Pu, R.; Gong, P.; Li, Z.; Scarborough, J. A dynamic algorithm for wildfire mapping with NOAA/AVHRR data. Int. J. Wildland Fire 2004, 13, 275–285. [Google Scholar] [CrossRef] [Green Version]
  22. Gong, P.; Pu, R.; Li, Z.; Scarborough, J.; Clinton, N.; Levien, L. An integrated approach to wildland fire mapping of California, USA using NOAA/AVHRR data. Photogramm. Eng. Remote Sens. 2006, 72, 139–150. [Google Scholar] [CrossRef]
  23. Ramo, R.; Chuvieco, E. Developing a random forest algorithm for MODIS global burned area classification. Remote Sens. 2017, 9, 1193. [Google Scholar] [CrossRef] [Green Version]
  24. Petropoulos, G.P.; Kontoes, C.; Keramitsoglou, I. Burnt area delineation from a uni-temporal perspective based on Landsat TM imagery classification using support vector machines. Int. J. Appl. Earth Obs. Geoinf. 2011, 13, 70–80. [Google Scholar] [CrossRef]
  25. Pinto, M.; Libonati, R.; Trigo, R.; Trigo, I.; DaCamara, C. A deep learning approach for mapping and dating burned areas using temporal sequences of satellite images. ISPRS J. Photogramm. Remote Sens. 2020, 160, 260–274. [Google Scholar] [CrossRef]
  26. Chan, T.; Vese, L. An active contour model without edges. In International Conference on Scale-Space Theories in Computer Vision; Springer: Berlin/Heidelberg, Germany, 1999; pp. 141–151. [Google Scholar]
  27. MODIS Characterization Support Team (MCST). MODIS Characterization Support Team (MCST). MODIS 250m Calibrated Radiances Product. In NASA MODIS Adaptive Processing System; Goddard Space Flight Center: Greenbelt, MD, USA, 2017. [Google Scholar] [CrossRef]
  28. Giglio, L.; Justice, C. MOD14A2 MODIS/Terra Thermal Anomalies/Fire 8-Day L3 Global 1km SIN Grid V006 [Data set], 2015, NASA EOSDIS Land Processes DAAC. Available online: https://doi.org/10.5067/MODIS/MOD14A2.006 (accessed on 4 March 2020).
  29. NASA Direct Readout. CREFL Version 1.7.1 Released—12/9/2010. Available online: https://directreadout.sci.gsfc.nasa.gov/?id=dspContent&cid=91 (accessed on 6 April 2020).
  30. Vermote, E. MOD09Q1 MODIS/Terra Surface Reflectance 8-Day L3 Global 250m SIN Grid V006 [Data set], 2015, NASA EOSDIS Land Processes DAAC. Available online: https://doi.org/10.5067/MODIS/MOD09Q1.006 (accessed on 4 March 2020).
  31. Platnick, S.; Meyer, K.; King, M.; Wind, G.; Amarasinghe, N.; Marchant, B.; Arnold, G.; Zhang, Z.; Hubanks, P.; Holz, R. The MODIS cloud optical and microphysical products: Collection 6 updates and examples from Terra and Aqua. IEEE Trans. Geosci. Remote Sens. 2016, 55, 502–525. [Google Scholar] [CrossRef] [Green Version]
  32. EUMETSAT. CODA (Copernicus Online Data Access). Available online: https://coda.eumetsat.int/#/home (accessed on 6 April 2020).
  33. Donlon, C.; Berruti, B.; Buongiorno, A.; Ferreira, M.; Féménias, P.; Frerick, J.; Goryl, P.; Klein, U.; Laur, H.; Mavrocordatos, C.; et al. The global monitoring for environment and security (GMES) sentinel-3 mission. Remote Sens. Environ. 2012, 120, 37–57. [Google Scholar] [CrossRef]
  34. Bossard, M.; Feranec, J.; Otahel, J. CORINE Land Cover Technical Guide: Addendum 2000. 2000. Available online: https://www.eea.europa.eu/publications/tech40add (accessed on 6 April 2020).
  35. Friedl, M.; Sulla-Menashe, D. MCD12Q1 MODIS/Terra+Aqua Land Cover Type Yearly L3 Global 500m SIN Grid V006 [Data set], 2019, NASA EOSDIS Land Processes DAAC. Available online: https://doi.org/10.5067/MODIS/MCD12Q1.006 (accessed on 4 March 2020).
  36. Rouse, J.; Haas, R.; Schell, J.; Deering, D. Monitoring the Vernal Advancement and Retrogradation (Green Wave Effect) of Natural Vegetation; Prog. Rep. RSC 1978-1; Remote Sensing Center, Texas A&M Univ.: College Station, TX, USA, 1973. [Google Scholar]
  37. Chuvieco, E.; Martin, M.; Palacios, A. Assessment of different spectral indices in the red-near-infrared spectral domain for burned land discrimination. Int. J. Remote Sens. 2002, 23, 5103–5110. [Google Scholar] [CrossRef]
  38. Escuin, S.; Navarro, R.; Fernandez, P. Fire severity assessment by using NBR (Normalized Burn Ratio) and NDVI (Normalized Difference Vegetation Index) derived from Landsat TM/ETM images. Int. J. Remote Sens. 2008, 29, 1053–1073. [Google Scholar] [CrossRef]
  39. Pereira, J. A comparative evaluation of NOAA/AVHRR vegetation indexes for burned surface detection and mapping. IEEE Trans. Geosci. Remote Sens. 1999, 37, 217–226. [Google Scholar] [CrossRef]
  40. Key, C.; Benson, N. Measuring and remote sensing of burn severity. In Proceedings Joint Fire Science Conference and Workshop; University of Idaho: Moscow, ID, USA; International Association of Wildland Fire: Fairfield, WA, USA, 1999; Volume 2. [Google Scholar]
  41. Plank, S.; Martinis, S. A fully automatic burnt area mapping processor based on AVHRR imagery—A timeline thematic processor. Remote Sens. 2018, 10, 341. [Google Scholar] [CrossRef] [Green Version]
  42. Vermote, E.; Justice, C.; Bréon, F.-M. Towards a generalized approach for correction of the BRDF effect in MODIS directional reflectances. IEEE Trans. Geosci. Remote Sens. 2008, 47, 898–908. [Google Scholar] [CrossRef]
  43. National Aeronautics and Space Administration. Fire Information for Resource Management System (FIRMS). Available online: https://firms.modaps.eosdis.nasa.gov (accessed on 1 January 2020).
  44. Chan, T.; Vese, L. Active contours without edges. IEEE Trans. Image Process. 2001, 10, 266–277. [Google Scholar] [CrossRef] [Green Version]
  45. Caselles, V.; Kimmel, R.; Sapiro, G. Geodesic active contours. Int. J. Comput. Vis. 1997, 22, 61–79. [Google Scholar] [CrossRef]
  46. Marquez-Neila, P.; Baumela, L.; Alvarez, L. A morphological approach to curvature-based evolution of curves and surfaces. IEEE Trans. Pattern Anal. Mach. Intell. 2013, 36, 2–17. [Google Scholar] [CrossRef]
  47. Álvarez, L.; Baumela, L.; Henríquez, P.; Márquez-Neila, P. Morphological snakes. In Proceedings of the 2010 IEEE Computer Society Conference on Computer Vision and Pattern Recognition, San Francisco, CA, USA, 13–18 June 2010; pp. 2197–2202. [Google Scholar]
  48. Liu, Y.; Dai, Q.; Liu, J.; Liu, S.; Yang, J. Study of burn scar extraction automatically based on level set method using remote sensing data. PLoS ONE 2014, 9, e87480. [Google Scholar] [CrossRef]
  49. Yan, L.; Roy, D. Conterminous United States crop field size quantification from multi-temporal Landsat data. Remote Sens. Environ. 2016, 172, 67–86. [Google Scholar] [CrossRef] [Green Version]
  50. San-Miguel-Ayanz, J.; Durrant, T.; Boca, R.; Libertà, G.; Branco, A.; de Rigo, D.; Ferrari, D.; Maianti, P.; Artés Vivancos, T.; Oom, D.; et al. Forest fires in Europe, Middle East and North Africa 2018; Joint Research Centre Technical Report; Publications Office of the European Union: Luxembourg, 2018. [Google Scholar]
  51. Padilla, M.; Stehman, S.; Ramo, R.; Corti, D.; Hantson, S.; Oliva, P.; Alonso-Canas, I.; Bradley, A.; Tansey, K.; Mota, B. Comparing the accuracies of remote sensing global burned area products using stratified random sampling and estimation. Remote Sens. Environ. 2015, 160, 114–121. [Google Scholar] [CrossRef] [Green Version]
  52. Rodrigues, J.; Libonati, R.; Pereira, A.; Nogueira, J.; Santos, F.; Peres, L.; Santa Rosa, A.; Schroeder, W.; Pereira, J.; Giglio, L. How well do global burned area products represent fire patterns in the Brazilian Savannas biome? An accuracy assessment of the MCD64 collections. Int. J. Appl. Earth Obs. Geoinf. 2019, 78, 318–331. [Google Scholar] [CrossRef]
  53. Libonati, R.; DaCamara, C.; Setzer, A.; Morelli, F.; Melchiori, A. An algorithm for burned area detection in the Brazilian Cerrado using 4 μ MODIS imagery. Remote Sens. 2015, 7, 15782–15803. [Google Scholar] [CrossRef] [Green Version]
  54. Schaaf, C.; Gao, F.; Strahler, A.; Lucht, W.; Li, X.; Tsang, T.; Strugnell, N.; Zhang, X.; Jin, Y.; Muller, J.-P. First operational BRDF, albedo nadir reflectance products from MODIS. Remote sensing of Environment 2002, 83, 135–148. [Google Scholar] [CrossRef] [Green Version]
  55. Müller, R.; Avbelj, J.; Carmona, E.; Gerasch, B.; Graham, L.; Günther, B.; Heiden, U.; Kerr, G.; Knodt, U.; Krutz, D.; et al. The new hyperspectral sensor DESIS on the multi-payload platform MUSES installed on the ISS. Int. Arch. Photogramm. Remote Sens. Spat. Inf. Sci. 2016, 41, 461–467. [Google Scholar] [CrossRef]
  56. Earth Observation Center EOC of DLR. Welcome to EnMAP. Available online: http://www.enmap.org/sites/default/files/pdf/pub/Web_EnMAP_2018_eng.pdf (accessed on 5 March 2020).
Figure 1. Diagram of the operating chain, showing the steps which are performed in order to derive burnt area information.
Remotesensing 12 02162 g001
Figure 2. Evolution of the burnt area perimeter curve using Morphological Active Contours (MorphACWE) for a fire in Northern Portugal, summer 2016. The NIR channel of a Sentinel-3 Ocean and Land Color Instrument (OLCI) post scene is used as background. (a) Initial state of the curve. (b) State after 10 iteration steps. (c) State after 25 iteration steps. (d) Final state after 50 iteration steps.
Remotesensing 12 02162 g002
Figure 3. Burnt area perimeter results, shown together with Copernicus EMS reference data. Background: NIR channel of a post-fire Sentinel-3 OLCI scene. (a) Study region of Kalamos/Greece. (b) Extract of the study region of Zakynthos/Greece.
Remotesensing 12 02162 g003
Figure 4. Burnt area results derived from Sentinel-3 OLCI data for Northern Portugal, for the testing period of August, 2017. The region highlighted by the ellipse illustrates that the algorithm correctly only reports burnt areas occurring within the predetermined time span. Background: NIR channel of a Sentinel-3 OLCI scene from end of August, 2017.
Remotesensing 12 02162 g004
Figure 5. Inter-comparison of derived results and reference datasets, visualized in the order of the respective release date. Backgrounds: NIR channel of AQUA/TERRA Moderate-resolution Imaging Spectroradiometer (MODIS) post scenes in close temporal proximity to the detection. (a) Results of German Aerospace Center (DLR) NRT mode. (b) Results of DLR fusion mode. (c) Joint Research Center of the European Commission (JRC) European Forest Fire Information System (EFFIS) Burnt Area (BA) reference data. (d) National Aeronautics and Space Administration (NASA) MCD64A1 reference data.
Remotesensing 12 02162 g005
Figure 6. Combined visualization of final results and reference datasets. Active fire (AF) locations from MODIS and VIIRS (black and white dots, respectively) are additionally shown.
Remotesensing 12 02162 g006
Table 1. Listing of the study areas and utilized reference data sources.
RegionDateSensorReference
Single incident
analysis
Jaen/Spain2017/08/03S3A-OLCICopernicus EMS
Corsica/France2017/08/11S3A-OLCICopernicus EMS
Kalamos/Greece2017/08/11S3A-OLCICopernicus EMS
Zakynthos/Greece2017/08/11S3A-OLCICopernicus EMS
Leon/Spain2017/08/22S3A-OLCICopernicus EMS
Large scale
analysis
(country-wide)
Spain, Portugal,
Greece, Italy, France
2017/08/01–
2017/08/31
S3A-OLCIJRC EFFIS BA
Spain, Portugal,
Greece, Italy, France
2017/08/01–
2017/08/31
S3A-OLCINASA MCD64A1
Spain, Portugal,
Greece, Italy, France
2017/08/01–
2017/08/31
S3A-OLCIESA Fire_cci 5.1 BA
Accuracy and
timeliness analysis
Near Lleida,
Catalonia/Spain
2019/06/27–
2019/07/02
AQUA/TERRA MODISJRC EFFIS BA
Table 2. Single incident analysis: validation of Sentinel-3 OLCI results with Copernicus Emergency Mapping Service data.
Jaen/SpainCorsica/FranceKalamos/GreeceZakynthos/GreeceLeon/Spain
Total BA
in reference
606 ha1160 ha2969 ha1278 ha9519.12 ha
NRT mode
True positives85.8 %73.7 %90.5 %55.9 %52.6 %
False negatives14.2 %26.3 %9.5 %44.1 %47.4 %
False positives21.1 %33.4 %11.0 %21.6 %14.5 %
Fusion mode
True positives80.3 %64.3 %89.2 %55.0 %59.4 %
False negatives19.7 %35.7 %10.8 %45.0 %40.6 %
False positives14.7 %27.3 %10.3 %21.1 %16.8 %
Table 3. Large scale analysis: Comparison of Sentinel-3 OLCI results with reference datasets.
JRC EFFIS BANASA MCD64A1ESA Fire_cci 5.1 BACombined
Total BA
in reference
(with number of
polygons in brackets)
153,330 ha (155)157,187 ha (165)185,266 ha (285)270,133.70 ha (351)
NRT mode
True positives75.9% (133)74.7% (133)62.9% (187)57.8% (206)
False negatives24.1%25.3%37.1%42.2%
False positives95.1%92.1%78.6%39.2%
Fusion mode
True positives73.3% (130)72.0% (131)60.1% (174)55.0% (195)
False negatives26.7%28.0%39.9%45.0%
False positives87.2%84.5%72.7%36.1%
Table 4. Inter-comparison of BA reference datasets.
JRC EFFIS BANASA MCD64A1ESA Fire_cci 5.1 BA
JRC EFFIS BA
True positivesX74.4 %54.7 %
False negativesX25.8 %45.3 %
False positivesX26.8 %31.0 %
NASA MCD64A1
True positives76.0 %X55.2 %
False negatives24.0 %X44.8 %
False positives27.5 %X30.5 %
ESA Fire_cci 5.1 BA
True positives66.1 %66.5 %X
False negatives33.9 %33.5 %X
False positives37.4 %34.4 %X

