Article

Developing a Remote Sensing-Based Combined Drought Indicator Approach for Agricultural Drought Monitoring over Marathwada, India

by
Sneha S. Kulkarni
1,2,*,
Brian D. Wardlow
2,3,
Yared A. Bayissa
4,
Tsegaye Tadesse
2,
Mark D. Svoboda
2 and
Shirishkumar S. Gedam
1
1
Centre of Studies in Resources Engineering, Indian Institute of Technology-Bombay, Powai, Mumbai, Maharashtra 400076, India
2
National Drought Mitigation Center, School of Natural Resources, University of Nebraska-Lincoln, Lincoln, NE 68583, USA
3
Center for Advanced Land Management Information Technologies, School of Natural Resources, University of Nebraska-Lincoln, Lincoln, NE 68588, USA
4
School of Natural Resources, University of Nebraska-Lincoln, Lincoln, NE 68583-0988, USA
*
Author to whom correspondence should be addressed.
Remote Sens. 2020, 12(13), 2091; https://doi.org/10.3390/rs12132091
Submission received: 10 May 2020 / Revised: 14 June 2020 / Accepted: 21 June 2020 / Published: 30 June 2020
(This article belongs to the Section Remote Sensing in Agriculture and Vegetation)

Abstract

:
The increasing drought severities and consequent devastating impacts on society over the Indian semi-arid regions demand better drought monitoring and early warning systems. Operational agricultural drought assessment methods in India mainly depend on a single input parameter such as precipitation and are based on a sparsely located in-situ measurements, which limits monitoring precision. The overarching objective of this study is to address this need through the development of an integrated agro-climatological drought monitoring approach, i.e., combined drought indicator for Marathwada (CDI_M), situated in the central part of Maharashtra, India. In this study, satellite and model-based input parameters (i.e., standardized precipitation index (SPI-3), land surface temperature (LST), soil moisture (SM), and normalized difference vegetation index (NDVI)) were analyzed at a monthly scale from 2001 to 2018. Two quantitative methods were tested to combine the input parameters for developing the CDI_M. These methods included an expert judgment-based weight of each parameter (Method-I) and principle component analysis (PCA)-based weighting approach (Method-II). Secondary data for major types of crop yields in Marathwada were utilized to assess the CDI_M results for the study period. CDI_M maps depict moderate to extreme drought cases in the historic drought years of 2002, 2009, and 2015–2016. This study found a significant increase in drought intensities (p ≤ 0.05) and drought frequency over the years 2001–2018, especially in the Latur, Jalna, and Parbhani districts. In comparison to Method-I (r ≥ 0.4), PCA-based (Method-II) CDI_M showed a higher correlation (r ≥ 0.60) with crop yields in both harvesting seasons (Kharif and Rabi). In particular, crop yields during the drier years showed a greater association (r > 6.5) with CDI_M over Marathwada. Hence, the present study illustrated the effectiveness of CDI_M to monitor agricultural drought in India and provide improved information to support agricultural drought management practices.

1. Introduction

Droughts are one of the most devastating natural hazards over the globe, affecting millions of individuals in multiple ways (e.g., food security, economic losses, and migration). Megacities such as Delhi, Chennai, Karachi, Madrid, and Istanbul are already experiencing the extremely high risk of droughts, and many other regions could follow suit over the next few years [1]. In the developing countries and food-insecure areas of Asia [2] and Africa [3], droughts have a profound impact on a nation’s economy and the everyday needs of people. Therefore, it is necessary to monitor and evaluate drought conditions with high accuracy, which will help decision-makers in the timely development of mitigation strategies [4].
Drought is a complex phenomenon to assess because its definition varies by sector (e.g., agricultural versus hydrologic), and each event has its own unique set of characteristics. It can be described according to its spatio-temporal coverage, duration, and intensity [5], and its severity can be determined by a number of factors, such as lack of rainfall [6], groundwater depletion [7], soil moisture deficiency [8], or socioeconomic losses [9]. In India, many researchers have studied droughts addressing these different parameters. In the 1980s, various drought studies were generally based on single drought variables that included rainfall and monsoon (June, July, August, and September) anomalies [10,11,12]. More recently, Guhathakurta [13], and Mahajan and Dodamani [14] used the percent of normal precipitation (PNP) technique and identified the highest drought probability districts (>60%) for north India. The standardized precipitation index (SPI)-based research [15,16] marked the years 1972, 1987, 2002, 2009, and 2015 as severe-to-extreme drought years in India. Kripalani and Kulkarni [17] and Kumar et al. [18] experienced high episodes of severe droughts during El Niño events in comparison with normal and La-Niña activities over the Indian subcontinent, whereas Roxy et al. [19] stated that the rising sea surface temperature of the Indian Ocean is responsible for the declining trend in the Indian summer-monsoon and increasing drought severities.
In recent years, remote sensing and high-resolution model data have played a vital role in drought assessment over India. SPI- and standardized precipitation evaporation index (SPEI)-based studies highlighted the Indo-Gangetic Plains as a high drought frequency region [20], and research based on the temperature vegetation dryness index (TVDI), using MODIS products, studied changing levels of soil moisture in the Utter Pradesh [21]. Bhuiyan et al. [22] witnessed greater hydrological stress via the standardized water level index (SWI) when compared with the vegetation stress index (VCI) in the Aravalli terrain region of Rajasthan. The regional phenomenon of changing drought severities and its general shift towards south India, the Indo Gangetic Plains, and central Maharashtra was explained by Mallya et al. [23]. In the semi-arid regions of India, drought has become more frequent [24]. The first decade of the 2000s (2001–2010) was recorded as the warmest decade for India, and ocean–atmospheric systems are projected to result in a higher frequency of droughts over the next 30 year period (2020–2050) [25]. Hence, the development of highly accurate early warning systems and drought assessment techniques are of high priority for India as attention turns to a more proactive drought response.
From the food security and societal needs perspective, agro-meteorological types of droughts are probably one of the essential key aspects of the drought assessment. Impacts of droughts are usually first documented in the agricultural sector. The World Wildlife Fund (WWF) has also reported that 22% of most-consumed food grains (e.g., wheat) are cultivated in high to very high drought-prone regions [1]. Countries like India, in which 62% of the population is reliant on the farming sector, and 16% of the contribution to the nation’s gross domestic product is from an agrarian industry [26], illustrate how agro-climatological drought studies play a crucial role in informing the country’s drought monitoring needs. In India, various studies examined the trends in agricultural droughts with the aid of vegetation indices retrieved from remote sensing methods, which include NDVI, VCI, and vegetation temperature condition index (VTCI) [27,28,29,30,31]. However, until recently, there were very few comprehensive drought studies carried out over India that combine different environmental parameters that influence agricultural drought intensities. Drought is a result of variations in multiple agro-climatological settings rather than just a single environmental variable. Hence, the integration of several relevant environmental parameters is needed for improved drought monitoring capabilities that can better inform agricultural practices [28,32].
In the United States, Wu and Wilhite [33] derived an operational drought monitoring technique for crops like soybean and corn. They considered the crop-specific drought index (CSDI) and SPI for their analysis. In recent years, the vegetation drought response index (VegDRI) was established and implemented over the continental US [32,34], which has also been developed in Korea [35]. Sepulcre-Canto et al. [36] developed an integrated agricultural drought Index for Europe by considering the SPI, SM, and photosynthetically active radiation (fAPAR) as input variables. An expert judgment-based integrated drought index was developed for Morocco [37]. During their research, SPI, LST, ET, and NDVI were utilized as contributing parameters to derive the new index. To support the humanitarian aid organizations, a weighted, dependent-combined drought indicator was also implemented over Ethiopia [38].
In Indian scenarios, Patel and Yadav [28] integrated the modified rainfall anomaly index (MRAI) and the VCI to understand crop loss and its association with droughts over the Bundelkhand region. Zhang et al. [39] developed a concurrent drought analysis method for India. This technique considered the SPI, SSI, SRI, and VCI to observe the changes in wheat production over various parts of India. On a country scale, Shah and Mishra [7] have executed the integrated drought monitoring approach and identified the highest severity drought years (1965, 1987, 2002, and 2015) over multiple river basins. Other researchers [40,41,42] have also reported the potential usefulness of applying an integrated drought index technique in India. Marathwada is among the severely drought-affected parts of India, where more than 1500 farmers committed suicide during the recent, severe drought years of 2015–16 [43]. Swain et al. [44]; Kulkarni et al. [16]; and Purandare [45] have studied frequent droughts in Marathwada using rainfall as an input variable for analyzing a specific drought year. Still, most of these studies did not combine multiple agro-climatological factors. Over the last few decades, the Marathwada semi-arid region of India is experiencing more frequent and extreme drought events, which have unprecedented water scarcity and agricultural crises [43]. The global drought monitoring studies have also projected increasing drought severities over India in the near future [46]. These studies have marked the semi-arid regions of India as one of the major worldwide hot spots to experience the more frequent and severe droughts. Therefore, a thorough understanding of drought scenarios over the Indian semi-arid regions has a local as well as global importance.
Most of the drought monitoring studies in India and elsewhere are still lingering with the single input parameters and worked on the country or subcontinent level. But at a regional scale, limited efforts have been taken; even though region-specific studies are crucial for developing policies and drought mitigation strategies. Many researchers have never implemented grid-based weight assignment methods to combine different input variables for a better assessment of droughts. Moreover, a single combining approach is widely used in previous studies, but limited endeavors have been made so far in testing two or more combining approaches at a time. Area-specific studies always have a crucial part in the policy management and designing the region-wise drought mitigation and adaptation plans, but most of the drought monitoring studies in India are still lagging. Therefore, the present study attempts to overcome the above-mentioned gaps in the current operational drought monitoring methods of India.
In this study, four primary drought indicator parameters (i.e., LST, SPI, NDVI, and SM) that are representing mainly the agricultural-field conditions (SM and NDVI), meteorological (SPI), and land atmospheric interaction (LST) were used to develop the combined drought index for Marathwada (CDI_M). Two approaches were also tested to combine these input parameters: (1) an expert judgment method (fixed weights, based on in-situ relationships and expert knowledge) and (2) a statistical (PCA) method. For the first time in India, the PCA technique is implemented through this study for the region-specific development of CDI. Previously, this approach was used by Hazaymeh and Hassan [47] and Bayissa et al. [48] over Jordan and Ethiopia, respectively. Implementing both the subjective (fixed weights) and objective (PCA) approaches and the comparative analysis of droughts results from these methods in this study stand as a unique contribution to the CDI-based drought assessment research. Hence, this newly developed CDI_M can be used for a comprehensive analysis of droughts and to better understand the relationship between major crop yields and drought events over Marathwada, India.

2. Study Area

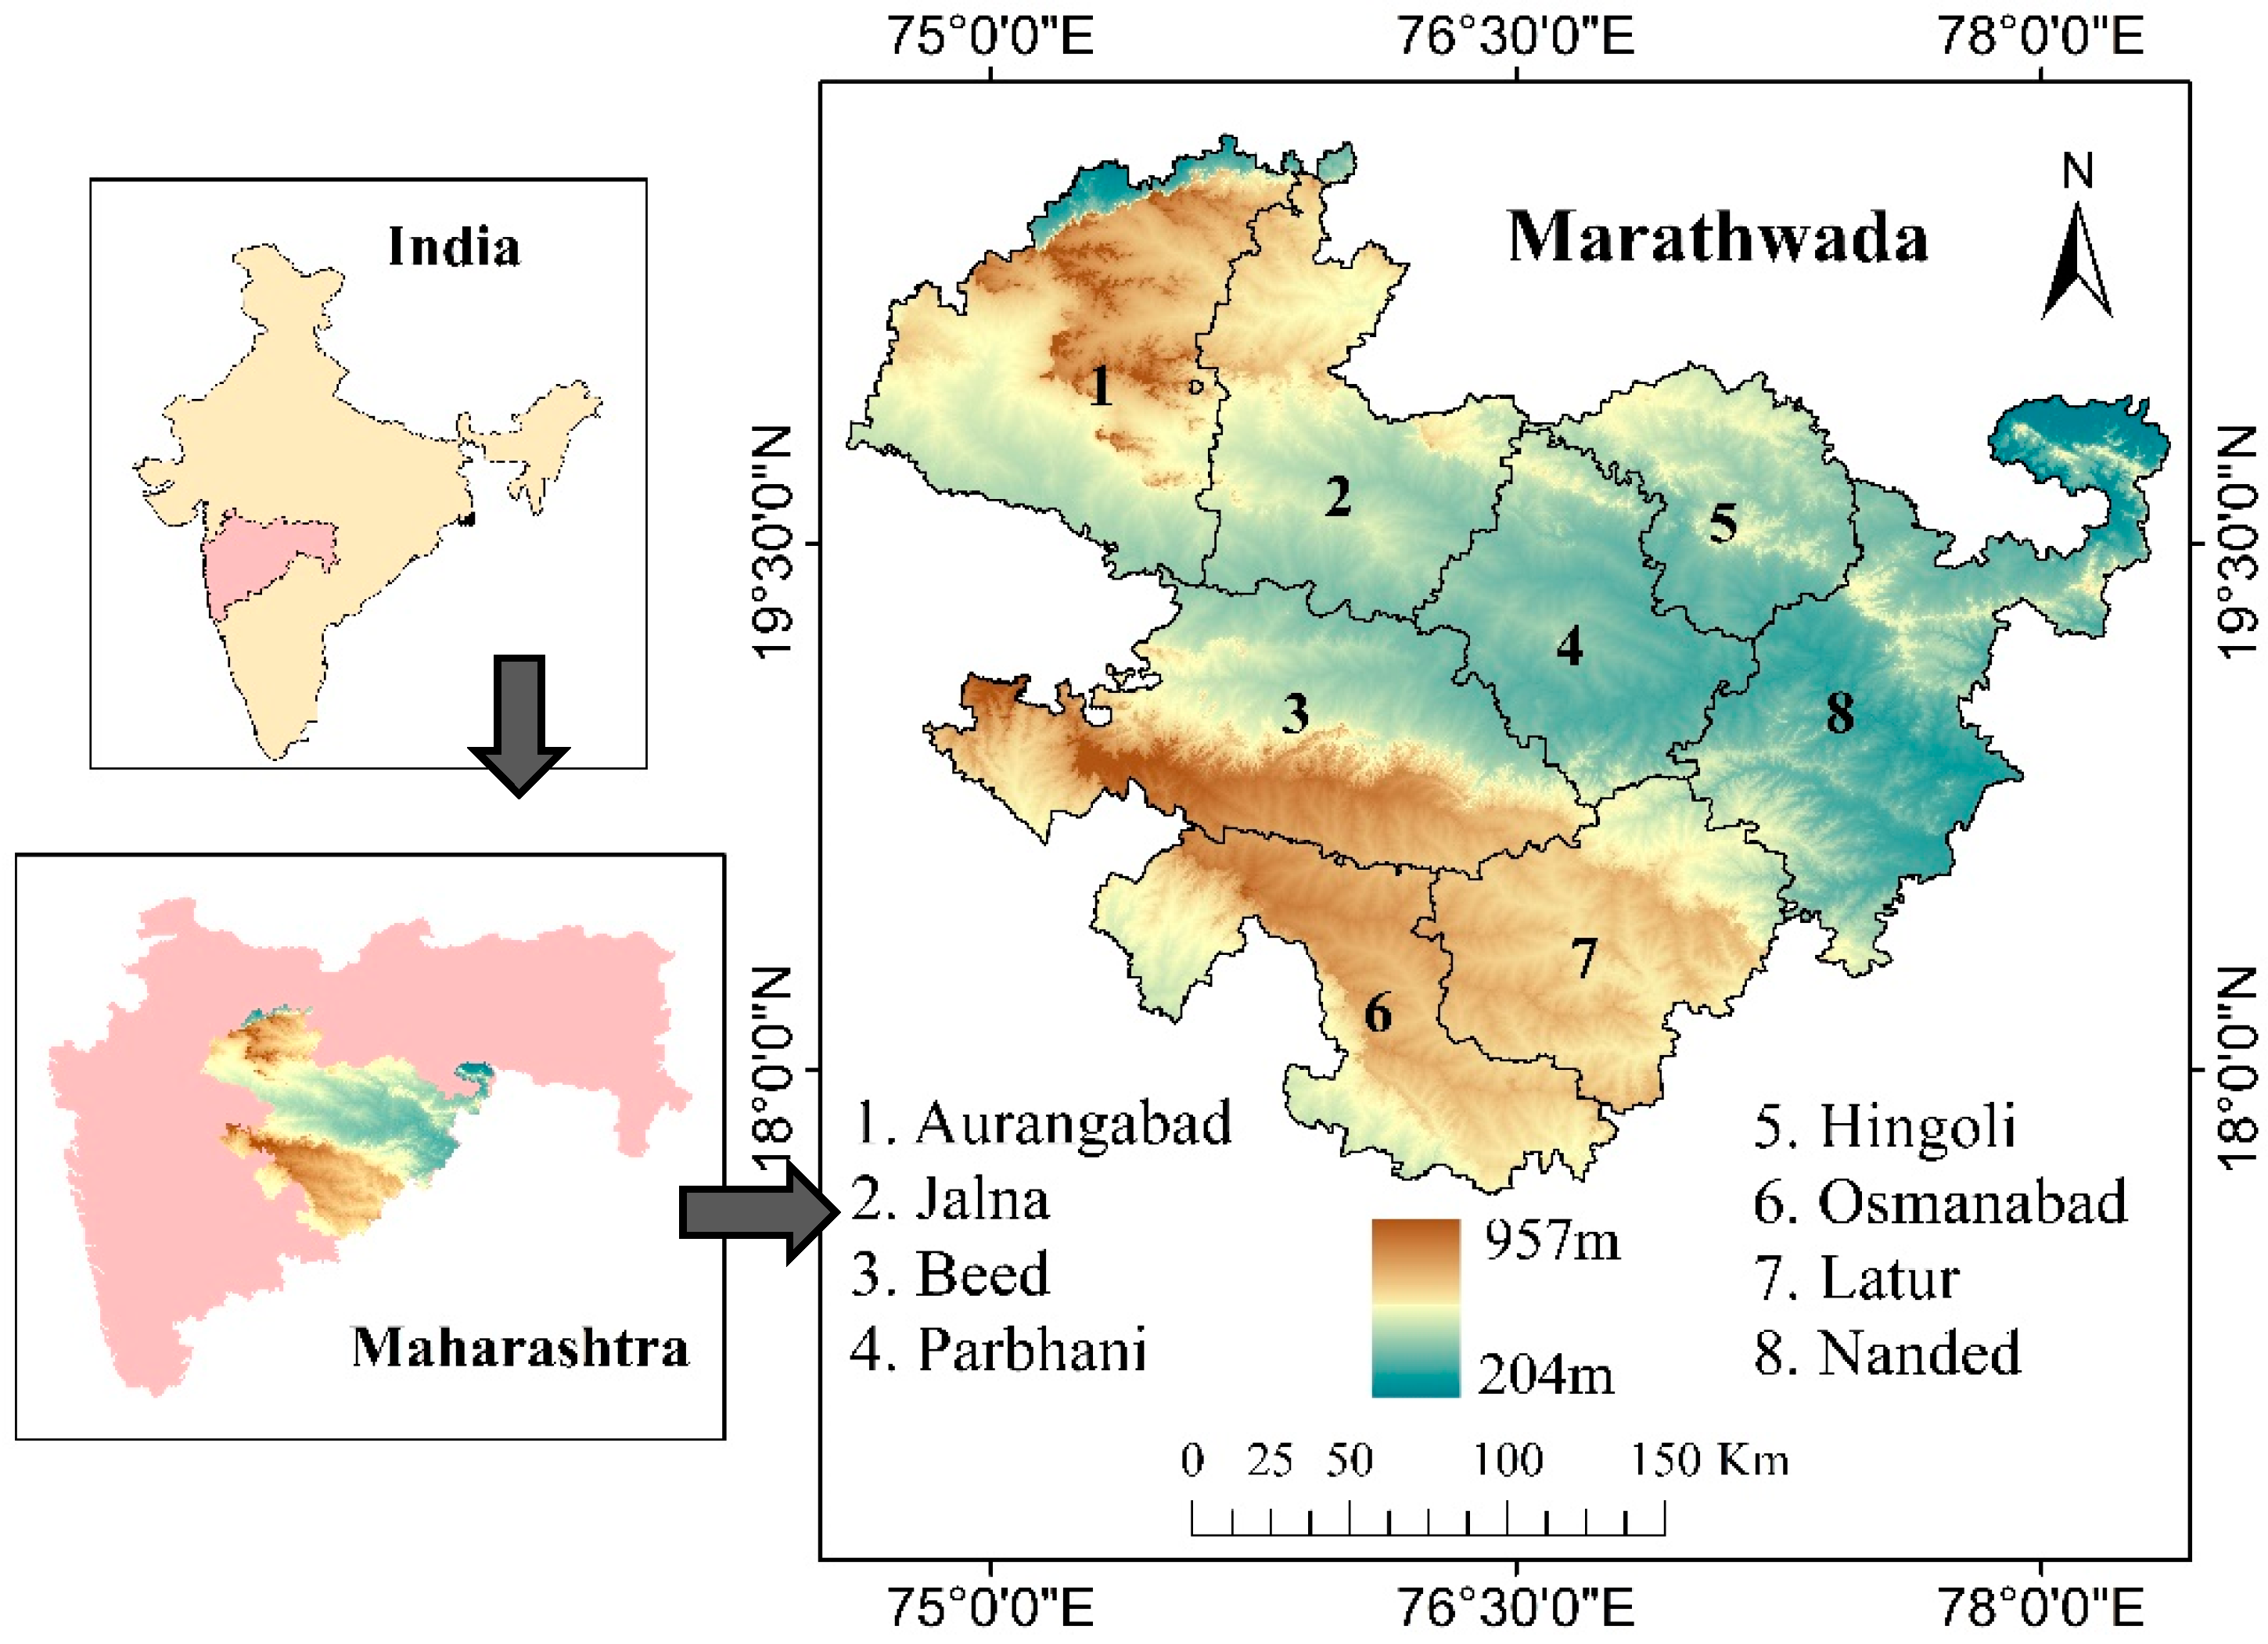
The Marathwada meteorological subdivision is situated in the central and southeastern parts of Maharashtra state, India. This region falls under the tropical semi-arid zone, which is recently known for its farmers’ distress and suicides in the severe drought years 2014–15 [43]. Administratively, the Marathwada region is known as the ‘Aurangabad’ division of Maharashtra state, which consists of eight districts, named as Osmanabad, Jalna, Parbhani, Nanded, Aurangabad, Beed, Hingoli, and Latur. The geographical latitudinal expansion of Marathwada is 17°35′N to 20°41′N, and the longitudinal extent is 74°40′E to 78°16′E (Figure 1). The entire administrative expanse of the Marathwada region is 64,590 sq. Km, which covers 21% of the overall spread of Maharashtra state. Physiologically, Marathwada is part of the Deccan plateau and is mostly covered with deep black cotton soil. This area consists of three main geographical regions based on its altitude variations. The northern and southern uplands of Marathwada are known as the Ajantha mountain ranges and Balaghat hills, whereas the central part contains the Godavari and Manjara river basins. Marathwada belongs to the rain shadow region of the Sahyadri mountain ranges, making this area vulnerable to rainfall variabilities.
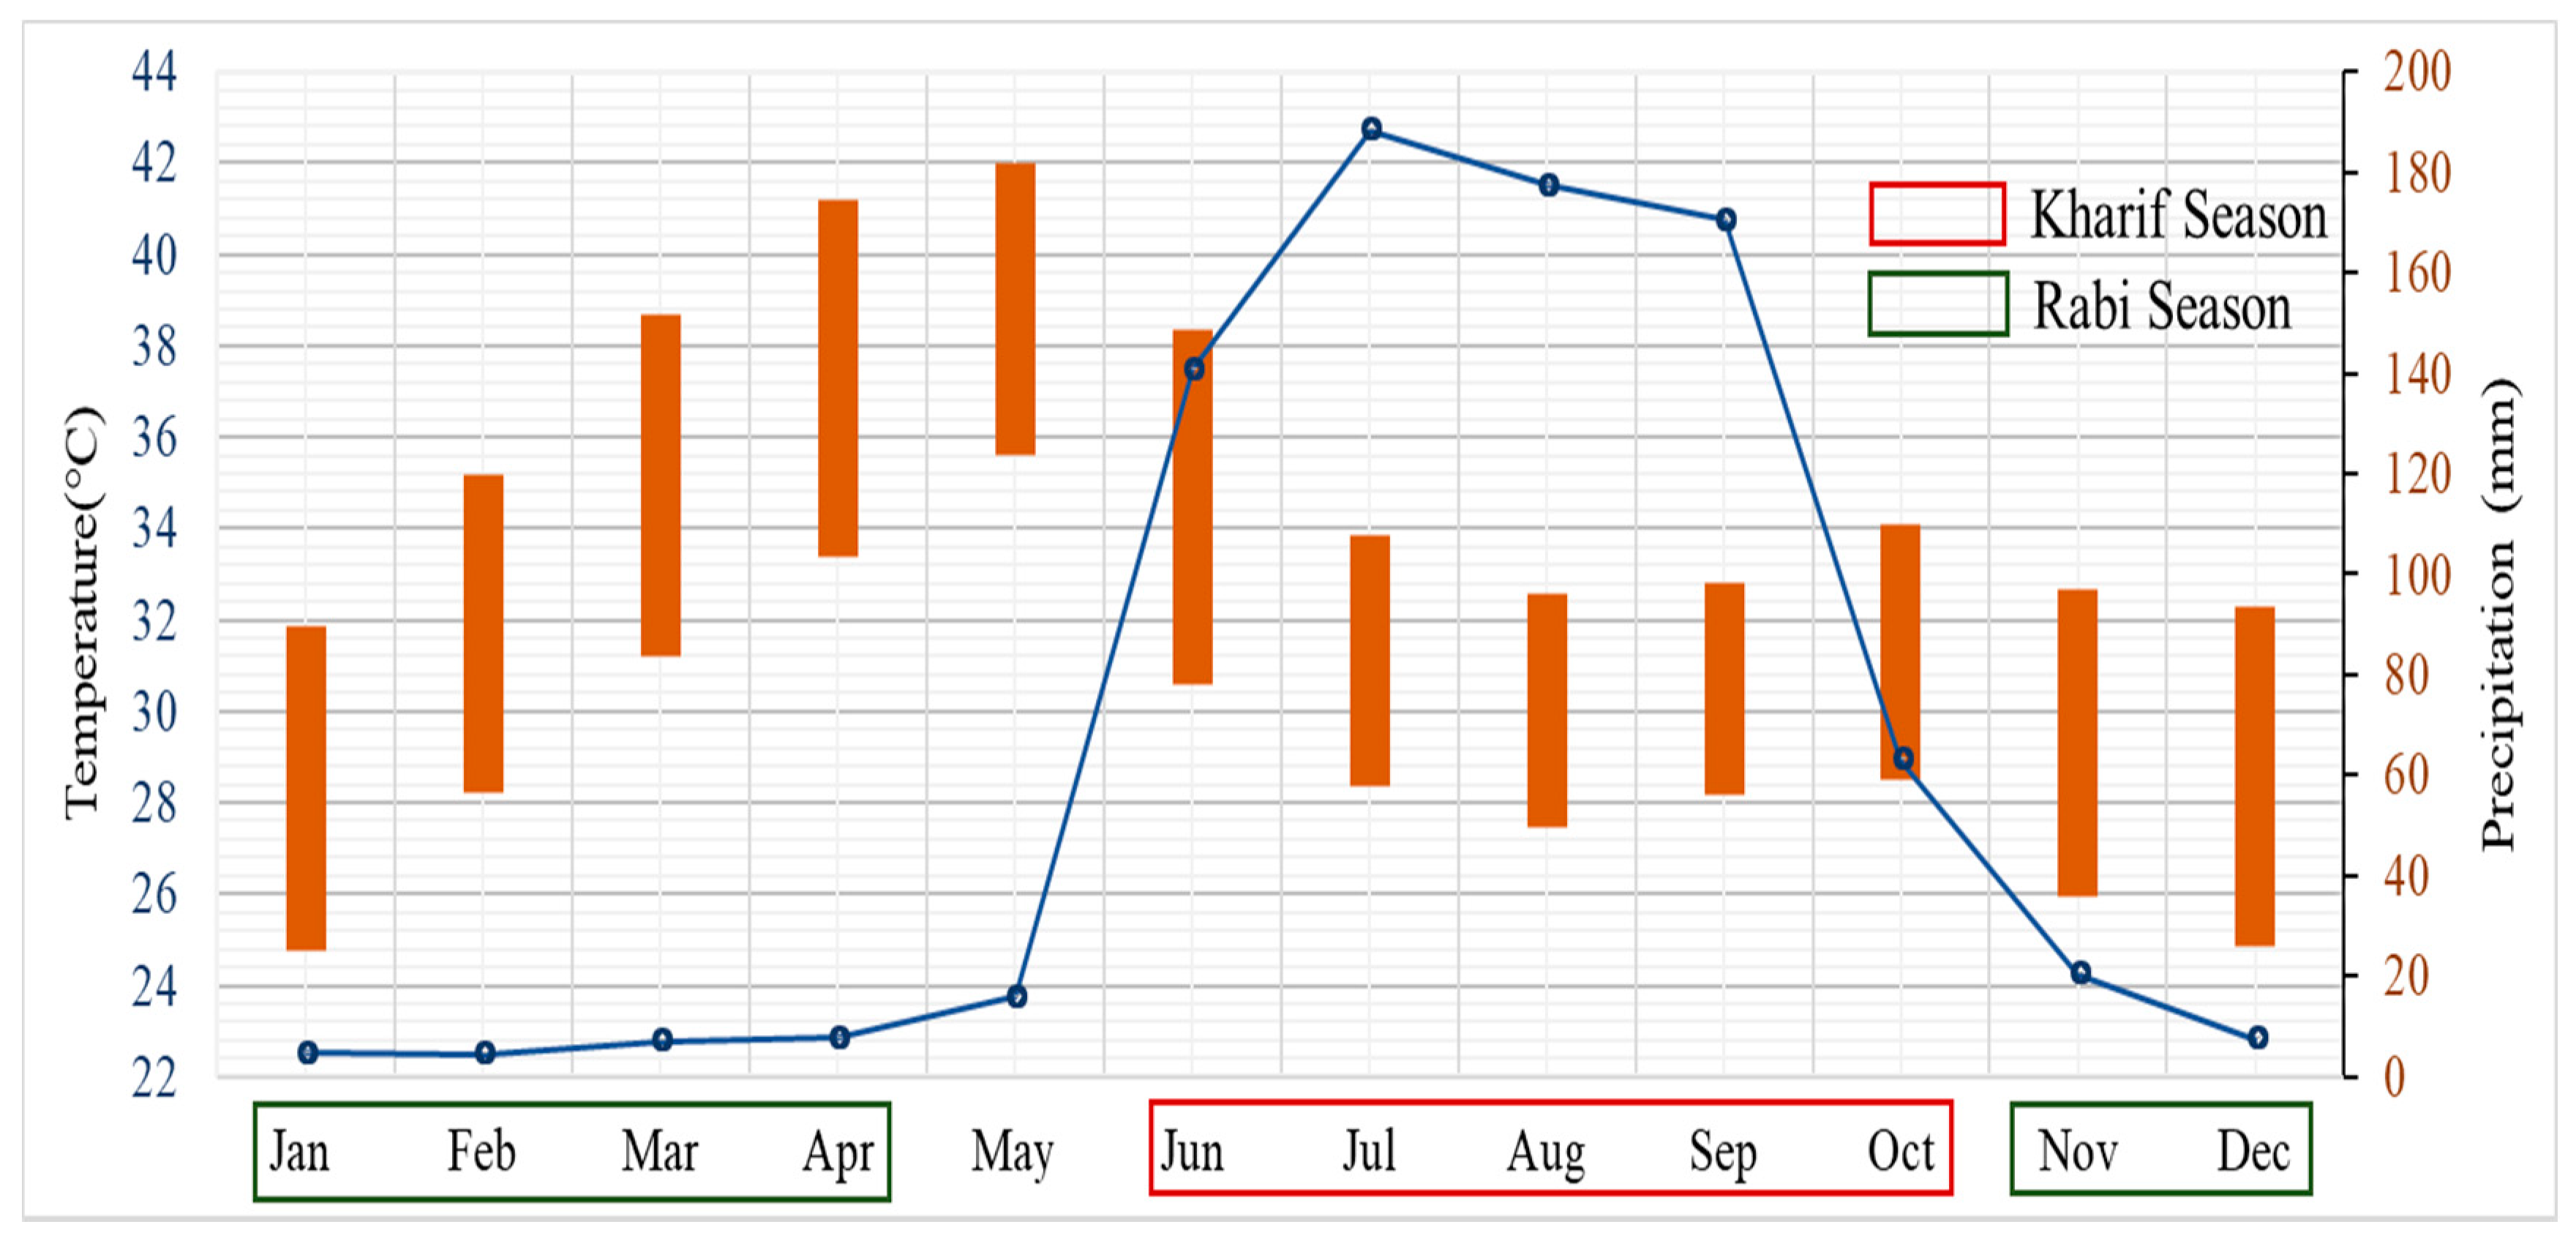
The average normal rainfall in Marathwada is 826 mm, ranging from 700 mm to 850 mm among the districts. The majority of annual precipitation (80%) is reliant on the southwest monsoon rains, which occurs in June, July, August, and September (J, J, A, and S) [49]. Depending on these monsoon rains, rainfed agriculture has become the dominant agricultural system in this region. Therefore, a failure of the southwest monsoon rains directly or indirectly leads to devastating drought scenarios and agrigrain crises in Marathwada. In this area, the highest temperature (45 °C) occurs in May, and the coldest temperature (11 °C) is observed in December (Figure 2) [49]. Kharif (sowing is at the starting of the monsoon) and Rabi (seeding is at the end of the rainy season) are two major cropping seasons in Marathwada. Cotton, jowar, bajra, wheat, maize, pulses, groundnut, and sugarcane are the main crops grown in this region. The total share of food grains is 52% to the gross cropped yield, followed by cotton, which contributes 38% in overall agricultural output [50]. Among food grains, jowar accounts for 25 to 40% of the total yield in each district of Marathwada. The variations in rainfall and temperature follow the nonuniform relief features in this region. Approximately 70% expanse of the overall geographic area is in agricultural production, whereas only 3.55% Marathwada region is under natural vegetation [50].

3. Materials and Methods

3.1. Data

The CDI_M developed in this study is based on four different remotely sensed and model-based input parameters. Monthly time-series data of two agricultural drought indicators, i.e., SM and NDVI, and two climatological parameters, i.e., SPI and LST, were used. For accurate spatial assessment of agricultural droughts, only the spatial extent of croplands was considered and extracted from the MODIS (MCD12Q1) Land Use Land Cover (LULC) datasets for Marathwada. This LULC datasets shows the human intervene land operation, and vegetations and man made constructions over the study region. CDI_M was compared with crop yield information from the study area to assess the agricultural drought monitoring capabilities of this method. The selection of specific input datasets was based on long-term data availability, reliability, high spatial resolution, accessibility, and use in the worldwide operational agro-climatic monitoring systems. Details of these datasets are presented below, and the detailed description of datasets and their sources is given in Table 1.

3.1.1. SPI (CHIRPS Data)

Rainfall deficit is an essential component of drought. Variations in rainfall and the south–north deviation of the intertropical conversion zone (ITCZ) alter the precipitation conditions and drought in particular [51]. Therefore, the commonly used rainfall-based SPI [52] was chosen as one of the meteorological components for this study. By normalizing the rainfall, the SPI was calculated on various time intervals, like 1, 2, and 3 months for the 2001 to 2018 study period. The SPI was computed using IMD-derived SPI ranges from higher negative values, representing extremely dry (−2.00 or less) conditions to the positive values of extremely wet (+2.00 or more) conditions. To maintain the seasonal relationship between rainfall and vegetation response, the SPI-3 (3-month SPI) was used for this study. The SPI values were calculated by using long-term (1981–2018) precipitation data. Climate Hazards Group Infrared Precipitation with Station data (CHIRPS) [53] generated by the U.S Geological Survey were incorporated to derive the time-series of SPI. CHIRPS data were used for this study, due to these main reasons: (1) data availability on a longer temporal scale (1981–present); (2) higher spatial resolution (0.05°) when compared to other available rainfall datasets; and (3) its significant correlation (r = 0.7) with the IMD-derived station-based data (as CHIRPS blends the station data, only independent stations were selected for correlation analysis).

3.1.2. LST (NOAH Data)

Land surface temperature is a key indicator of land surface processes, which reflects the energy balance at the surface of the Earth [54]. Being a fundamental linking parameter between SM and evapotranspiration, increasing LST precedes the onset of droughts. Hence, we have considered LST as an input for the CDI_M. The monthly LST data for the period 2001 to 2018 were retrieved from the Global Land Data Assimilation System (GLDAS), NOAH land surface model of NASA [55]. This LST data (spatial resolution—0.25°), is a part of 36 land surface fields of monthly data product version 2, which was forced using a combination of observations and modeled data [55].

3.1.3. NDVI (MODIS Data)

NDVI measures the vigor and greenness of vegetation. NDVI deals with vegetation health, based on the differences between its reflection in the red and near-infrared spectrum. Unhealthy vegetation highly reflects in the red spectrum and fewer in near-infrared. Stressed and unhealthy vegetation results in low NDVI values, which is useful to identify and measure the agricultural drought intensities [2,56]. Therefore, to understand the agrarian stress and its relation with overall agricultural drought conditions, this study utilized NDVI data from 2001 to 2018. Monthly NDVI anomalies were collected from Moderate Resolution Imaging Spectroradiometer (MODIS) with a spatial resolution of 0.01° (1 km). The benefits of the data obtained from MODIS are better radiometric calibration and its high temporal resolution, which provides continuous satellite data for drought monitoring.

3.1.4. SM (NOAH Data)

Soil moisture has the potential to indicate agricultural drought and level of water storage. The root zone soil moisture is one of the critical parameters in the overall vegetation growth. It is also responsible for water availability during the transpiration process, which directly indicates the agricultural drought condition [57]. Hence, we have used SM as a significant input parameter to identify agrarian droughts. Monthly SM data, for the period 2001 to 2018, were derived from the GLDAS, NOAH land surface model of NASA [54] for this study. Like LST, this SM data were also one of the parts of 36 land surface fields data product, version-2, and available at 0.25° spatial resolution. Concerning land use type, root zone soil moisture at middle depth (10 to 40 cm) was used as an input for the SM.

3.1.5. LULC (MODIS Data)

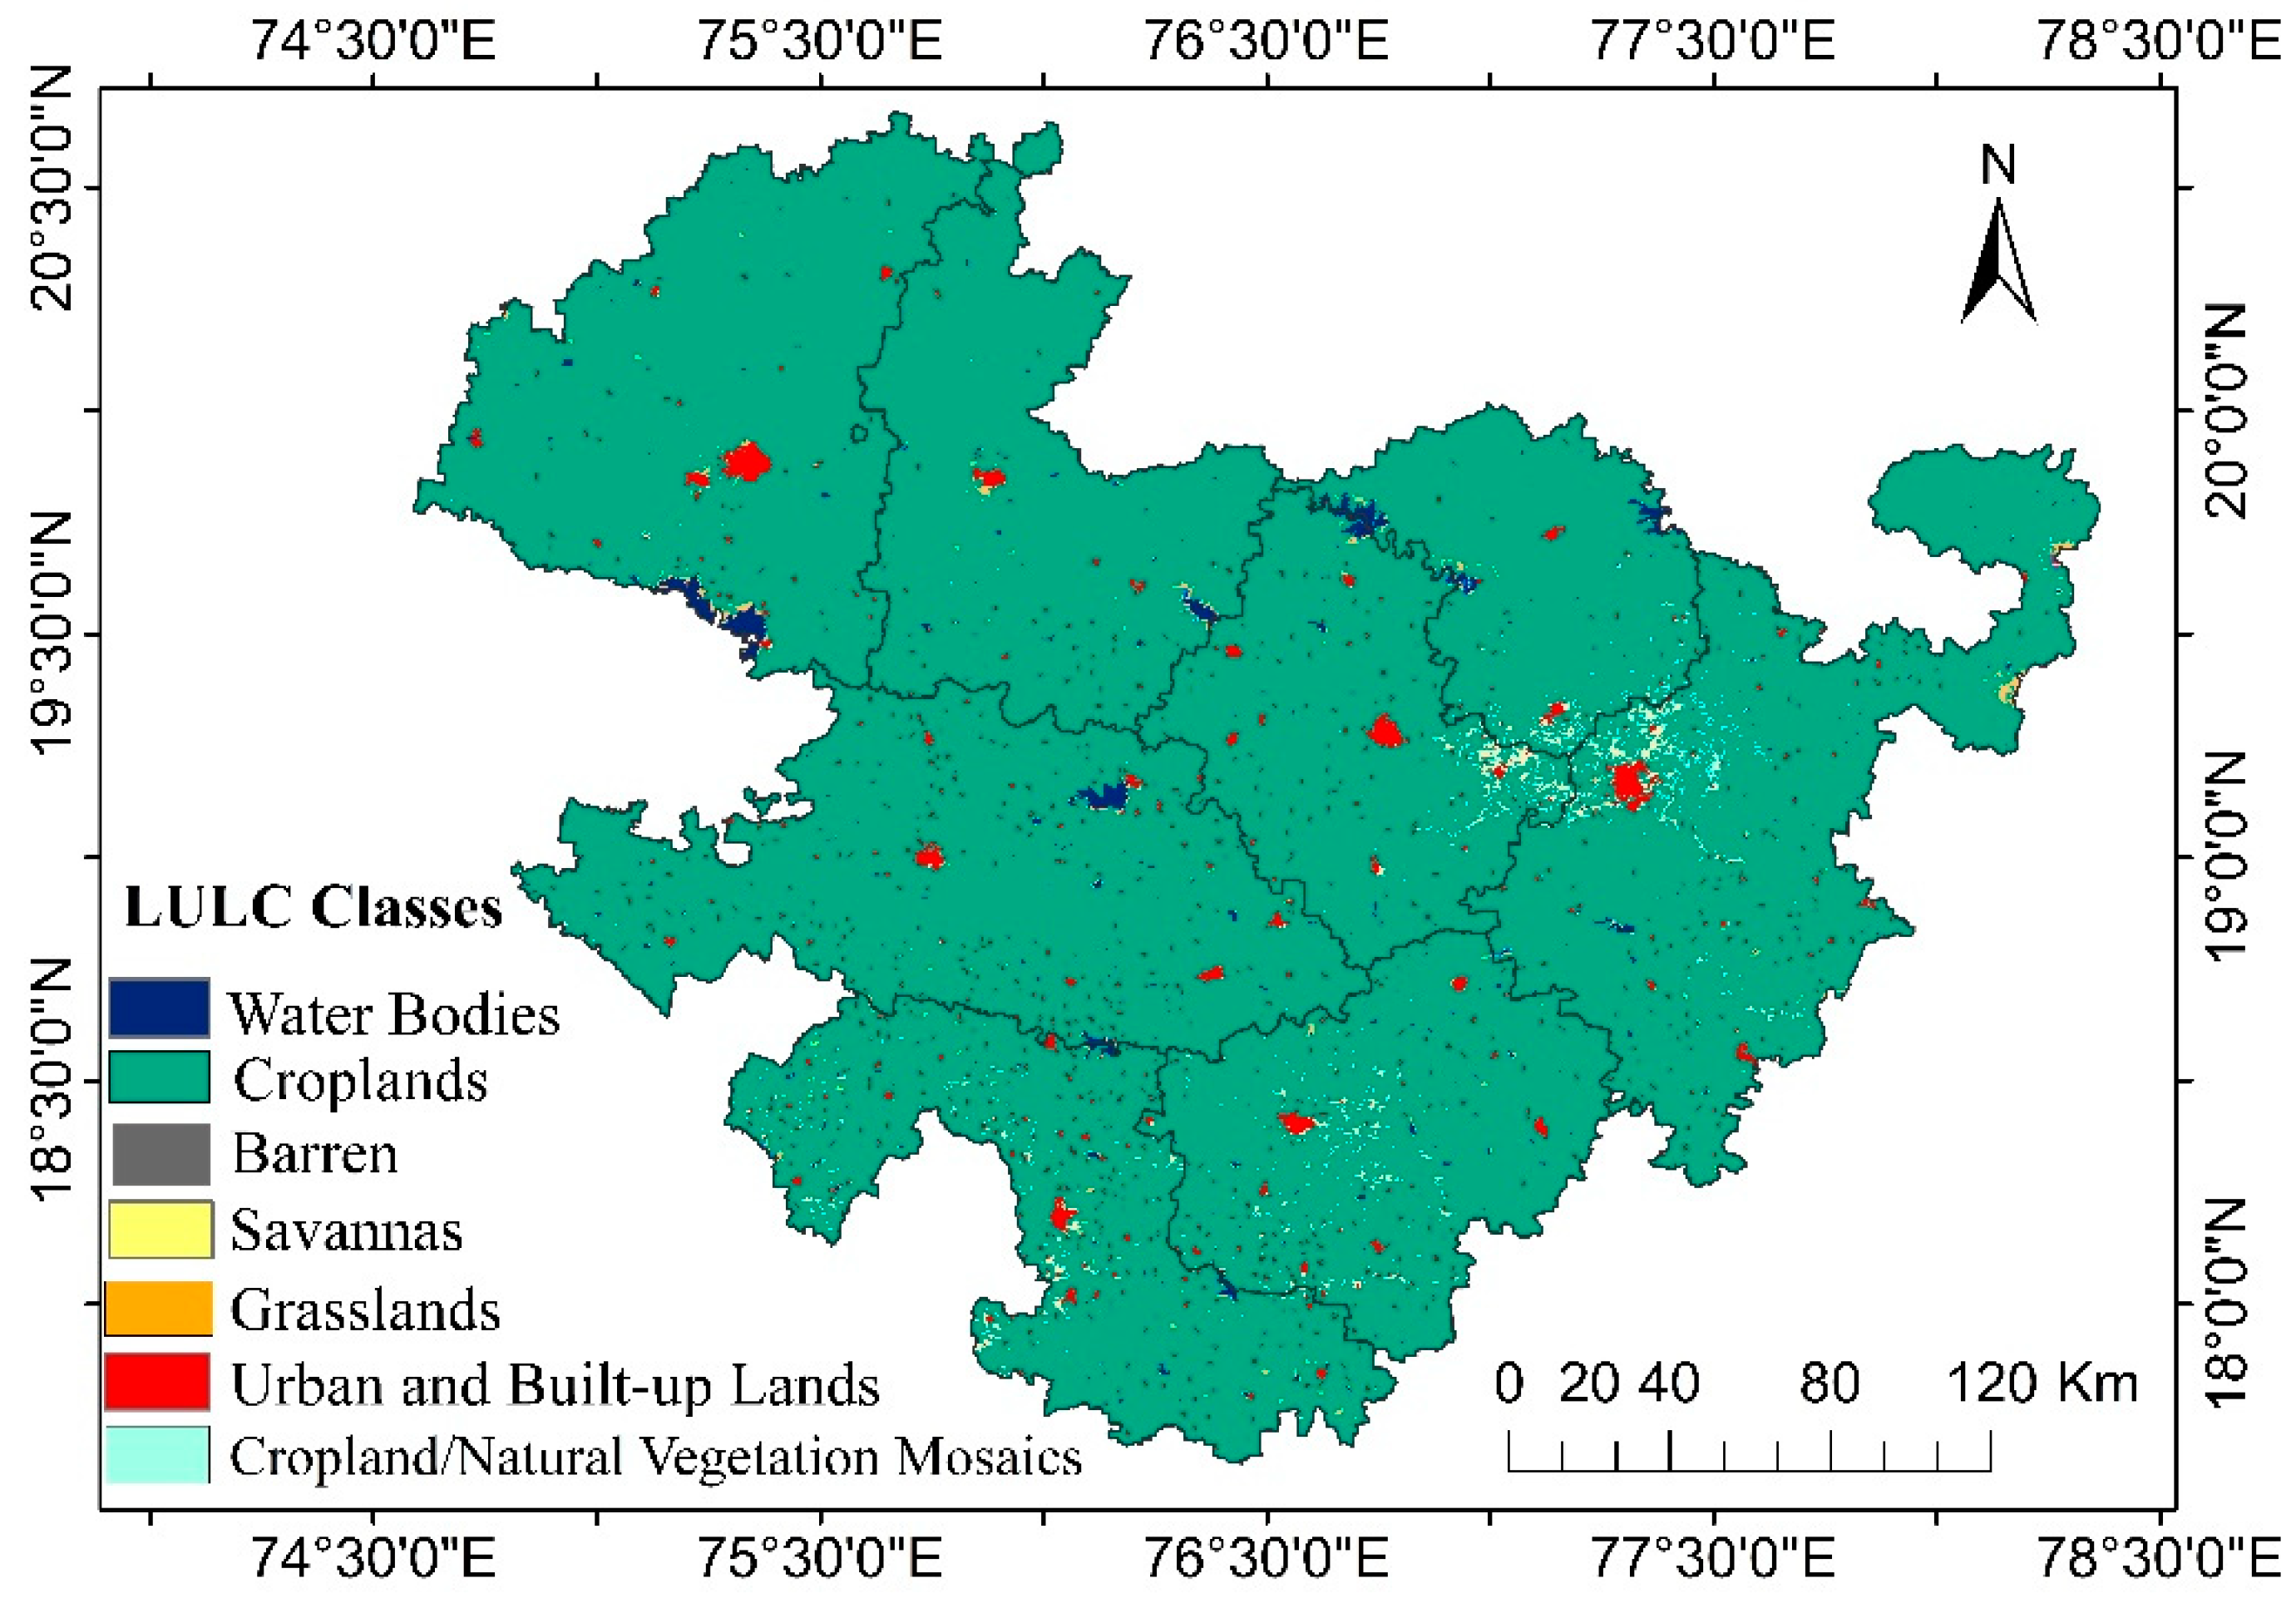
The primary objective of the current research was to monitor the spatio-temporal variations and changes during the drought conditions for agrarian activities. Hence, for the accurate assessment of the CDI_M results, the historical time-series of data for each input variable was masked to retain only pixel locations associated with agricultural activities within the study area. Yearly LULC data (2001–2018) were acquired from MODIS, with a spatial resolution of 1 km. These LULC datasets (MCD12Q1) were generated by a supervised classification method, which has divided Marathwada into 17 different classes (forest, water bodies, barren, urban and built-up land, etc.) [58]. Most of the study area is covered with croplands (95.93%), followed by urban and built-up lands (1.72%), water bodies (0.83%), etc. (Figure 3) (Table 2). For masking and data extraction, only image pixels associated with the croplands (class 12) and croplands/vegetation (class 14) were retained for CDI_M development and assessment, while pixel locations associated with the other nonagricultural classes were eliminated. The LULC-masked input datasets were then used for the CDI_M estimation.

3.1.6. Crop Yield data

In this study, we have considered season-based, highly cultivated, and maximum yield producing crops from Marathwada that include bajra, jowar, maize, cotton, wheat, and rice over the year 2001 to 2018. These crops were grouped and analyzed as per their growing seasons, i.e., Rabi (November to April) and Kharif (June to October). The station-based crop area and crop production data were incorporated from the national level agricultural authority and open government data platform [59]. These datasets were further arranged as per seasonal yield production, using the following formula,
Yield = Tonnes/Hectare

3.2. Methodology

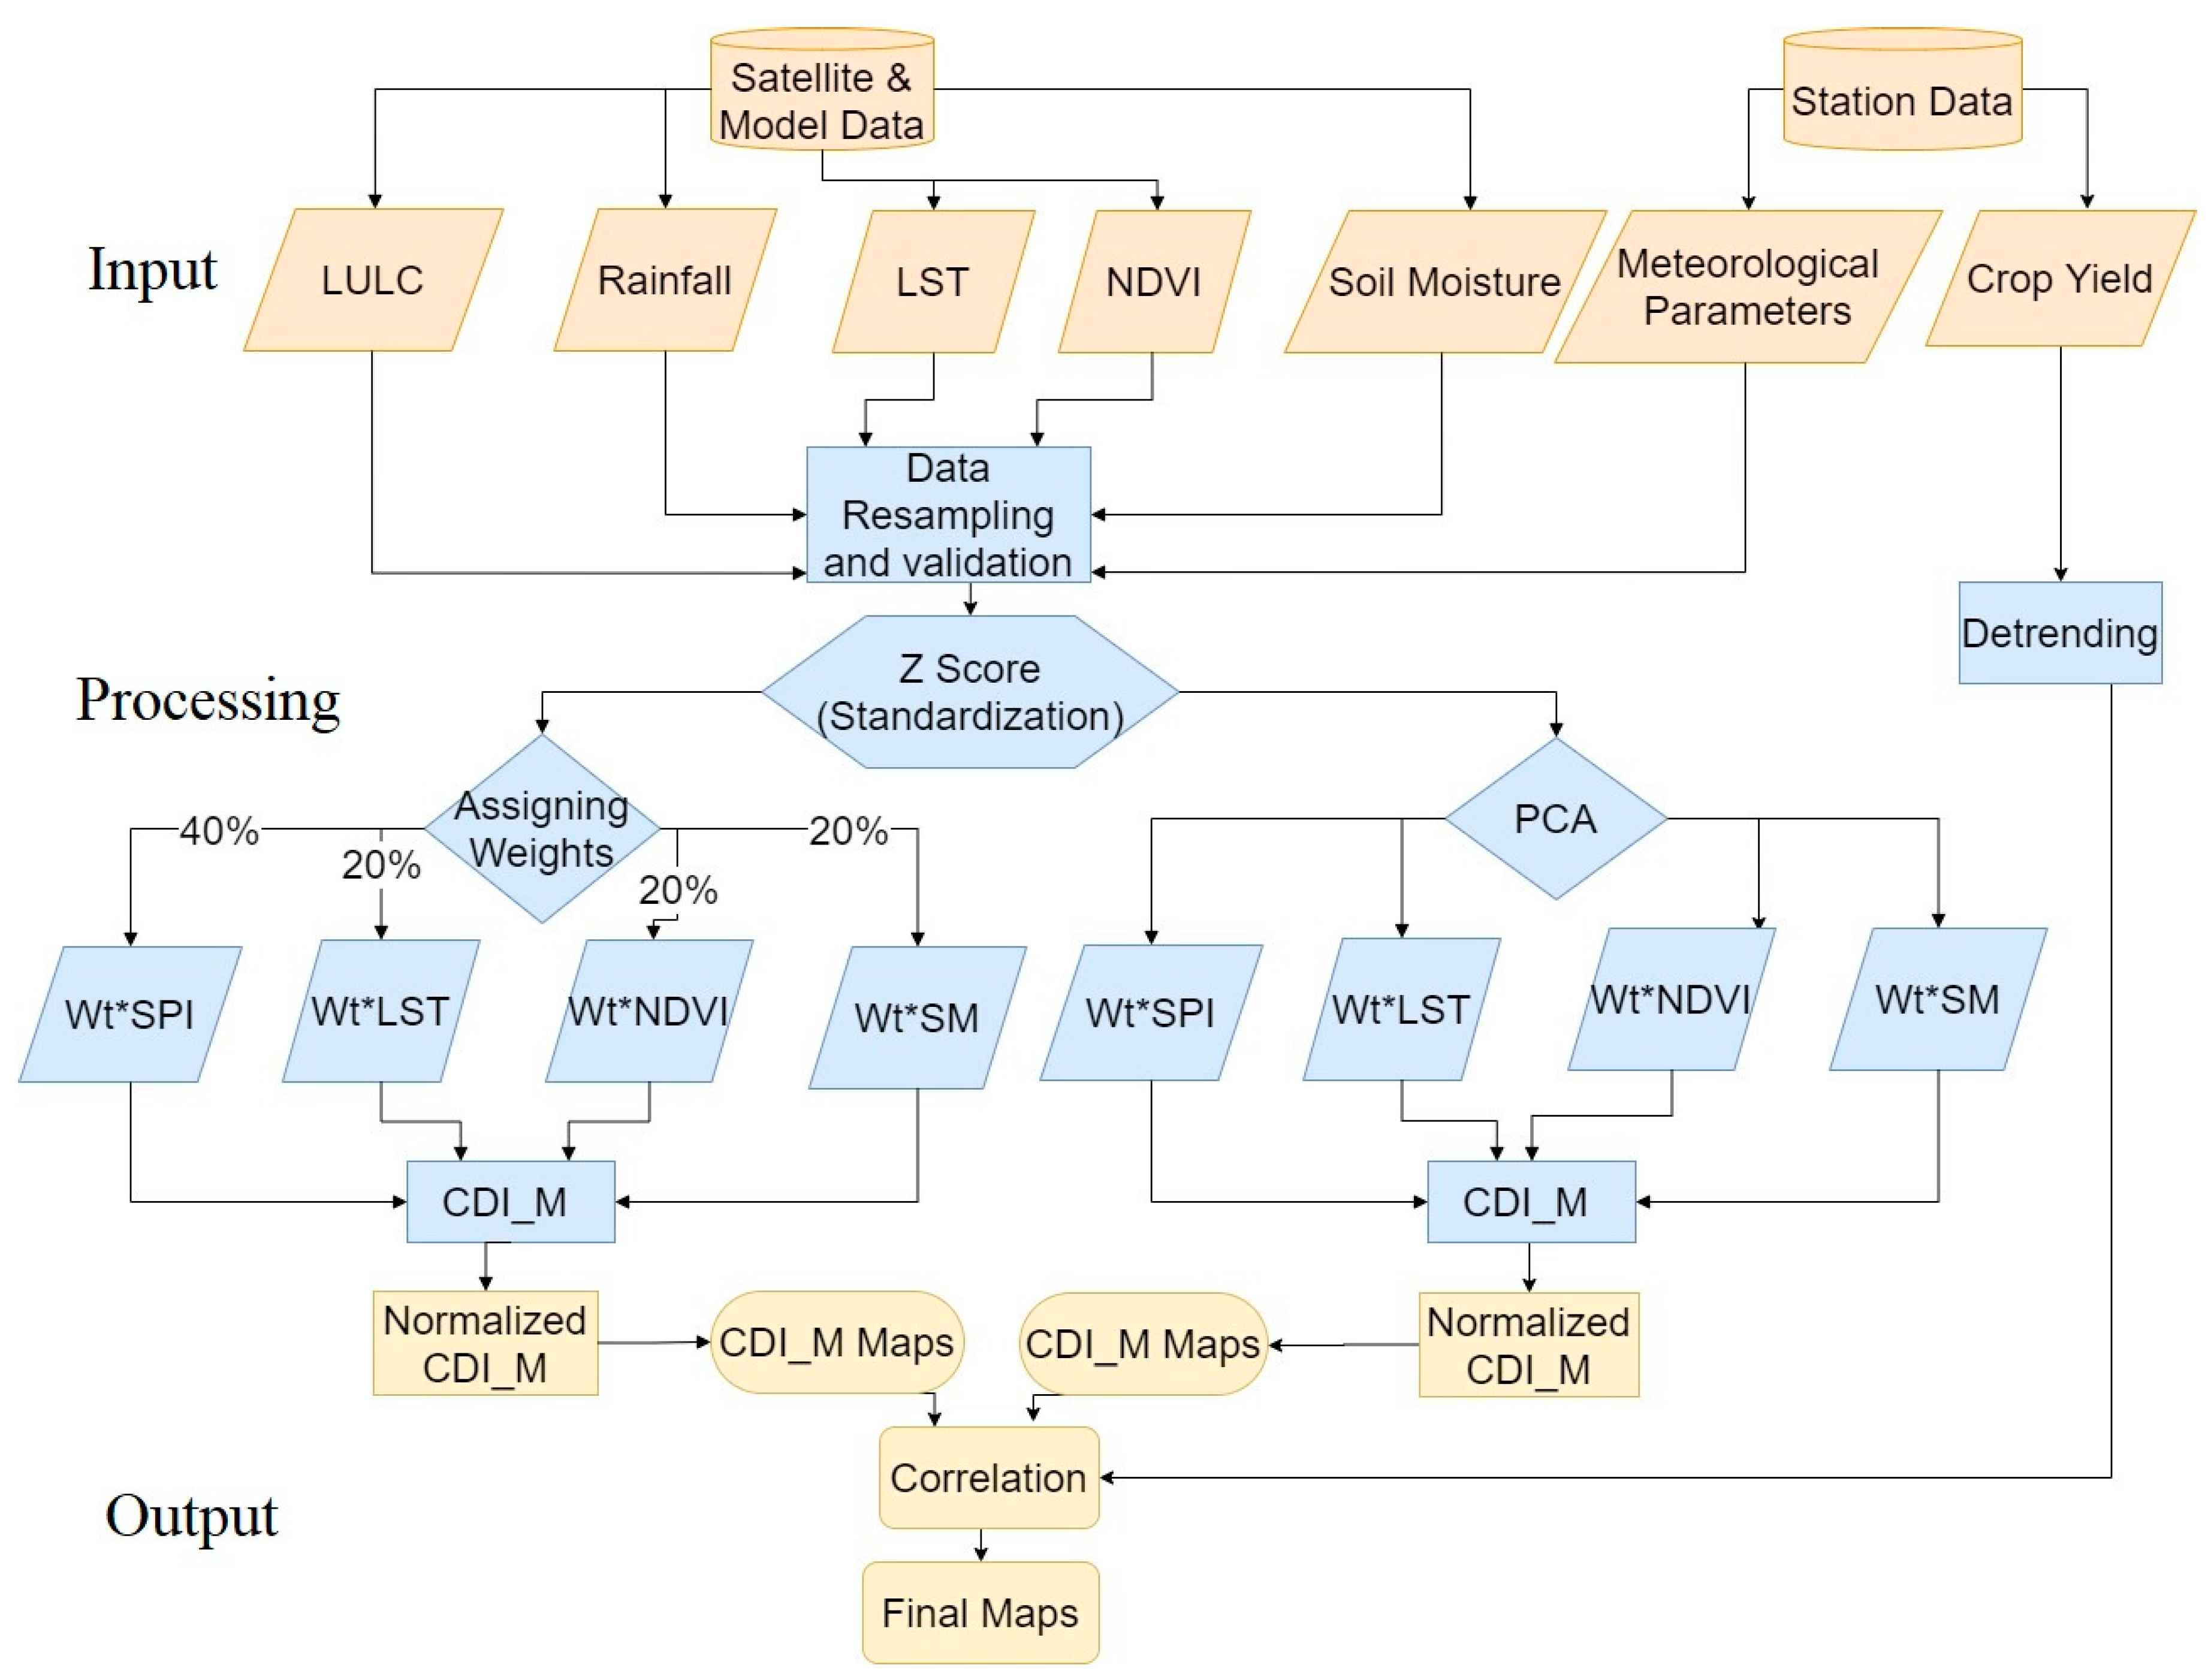
The input parameters used for this study were available at different spatial resolutions (0.25° and 0.01°). Therefore, the first step of preprocessing was applied to spatially resample all the data sets to a 1-km resolution on a monthly temporal scale. This downscaling of the input data was performed by adopting the inverse distance weighted (IDW) technique [60]. This IDW method is easy to define, simple to understand, commonly used [61,62], and widely accepted in the scientific community and hence, implemented for this study. The general assumption behind IDW is points in close proximity are highly related than the distinct points. In the next preprocessing step, all the grid values were standardized by ‘Z-score’ statistics and further extracted using MODIS-LULC data sets.
Z-score values were computed using the following formula,
Z score = X μ σ
where,
  • X = particular value of a parameter from the group
  • μ = long-term mean
  • δ = long-term standard deviation
This study deals with two different methods to combine the input parameters for the CDI_M analysis. Method I is a fixed percentage of weights were subjectively assigned to each input variable, whereas, method II determines the spatio-temporal weights of a parameter based on the PCA technique. Details of these two methods are described below.

3.2.1. Expert Judgment-Based Percentage Weights (Method-I)

The four input parameters used in this study have their own individual contributions to explain the collective drought conditions that may vary in importance. Therefore, in this first method of combining input variables for the CDI_M, weights were assigned using historical records of each parameter and its correlation with the actual in-field chronological drought conditions reported by the IMD. These weights and their contribution were also discussed and approved by the domain drought experts. In this analysis, the rainfall-based variable (SPI) was recognized as a key element to represent the ground reality of droughts; hence, it is assigned with the highest weight (40%). The remaining parameters of LST, NDVI, and SM showed relatively equal ability to represent in-field drought scenarios, and therefore were assigned equal weightings of 20% (Figure 4). The monthly time series of CDI_M, based on this method was computed by the following formula:
CDI_M(z, i) = WtSPI *SPI(z, i) + WtLST *LST(z,i) + WtNDVI *NDVI(z,i) + WtSM *SM(z,i)
where WtSPI, WtLST, WtNDVI, and WtSM stand for the percentage weight values for individual parameters. z and i represent a particular year and the specific month (January–December).

3.2.2. PCA-Based Weights (Method-II)

In hydrologic and atmospheric studies, principle component analysis (PCA) is commonly used to detect a dominant pattern in the datasets [63,64]. Based on this capability, the PCA method was incorporated into this study as an alternative means to quantitatively determine input variable weightings. In the first step, based on all the input parameters and their temporal values, the correlation coefficient matrix (p*p, where p indicates the number of input variables) was constructed for each grid cell. In general, eigenvectors help to describe the relationship between data and the principal components. Therefore, as a second step, eigenvectors were computed using a matrix, developed in stage one and further employed for the orthogonal principal components (PCs). It is observed that the first PC (PC1) reflects the maximum variability of input data [65]; hence, we have considered PC1 for the development of the CDI_M.
In the next step, the percentage contribution (square of eigenvectors) of each variable was estimated using eigenvector values. These percentage contributions were generated and used to avoid the peaks and unwanted extremes in the CDI_M values.
Based on the above-mentioned steps, 48 spatially weighted maps for each month (12) and all the input variables (4) were created. These PCA-based percentage weights were further used to evaluate the CDI_M by using the following formula:
CDI_M(z,i) = WtSPI *SPI(z, i) + WtLST *LST(z,i) + WtNDVI *NDVI(z,i) + WtSM *SM(z,i)
where WtSPI, WtLST, WtNDVI, and WtSM stand for the PCA-based weight values for individual parameters, i.e., SPI, LST, NDVI, and SM, respectively. The z and i represent a particular year and the specific month (January–December) of the standardized input data.
After the computation of the CDI_M using both methods, all results were normalized by considering its standard deviation. The normalization was carried out using the formula mentioned below,
stdCDI _ M ( z , i ) = CDI ( z , i ) δ i
where the stdCDI_M (z, i) is a combined drought anomaly for the z year and ith month. The δi represents the standard deviation value for the month i, over all the years. After the evaluation of the CDI_M, all the drought events were classified based on IMD derived drought ranges and categories (Table 3).

3.2.3. Evaluation of the CDI_M Based on Crop Yield

Drought variability and its spatio-temporal distribution are highly responsible for the fluctuations in crop productivity and overall agricultural conditions. Hence, part of this study deals with the drought conditions and variations detected by the CDI_M and its relationship to the yields of principal crops cultivated in Marathwada. The primary step of preprocessing involves detrending the crop yield datasets to account for historical crop yield improvements due to improved plant genetics and farming technologies over time. Yearly crop production is not only a result of climatic variations but also depends on other nonclimatic factors that are accounted through data detrending. The detrending technique was used to remove the effect of variables other than agro-climatological parameters in the overall increasing trends in crop yield. This analysis is based on an annual yield data for the five significant crops and two major crop growing seasons (Kharif and Rabi) of Marathwada. The results of the correlation were produced based on the crop cycle (sowing and harvesting) and its spatio-temporal visualization through maps.

4. Results and Discussion

Monthly maps of the CDI_M in Figure 5 show the spatio-temporal variations of drought frequencies over Marathwada. In the past 18 years (2001–2018), both of the CDI_M methods detected the years 2002, 2009, 2015, and 2016 as severe drought years, with conditions ranging from mild to extreme drought intensities across the cropping season. For the study area as a whole, the highest drought frequencies (number of extreme drought years) were observed during the monsoon (Jun, Jul, Aug, Sep) and postmonsoon (Oct and Nov) months. For the agriculture sector, in particular, these observed months are crucial for the overall cropping cycle of the Kharif season, whereas increasing drought frequencies over these months may also directly impact the following Rabi season’s sowing activities in Marathwada. Between the years 2001–2018, the eastern parts of Jalna and central Parbhani experienced maximum drought frequencies (3/4 extreme drought years) in June and October, whereas the Osmanabad district had the highest number of drought frequencies (4 extreme drought years) in August (Figure 5). For most of the remaining months (Figure A1), only one to three severe to extreme drought events occurred over various parts of the Marathwada during the past 18 years. In general, Parbhani, Beed, and parts of Hingoli witnessed a higher number of drought frequencies during the monsoon and postmonsoon season, which can also be marked as continuous drought-affected expanses within Marathwada (Figure 5). Over any region, three to four occurrences of severe to extreme drought events in 18 years are of great concern in the face of future uncertainties. Therefore, a timely assessment of these dry spells is a basic need for the socio-economic and environmental well-being of Marathwada.
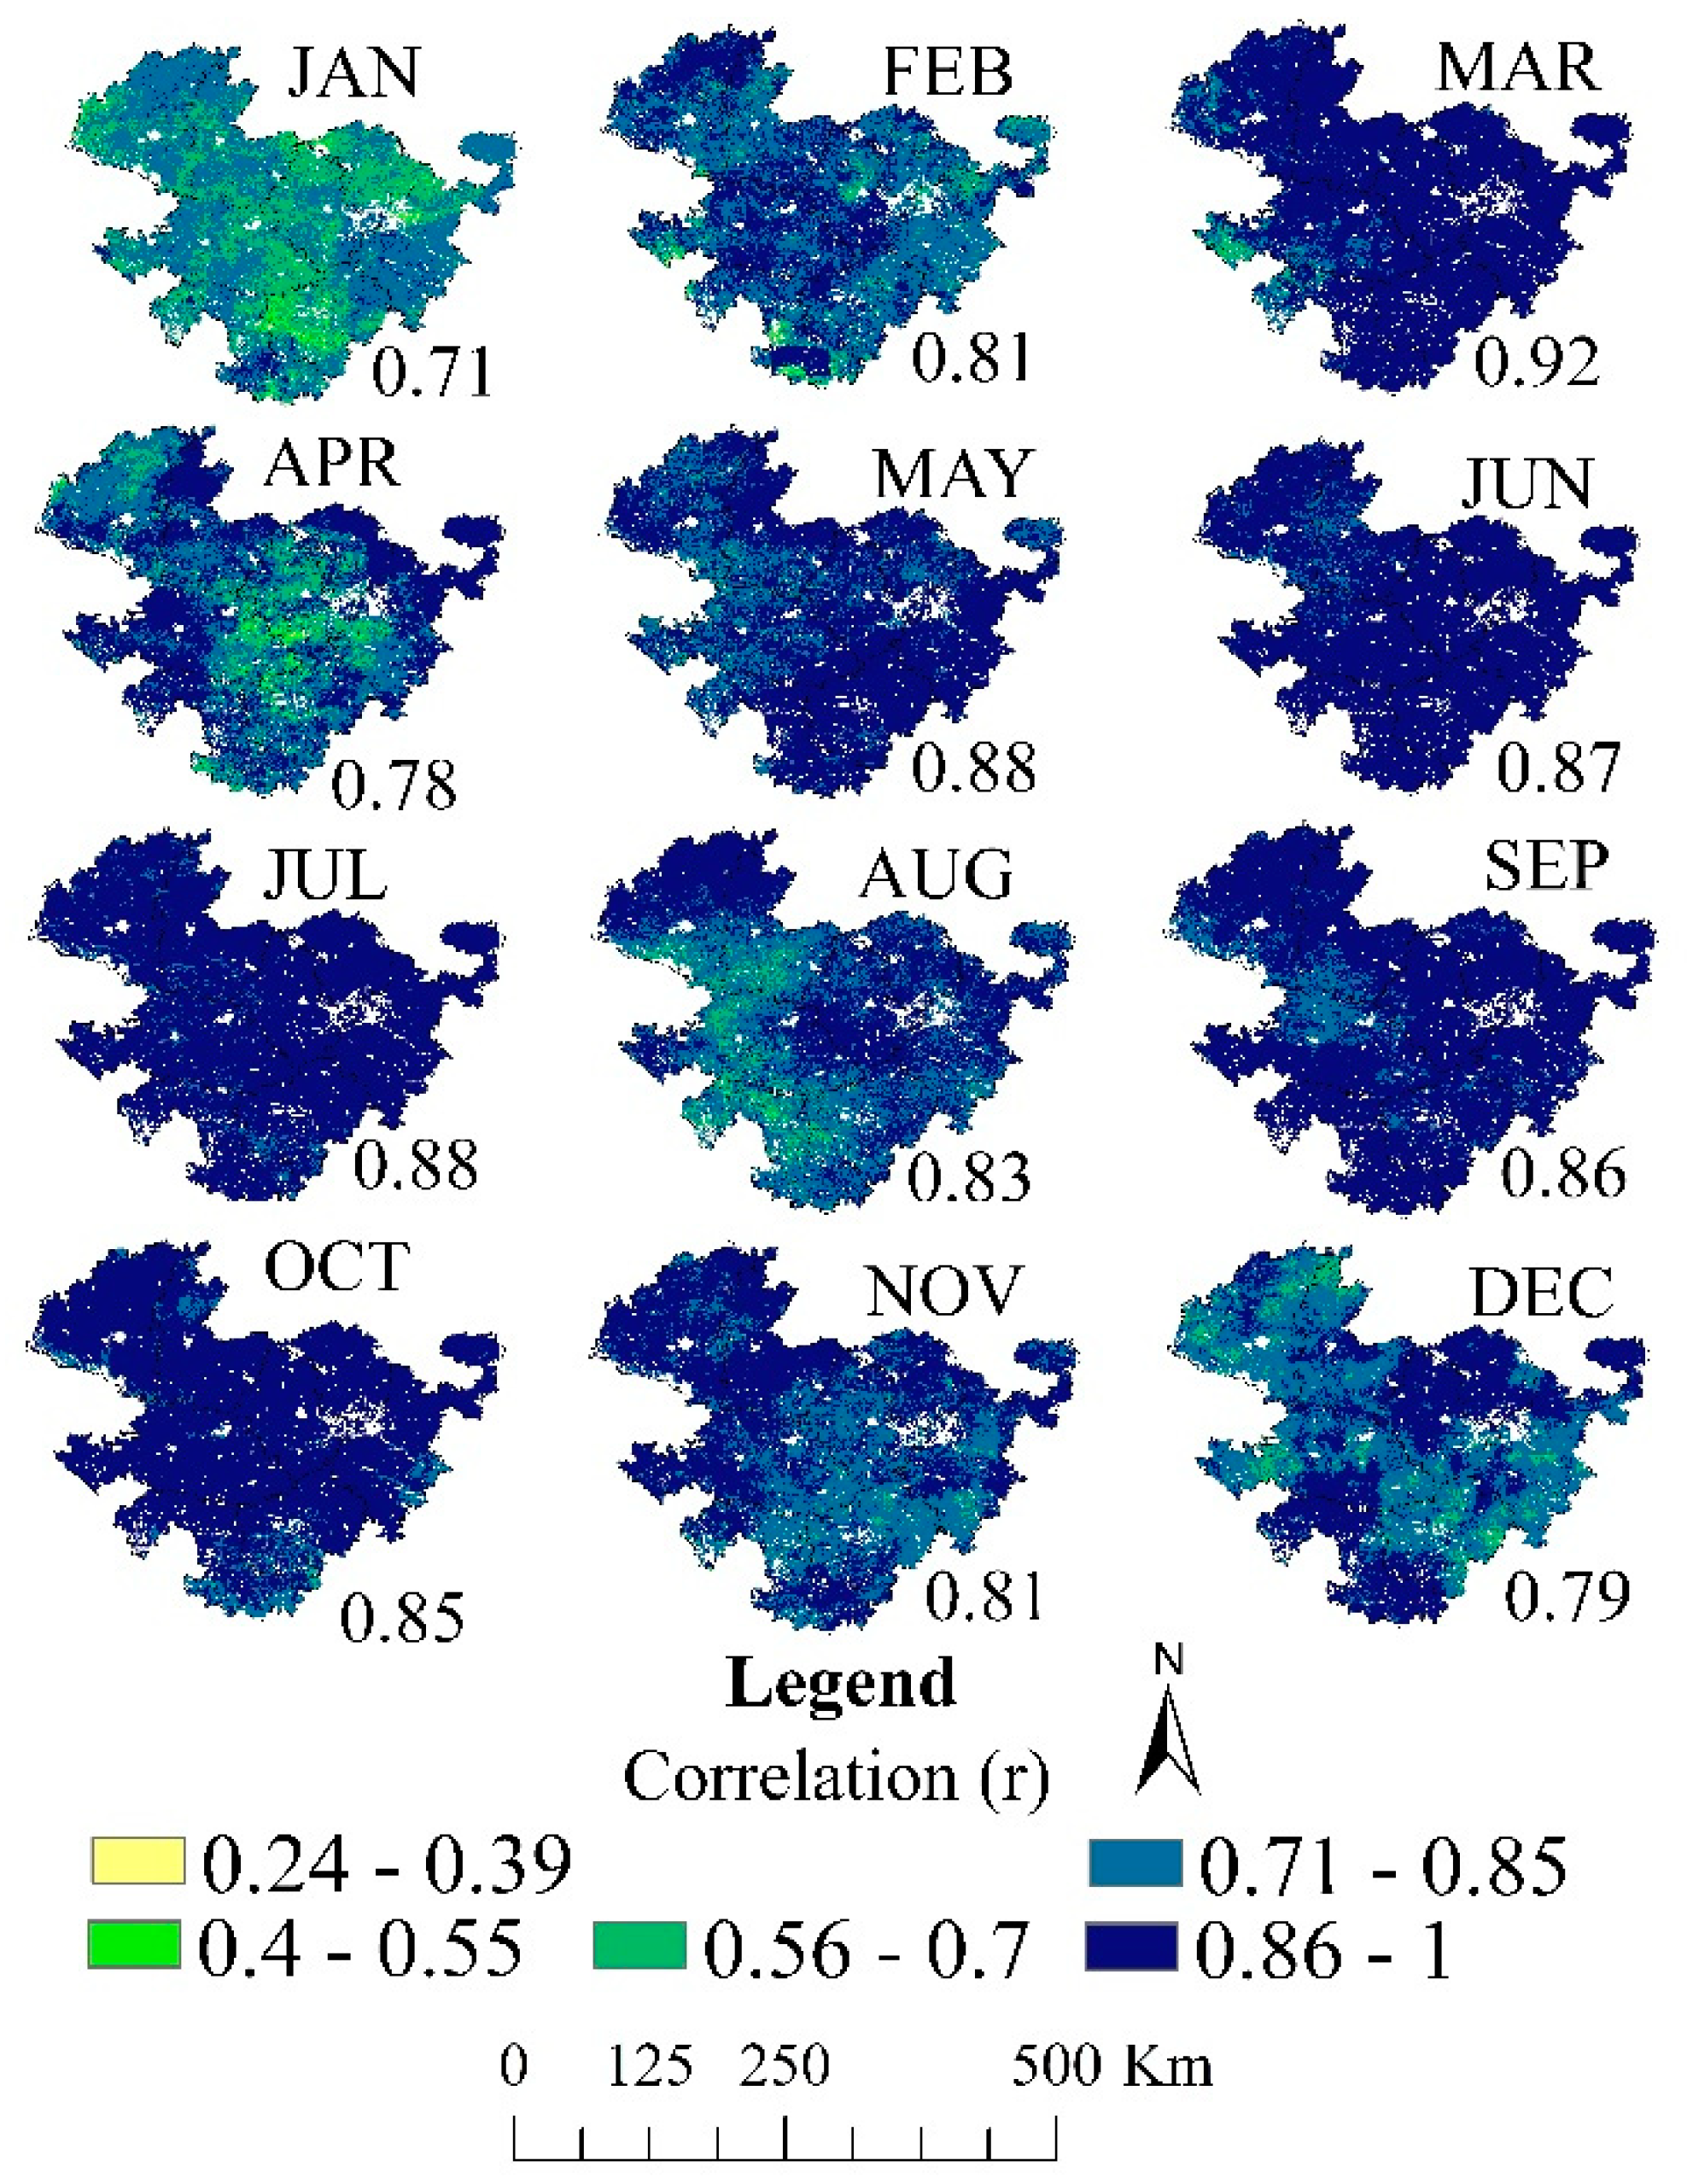
Figure 6 represents the spatial association between the CDI_M results from both methods. The greater correlation (0.71 < r < 1.00) in Method-I and Method-II was found in March (average = 0.92) and May (average = 0.88) over most of the study area. The lowest values (0.24 < r < 0.55) of relationship were found in the Nanded, Aurangabad, and Parbhani districts in January (average = 0.71), and April (average = 0.78). In this study, Method-I is based on fixed assigned weights for calculating the CDI_M, where the highest weight (40%) was given to the rainfall parameter. For most of the months (Figure A2), the correlation between both of the methods was low when Method-II (PCA) has assigned lower weights to rainfall in calculating the CDI_M (e.g., in January, Method-I allotted a 40% weightage to SPI, whereas the PCA method considered only a 9% contribution from SPI). Months with comparatively similar weight in both of the methods for all input parameters (or higher weight to rainfall in the PCA-based method) illustrates a greater correlation in CDI_M results between Method-I and Method-II (Figure A2).

4.1. CDI_M-Based Spatio-Temporal Drought Analysis—Method-I

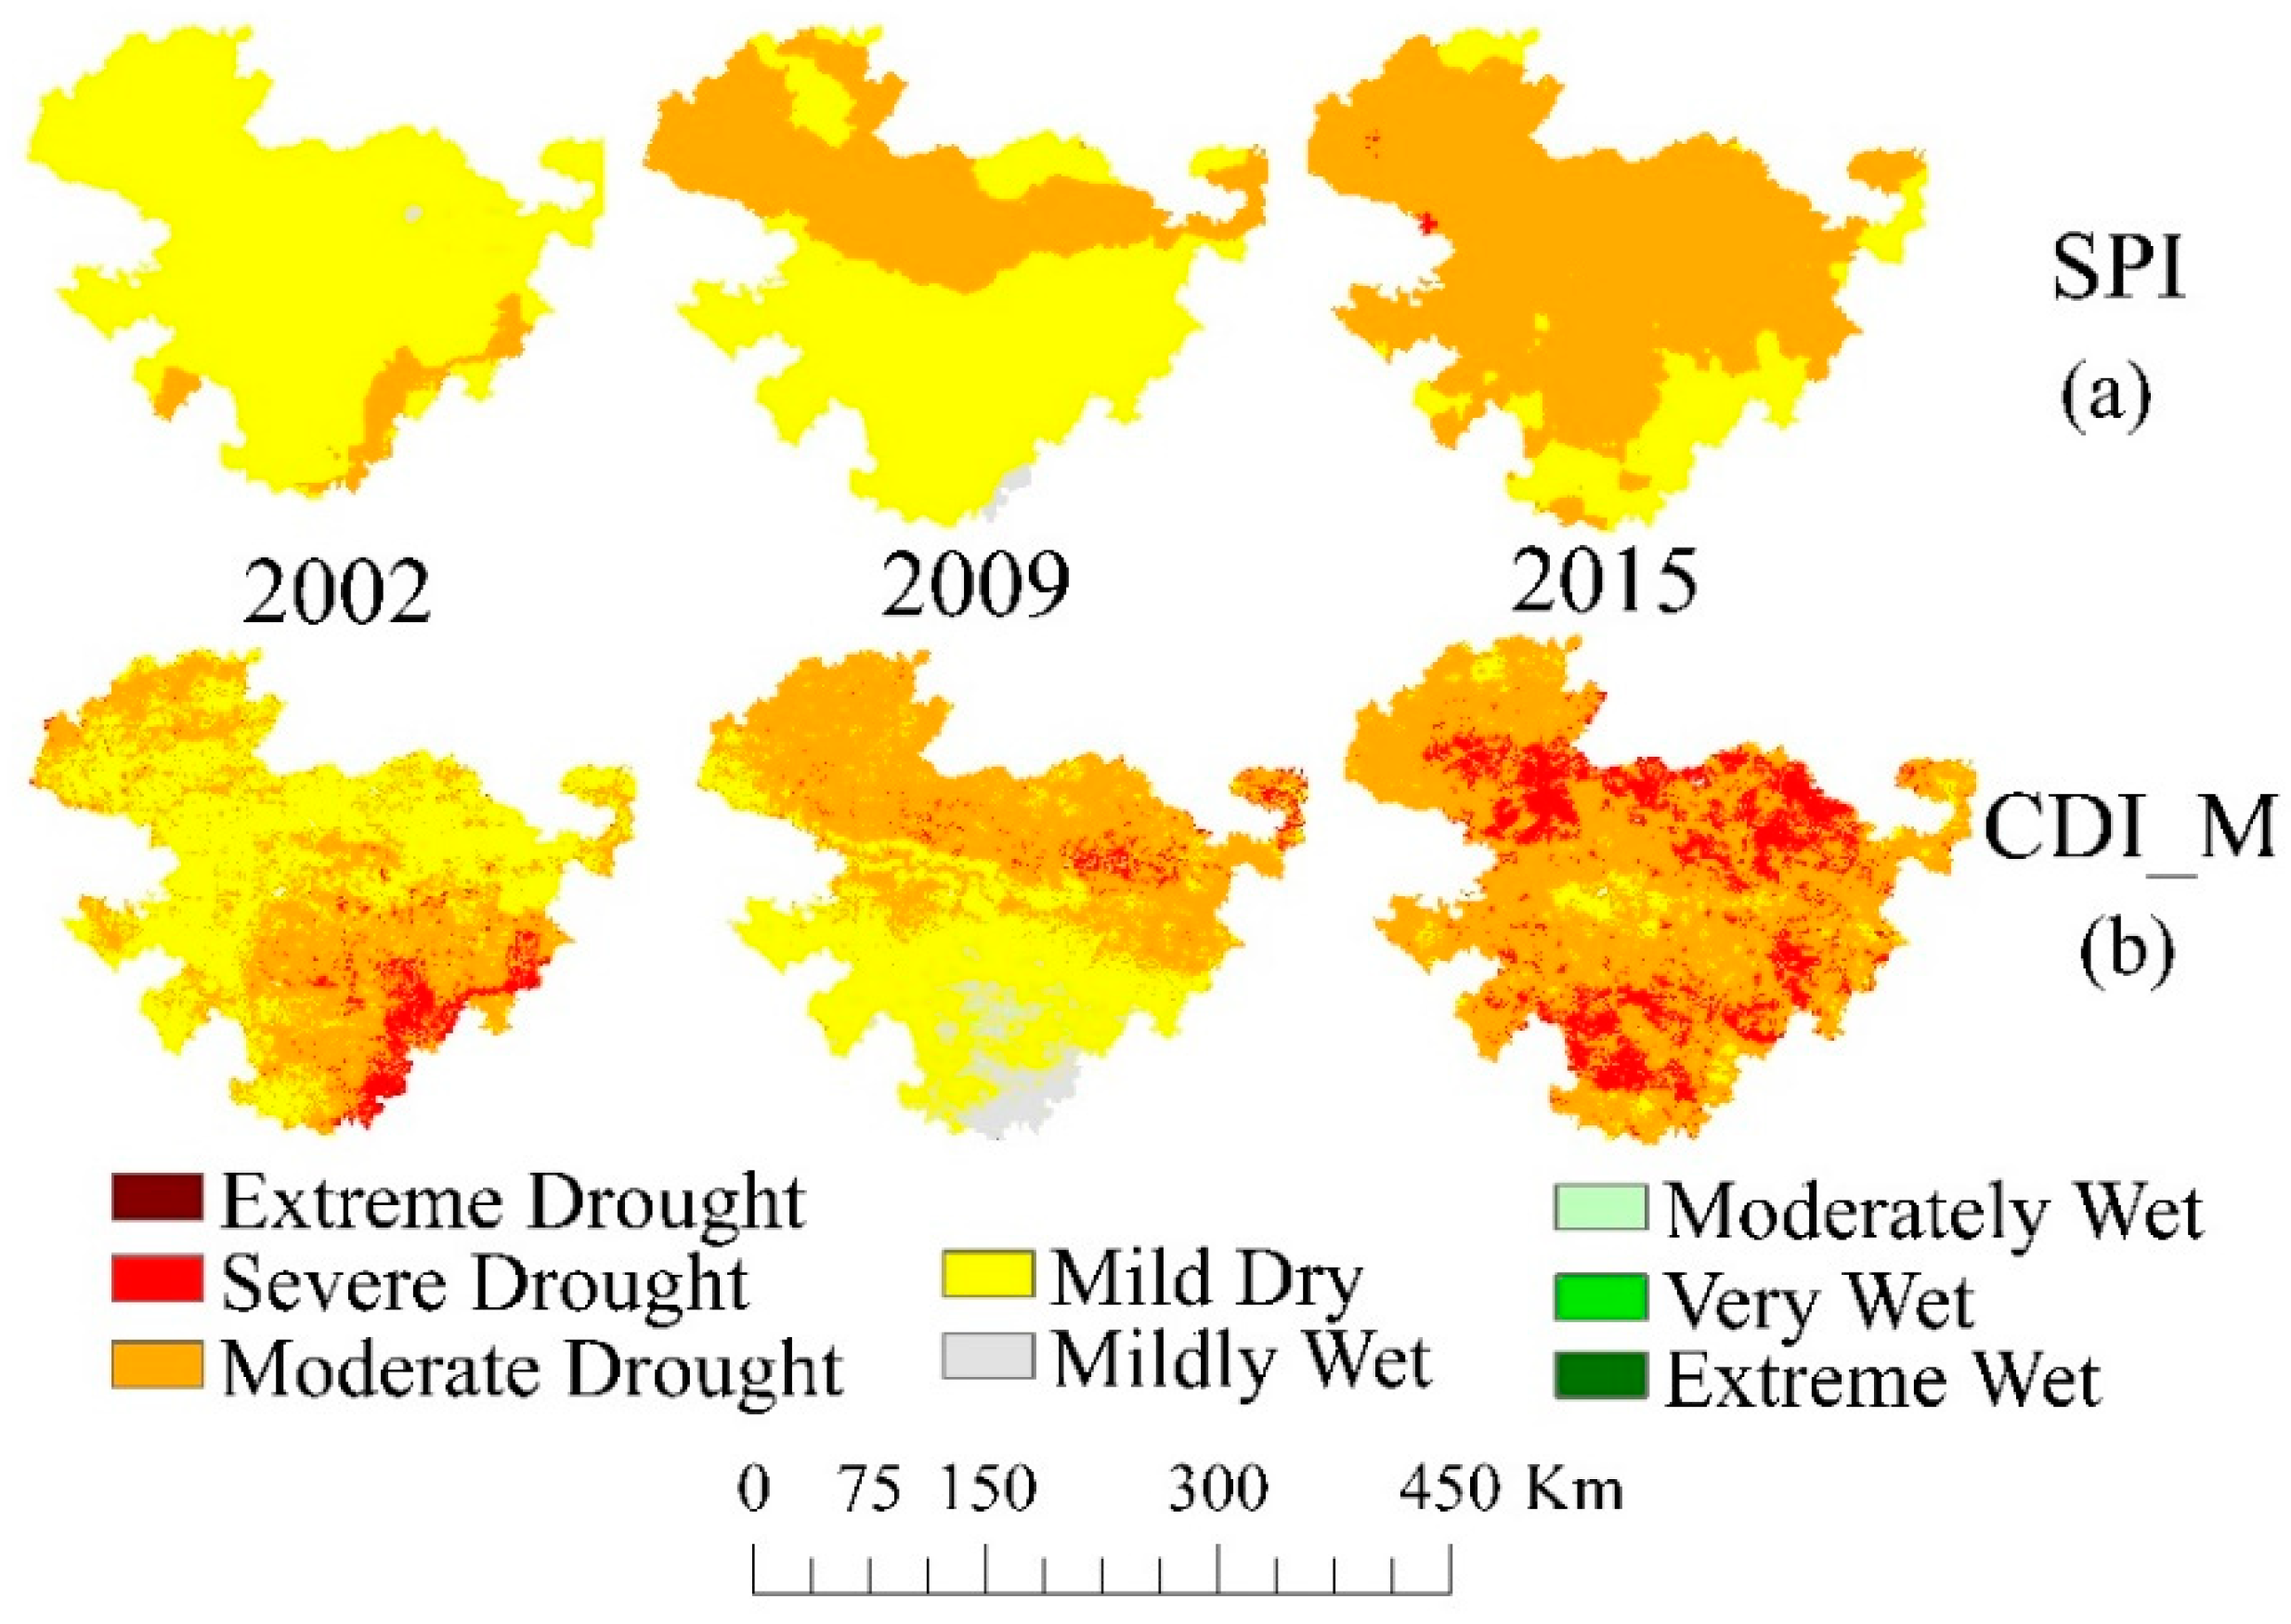
This method of computing the CDI_M is based on predefined weights for all of the input parameters, where the meteorological parameter (SPI) has the highest weight (40%), and equal weights (20% each) were assigned to all the other input variables (LST, SM, and NDVI). The time series of CDI_M was computed to evaluate the spatio-temporal variations in droughts over Marathwada. This method highlighted the years of 2002, 2009, and 2015–2016 as severe drought years, whereas other years were marked with wet or low-intensity dry spells. In the exceedingly affected dry periods of 2002 (53%), 2009 (42%), and 2015 (82%), nearly 40 to 60% of the study area was under severe-to-extreme stress of droughts (Table 4). The central and southern districts of Marathwada (Beed, Latur, and Osmanabad) depicted a consistently high magnitude of dryness over the severe drought years. The influence of long-term and extreme droughts often extend over adjacent years. Therefore, several months during 2003, 2008, 2014, and 2016 also experienced mild to moderate dry stress as an extension of extreme drought years (2002, 2009, and 2015). This method observes that, with SPI, the remaining three input parameters are also collectively responsible for the enhancement of drought severities. Figure 7 shows the spatial coverage of significant drought years over Marathwada, derived from individual SPI method (Figure 7a) of drought analysis and based on CDI_M (Figure 7b). The individual SPI technique was able to identify the drought conditions at some extent, but CDI_M gives the more detailed and precise nature of expanses of drought (Figure 7).
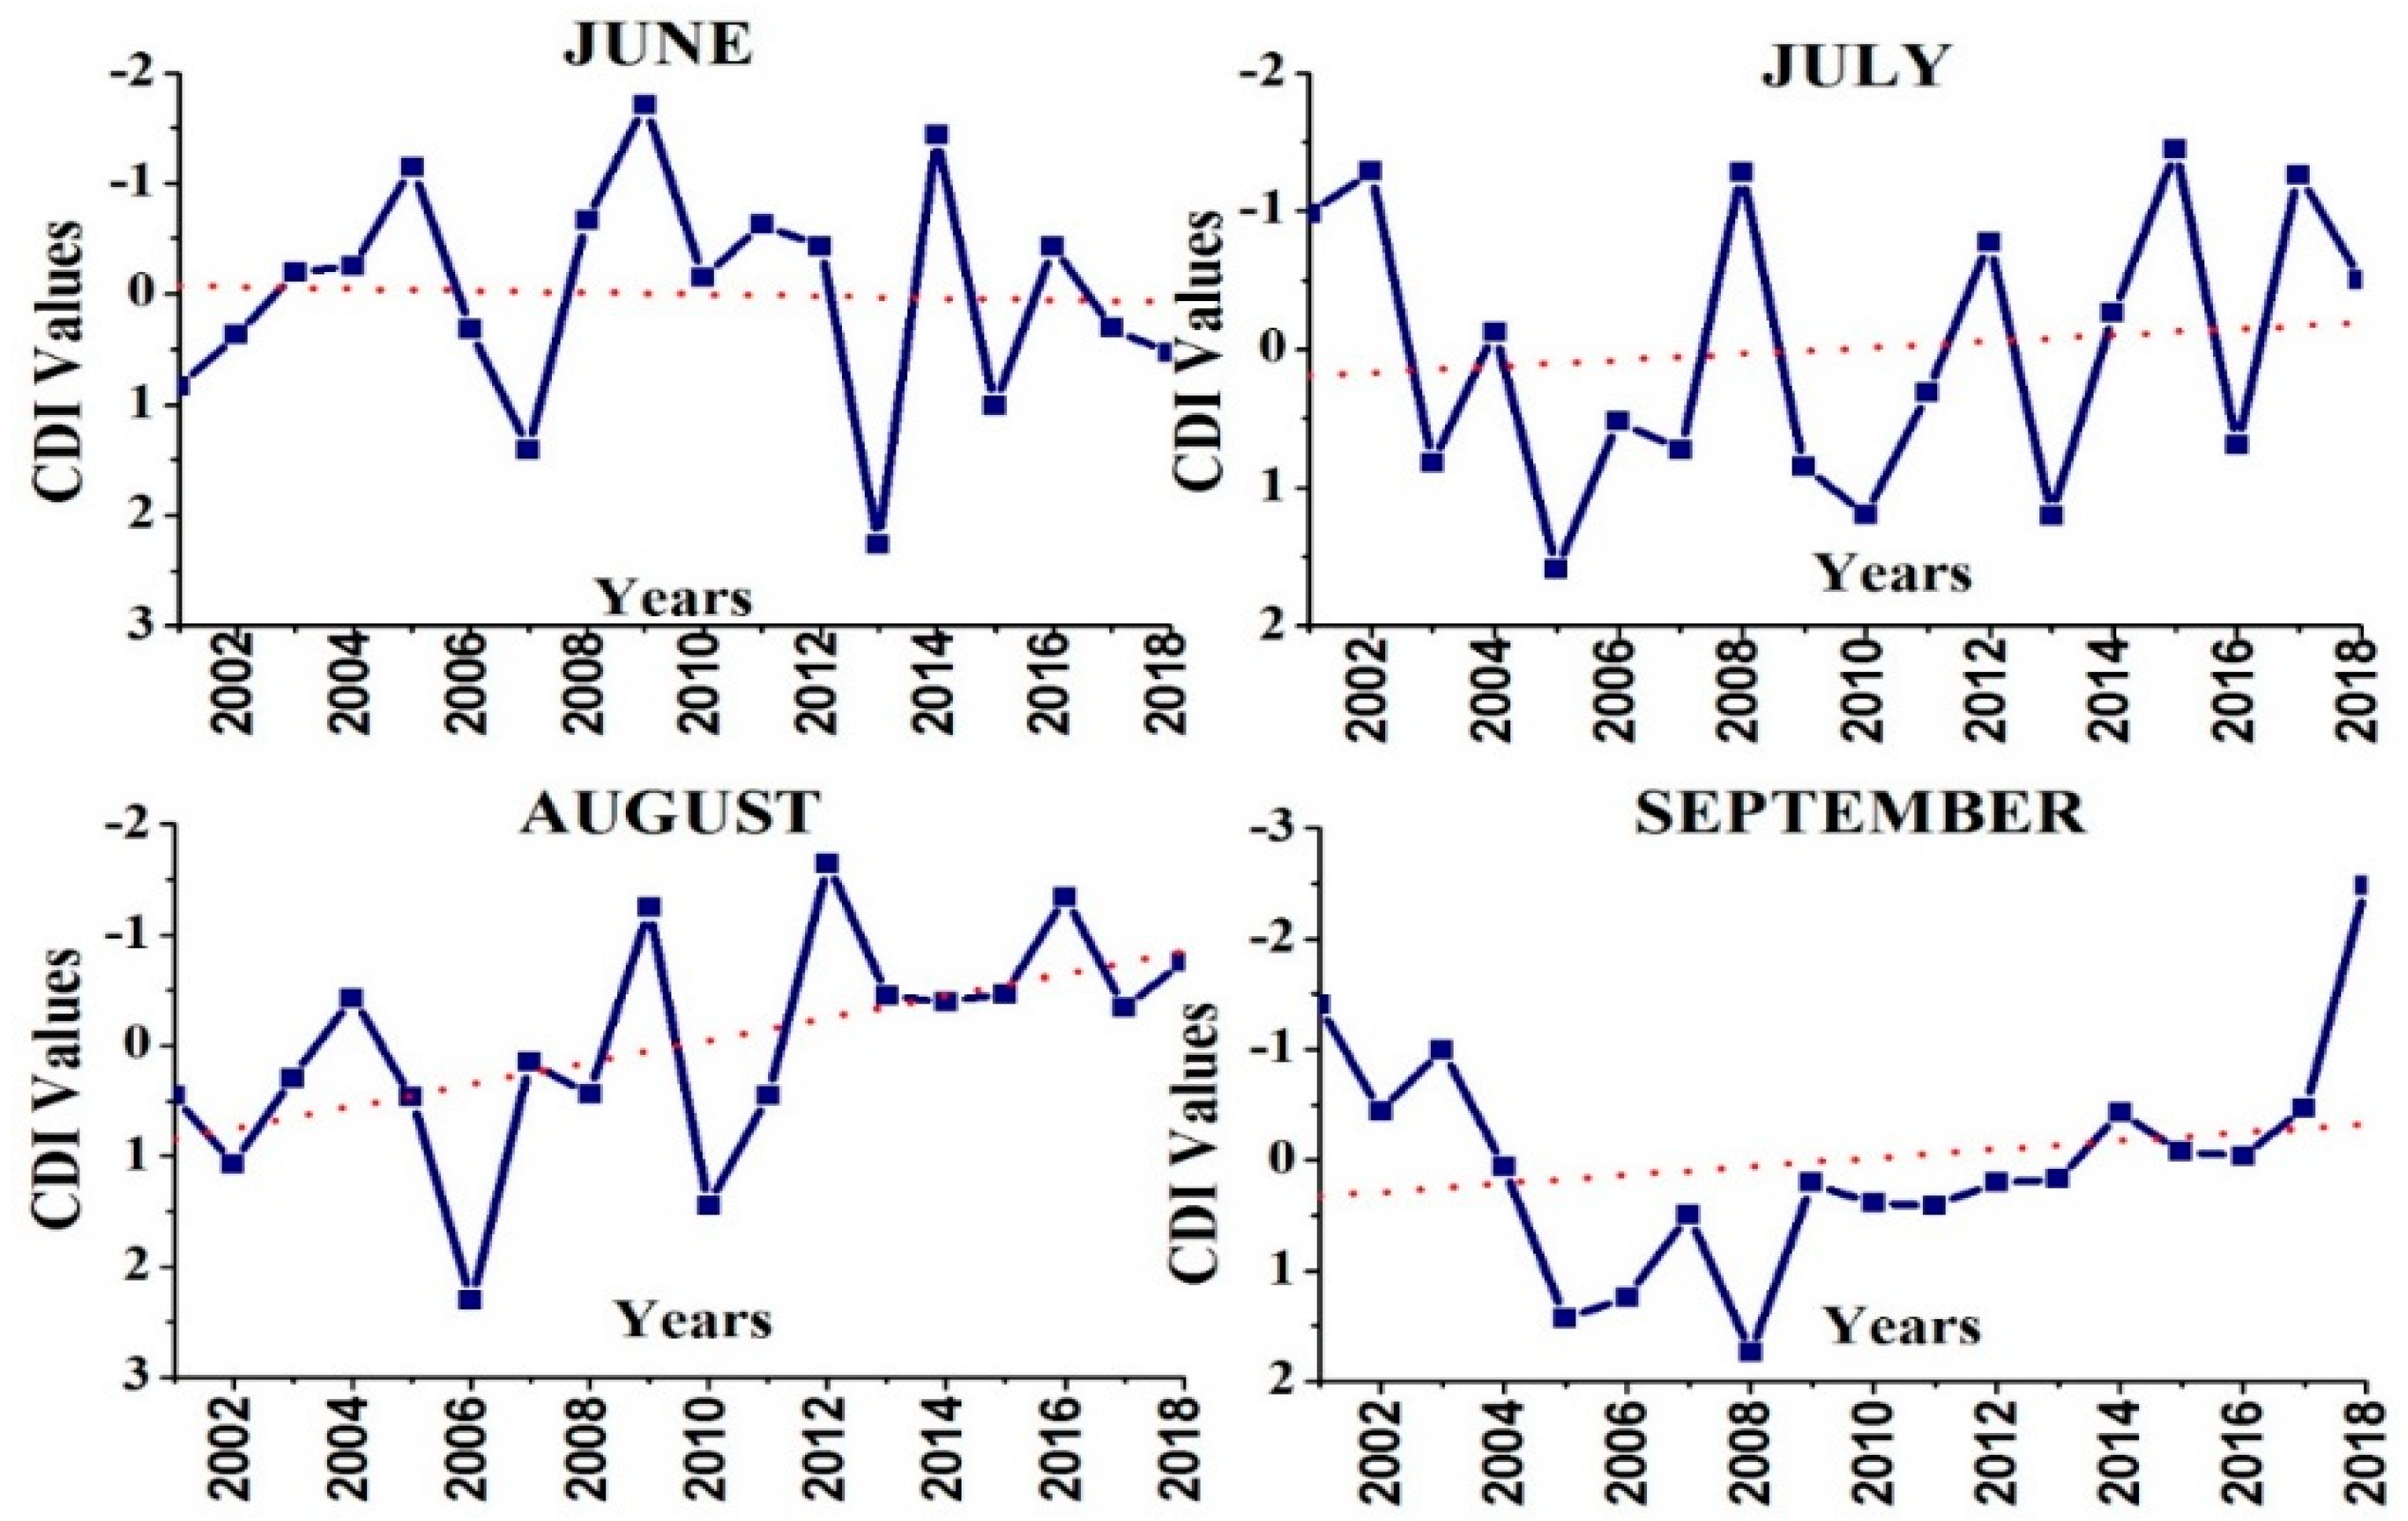
In the CDI_M computation, Method-I assigned a 40% weight to the SPI, and in Marathwada, 80% of the annual rainfall comes from monsoon rains. Hence, compared to other months, this drought assessment method is highly accurate for the monsoon season. The trends in CDI_M values over the monsoon months in Marathwada are graphically represented in Figure 8. This figure exhibits the increasing trend in CDI_M values during July, August, and September. The CDI_M values range from −2 to +2. Lower values of CDI_M (negative) indicate the drier nature of a surface. Therefore, upward trends in the CDI_M inferred the increasing drought intensities from 2001 to 2018 in Marathwada. The enhanced drought stress is more pronounced in August and July, which are the primary sowing months for the Kharif crops. Other than monsoon months, an increasing trend in CDI_M values was also noticed during February, April, and October within the study area.

4.2. CDI_M-Based Spatio-Temporal Drought Analysis—Method-II

In this method, the PCA technique is used to integrate all the input parameters for the development of the CDI_M. The PCA-based method takes care of monthly variations in input variables and their changing percentage contribution with respect to space and time. Hence, the PCA-based CDI_M method seems to be more effective for drought monitoring over Marathwada. In this method, the first PC value is considered to assign the specific weight for each input parameter (SPI, SM, NDVI, and LST). Table 5 indicates parameter wise average weights for every month over Marathwada, whereas Figure A3 represents the sample of the spatial distribution of contribution of each input parameter in June. It is noted that on an annual scale, and in both the crop harvesting seasons (Rabi and Kharif), soil moisture is the highest contributing (35%) parameter in the CDI_M followed by LST (25%), SPI (21%), and NDVI (18%). The spatial distribution maps of weights for the Rabi season (harvesting months) show the highest weight values for SM and NDVI, and the lowest values are for the SPI and LST, at the central part of Aurangabad, Beed, and Jalna district. During the Kharif season (harvesting months), in the extreme southern portion of Osmanabad district, SM is given the maximum weighting followed by eastern and central Aurangabad for SPI and LST.
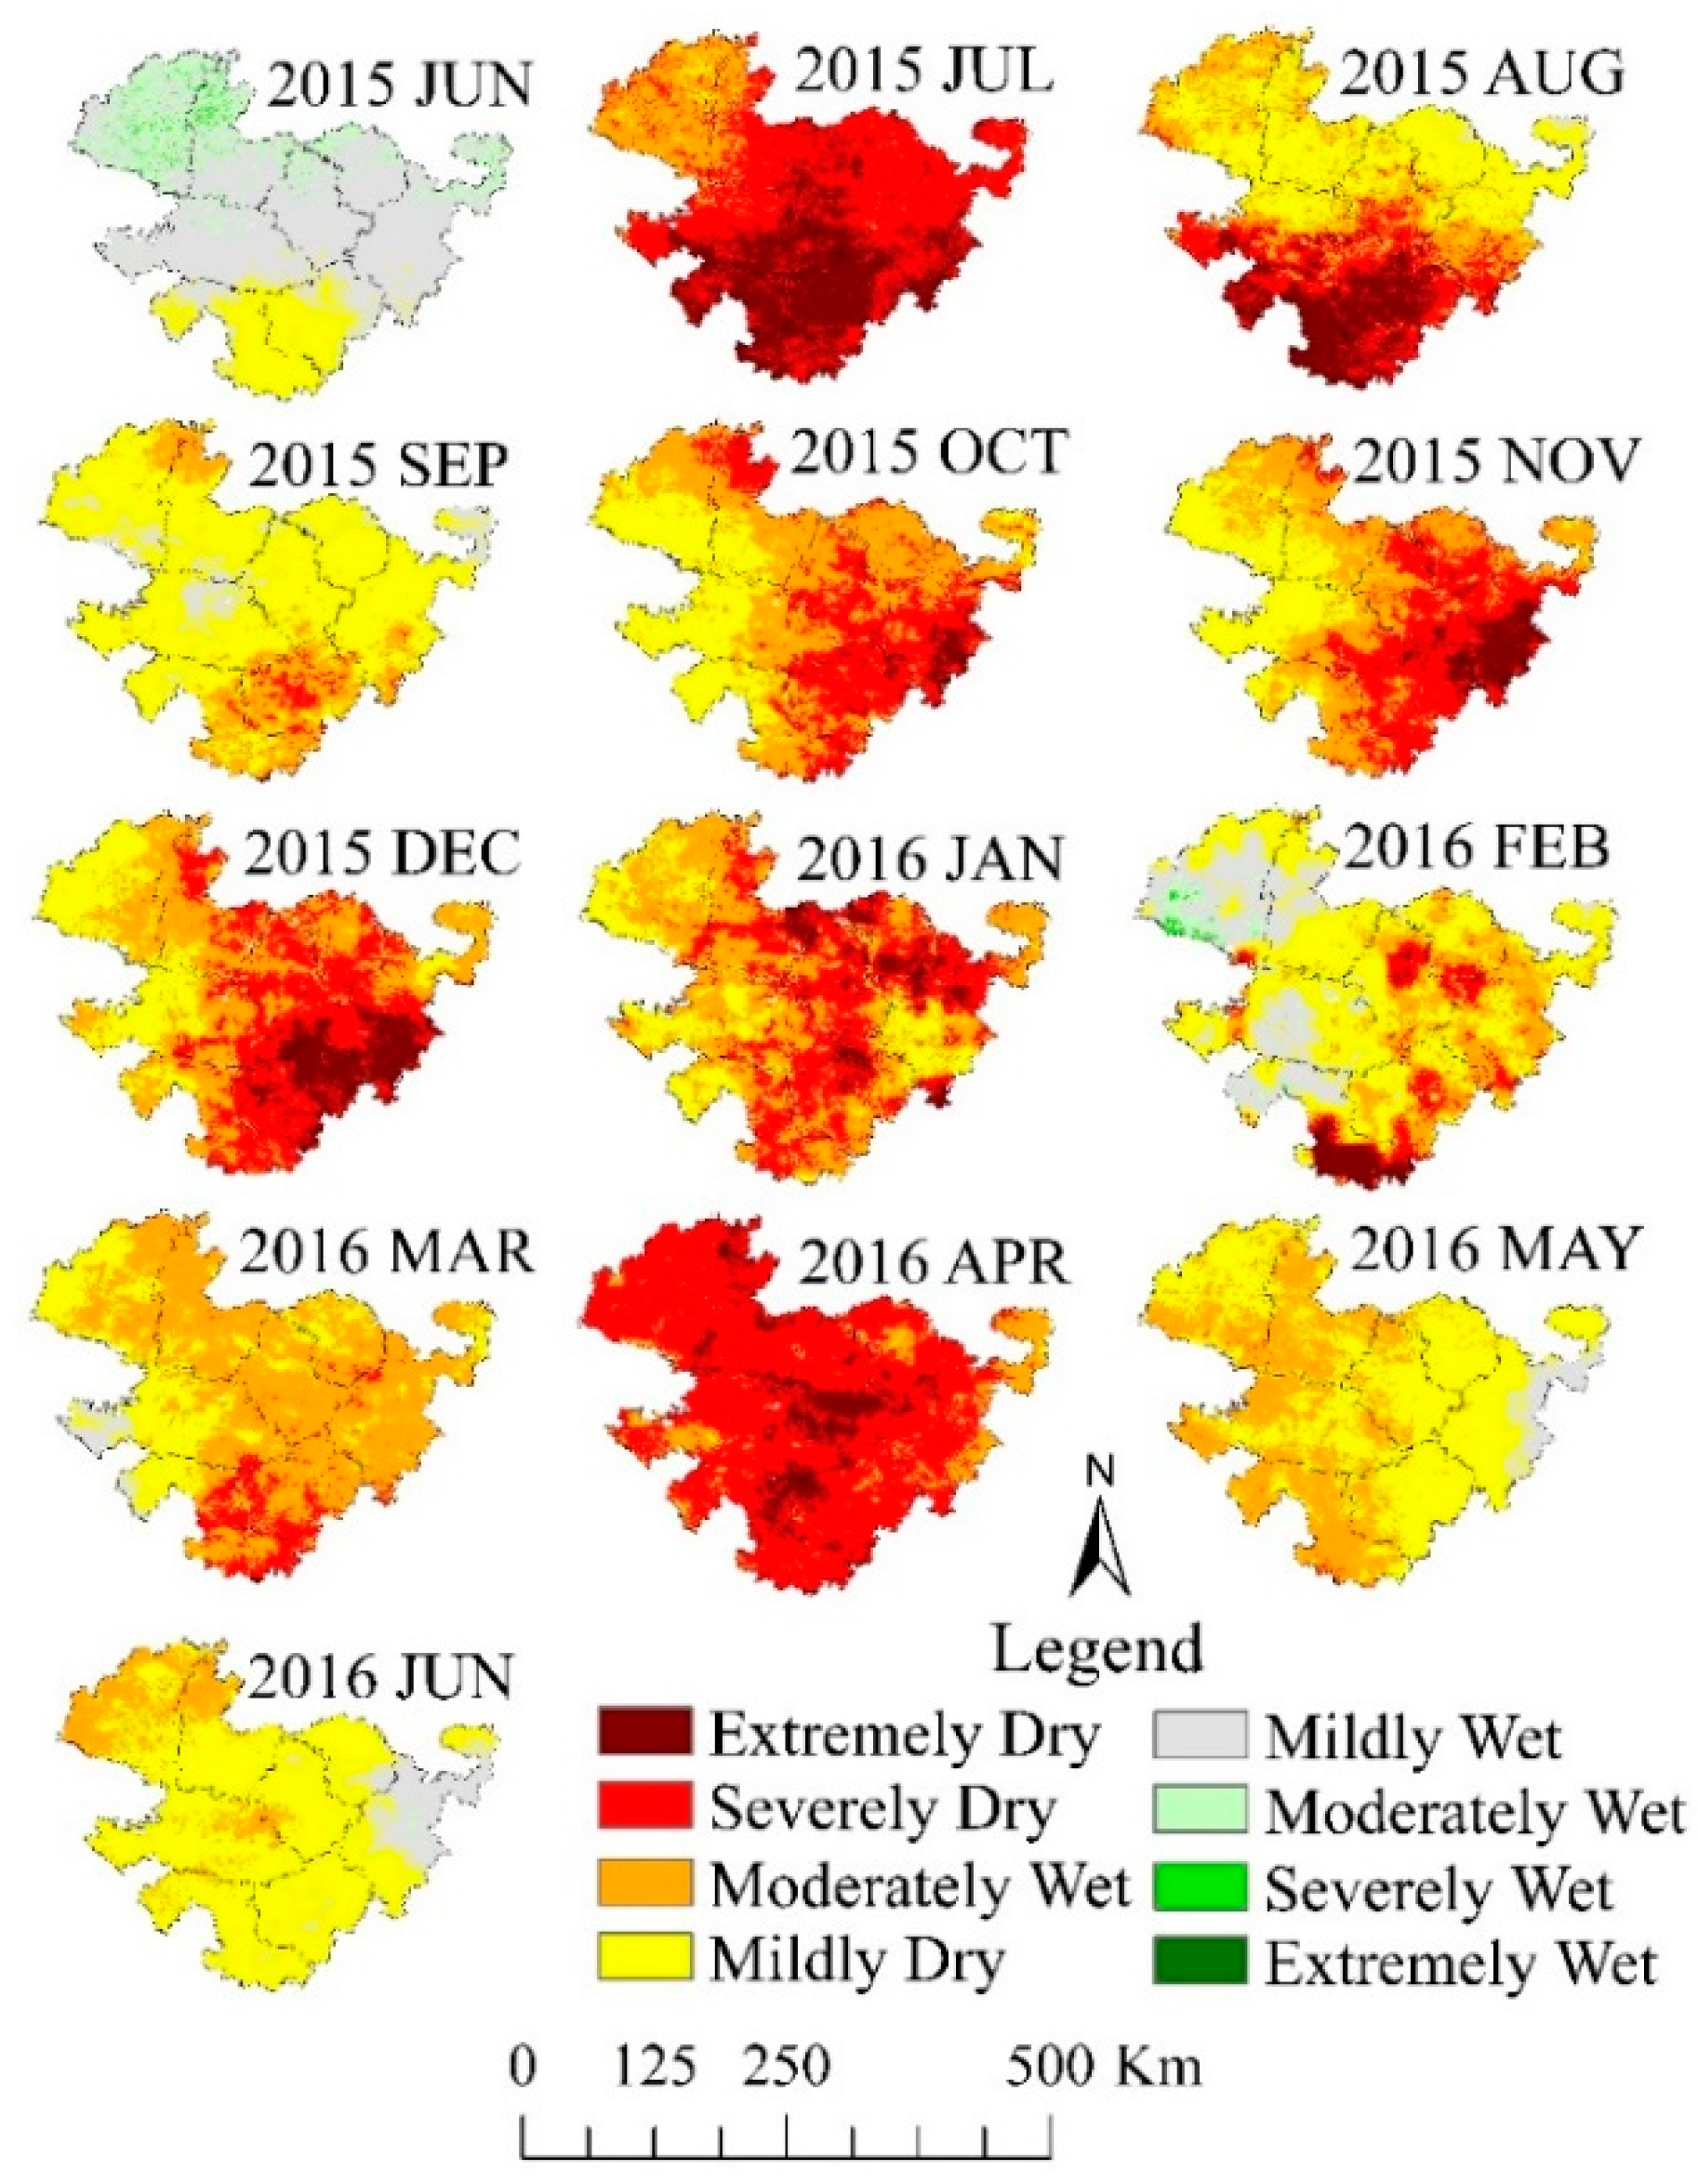
The time series of CDI_M maps from this method have highlighted the monsoon and postmonsoon months of 2015 and the premonsoon season of 2016 as the most severe drought period over Marathwada during our study’s period of record. These two years and in particular the months of July, August, October, and April were noted as one of the most life-threatening droughts of the 21st century [43]. In July 2015 and October 2016, nearly 92% of the Marathwada region experienced severe-to-extreme drought conditions, and the average CDI_M values for most of the districts were less than −1.92. This severity of the drought continued for almost eleven months, starting from 2015 July to mid-June 2016 (Figure 9). During this period, the average spatial drought spread has varied from 30% to 95% with respect to each month. In general, the south, southeastern, and central region of the Marathwada, which covers a major part of the Osmanabad, Beed, Latur, and Parbhani districts, was frequently under rigorous dry spells (Figure 9). Higher elevation and less availability of surface water resources are the common characteristics for almost all of the regions mentioned above. These characteristics might have acted as additional parameters for the enhancement of drought severities and the reduction in agricultural productivity over the 2015–16 period.
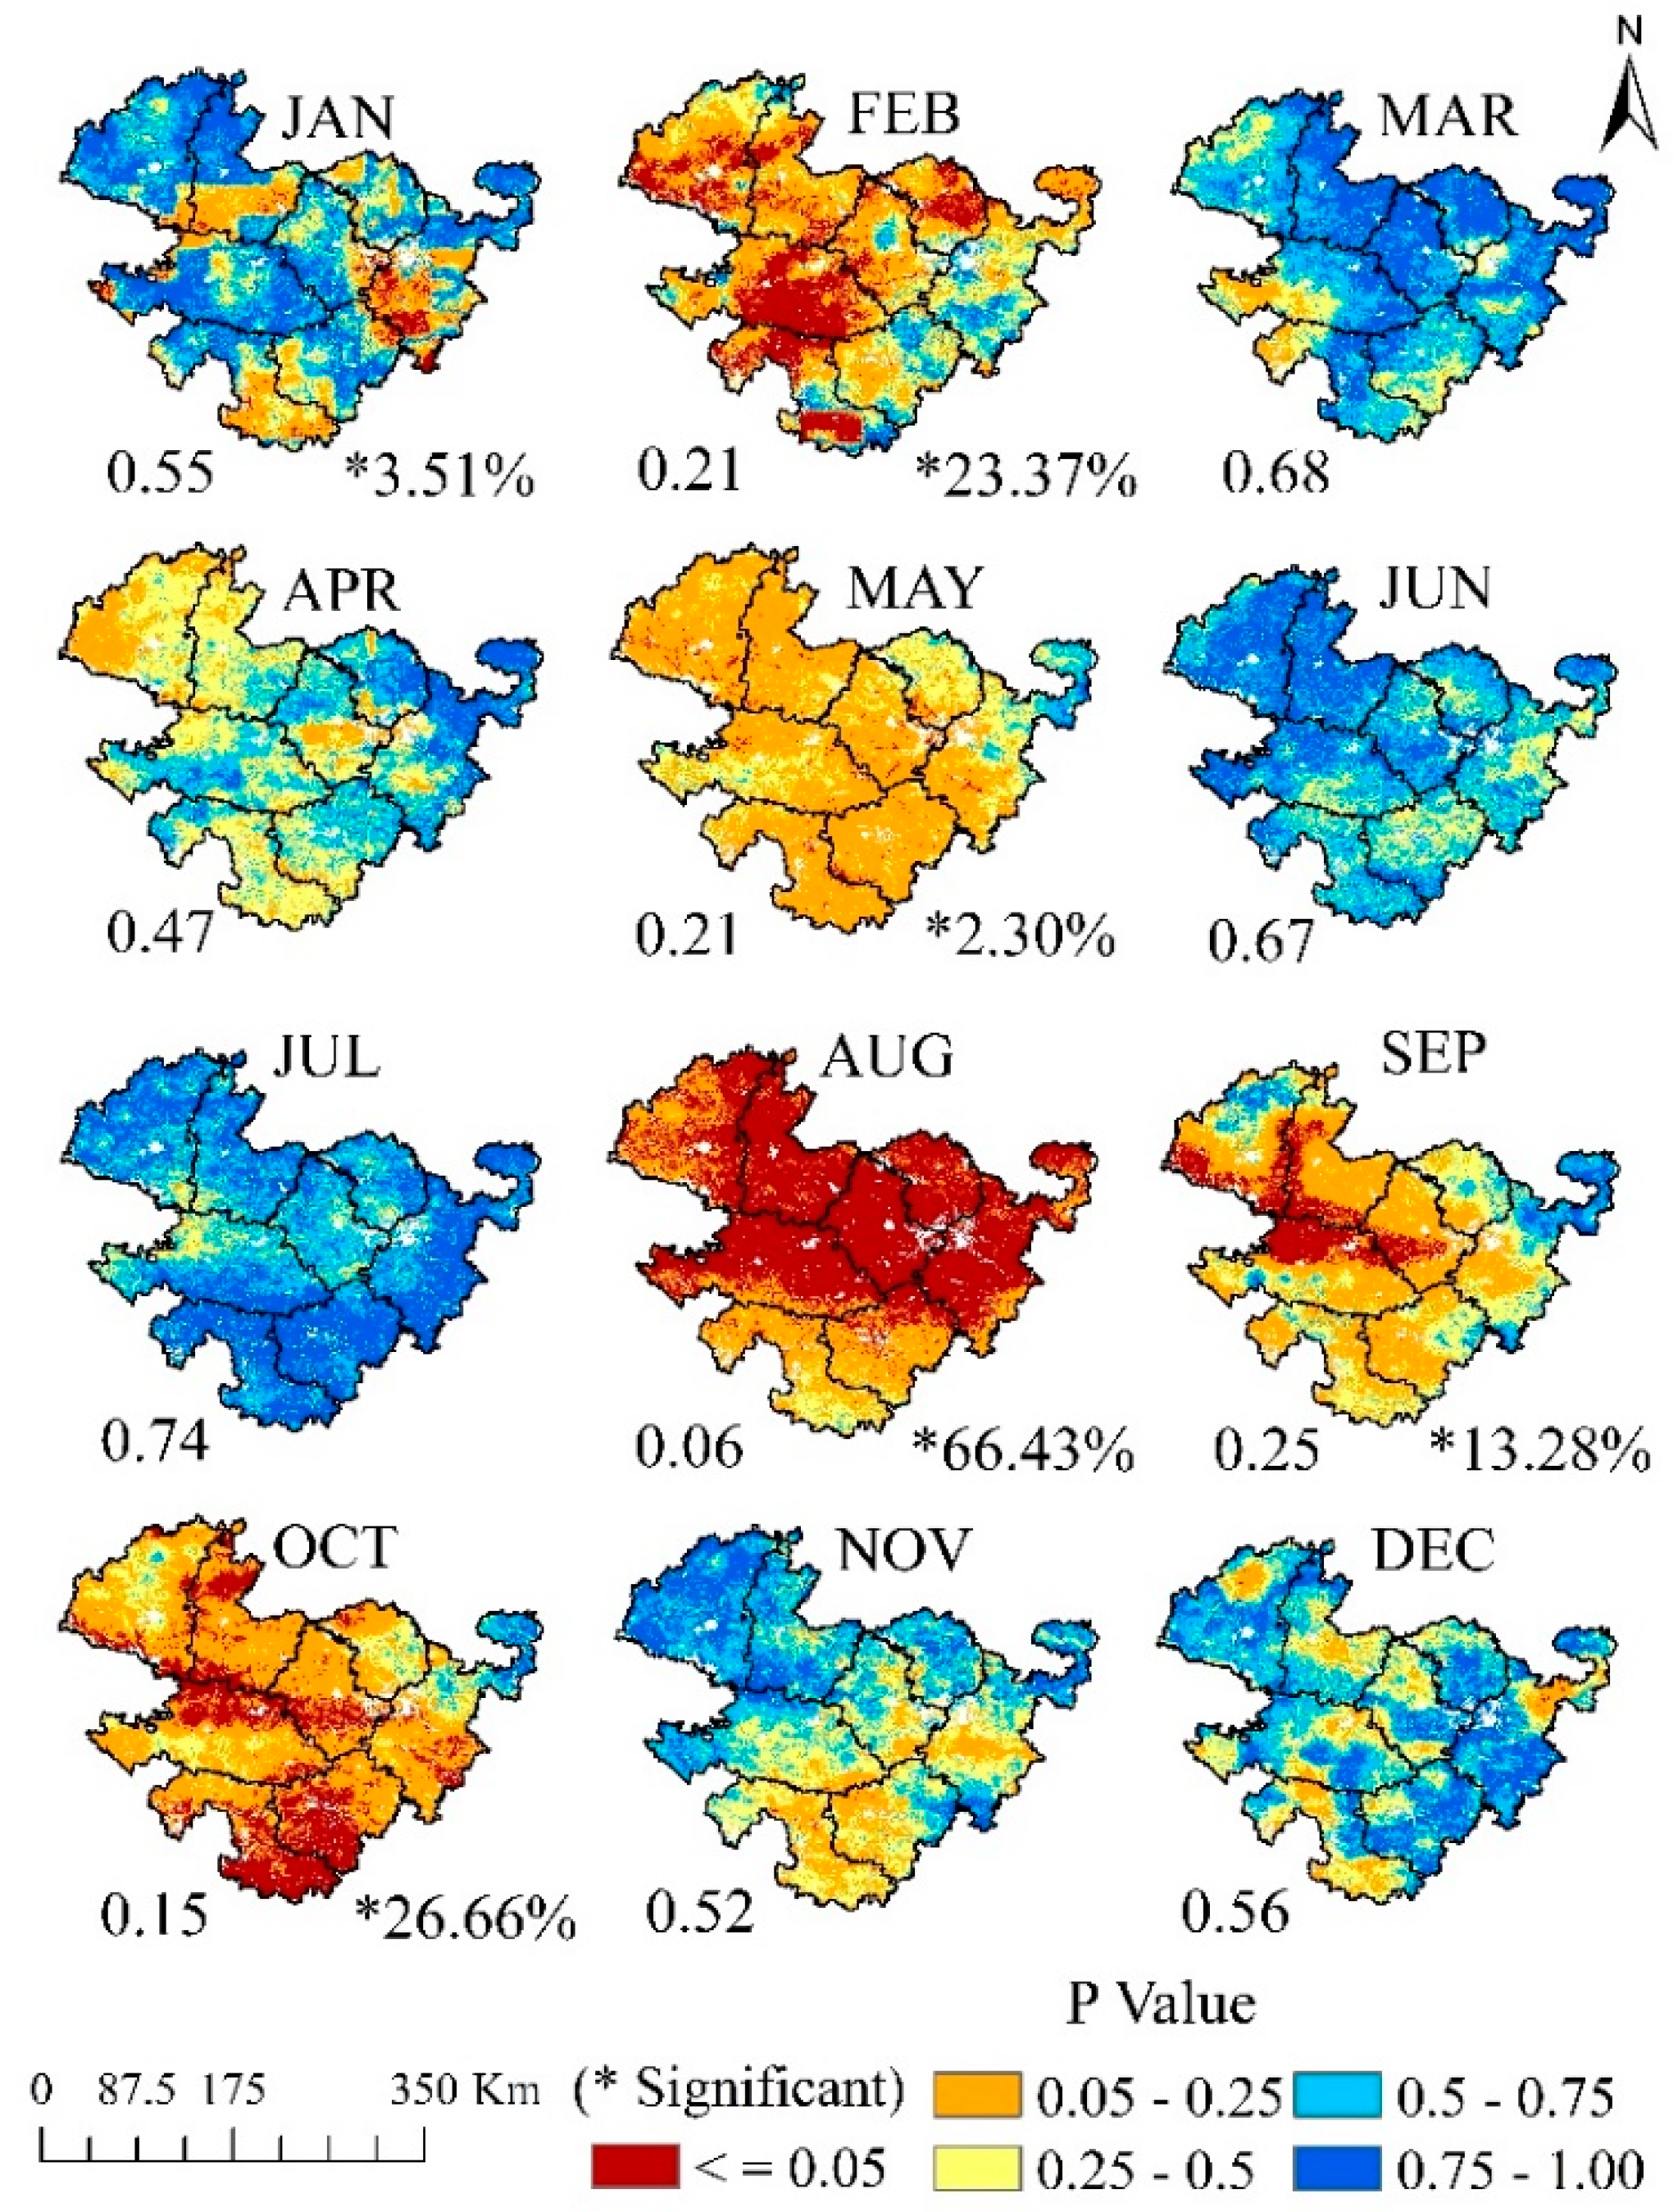
Like Method-I, this method also depicted 2002 and 2009 as drought years, but compared to the first method, the PCA-based technique showed higher variations in month wise spatial distribution of droughts over Marathwada. Figure 10 represents the monthly spatial spread of statistical significance (P values) of the CDI_M values with respect to years. In August, 66.4% of Marathwada noticed a significantly increasing trend (p ≤ 0.05, hence, accepted the alternative hypothesis, i.e., drought intensities are increasing with respect to time) in CDI_M intensities, followed by October (26.7% area, where p ≤ 0.05), February (23.4% area, where p ≤ 0.05), and September (13.3% area, where p ≤ 0.05) (Figure 10). CDI_M values range from −2 to +2; therefore, the increasing trend means CDI_M values are shifting towards more negative values, overtime for the period 2001 to 2018. In all of the above-identified months, parts of Hingoli, Parbhani, and Beed districts have experienced a significant upwelling trend in CDI_M values, whereas Aurangabad and Osmanabad districts noticed it in August and October, respectively (Figure 10). The results of spatio-temporal trends in the CDI_M emphasizes the necessity of a PCA-based drought assessment method for the region and month specific drought management strategies.

4.3. CDI_M and Its Relation with Crop Yield

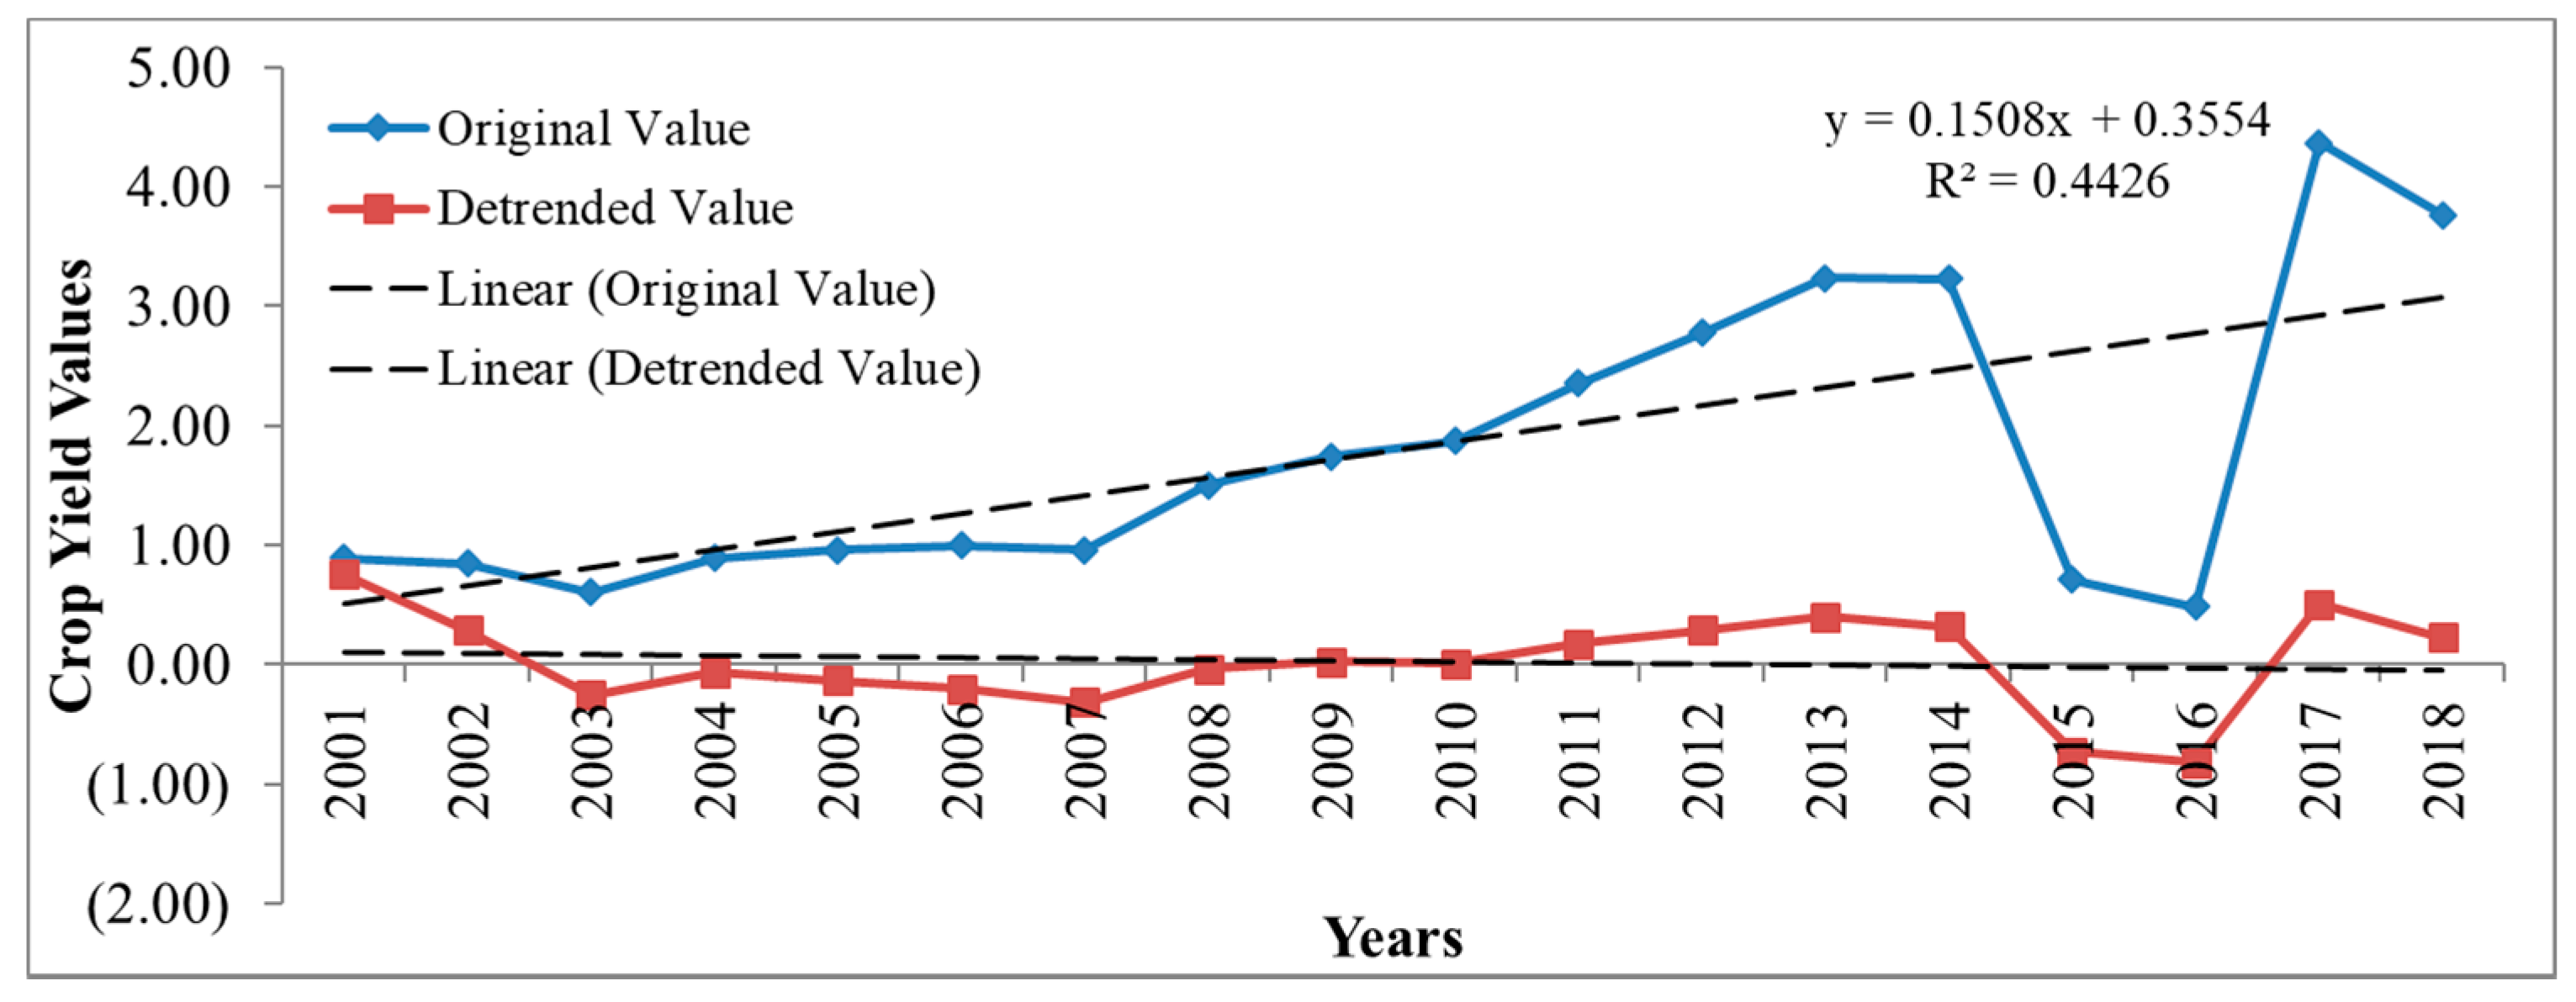
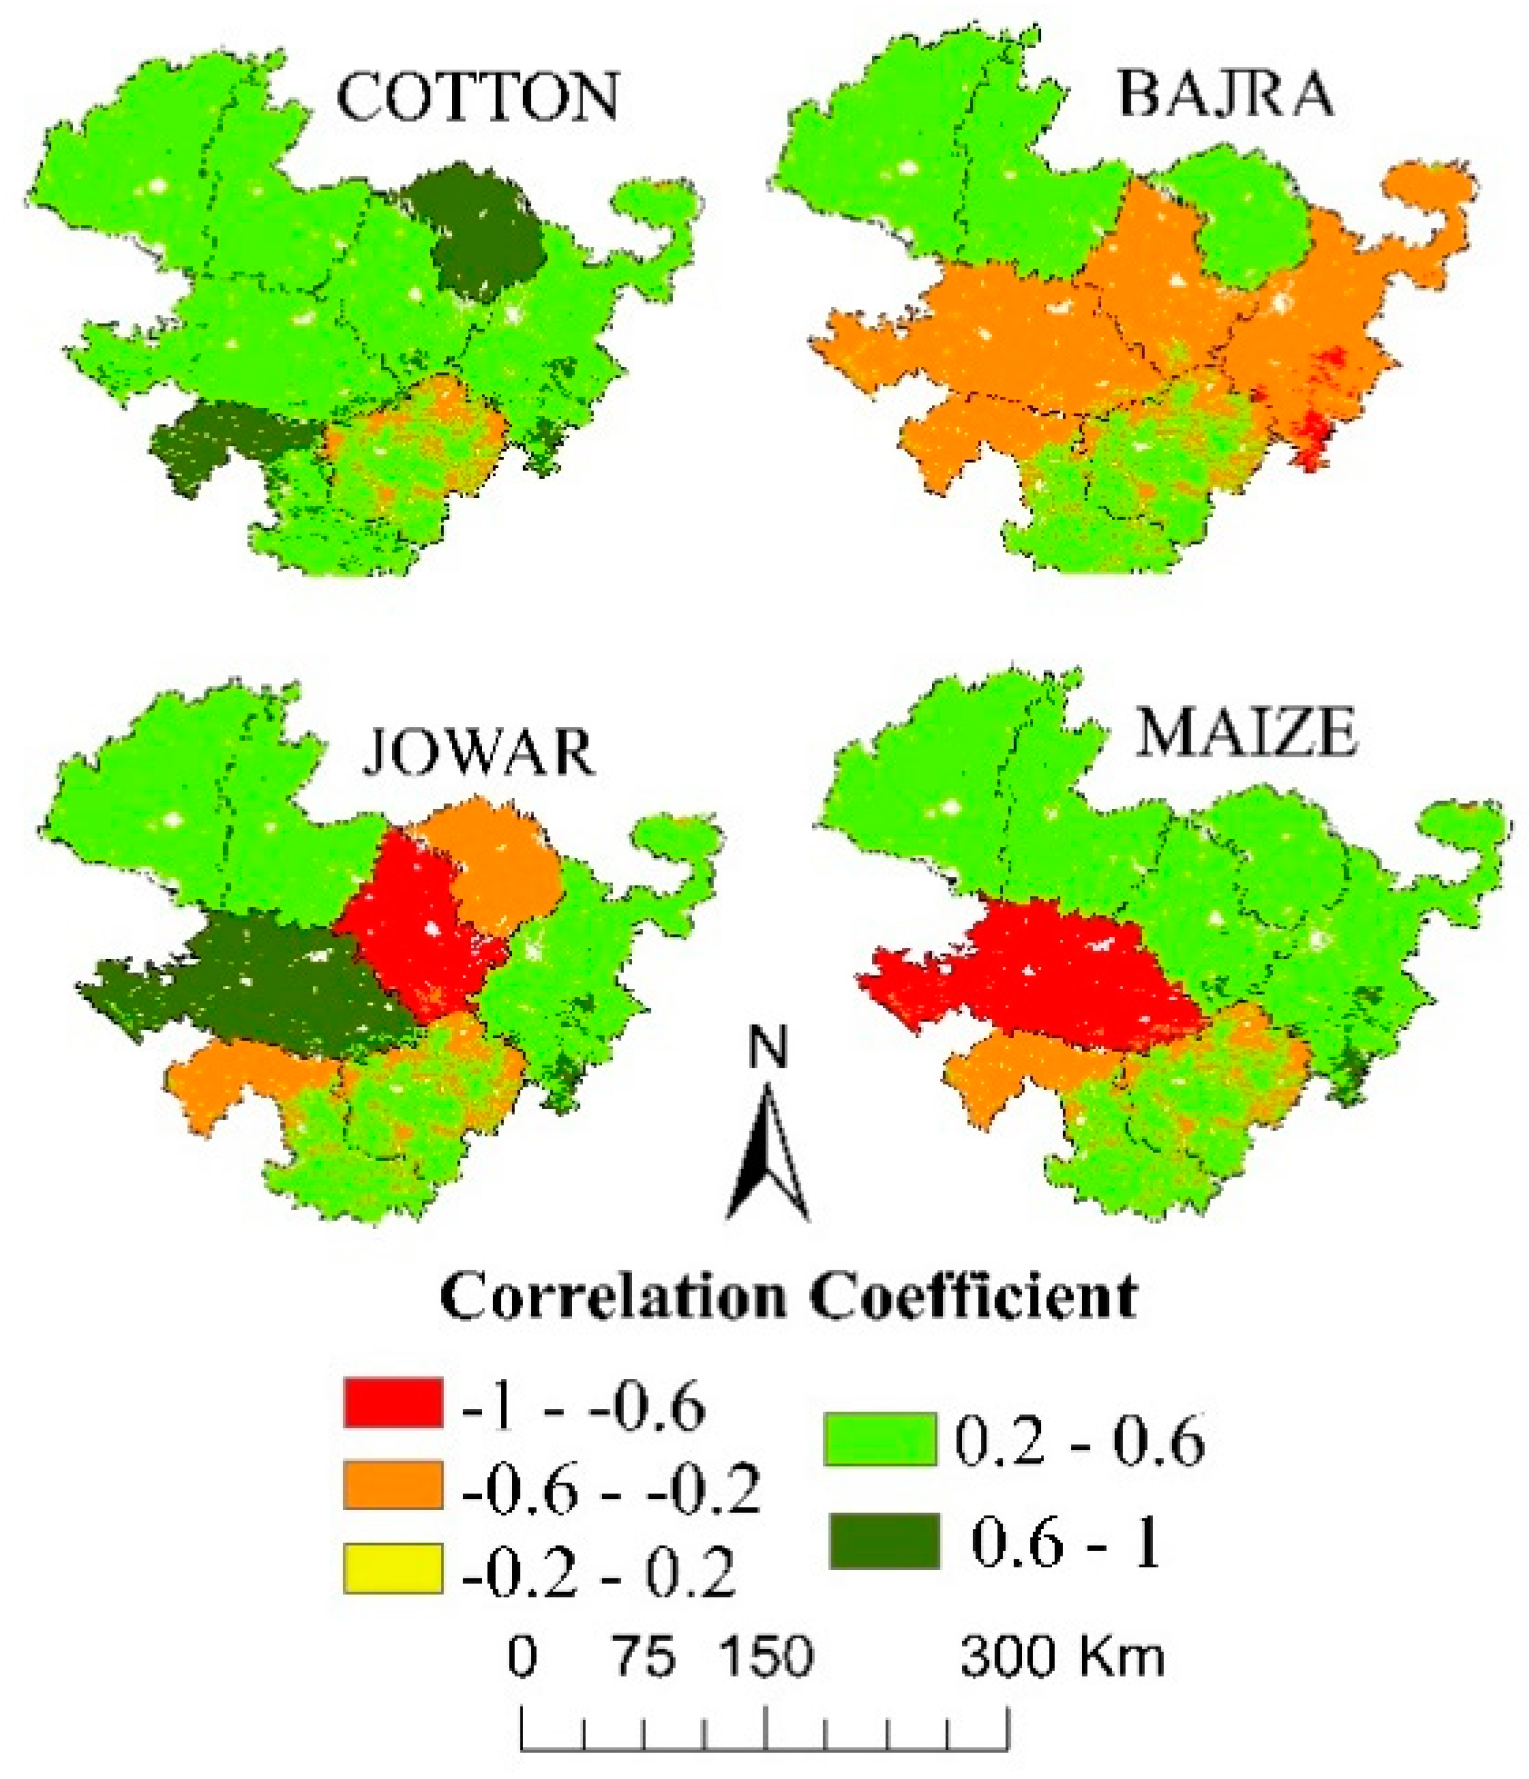
Numerous studies have observed the significant negative effect of severe to extreme drought events on crop yields over the USA [66], Canada [66], China [67], Korea [68], Bangladesh [69], and other parts on the world. India has particularly shown the highest risk of reduction in maize crops under the drought years [66]. Intense dry spells in India always have a dire influence on the community and environment. Marathwada agriculture sector, in particular, bears 80% of the direct impacts of severe drought events. Therefore, in the present research, we have tried to comprehend the spatio-temporal association between major crop yields and cropping season drought incidences. To reduce the influence of other non-agro-climatological parameters on crop production, all the crop yield datasets were detrended, as shown in Figure 11. Further, these detrended crop yield values were compared with the monthly CDI_M intensities using the statistical correlation method. CDI_M values from both the CDI_M computation methods and for all the wet and dry years were compared to the detrended anomalies of crop yields; however, in the drought years, the outcomes from the PCA-based CDI_M method showed a greater correlation (r > 6.5). Hence, the relationship between the CDI_M from Method-II (PCA-based) and crop yield anomalies is discussed below.

4.3.1. Rabi Season

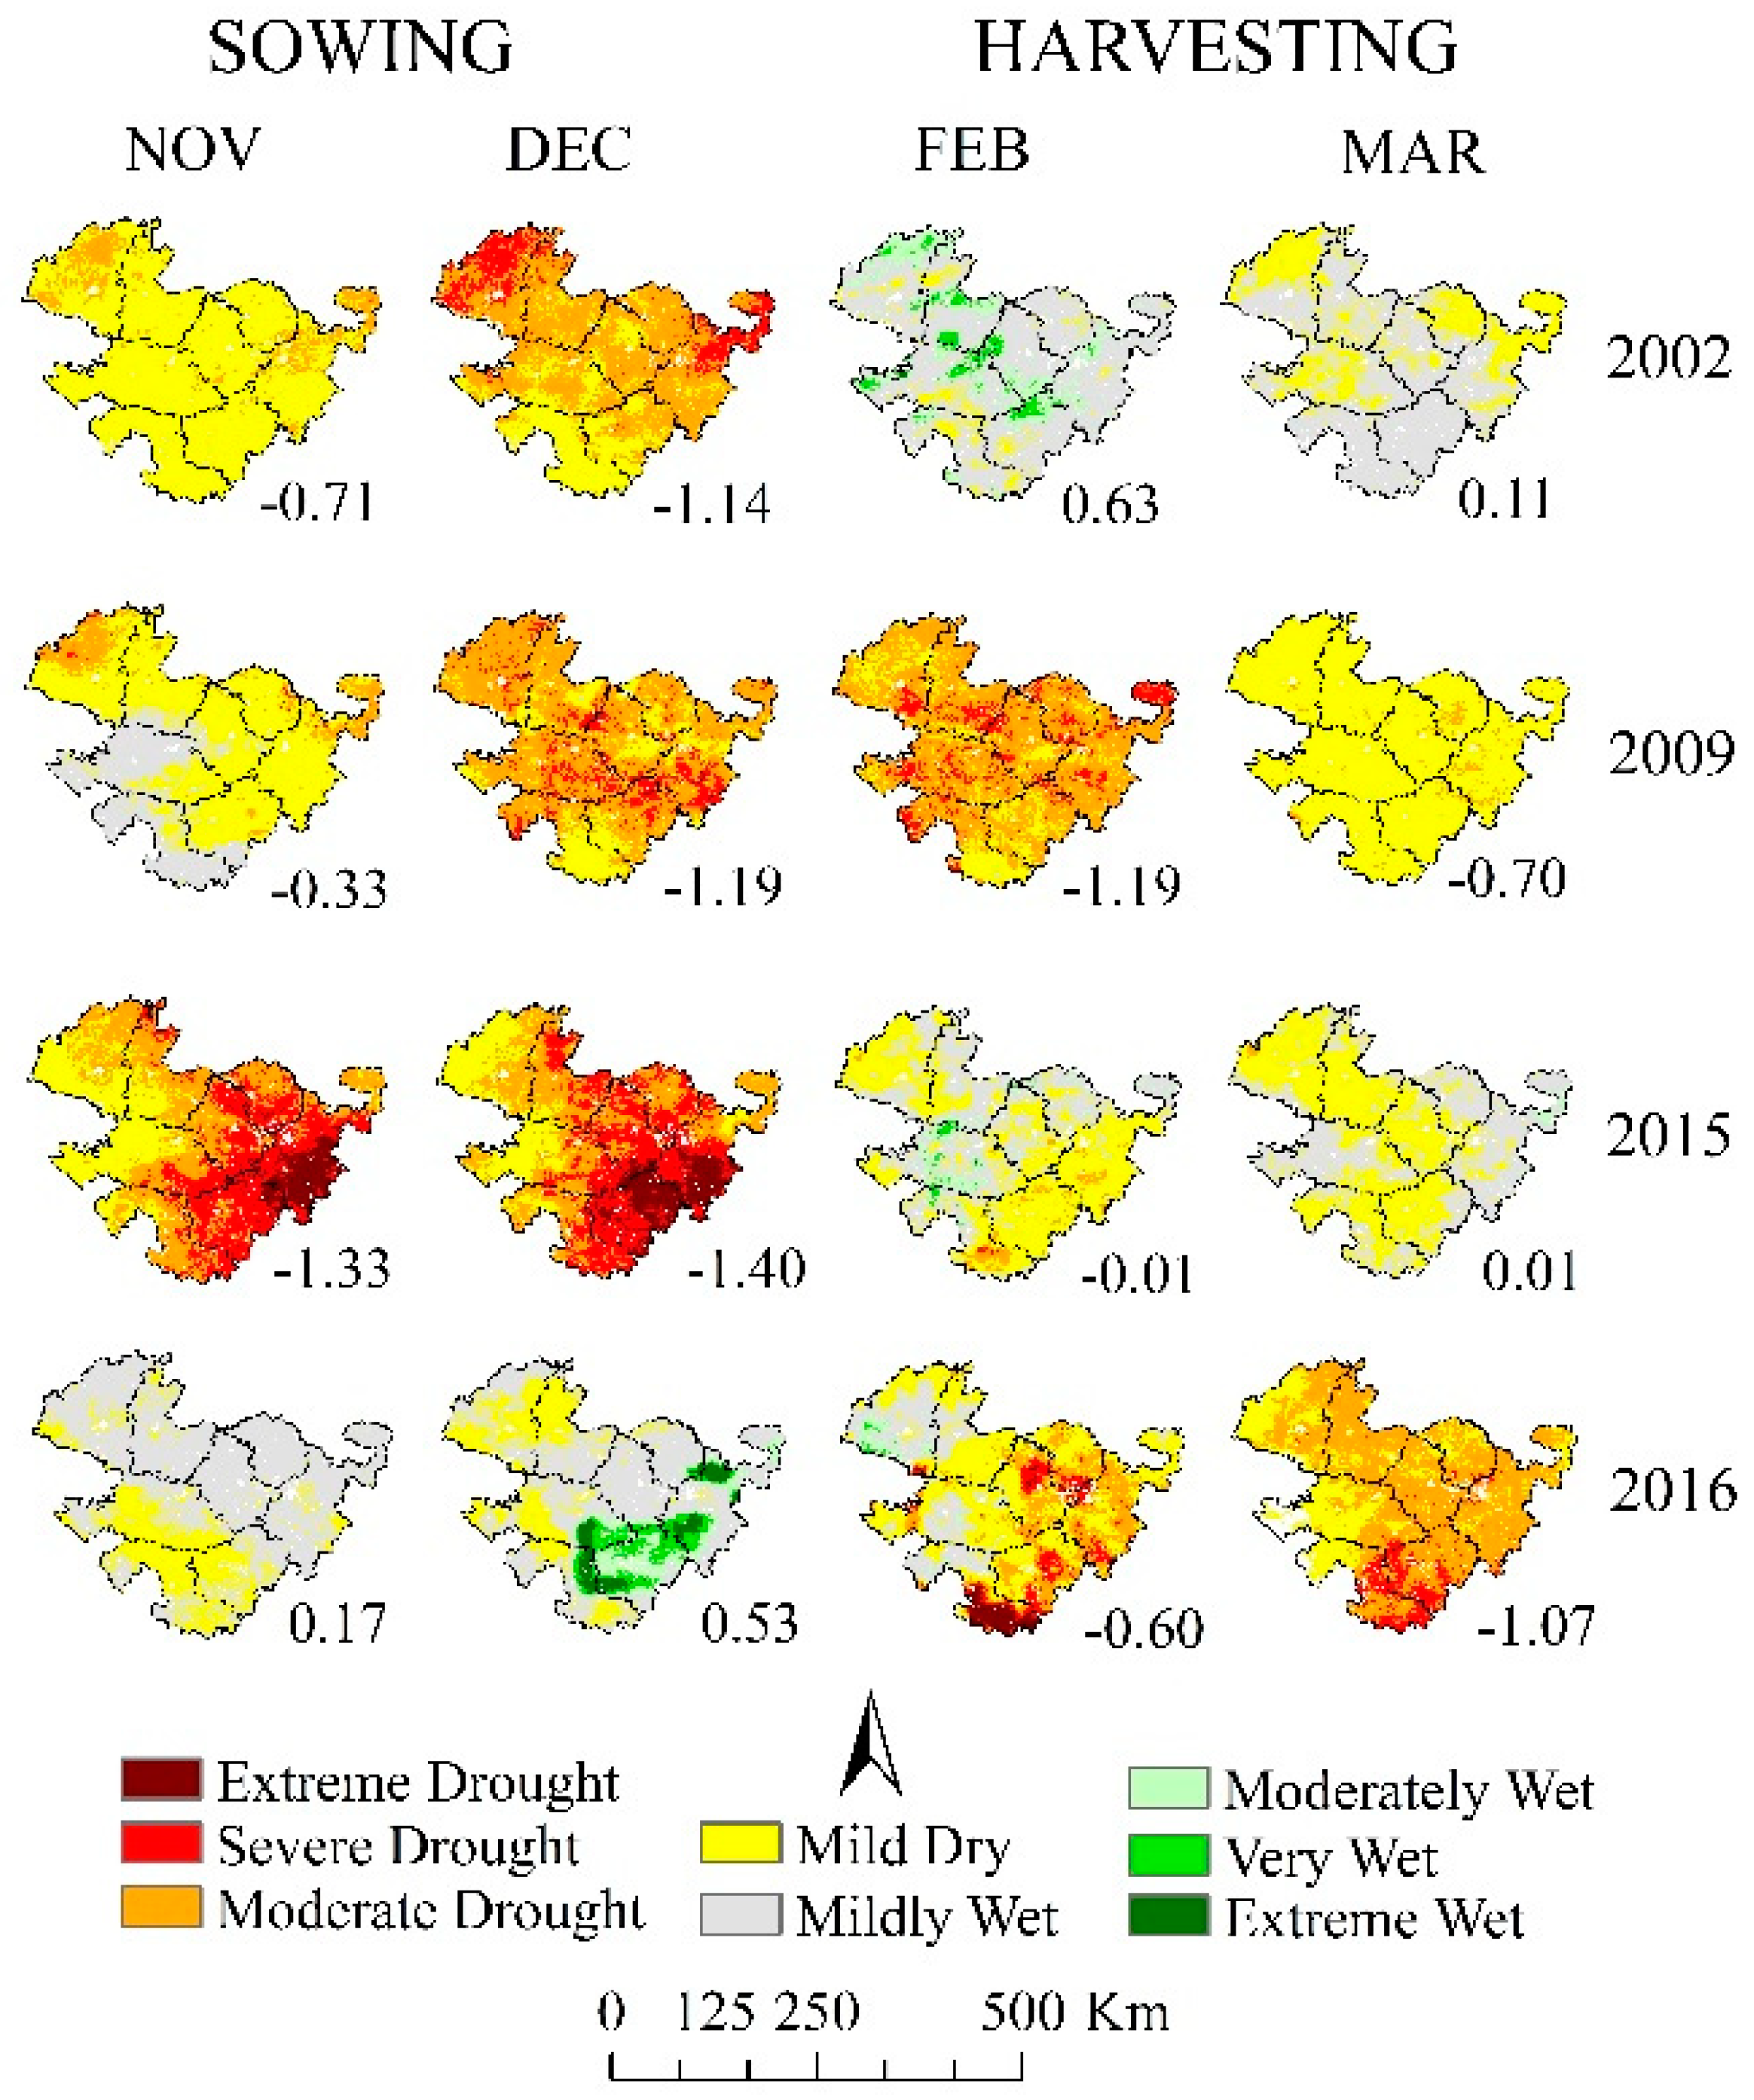
Figure 12 represents the spatio-temporal patterns of dry spells in the highly-affected drought years for Marathwada. In the Rabi season, most of the sowing and harvesting months experience mild to extreme drought conditions over the years 2002, 2009, and 2015–16. For the sowing months, in particular, the Nanded, Parbhani, and Hingoli districts have noticed the highest intensity dry spells. During the harvesting months, perhaps due to some local factors such as irrigation, only a few small areas of extremely dry pockets (Osmanabad, Parbhani) and equal distribution of mild wet and mild dry spells were detected over most regions of Marathwada.
Figure 13 demonstrates a spatial distribution of correlation coefficient values among major crop yields and CDI_M drought intensities over the harvesting of the Rabi season. This figure has identified the eastern and southeastern districts of Marathwada with higher correlation values (r > 0.5), whereas parts of Beed, Aurangabad, and Osmanabad in the west had negative correlations. In the case of jowar and wheat crop, a significant relationship was marked over large portions of Hingoli (r = 0.82 over 78% area), Parbhani (r = 0.76 over 58%), and Nanded (r > 0.6 over 32% area) districts. For a detailed understanding of the temporal association between crop yield and CDI_M values, linear regression graphs were plotted, and regression equations were generated over randomly selected sites.
In a further step, two potential assumptions (i.e., CDI_M values may increase or decrease by 0.5 or 1) were made for the future CDI_M, and based on it, the future changes in crop yield were predicted [70]. Regression equations given in Table 6 suggest that in the future, if the values of CDI_M increases or decreases by 0.5, then crop yields for Wheat, Jowar, and Maize will rise or decline by 16.7%, 9.2%, 9.1%, respectively. If the CDI_M varies by + or ‒1, then the yield will alter by 33% (wheat), 18.4% (Jowar), and 18.2% (Maize) Tonnes/ Hectare.

4.3.2. Kharif Season

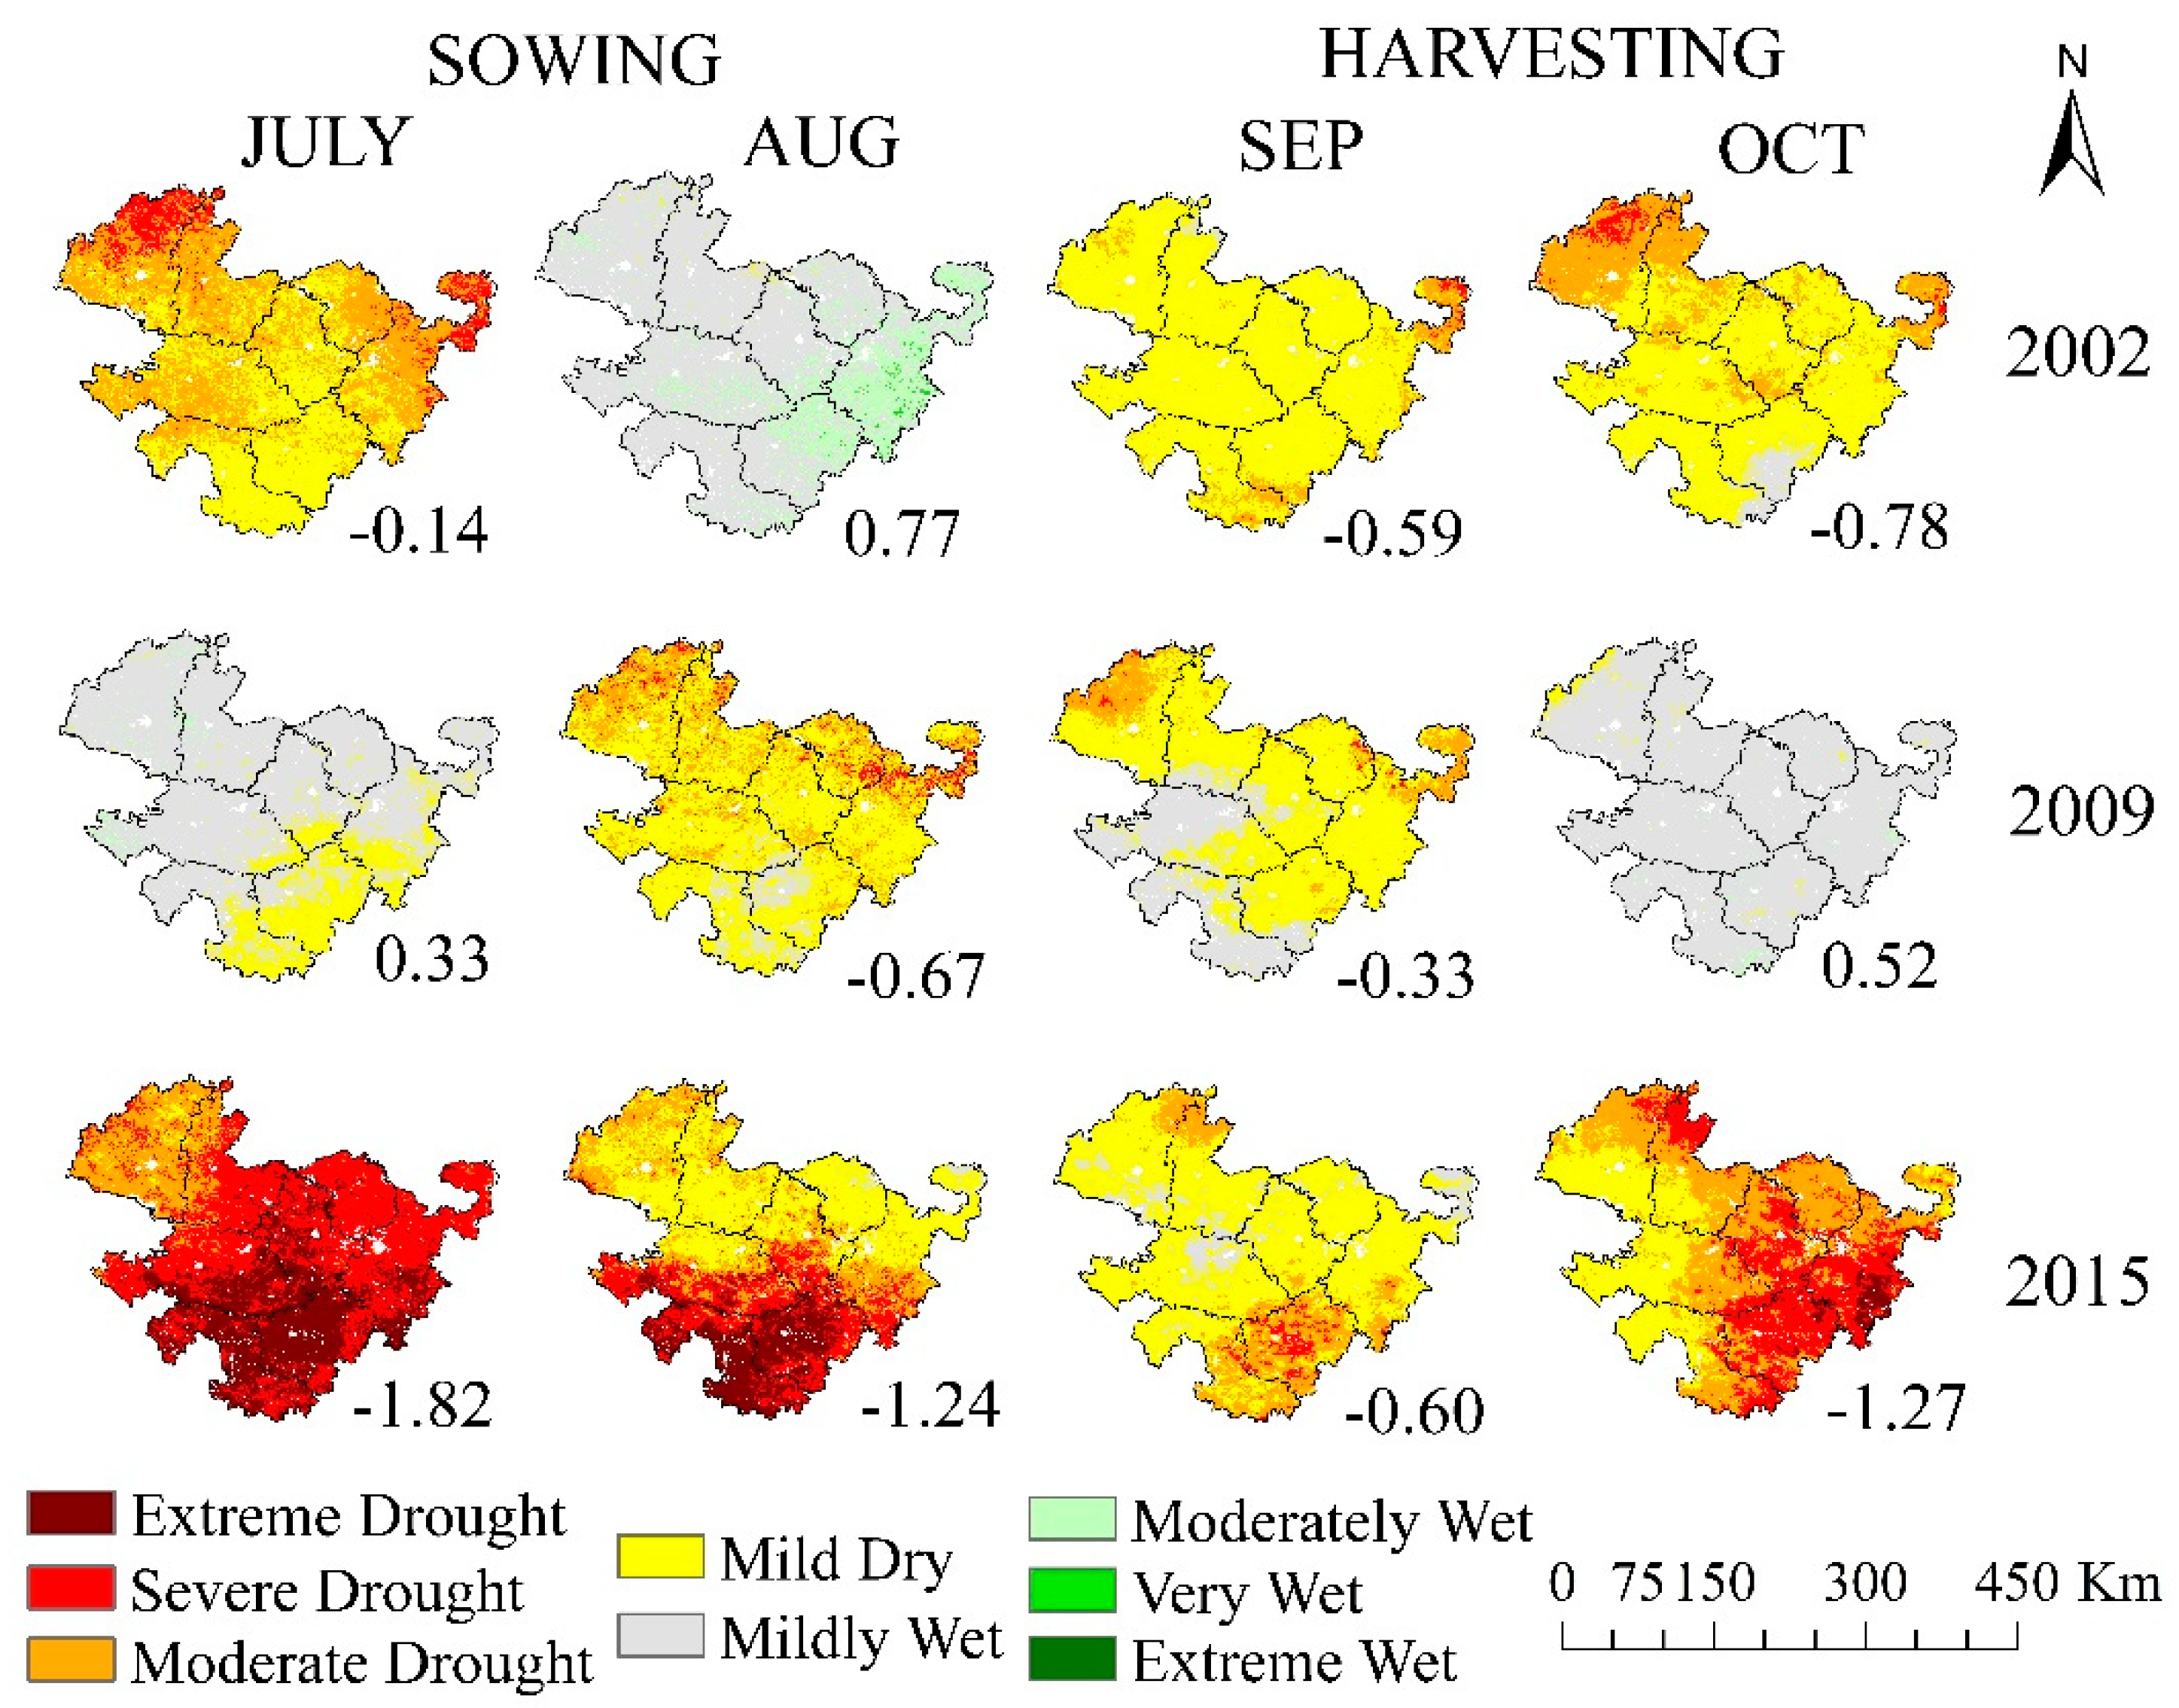
Monsoon rainfall is the primary resource for Kharif crops in Maharashtra. Hence, the fluctuations in the monsoon rains directly impact the dryness, soil moisture availability, and the overall crop productivity in the region. Figure 14 shows the spatial distribution of dry spells in the highest drought-affected years (2002, 2009, 2015–16) over the sowing and harvesting months of Kharif. In 2002, eastern parts of Aurangabad and Nanded districts observed severe to extreme drought intensities during the starting of sowing and at the end of the harvesting season. 2015 was a crucial time over most of the cropping cycle, where more than 40% of the area of Marathwada continuously experienced extreme drought. In 2015, Kharif, Osmanabad, and Latur were the two most affected districts due to the life-threatening dry spells.
In the Rabi season, jowar and cotton crops had a stronger relationship (r > 0.5) with the CDI_M based drought intensities. At the district level, in particular, almost the entire area of Beed and some pockets of the Nanded showed a significant association (r > 0.7) in CDI_M and yield of jowar (Figure 15). In the case of cotton, the entire Hingoli and northern horn of Osmanabad districts observed a significant correlation (r > 0.7) between crop yield and drought intensities (Figure 15).
To get the general idea of future Kharif crop yield anomalies, based on assumed variations in the CDI_M values (increase or decrease by 0.5 or 1), the same regression equation technique was implemented as described for the Rabi crop. Regression equations given in Table 7 suggest that in the future, if the values of CDI_M increase or decrease by 0.5, then crop yields for Jowar and Cotton will rise or decline by 19.8%, and 11.3%, respectively. If the CDI_M varies by + or −1, then the yield will alter by 39.5 % (Jowar) and 22.6% (Cotton) Tonnes/Hectare.

4.4. Limitations and Future Recommendations

In this study, a weighted combination of input parameters was used to compute the CDI_M. The weights for CDI_M were based on expert judgment (Method-I) and the principle component analysis (PCA) weighting approach (Method-II). However, several other methods like entropy [71,72], Copula [73] can also be implemented and compared in the development of combined drought indicators.
All the input parameters used for this study were initially available in different spatial resolutions. Some of the datasets were best available only with the coarse resolution (SM and LST—0.25°). Though these coarse resolution data still represented the spatial variability, this study recommends the use of high-resolution input data for future research.
The correlation coefficient maps of the crop yield with the CDI_M showed a weak correlation (r < 5.0) over some parts of the study area. Unavailability of grid-based or high-resolution crop yield data and shorter data length (18 years) can be responsible for the above-mentioned poor association between crop yield and CDI_M.
Current operational drought monitoring methods in the Marathwada, India, are based on a single input parameter, i.e., rainfall. Hence, the combined drought indicator developed in this study constitutes a new technique for agricultural drought monitoring over the study area. The drought assessment methods used in the framework of this study recommend its implementation over the various parts of the world by adopting the region-specific input variables and their relative weights.

5. Conclusions

During the past few decades, the global environment has been brutally affected by droughts [74]. In recent years, severe drought events and water crises have increased widely over the various parts of India, especially Marathwada. Hence, for the accurate assessment of droughts, this study has developed the combined drought index for Marathwada. The present study has used fixed weighted-based and PCA-dependent methods to develop a combined drought index for Marathwada. Both methods were capable of identifying the spatial extent of historical and current drought events over the study area. Two agricultural (NDVI and SM) and two meteorological (SPI and LST) variables were utilized in developing the CDI_M as an attempt to understand the agro-climatological drought severities over Marathwada in a better way. In the later stages of this study, both the CDI_M results were compared with the temporal trends in major crop yields in Marathwada. Over both crop growing seasons, the PCA-based CDI_M showed a higher correlation with most of the crop yields compared to the fixed weight-based CDI_M. The outcomes from this study conclude that,
  • Both of the CDI_M methods (fixed weight-based and PCA-dependent) were accurately able to identify the spatiotemporal extent of drought or nondrought events along with an enhanced trend in the number of drought occurrences for the period 2001 to 2018.
  • The years 2002, 2009, 2015 (monsoon and postmonsoon), and 2016 (premonsoon) were identified as the severe drought spans over the study area. In these years, nearly 40% of the Marathwada experienced moderate to extremely dry conditions.
  • Adjoining years (2003 and 2016) of most of the extreme dry spells (2002 and 2015) experienced similar drought characteristics that lingered from the extreme drought events (e.g., January 2003, 2016).
  • Both methods have observed an increasing trend in CDI_M values. In April, the upwelling trends in the CDI_M were statistically significant, over 66% of Marathwada, followed by 26% in October. These rising trends in CDI_M are of major concern for agriculture going forward.
  • Compared to the fixed weighted-based CDI_M, PCA-dependent CDI_M indicated a higher association with the major crop yields in Marathwada. During drought years, in particular, the PCA-based CDI_M held a significant relationship with crop yields (r > 0.7 for jowar and wheat).
Hence, this study emphasizes the potential usefulness of PCA-based CDI_M for better agricultural drought management practices, crop yield predictions, and for the development of area-specific drought mitigation techniques in Marathwada.

Author Contributions

Conceptualization, S.S.K. and B.D.W.; methodology, S.S.K. and Y.A.B.; Software, S.S.K. and Y.A.B.; formal analysis and writing (original draft preparation), S.S.K.; writing (review and editing), S.S.K., B.D.W., Y.A.B., T.T., M.D.S. and S.S.G.; Supervision, B.D.W., T.T., M.D.S. and S.S.G. All authors have read and agreed to the published version of the manuscript.

Funding

This research was funded by the IIE, USIEF- Fulbright Kalam Doctoral program (ID: PS00280516), and partially funded by SNR, UNL, USA.

Acknowledgments

We are thankful to the National Data Centre, Indian Meteorological Department, Pune, India, for providing the station-based rainfall data for the validation. We would also like to acknowledge all of the reviewers of this manuscript. The first author is grateful to the IIE, USIEF-Fulbright program for the financial aid to carry out this research at the Center for Advanced Land Management Information Technologies (CALMIT), National Drought Mitigation Center (NDMC) and School of Natural Resources (SNR) at the University of Nebraska-Lincoln (UNL), USA. The first author also extends her special thanks to CALMIT, NDMC, and UNL, for providing the necessary facilities in the department for this work.

Conflicts of Interest

The authors declare no conflict of interest.

Appendix A

Figure A1. Spatio-temporal representation of Method-II-based number of ‘extreme drought’ events that occurred between 2001 to 2018.
Remotesensing 12 02091 g0a1
Figure A2. Correlation coefficient values between results of CDI_M, derived from Method-I and Method-II (bottom right values of each month indicates the average correlation coefficient value over the study area).
Remotesensing 12 02091 g0a2
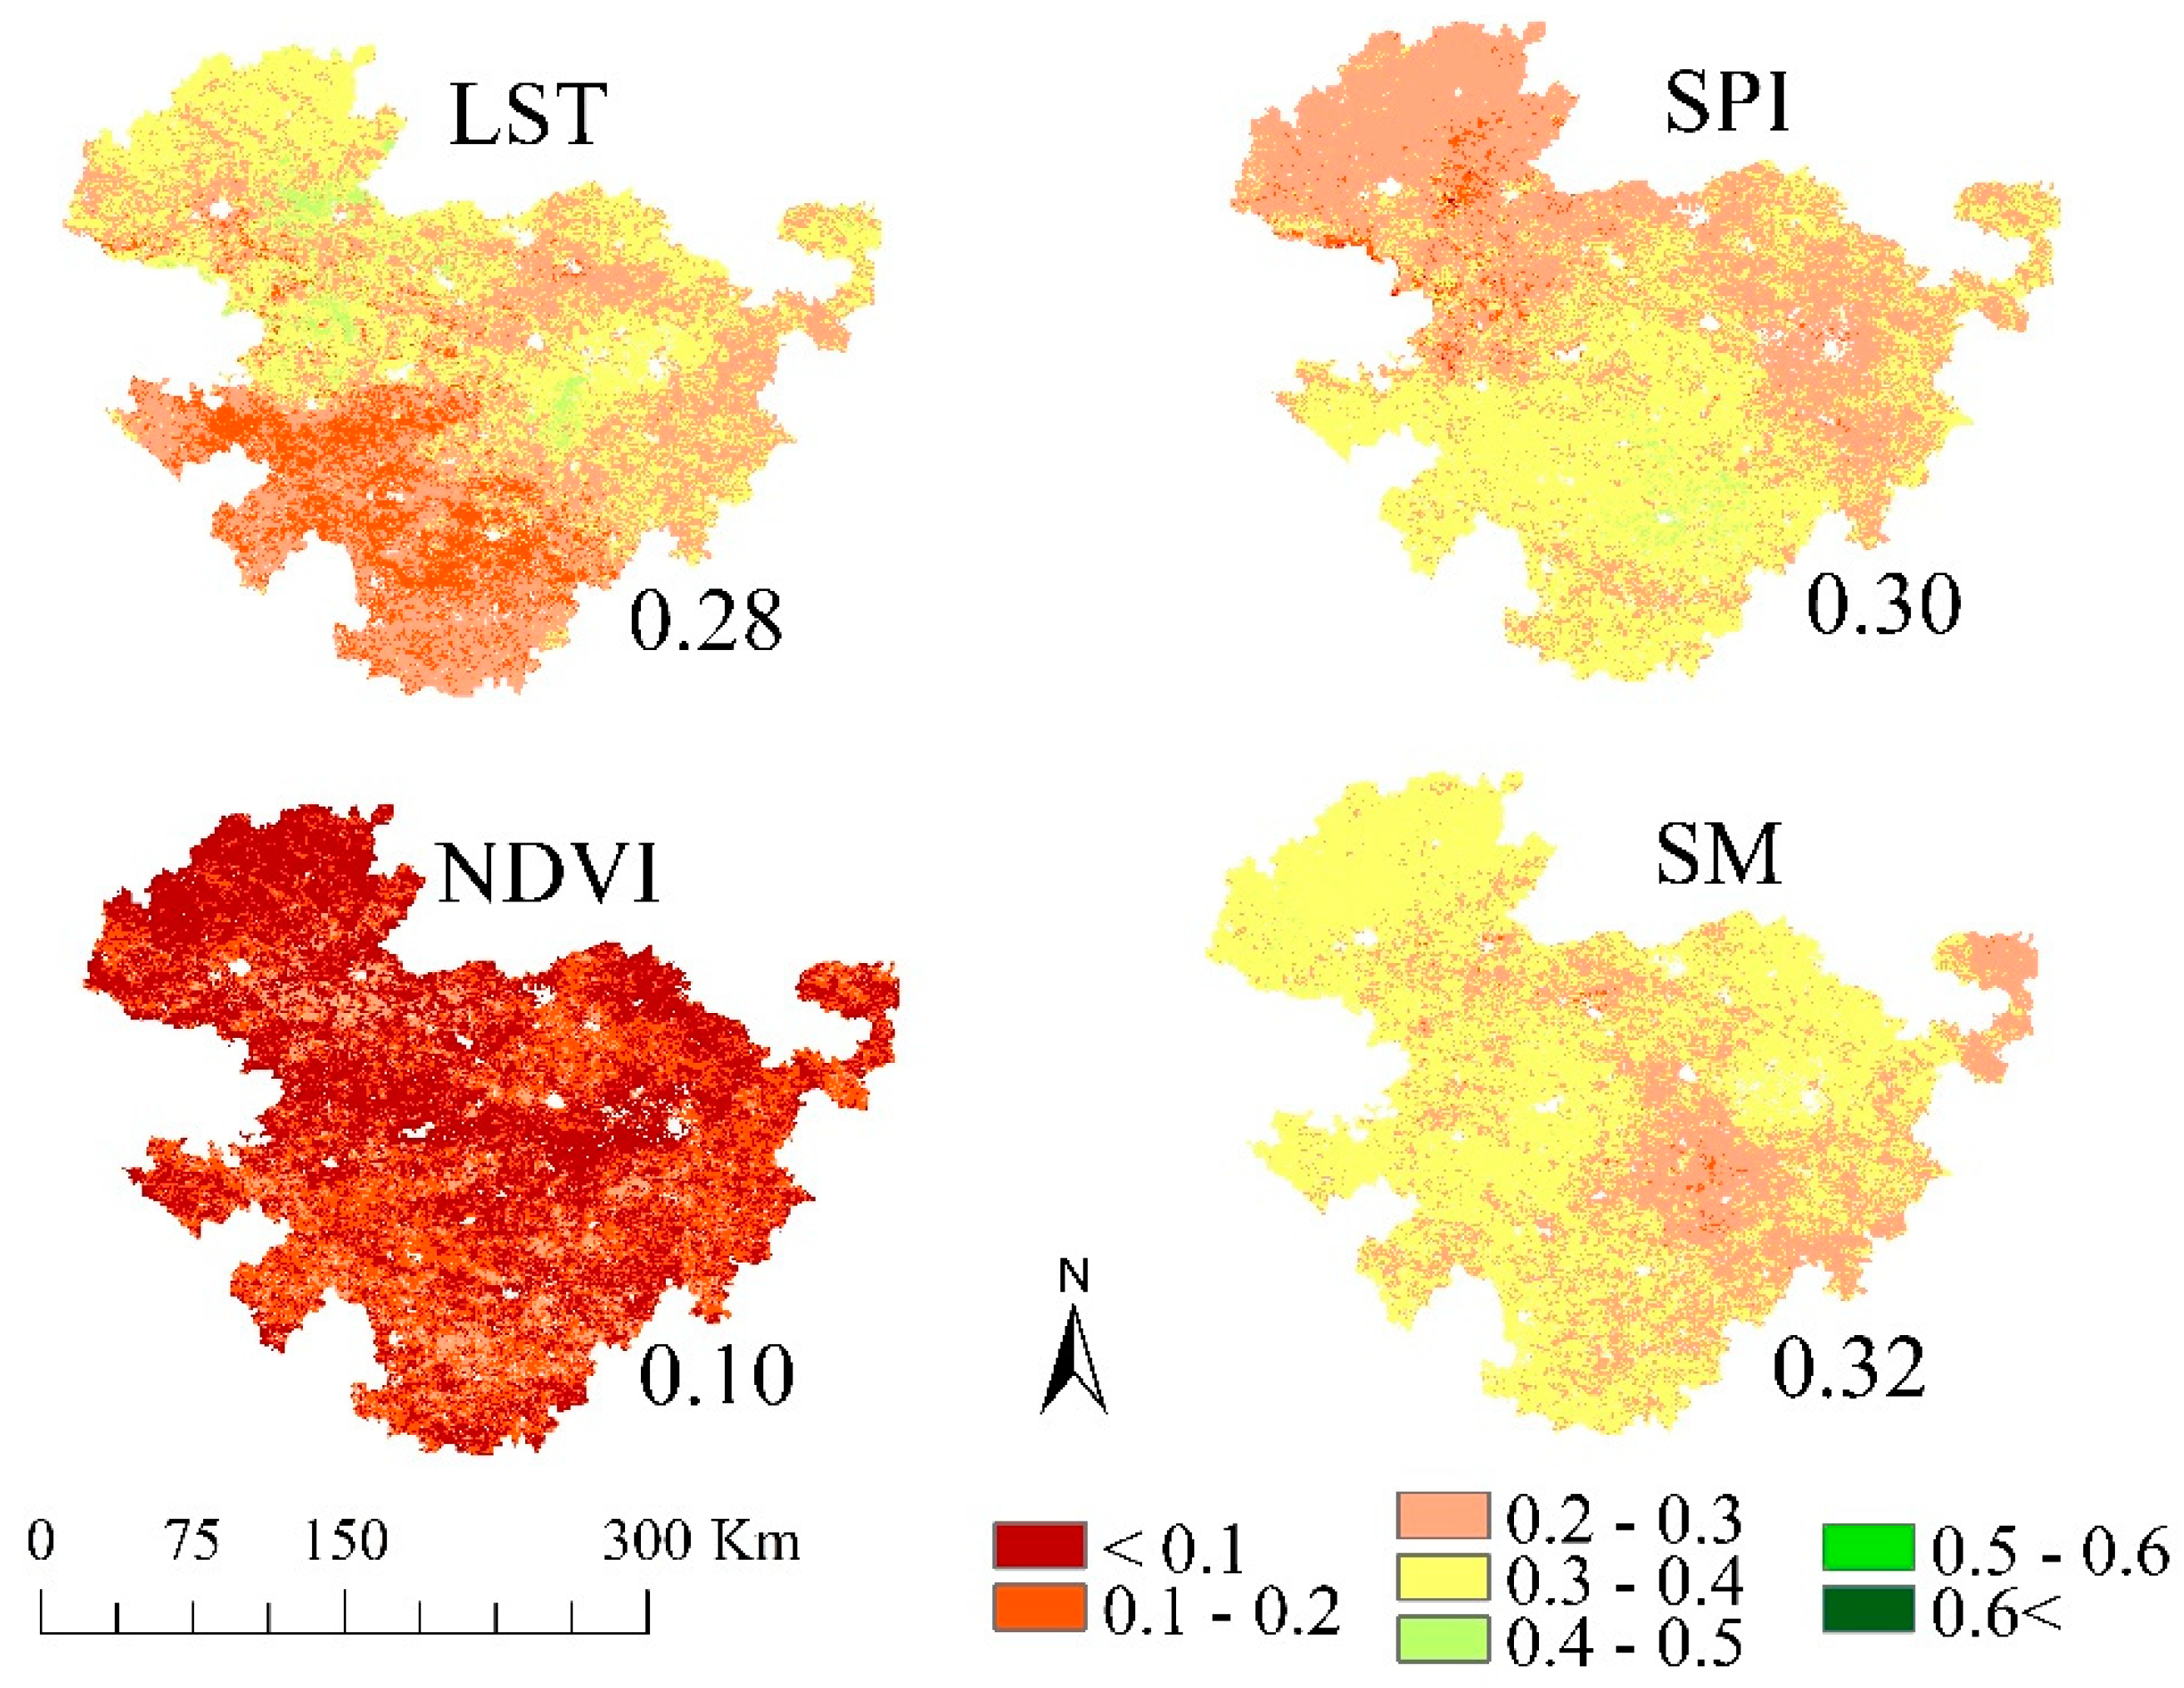
Figure A3. The sample (June month) spatial pattern of percent contribution of land surface temperature (LST), SPI, normalized difference vegetation index (NDVI), and soil moisture (SM) over the Marathwada.
Remotesensing 12 02091 g0a3

References

  1. Water Risk Filter Germany 2019. Drought Risk the Global Thirst for Water in the Era of Climate Crisis. Available online: https://waterriskfilter.panda.org/en/Explore/WaterRiskReports (accessed on 6 April 2020).
  2. Kogan, F.; Guo, W.; Yang, W. Drought and food security prediction from NOAA new generation of operational satellites. Geomat. Nat. Hazards Risk 2019, 10, 651–666. [Google Scholar] [CrossRef] [Green Version]
  3. Africa Renewal. Drought in Ethiopia: 10 Million People in Need. Available online: https://www.un.org/africarenewal/news/drought-ethiopia-10-million-people-need (accessed on 8 April 2020).
  4. Svoboda, M.; Lecomte, D.; Hayes, M.; Heim, R.; Gleason, K.; Angel, J.; Rippey, B.; Tinker, R.; Palecki, M.; Stooksbury, D.; et al. The drought monitor. Bull. Am. Meteorol. Soc. 2002, 83, 1181–1190. [Google Scholar] [CrossRef] [Green Version]
  5. Belal, A.A.; El-Ramady, H.R.; Mohamed, E.S.; Saleh, A.M. Drought risk assessment using remote sensing and GIS techniques. Arab. J. Geosci. 2014, 7, 35–53. [Google Scholar] [CrossRef]
  6. Kumar, K.; Rajeevan, M.; Pai, D.; Srivastava, A.; Preethi, B. On the observed variability of monsoon droughts over India. Weather Clim. Extrem. 2013, 1, 42–50. [Google Scholar] [CrossRef] [Green Version]
  7. Shah, D.; Mishra, V. Integrated Drought Index (IDI) for drought monitoring and assessment in India. Water Resour. Res. 2020, 56. [Google Scholar] [CrossRef]
  8. Sheffield, J.; Wood, E.F. Global trends and variability in soil moisture and drought characteristics, 1950–2000, from observation-driven simulations of the terrestrial hydrologic cycle. J. Clim. 2008, 21, 432–458. [Google Scholar] [CrossRef] [Green Version]
  9. Madani, K.; AghaKouchak, A.; Mirchi, A. Iran’s socio-economic drought: Challenges of a water-bankrupt nation. Iran. Stud. 2016, 49, 997–1016. [Google Scholar] [CrossRef]
  10. Bhalme, H.N.; Mooley, D.A. Large-scale droughts/floods and monsoon circulation. Mon. Weather Rev. 1980, 108, 1197–1211. [Google Scholar] [CrossRef] [Green Version]
  11. Raman, C.; Rao, Y. Blocking highs over Asia and monsoon droughts over India. Nature 1981, 289, 271–273. [Google Scholar] [CrossRef]
  12. Parthasarathy, B.; Sontakke, N.; Monot, A.; Kothawale, D. Droughts/floods in the summer monsoon season over different meteorological subdivisions of India for the period 1871–1984. Int. J. Climatol. 1987, 7, 57–70. [Google Scholar] [CrossRef]
  13. Guhathakurta, P. Droughts in districts of India during the recent all India normal monsoon years and its probability of occurrence. Mausam 2003, 54, 542–544. [Google Scholar]
  14. Mahajan, D.R.; Dodamani, B.M. Spatial and temporal drought analysis in the Krishna river basin of Maharashtra, India. Cogent Eng. 2016, 3, 1185926. [Google Scholar] [CrossRef]
  15. Pai, D.; Sridhar, L.; Guhathakurta, P.; Hatwar, H. District-wide drought climatology of the southwest monsoon season over India based on standardized precipitation index (SPI). Nat. Hazards 2011, 59, 1797–1813. [Google Scholar] [CrossRef]
  16. Kulkarni, S.; Gedam, S. Geospatial Approach to Categorize and Compare the Agro-Climatological Droughts Over Marathwada Region of Maharashtra, India. ISPRS Ann. Photogramm. Remote Sens. Spat. Inf. Sci. 2018, 4, 279–285. [Google Scholar] [CrossRef] [Green Version]
  17. Kripalani, R.; Kulkarni, A. Assessing the impacts of El Niño and non-El Niño-related droughts over India. Drought Netw. News (1994–2001) 1996, 24, 11–13. [Google Scholar]
  18. Kumar, K.K.; Rajagopalan, B.; Hoerling, M.; Bates, G.; Cane, M. Unraveling the mystery of Indian monsoon failure during El Niño. Science 2006, 314, 115–119. [Google Scholar] [CrossRef] [PubMed] [Green Version]
  19. Roxy, M.K.; Ritika, K.; Terray, P.; Murtugudde, R.; Ashok, K.; Goswami, B. Drying of Indian subcontinent by rapid Indian Ocean warming and a weakening land-sea thermal gradient. Nat. Commun. 2015, 6, 1–10. [Google Scholar] [CrossRef] [Green Version]
  20. Aadhar, S.; Mishra, V. Impact of Climate Change on Drought Frequency over India; Ministry of Environment, Forest and Climate Change: Delhi, India, 2018.
  21. Patel, N.; Anapashsha, R.; Kumar, S.; Saha, S.; Dadhwal, V. Assessing potential of MODIS derived temperature/vegetation condition index (TVDI) to infer soil moisture status. Int. J. Remote Sens. 2009, 30, 23. [Google Scholar] [CrossRef]
  22. Bhuiyan, C.; Singh, R.; Kogan, F. Monitoring drought dynamics in the Aravalli region (India) using different indices based on ground and remote sensing data. Int. J. Appl. Earth Obs. 2006, 8, 289–302. [Google Scholar] [CrossRef]
  23. Mallya, G.; Mishra, V.; Niyogi, D.; Tripathi, S.; Govindaraju, R.S. Trends and variability of droughts over the Indian monsoon region. Weather Clim. Extrem. 2016, 12, 43–68. [Google Scholar] [CrossRef] [Green Version]
  24. Aadhar, S.; Mishra, V. Increased drought risk in South Asia under warming climate: Implications of uncertainty in potential evapotranspiration estimates. J. Hydrometeorol. 2020. [CrossRef] [Green Version]
  25. Sharma, S.; Mujumdar, P. Increasing frequency and spatial extent of concurrent meteorological droughts and heatwaves in India. Sci. Rep. 2017, 7, 1–9. [Google Scholar] [CrossRef] [PubMed] [Green Version]
  26. Economic Survey. Report Summary Economic Survey 2019–20. Available online: https://www.prsindia.org/sites/default/files/parliament_or_policy_pdfs/Economic%20Survey%202019-20%20Summary.pdf (accessed on 18 April 2020).
  27. Mallegowda, P.; Rengaian, G.; Krishnan, J.; Niphadkar, M. Assessing habitat quality of forest-corridors through NDVI analysis in dry tropical forests of south India: Implications for conservation. Remote Sens. 2015, 7, 1619–1639. [Google Scholar] [CrossRef] [Green Version]
  28. Saikia, A. NDVI variability in North East India. Scott. Geogr. J. 2009, 125, 195–213. [Google Scholar] [CrossRef]
  29. Patel, N.; Yadav, K. Monitoring spatio-temporal pattern of drought stress using integrated drought index over Bundelkhand region, India. Nat. Hazards 2015, 77, 663–677. [Google Scholar] [CrossRef]
  30. Patel, N.; Parida, B.; Venus, V.; Saha, S.; Dadhwal, V. Analysis of agricultural drought using vegetation temperature condition index (VTCI) from Terra/MODIS satellite data. Environ. Monit. Assess. 2012, 184, 7153–7163. [Google Scholar] [CrossRef]
  31. Murthy, C.; Sesha Sai, M.; Kumari, V.B.; Roy, P. Agricultural drought assessment at disaggregated level using AWiFS/WiFS data of Indian Remote Sensing satellites. Geocarto Int. 2007, 22, 127–140. [Google Scholar] [CrossRef]
  32. Wardlow, B.D.; Tadesse, T.; Brown, J.F.; Callahan, K.; Swain, S.; Hunt, E. Vegetation Drought Response Index: An Integration of Satellite, Climate, and Biophysical Data. In Remote Sensing of Drought: Innovative Monitoring Approaches; Wardlow, B.D., Anderson, M.C., Verdin, J.P., Eds.; CPC Press: Boca Raton, FL, USA, 2012; pp. 51–74. [Google Scholar]
  33. Wu, H.; Wilhite, D.A. An operational agricultural drought risk assessment model for Nebraska, USA. Nat. Hazards 2004, 33, 1–21. [Google Scholar] [CrossRef]
  34. Brown, J.F.; Wardlow, B.D.; Tadesse, T.; Hayes, M.J.; Reed, B.C. The Vegetation Drought Response Index (VegDRI): A new integrated approach for monitoring drought stress in vegetation. GISci. Remote Sens. 2008, 45, 16–46. [Google Scholar] [CrossRef]
  35. Nam, W.-H.; Tadesse, T.; Wardlow, B.D.; Hayes, M.J.; Svoboda, M.D.; Hong, E.-M.; Pachepsky, Y.A.; Jang, M.-W. Developing the vegetation drought response index for South Korea (VegDRI-SKorea) to assess the vegetation condition during drought events. Int. J. Remote Sens. 2018, 39, 1548–1574. [Google Scholar] [CrossRef]
  36. Sepulcre-Canto, G.; Horion, S.; Singleton, A.; Carrao, H.; Vogt, J. Development of a Combined Drought Indicator to detect agricultural drought in Europe. Nat. Hazards Earth Syst. 2012, 12, 3519–3531. [Google Scholar] [CrossRef] [Green Version]
  37. Imani, Y.; Lahlou, O.; Bennasser Alaoui, S.; Naumann, G.; Barbosa, P.; Vogt, J. Drought vulnerability assesssment and mapping in Morocco. In Proceedings of the EGU General Assembly Conference Abstracts, Vienna, Austria, 27 April–2 May 2014. [Google Scholar]
  38. Enenkel, M.; Steiner, C.; Mistelbauer, T.; Dorigo, W.; Wagner, W.; See, L.; Atzberger, C.; Schneider, S.; Rogenhofer, E. A combined satellite-derived drought indicator to support humanitarian aid organizations. Remote Sens. 2016, 8, 340. [Google Scholar] [CrossRef] [Green Version]
  39. Zhang, X.; Obringer, R.; Wei, C.; Chen, N.; Niyogi, D. Droughts in India from 1981 to 2013 and Implications to Wheat Production. Sci. Rep. 2017, 7, 44552. [Google Scholar] [CrossRef] [PubMed] [Green Version]
  40. Vyas, S.S.; Bhattacharya, B.K.; Nigam, R.; Guhathakurta, P.; Ghosh, K.; Chattopadhyay, N.; Gairola, R.M. A combined deficit index for regional agricultural drought assessment over semi-arid tract of India using geostationary meteorological satellite data. Int. J. Appl. Earth Obs. 2015, 39, 28–39. [Google Scholar] [CrossRef]
  41. Subash, N.; Mohan, H.R. A simple rationally integrated drought indicator for rice–wheat productivity. Water Resour. Manag. 2011, 25, 2425–2447. [Google Scholar] [CrossRef]
  42. Dhorde, A.G.; Patel, N.R. Spatio-temporal variation in terminal drought over western India using dryness index derived from long-term MODIS data. Ecol. Inform. 2016, 32, 28–38. [Google Scholar] [CrossRef]
  43. Kulkarni, A.; Gadgil, S.; Patwardhan, S. Monsoon variability, the 2015 Marathwada drought and rainfed agriculture. Curr. Sci. 2016, 111, 1182–1193. [Google Scholar] [CrossRef]
  44. Swain, S.; Patel, P.; Nandi, S. Application of SPI, EDI and PNPI using MSWEP precipitation data over Marathwada, India. In Proceedings of the 2017 IEEE International geoscience and remote sensing symposium (IGARSS), Fort Worth, TX, USA, 23–28 July 2017. [Google Scholar]
  45. Purandare, P. Water governance and droughts in Marathwada. Econ. Political Wkly. 2013, 18–21. [Google Scholar]
  46. Spinoni, J.; Barbosa, P.; Bucchignani, E.; Cassano, J.; Cavazos, T.; Christensen, J.H.; Christensen, O.B.; Coppola, E.; Evans, J.; Geyer, B.; et al. Future Global Meteorological Drought Hot Spots: A Study Based on CORDEX Data. J. Clim. 2020, 33, 3635–3661. [Google Scholar] [CrossRef]
  47. Hazaymeh, K.; Hassan, Q.K. A remote sensing-based agricultural drought indicator and its implementation over a semi-arid region, Jordan. J. Arid Land 2017, 9, 319–330. [Google Scholar] [CrossRef]
  48. Bayissa, Y.A.; Tadesse, T.; Svoboda, M.; Wardlow, B.; Poulsen, C.; Swigart, J.; Van Andel, S.J. Developing a satellite-based combined drought indicator to monitor agricultural drought: A case study for Ethiopia. GISci. Remote Sens. 2019, 56, 718–748. [Google Scholar] [CrossRef]
  49. India Meteorological Department. Monthly Rainfall and Temperature Datasets. Available online: https://mausam.imd.gov.in/ (accessed on 5 March 2020).
  50. P. D. Government of Maharashtra. Economic Survey of Maharashtra 2019–20. Available online: https://mahades.maharashtra.gov.in/ (accessed on 22 March 2020).
  51. Srivastava, A.; Rajeevan, M.; Kshirsagar, S. Role of the ITCZ over the north Indian Ocean and Pre-Mei-Yu front in modulating July rainfall over India. J. Clim. 2004, 17, 673–678. [Google Scholar] [CrossRef]
  52. McKee, T.B.; Doesken, N.J.; Kleist, J. The relationship of drought frequency and duration to time scales. In Proceedings of the 8th Conference on Applied Climatology, Anaheim, CA, USA, 17–22 January 1993; pp. 179–183. [Google Scholar]
  53. Funk, C.; Peterson, P.; Landsfeld, M.; Pedreros, D.; Verdin, J.; Shukla, S. The climate hazards infrared precipitation with stations—A new environmental record for monitoring extremes. Sci. Data 2015, 2, 150066. [Google Scholar] [CrossRef] [PubMed] [Green Version]
  54. Wan, Z.; Wang, P.; Li, X. Using MODIS land surface temperature and normalized difference vegetation index products for monitoring drought in the southern Great Plains, USA. Int. J. Remote Sens. 2004, 25, 61–72. [Google Scholar] [CrossRef]
  55. Rodell, M.; Houser, P.; Jambor, U.; Gottschalck, J.; Mitchell, K.; Meng, C.-J.; Arsenault, K.; Cosgrove, B.; Radakovich, J.; Bosilovich, M. The global land data assimilation system. Bull. Am. Meteor. 2004, 85, 381–394. [Google Scholar] [CrossRef] [Green Version]
  56. Tucker, C.J.; Choudhury, B.J. Satellite remote sensing of drought conditions. Remote Sens. Environ. 1987, 23, 243–251. [Google Scholar] [CrossRef]
  57. Koster, R.D.; Suarez, M.J.; Higgins, R.W.; Van den Dool, H.M. Observational evidence that soil moisture variations affect precipitation. Geophys. Res. Lett. 2003, 30, 1241. [Google Scholar] [CrossRef] [Green Version]
  58. Sulla- Menashe, D.; Friedl, M.A. User Guide to Collection 6 MODIS Land Cover (MCD12Q1 and MCD12C1) Product; USGS: Reston, VA, USA, 2018; pp. 1–18.
  59. Government of India. Open Government Data Platform INDIA. Available online: https://data.gov.in/ (accessed on 12 March 2020).
  60. Watson, D.F.; Philip, G. A refinement of inverse distance weighted interpolation. Geo-Processing 1985, 2, 315–327. [Google Scholar]
  61. Gebrehiwot, T.; van der Veen, A.; Maathuis, B. Spatial and temporal assessment of drought in the Northern highlands of Ethiopia. Int. J. Appl. Earth Obs. 2011, 13, 309–321. [Google Scholar] [CrossRef]
  62. Duan, Z.; Bastiaanssen, W.G.M. First results from Version 7 TRMM 3B43 precipitation product in combination with a new downscaling–calibration procedure. Remote Sens. Environ. 2013, 131, 1–13. [Google Scholar] [CrossRef]
  63. Meshram, S.; Sharma, S. Prioritization of watershed through morphometric parameters: A PCA-based approach. Appl. Water. Sci. 2017, 1505–1519. [Google Scholar] [CrossRef] [Green Version]
  64. Somkuti, P.; Boesch, H.; Natraj, V.; Kopparla, P. Application of a PCA-Based Fast Radiative Transfer Model to XCO2 Retrievals in the Shortwave Infrared. J. Geophys. Res. Atmos. 2017, 122, 10477–10496. [Google Scholar] [CrossRef]
  65. Keyantash, J.A.; Dracup, J.A. An aggregate drought index: Assessing drought severity based on fluctuations in the hydrologic cycle and surface water storage. Water Resour. Res. 2004, 40. [Google Scholar] [CrossRef] [Green Version]
  66. Leng, G.; Hall, J. Crop yield sensitivity of global major agricultural countries to droughts and the projected changes in the future. Sci. Total Environ. 2019, 654, 811–821. [Google Scholar] [CrossRef] [PubMed]
  67. Yu, H.; Zhang, Q.; Sun, P.; Song, C. Impact of Droughts on Winter Wheat Yield in Different Growth Stages during 2001–2016 in Eastern China. Int. J. Disaster Risk Sci. 2018, 9, 376–391. [Google Scholar] [CrossRef] [Green Version]
  68. Sur, C.; Perk, S.Y.; Kim, T.W.; Lee, J.H. Remote Sensing-based Agricultural Drought Monitoring using Hydrometeorological Variables. KSCE J. Civ. Eng. 2019, 23, 5244–5256. [Google Scholar] [CrossRef]
  69. Alamgir, M.; Khan, N.; Shahid, S.; Yaseen, Z.M.; Dewan, A.; Hassan, Q.; Rasheed, B. Evaluating severity–area–frequency (SAF) of seasonal droughts in Bangladesh under climate change scenarios. Stoch. Environ. Res. Risk Assess. 2020, 1–18. [Google Scholar] [CrossRef]
  70. Latha, R.; Vinayak, B.; Murthy, B. Response of heterogeneous vegetation to aerosol radiative forcing over a northeast Indian station. J. Environ. Manag. 2018, 206, 1224–1232. [Google Scholar] [CrossRef]
  71. Hong, X.; Guo, S.; Xiong, L.; Liu, Z. Spatial and temporal analysis of drought using entropy-based standardized precipitation index: A case study in Poyang Lake basin, China. Theor. Appl. Climatol. 2015, 122, 543–556. [Google Scholar] [CrossRef]
  72. Aghakouchak, A. Entropy–Copula in Hydrology and Climatology. J. Hydrometeor. 2014, 15, 2176–2189. [Google Scholar] [CrossRef]
  73. Kavianpour, M.; Seyedabadi, M.; Moazami, S. Spatial and temporal analysis of drought based on a combined index using copula. Environ. Earth Sci. 2018, 77, 769. [Google Scholar] [CrossRef]
  74. Vicente-Serrano, S.M.; Quiring, S.M.; Peña-Gallardo, M.; Yuan, S.; Domínguez-Castro, F. A review of environmental droughts: Increased risk under global warming? Earth Sci. Rev. 2020, 201, 102953. [Google Scholar] [CrossRef]
Figure 1. District wise extent, elevation variation, and location of the study area.
Remotesensing 12 02091 g001
Figure 2. Indian Meteorological Department (IMD)-based long-term average monthly temperature and precipitation in Marathwada.
Remotesensing 12 02091 g002
Figure 3. Sample land use land cover map (the year 2002) derived from Moderate Resolution Imaging Spectroradiometer (MODIS).
Remotesensing 12 02091 g003
Figure 4. The general flow of methodology followed for this study.
Remotesensing 12 02091 g004
Figure 5. Spatio-temporal representation of method II-based number of extreme drought events (months of the highest number of drought frequencies) that occurred between 2001 to 2018.
Remotesensing 12 02091 g005
Figure 6. Correlation coefficient values (highest and lowest average months) between results of CDI_M, derived from Method-I and Method-II (bottom right values of each month indicates the average correlation coefficient value over the study area).
Remotesensing 12 02091 g006
Figure 7. Comparative analysis of pure standardized precipitation index (SPI) vs. combined drought indicator for Marathwada (CDI_M) based drought maps for 2002, 2009, and 2015. The maps in the top row show pure SPI (a) whereas the bottow row show CDI_M where SPI contributed 40% (b).
Remotesensing 12 02091 g007
Figure 8. Trends in CDI_M over the monsoon months.
Remotesensing 12 02091 g008
Figure 9. PCA-based CDI_M maps for the year 2015–16.
Remotesensing 12 02091 g009
Figure 10. Monthly trends (statistical p-value) in PCA-based CDI_M (bottom right value represents the percentage-wise area with a significant change in the CDI_M, and bottom left numbers indicate the average p-value).
Remotesensing 12 02091 g010
Figure 11. Original and detrended crop yield pattern of Maize crop.
Remotesensing 12 02091 g011
Figure 12. Spatio-temporal representation of CDI_M values over the Rabi season in the Marathwada (bottom right value indicate the monthly average CDI_M over the study area).
Remotesensing 12 02091 g012
Figure 13. Spatial variations in the correlation of Rabi crop yields in Marathwada and CDI_M values.
Remotesensing 12 02091 g013
Figure 14. Spatio-temporal representation of CDI_M values over the Kharif season in the Marathwada (bottom right value indicate the monthly average CDI_M over the study area).
Remotesensing 12 02091 g014
Figure 15. Spatial variations in the correlation coefficient values between Kharif crop yields and CDI_M in Marathwada.
Remotesensing 12 02091 g015
Table 1. Details of the temporal scales of the data used and the computed results.
DataPeriodTemporal ScaleData Source
Rainfall2001 to 2018 (Long term (1981 to 2018) monthly data were referred to compute the monthly SPI values from 2001 to 2018)Monthly(further used to calculate SPI-3)https://www.chc.ucsb.edu/data/chirps
LST2001 to 2018Monthlyhttps://ldas.gsfc.nasa.gov/gldas
SM2001 to 2018Monthlyhttps://ldas.gsfc.nasa.gov/gldas
NDVI2001 to 2018Monthlyhttps://modis.gsfc.nasa.gov/data/dataprod/mod13.php
LULC2001 to 2018Yearlyhttps://modis.gsfc.nasa.gov/data/dataprod/mod12.php
Crop Yield2001 to 2018Season wisehttps://data.gov.in/
ResultsPeriodTemporal scale
CDI_M2001 to 2018Monthly
CDI_M vs. Crop Yield2001 to 2018Monthly
Table 2. Land Use Land Cover (LULC) classes and percentage-wise area under each category based on MODIS data (2017).
LULC ClassArea Covered (%)
Croplands95.93
Urban and Built-up Lands1.7276
Water Bodies0.8419
Savanas0.8323
Grassland0.4287
Barren, Natural Vegetation Mosaics, Permanent Wetlands, Open Shrublands, and Mixed and Deciduous forestsLess than 0.40
Table 3. IMD derived drought categories and classes.
CDI ValuesDrought CategoryCDI ValuesDrought Category
2 or moreExtremely Wet0 to −0.99Mildly Dry
1.5 to 1.99Severely Wet−1.0 to −1.49Moderately Dry
1.0 to 1.49Moderately Wet−1.50 to −1.99Severely Dry
0 to 0.99Mildly Wet−2 or lessExtremely Dry
Table 4. Drought affected area during the primary drought years.
Area under Severe to Extreme Drought (%) during the Monsoon Months
Year200220092015
Month
June3.71%79.11%0%
July53.59%42.07%82.17%
August0.15%25.41%57.24%
September7.15%10.39%20.64%
Table 5. PCA-based spatially averaged monthly mean weight values for input parameters.
MonthsLSTNDVISMSPI
JAN0.320.190.400.09
FEB0.310.190.250.25
MAR0.180.270.300.25
APR0.140.340.360.18
MAY0.230.190.310.28
JUN0.280.100.320.30
JUL0.330.070.360.24
AUG0.340.100.430.13
SEP0.270.060.410.27
OCT0.260.160.370.22
NOV0.130.300.400.17
DEC0.270.290.350.09
Table 6. Correlation and regression between CDI_M values and crop yield anomalies for the Rabi season.
Rabi CropsRRegression Equation
Jowar0.79Jowar Yield = 0.184(CDI) + 0.603
Wheat0.76Wheat Yield = 0.334(CDI) + 0.982
Maize0.63Maize Yield = 0.182(CDI) + 0.942
Table 7. Correlation and regression between CDI values and crop yield anomalies for the Kharif season.
Kharif CropsRRegression Equation
Jowar0.57Jowar Yield = 0.395(CDI) + 1.178
Cotton0.67Bajra Yield = 0.226(CDI) + 0.743