Article

Validation of Sentinel-3A/3B and Jason-3 Altimeter Wind Speeds and Significant Wave Heights Using Buoy and ASCAT Data

1
The First Institute of Oceanography, Ministry of Natural Resources, Qingdao 266061, China
2
National Satellite Ocean Application Service, Ministry of Natural Resources, Beijing 100081, China
*
Author to whom correspondence should be addressed.
Remote Sens. 2020, 12(13), 2079; https://doi.org/10.3390/rs12132079
Submission received: 23 April 2020 / Revised: 17 June 2020 / Accepted: 17 June 2020 / Published: 29 June 2020
(This article belongs to the Special Issue Calibration and Validation of Satellite Altimetry)

Abstract

:
This study validated wind speed (WS) and significant wave height (SWH) retrievals from the Sentinel-3A/3B and Jason-3 altimeters for the period of data beginning 31 October 2019 (to 18 September 2019 for Jason-3) using moored buoy data and satellite Meteorological Operational Satellite Program (MetOp-A/B) Advanced Scatterometer (ASCAT) data. The spatial and temporal scales of the collocated data were 25 km and 30 min, respectively. The statistical metrics of root mean square error (RMSE), bias, correlation coefficient (R), and scatter index (SI) were used to validate the WS and SWH accuracy. Validation of WS against moored buoy data indicated errors of 1.19 m/s, 1.13 m/s and 1.29 m/s for Sentinel-3A, Sentinel-3B and Jason-3, respectively. The accuracy of Sentinel-3A/3B WS is better than that of Jason-3. All three altimeters underestimated WS slightly in comparison with the buoy data. Errors in WS at different speeds or SWHs increased slightly as WS or SWH increased. Over time, the accuracy of the Jason-3 altimeter-derived WS improved, whereas that of Sentinel-3A showed no temporal dependence. The WSs of the three altimeters were compared with ASCAT wind data for validation purposes over the global ocean without in situ measurements. On average, the WSs of the three altimeters were lower in comparison with the ASCAT data. The accuracy of the three altimeters was found to be consistent and stable at low/medium speeds but it decreased when the WS exceeded 15 m/s. Validations of SWH against buoy wave data indicated that the accuracy of Jason-3 SWH was better than that of Sentinel-3A/3B. However, the accuracy of all three altimeters decreased when the SWH exceeded 4 m. The accuracy of Sentinel-3A and Jason-3 SWH was temporally stable, whereas that of Sentinel-3B SWH improved over time. Analyses of SWH accuracy as a function of wave period showed that the Jason-3 altimeter was better than the Sentinel-3A/3B altimeters for long-period ocean waves. Generally, the accuracy of WS and SWH data derived by the Sentinel-3A/3B and Jason-3 altimeters satisfies their mission requirements. Overall, the accuracy of WS (SWH) derived by Sentinel-3A/3B (Jason-3) is better than that retrieved by Jason-3 (Sentinel-3A/3B).

Graphical Abstract

1. Introduction

Sea surface wind is an important parameter of the marine dynamic environment. It is related to all types of movement of sea water, e.g., capillary gravity waves, ocean waves, and ocean currents. Sea surface winds are required as input to meteorological and wave forecasting models, as well as ocean circulation numerical models. Ocean waves represent one form of seawater movement and wave height is an important parameter for characterization of the sea state. Remote sensing technology provides the opportunity to obtain sea surface wind and ocean wave information simultaneously over large areas. A scatterometer, radiometer, synthetic aperture radar (SAR), and altimeters can obtain sea surface wind and/or ocean wave retrievals, and such information is important for socioeconomic development. For example, Sentinel-1 SAR images have been used to assess the wind energy potential of the northwest coast of the Sicily (Italy) [1].
A satellite-borne altimeter represents an important sensor for monitoring marine dynamic environment. For example, the sea surface height (SSH), significant wave height (SWH) and wind speed (WS) of the global ocean can be derived using satellite altimeters [2]. Moreover, SWH and WS can be measured simultaneously by a satellite altimeter, which is very useful in studies on ocean waves and their relations with wind. More than 10 altimeter missions have produced a database of synchronous WS and SWH data of the global ocean spanning more than 30 years. This database has proven very useful in oceanographic research, such as study of the climate of waves and wind over the global ocean, and the determination and investigation of extreme values of meteorological system.
Satellite altimeters measure the radar power returned from the sea surface, which is influenced by the wind-induced capillary waves of the sea surface. The returned radar power is directly related to the backscattering coefficient σ0 of the sea surface. As sea surface WS increases, the sea surface roughness is also increased by the wind-induced capillary waves. Altimeter measurements of σ0 are therefore inversely related to sea surface WS. Wind direction cannot be determined by the measurements of σ0, which means only WS can be inferred from satellite-borne altimeters. The altimeter WS model functions relate σ0 to WS at the height of 10 m above the sea surface, which is regarded as neutrally stable. The model functions used most widely to date are empirical [3]. The SWH of ocean waves can be determined from the slope of the leading edge of the returned altimeter waveform. Therefore, validation of altimeter WS and SWH retrievals is very important for data applications. In addition, the accuracy of satellite-derived WS and SWH data influences altimeter SSH measurements because such information forms the basis for correction of sea state bias in SSH measurements [4,5]. Buoy data are used commonly to develop and validate the WS and/or SWH retrieval methods of altimeters [6]. Typically, collocation data with spatial and temporal scales of 50 km and 30 min, respectively, are used to validate the WS and SWH measurements of existing altimetry missions [7,8,9,10]. For example, GEOSAT radar altimeter-derived WS was compared with data measured by 43 National Data Buoy Center (NDBC) buoys moored in coastal regions of the North Pacific, North Atlantic, and Gulf of Mexico during several months in 1985. The difference in WS between the GEOSAT and buoy measurements was 1.3 m/s within a 50-km spatial range [11]. WS measurements acquired during 2013–2015 by the SARAL/AltiKa mission were validated using observations from moored buoys in the north Indian Ocean. The results indicated that the WS derived by SARAL/AltiKa had reasonable consistency with the buoy data [12]. The TOPEX altimeter WS data of the first 30 cycles were validated using the Japanese buoy data. The results showed that the altimeter-derived WS satisfied the design requirements of the mission with a root mean square error (RMSE) value of 1.99 m/s [13]. WS derived by the altimeters of ENVISAT and Jason-1 have also been validated using buoy data. The results showed reasonable agreement between both the ENVISAT and Jason-1 WS measurements and the buoy data [14]. Average monthly estimates of WS by the GEOSAT, TOPEX, and ERS-1 altimeters have been compared with NDBC buoy WS data and corrected to form a long-term WS database of the global ocean that spans several decades [15]. Sea surface WS measurements derived by the SAR mode of CryoSat-2 have been validated using WS data from the numerical model of the European Centre for Medium-Range Weather Forecasts (ECMWF), as well as measurements by buoys and the Jason-2 altimeter. The results indicated that the performance of the CryoSat-2 SAR WS observations was in reasonable agreement with that of the Jason-2 altimeter [16]. The WS estimates of nine altimeters have been calibrated using NDBC buoy data in a systematic manner to build a long-term consistent satellite-derived WS database [17]. Retrievals of WS by seven scatterometers (i.e., ERS-1/2, QuikSCAT, Meteorological Operational Satellite Program (MetOp-A/B), OceanSat-2, and RapidScat) have also been validated using NDBC buoy data, and cross validation between these scatterometers and certain altimeters was performed on data acquired before 16 July 2018 to verify the consistency and stability [18]. SWH and WS from 13 altimeters (i.e., Geosat, ERS-1/2, TOPEX, GFO, Jason-1/2/3, Envisat, Cryosat-2, HY-2A, SARAL, and Sentinel-3A) with temporal coverage of 33 years (1985-2018) have been calibrated and validated against National Oceanographic Data Center (NODC) buoy data [19]. Much other work has also been dedicated to validation of SWH data derived from the TOPEX/Poseidon (T/P), Jason-1, Jason-2, ERS, GEOSAT Follow-on, and ENVISAT altimeters [20,21,22,23,24]. Sentinel-3, which is operated jointly by the European Space Agency (ESA) and the European Organization for the Exploitation of Meteorological Satellites (EUMETSAT), is a satellite mission of the European Copernicus programme [25]. Sentinel-3A was launched on 16 February 2016 and Sentinel-3B was launched on 25 April 2018. The SAR Altimeter (SRAL) instrument onboard Sentinel-3A/3B can be used to measure SSH, SWH and sea surface WS of the global ocean. The standard algorithm for the SRAL-derived WS is based on Abdalla et al. [26]. Sentinel-3A data, including range corrections, are assessed over the global ocean and the WS retrievals from Sentinel-3A are compared with those of Jason-3 [27]. Data assessment is very important in satellite altimetry; thus, the main range and geophysical corrections of T/P and Jason-1/2 altimeters have been assessed in relation to the determination of sea-level trend in the Indonesia seas [28]. Jason-3, which was launched on 17 January 2016, is the fourth mission of the cooperative program between the U.S. and Europe (i.e., the successor of T/P and Jason-1/2) that is designed to measure SSH, SWH and WS. The Jason-3 mission extends the period of observations of sea surface topography that commenced with the T/P satellite mission. WS of Jason-3 is derived using the Gourrion algorithm [29] and Collard table [30].
This study evaluated the accuracy of the WS and SWH retrievals from the Sentinel-3A (1 March 2016 to 31 October 2019), Sentinel-3B (10 November 2018 to 31 October 2019), and Jason-3 (12 February 2016 to 18 September 2019) altimeters using measurements from moored buoys and the MetOp-A/B Advanced Scatterometer (ASCAT). The accuracy of the WS derived by the Sentinel-3A/3B and Jason-3 altimeters over the global ocean and at different WSs and SWHs was analyzed, and the WSs retrieved by the three altimeters were compared with ASCAT data over the global ocean without in situ measurement. The accuracy of SWHs derived by the Sentinel-3A/3B and Jason-3 altimeters over the global ocean was analyzed at different SWHs, WSs and wave periods. Section 2 provides descriptions of the material and methods used in this work. The validation of the WSs and SWHs derived by the three altimeters is considered in Section 3. Section 4 provides the conclusions of this study.

2. Material and Methods

2.1. Data

This study used WS and SWH data derived by the Sentinel-3A/3B and Jason-3 altimeters, wind and wave data from the moored buoys, and ASCAT wind vectors.

2.1.1. Altimeter Data
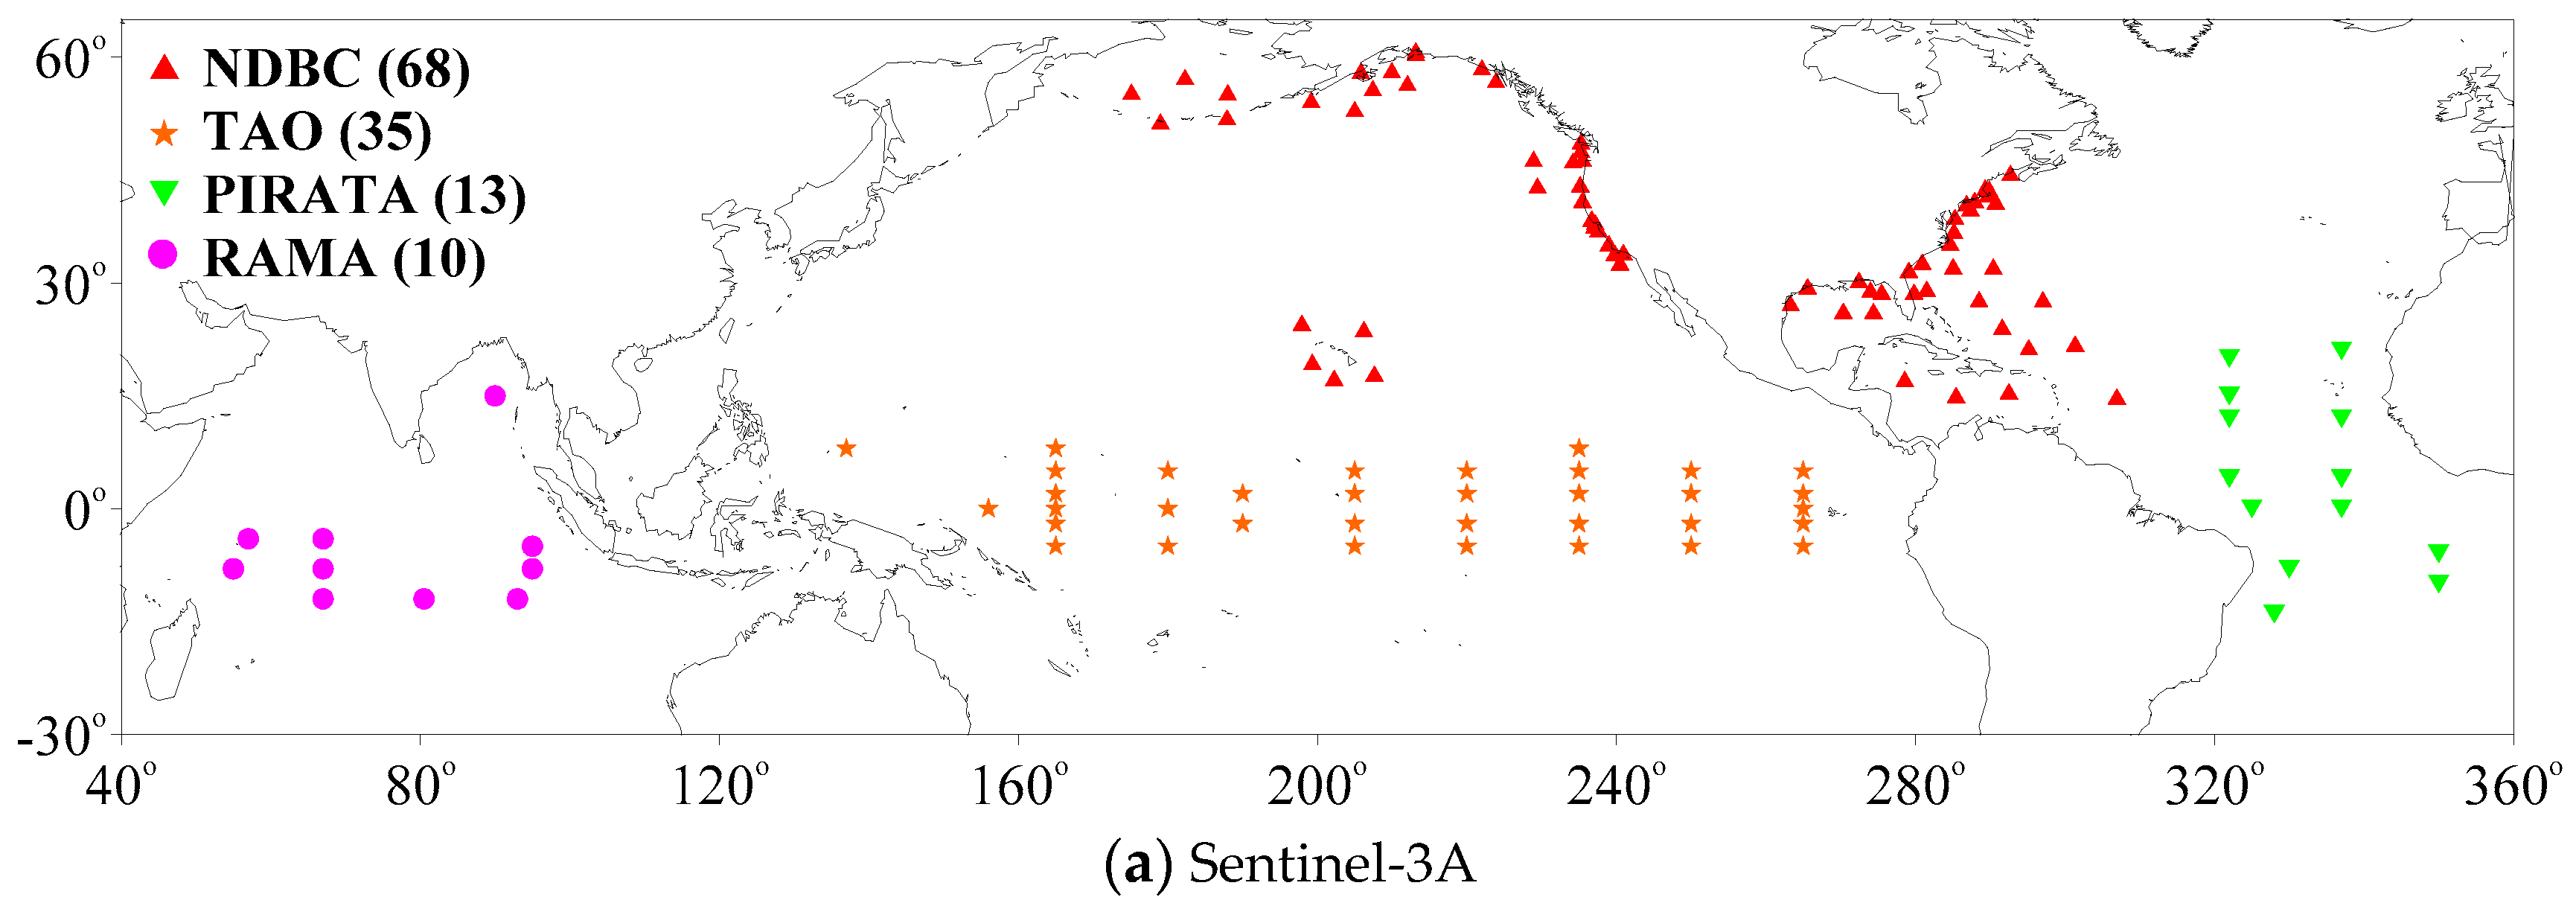
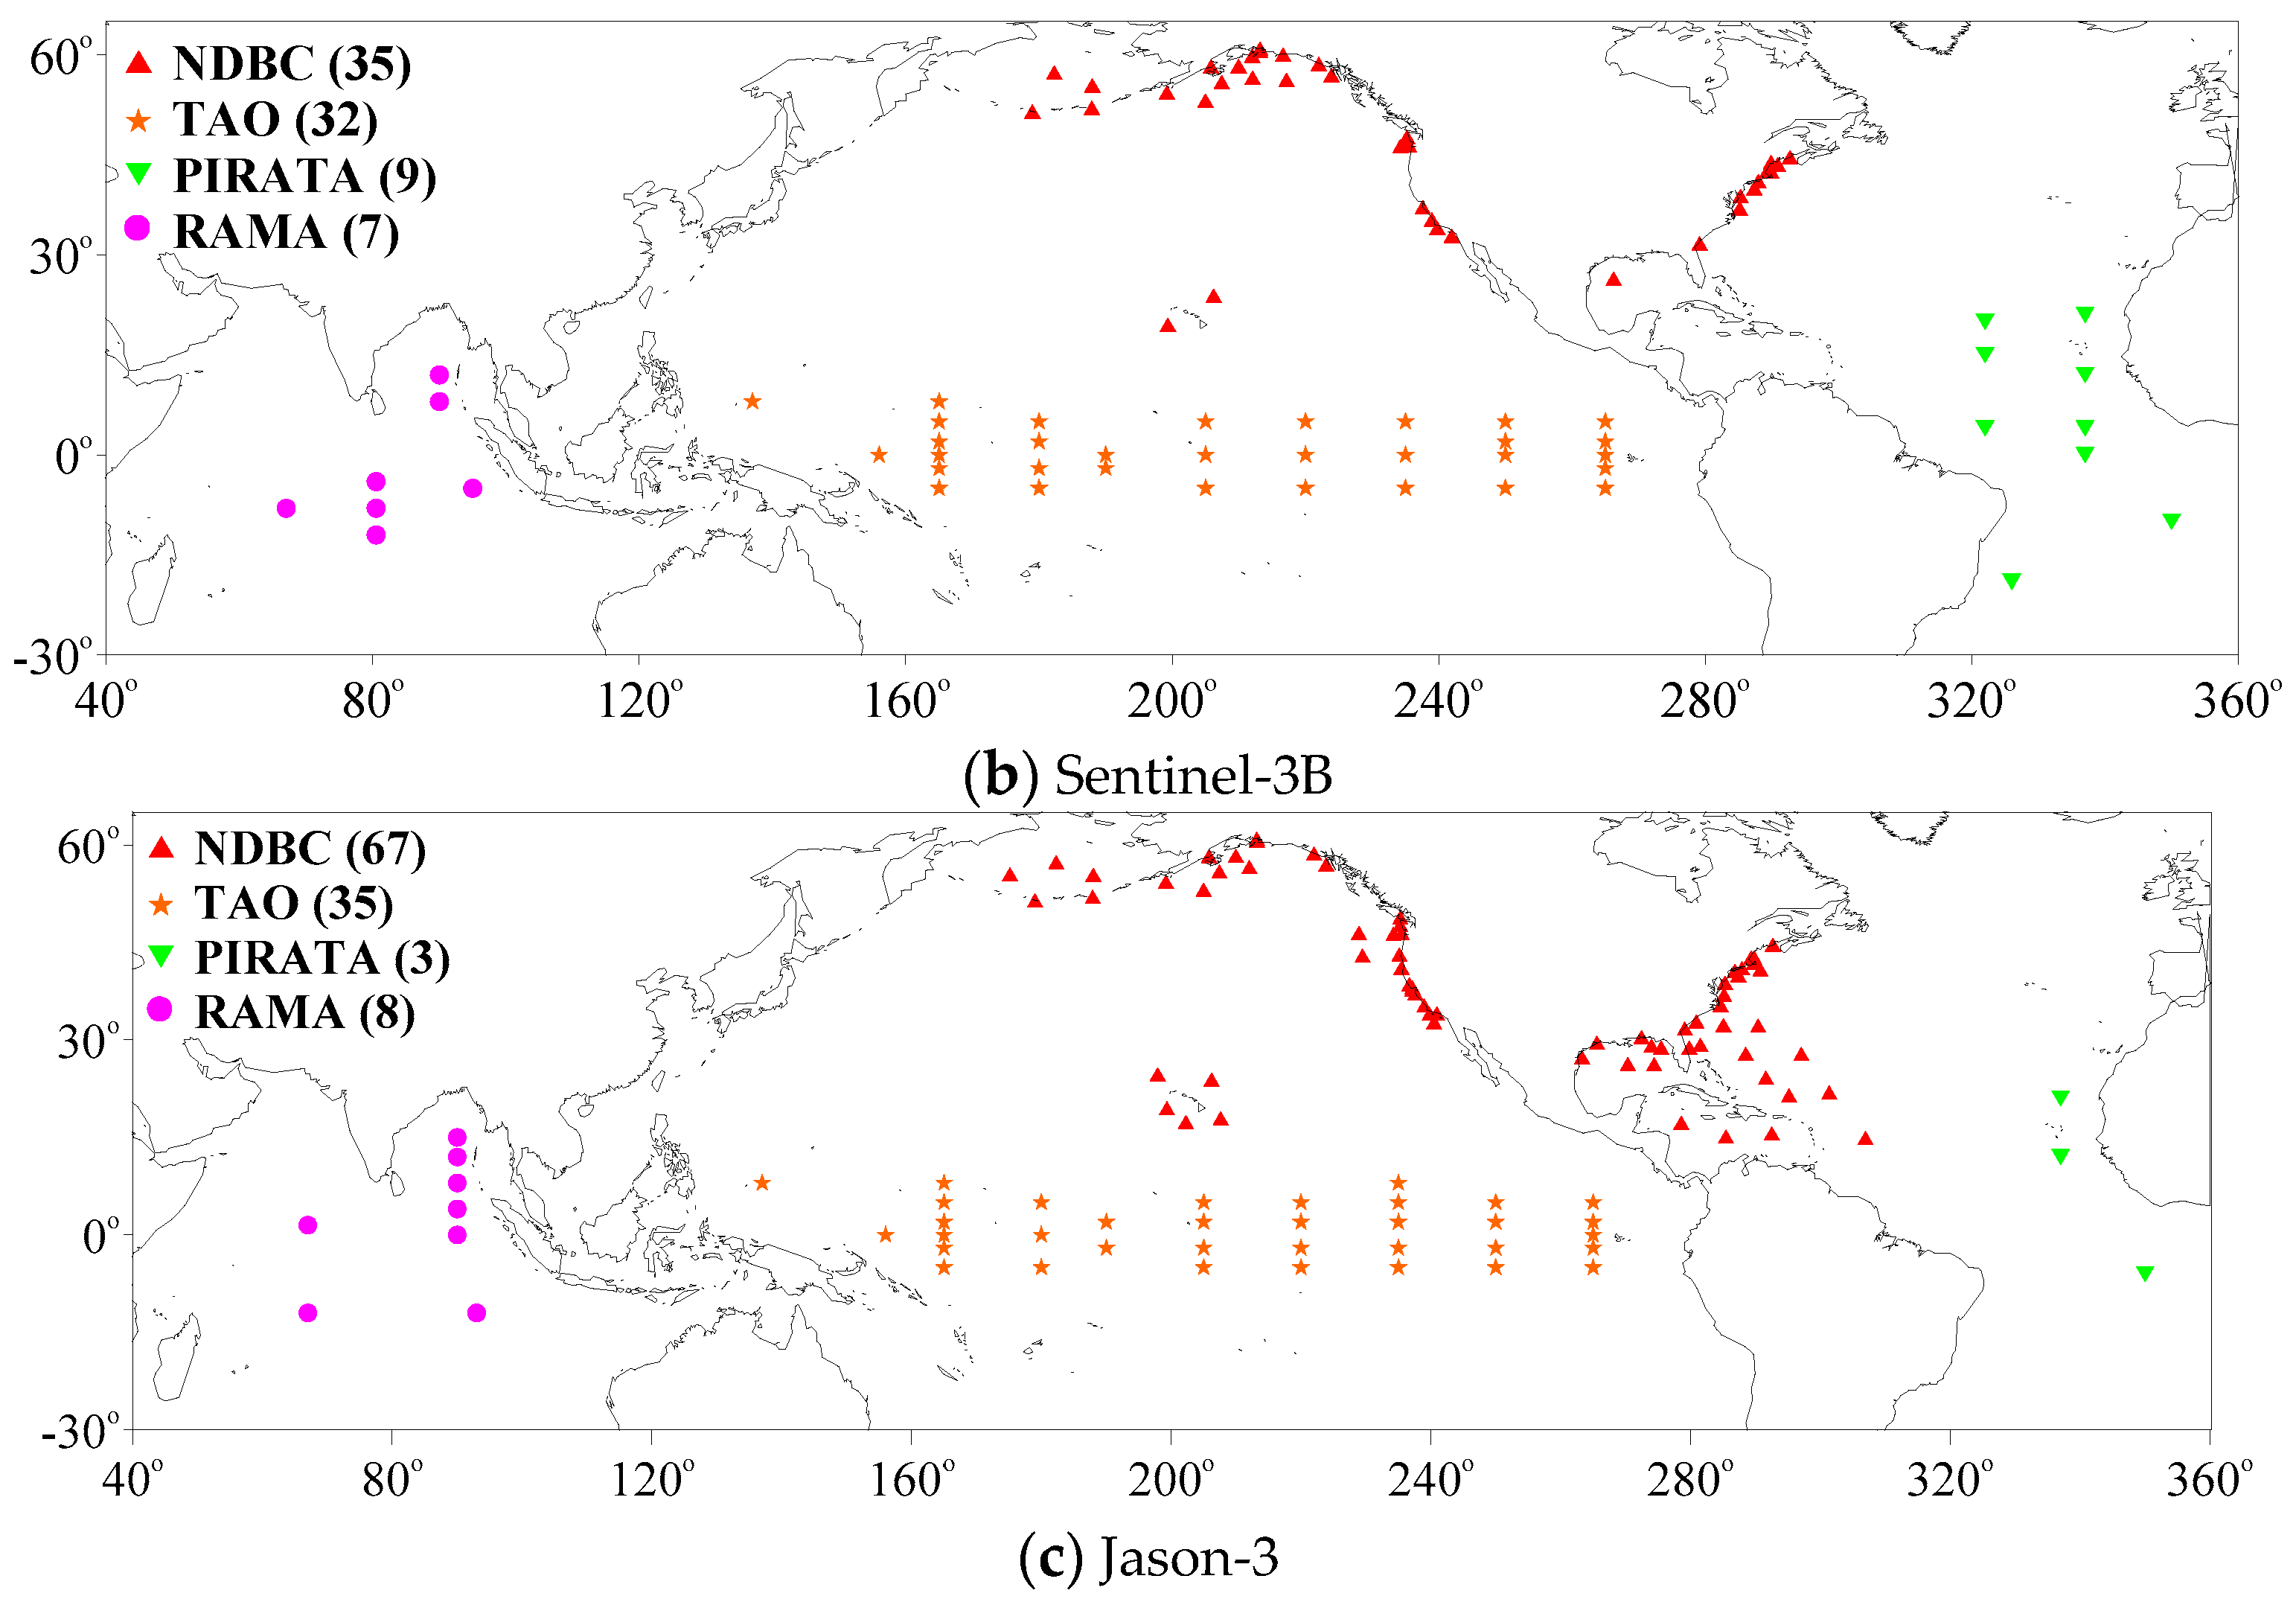
The SRAL onboard Sentinel-3A/3B has a repeat cycle of 27 days, and it can measure SSH, SWH, and WS of the global ocean on a sun-synchronous polar orbit. The SRAL operates at the frequencies of 13.575 GHz (Ku-band) and 5.41 GHz (C-band), which allows for dual-frequency ionospheric correction. The latitudinal range of the global coverage of the SRAL is between 81.35°S and 81.35°N. The SRAL has two measurement modes: a low-resolution mode (LRM) and SAR mode. The former is the traditional altimeter mode, while the SAR mode is the high-resolution along-track mode. The two modes of the SRAL cannot work simultaneously and therefore the SAR mode is commonly used over the global ocean. The Sentinel-3A/3B SRALs produce three types of level-2 data: reduced, standard, and enhanced measurement data. Reduced measurement data contain only the main 1 Hz data. Standard measurement data contain the 1 Hz and 20 Hz data of the Ku and C bands. Enhanced measurement data contain the returned waveforms, additional information, and data reprocessing parameters in addition to the standard measurement information. This study used the standard measurement data of the Sentinel-3A/3B SRALs, which are distributed by EUMETSAT through the Copernicus Online Data Access (CODA) system (https://coda.eumetsat.int/#/home) [31]. The Sentinel-3A (3B) SRAL data used covered the period from 1 March 2016 to 31 October 2019 (10 November 2018 to 31 October 2019).
Jason-3, which is also a dual-frequency (Ku- and C-band) altimeter launched on 17 January 2016, is the successor of the TOPEX/Poseidon (1992–2006), Jason-1 (2001–2013), and Jason-2 (2008–2019) satellites. Jason-3 can measure SSH, SWH and WS over the global ocean with a repeat cycle of 10 days. Jason-3 continues the program of high-precision measurement of SSH for studies on topics such as the global ocean circulation, climate change, and sea level rise. The latitudinal coverage of Jason-3 is between 66°S and 66°N. This study used geophysical data records from Jason-3 for the period from 12 February 2016 to 18 September 2019 distributed by the French Space Agency (ftp://ftp-access.aviso.altimetry.fr).

2.1.2. Buoy Data

This study used wind and wave field observational data acquired by moored buoys. Wind data from the NDBC buoys represent 10-min averages of the speed and direction at different heights above the sea surface with sampling of 2 Hz. Measurements of SWH by the NDBC buoys represent the average of the highest third of the waves during a 20-min sampling period. In addition, 10-min average measurements of wind data recorded by moored buoys of the Tropical Atmosphere Ocean (TAO) array, Pilot Research Moored Array in the Tropical Atlantic (PIRATA), and Research Moored Array for African-Asian-Australian Monsoon Analysis and Prediction (RAMA) were also used. The height of the wind measurements by these buoys is 4 m above the sea surface, and the sampling period and rate of wind measurement are 2 min and 2 Hz, respectively. The spatial distributions of the moored buoys matched to the Sentinel-3A, Sentinel-3B, and Jason-3 altimeters for WS validation are shown in Figure 1. In this study, WS data from 116, 83, and 113 moored buoys were used to validate the WSs derived by the Sentinel-3A/3B and Jason-3 altimeters, respectively. The spatial distributions of the NDBC buoys matched to the three altimeters for SWH validation are shown in Figure 2. Wave height data from 123, 106, and 41 NDBC buoys were used to validate SWHs derived by the Sentinel-3A/3B and Jason-3 altimeters, respectively. Only observations acquired by buoys more than 50 km offshore and in regions with water depth of >100 m were used to avoid nearshore effects on data quality. NDBC buoy data can be downloaded from https://www.ndbc.noaa.gov/. TAO, PIRATA, and RAMA buoy data can be downloaded from https://www.pmel.noaa.gov/tao/drupal/disdel/. For direct comparison of the altimeter and buoy data, buoy WSs were converted to speeds at 10 m above the sea surface using a model developed by Liu, Katsaros and Businger (referred to as the LKB model). The LKB model enabled numerical determination of air-sea exchanges of momentum, heat and water vapor employing the bulk parameters of mean WS, temperature and humidity at a certain height in the atmospheric surface layer, and the water temperature [32,33,34].

2.1.3. Advanced Scatterometer (ASCAT) Data

In this study, Level 2 25-km sea surface wind data retrieved by ASCAT, which is deployed onboard the MetOp-A/B satellites for operational meteorology, were used to validate WS data of the three altimeters. ASCAT wind data are available with authorization from the following site: ftp://ftppro.knmi.nl. Validation has shown ASCAT WS data have reasonable accuracy with bias in the range of −0.3–0.3 m/s and average standard deviation of <1.6 m/s.

2.2. Methods

Sentinel-3A/3B and Jason-3 altimeter-derived WSs were collocated with moored buoy (NDBC, TAO, PIRATA, and RAMA) and ASCAT wind data to validate the accuracy of WS derived by the three altimeters. In accordance with the LKB method mentioned in Section 2.1.2, the moored buoy WSs were converted to speeds at 10 m above the sea surface using the following expression:
u h = 2.5 ln ( h / z 0 ) u
where u h is WS at height h above the sea surface, u and z 0 are parameters obtained from the LKB model with the measured WS and its measurement height above the sea surface.
Moored buoy WS data were collocated with altimeter-derived WSs with spatial and temporal scales of 25 km and 30 min, respectively. The WS data of Sentinel-3A/3B and Jason-3 altimeters were also compared with ASCAT data to validate the accuracy of the data for intervals of <30 min and distances of <25 km. The along-track spatial resolution of the altimeter is approximately 7 km. Therefore, the average of all altimeter WS data within intervals of 25 km and 30 min was considered collocated with the ASCAT wind data. The collocated WS data of Sentinel-3A/3B and Jason-3 altimeters were distributed along their tracks over the global ocean, and the numbers of collocated data were more than 10 million, 2 million, and 2 million for Sentinel-3A/3B and Jason-3, respectively.
The SWH data of Sentinel-3A/3B and Jason-3 altimeters were validated using SWH data of NDBC buoys located more than 50 km offshore and in regions with water depth of >100 m. The NDBC buoy SWH data were collocated with Sentinel-3A/3B and Jason-3 altimeters SWH data with spatial and temporal scales of 25 km and 30 min, respectively. The numbers of collocation data pairs between the Sentinel-3A/3B and Jason-3 altimeters and the NDBC buoys data are 5345, 1191, and 3033, respectively.
Four statistical parameters were used to evaluate WS and SWH data derived by the three altimeters [35]. These comprised the RMSE, bias, correlation coefficient (R) and scatter index (SI), which can be expressed as follows:
B i a s = ( S S 0 ¯ )
R M S E = ( S S 0 ) 2 ¯
R = i = 1 N [ ( S ( i ) S ¯ ) ( S 0 ( i ) S 0 ¯ ) ] / i = 1 N ( S ( i ) S ¯ ) 2 i = 1 N ( S 0 ( i ) S 0 ¯ ) 2
S I = 1 N i = 1 N [ ( S ( i ) S ¯ ) ( S 0 ( i ) S 0 ¯ ) ] 2 S 0 ¯
where S represents the collocated altimeter WS or SWH, S0 denotes the collocated WS or SWH of the moored buoys or ASCAT, and the upper bar denotes the statistical average. Here, N is the number of the collocated data elements.

3. Results and Discussion

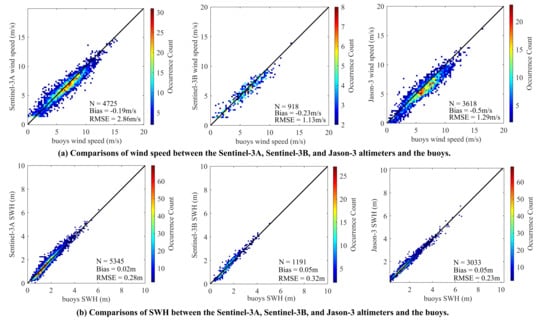
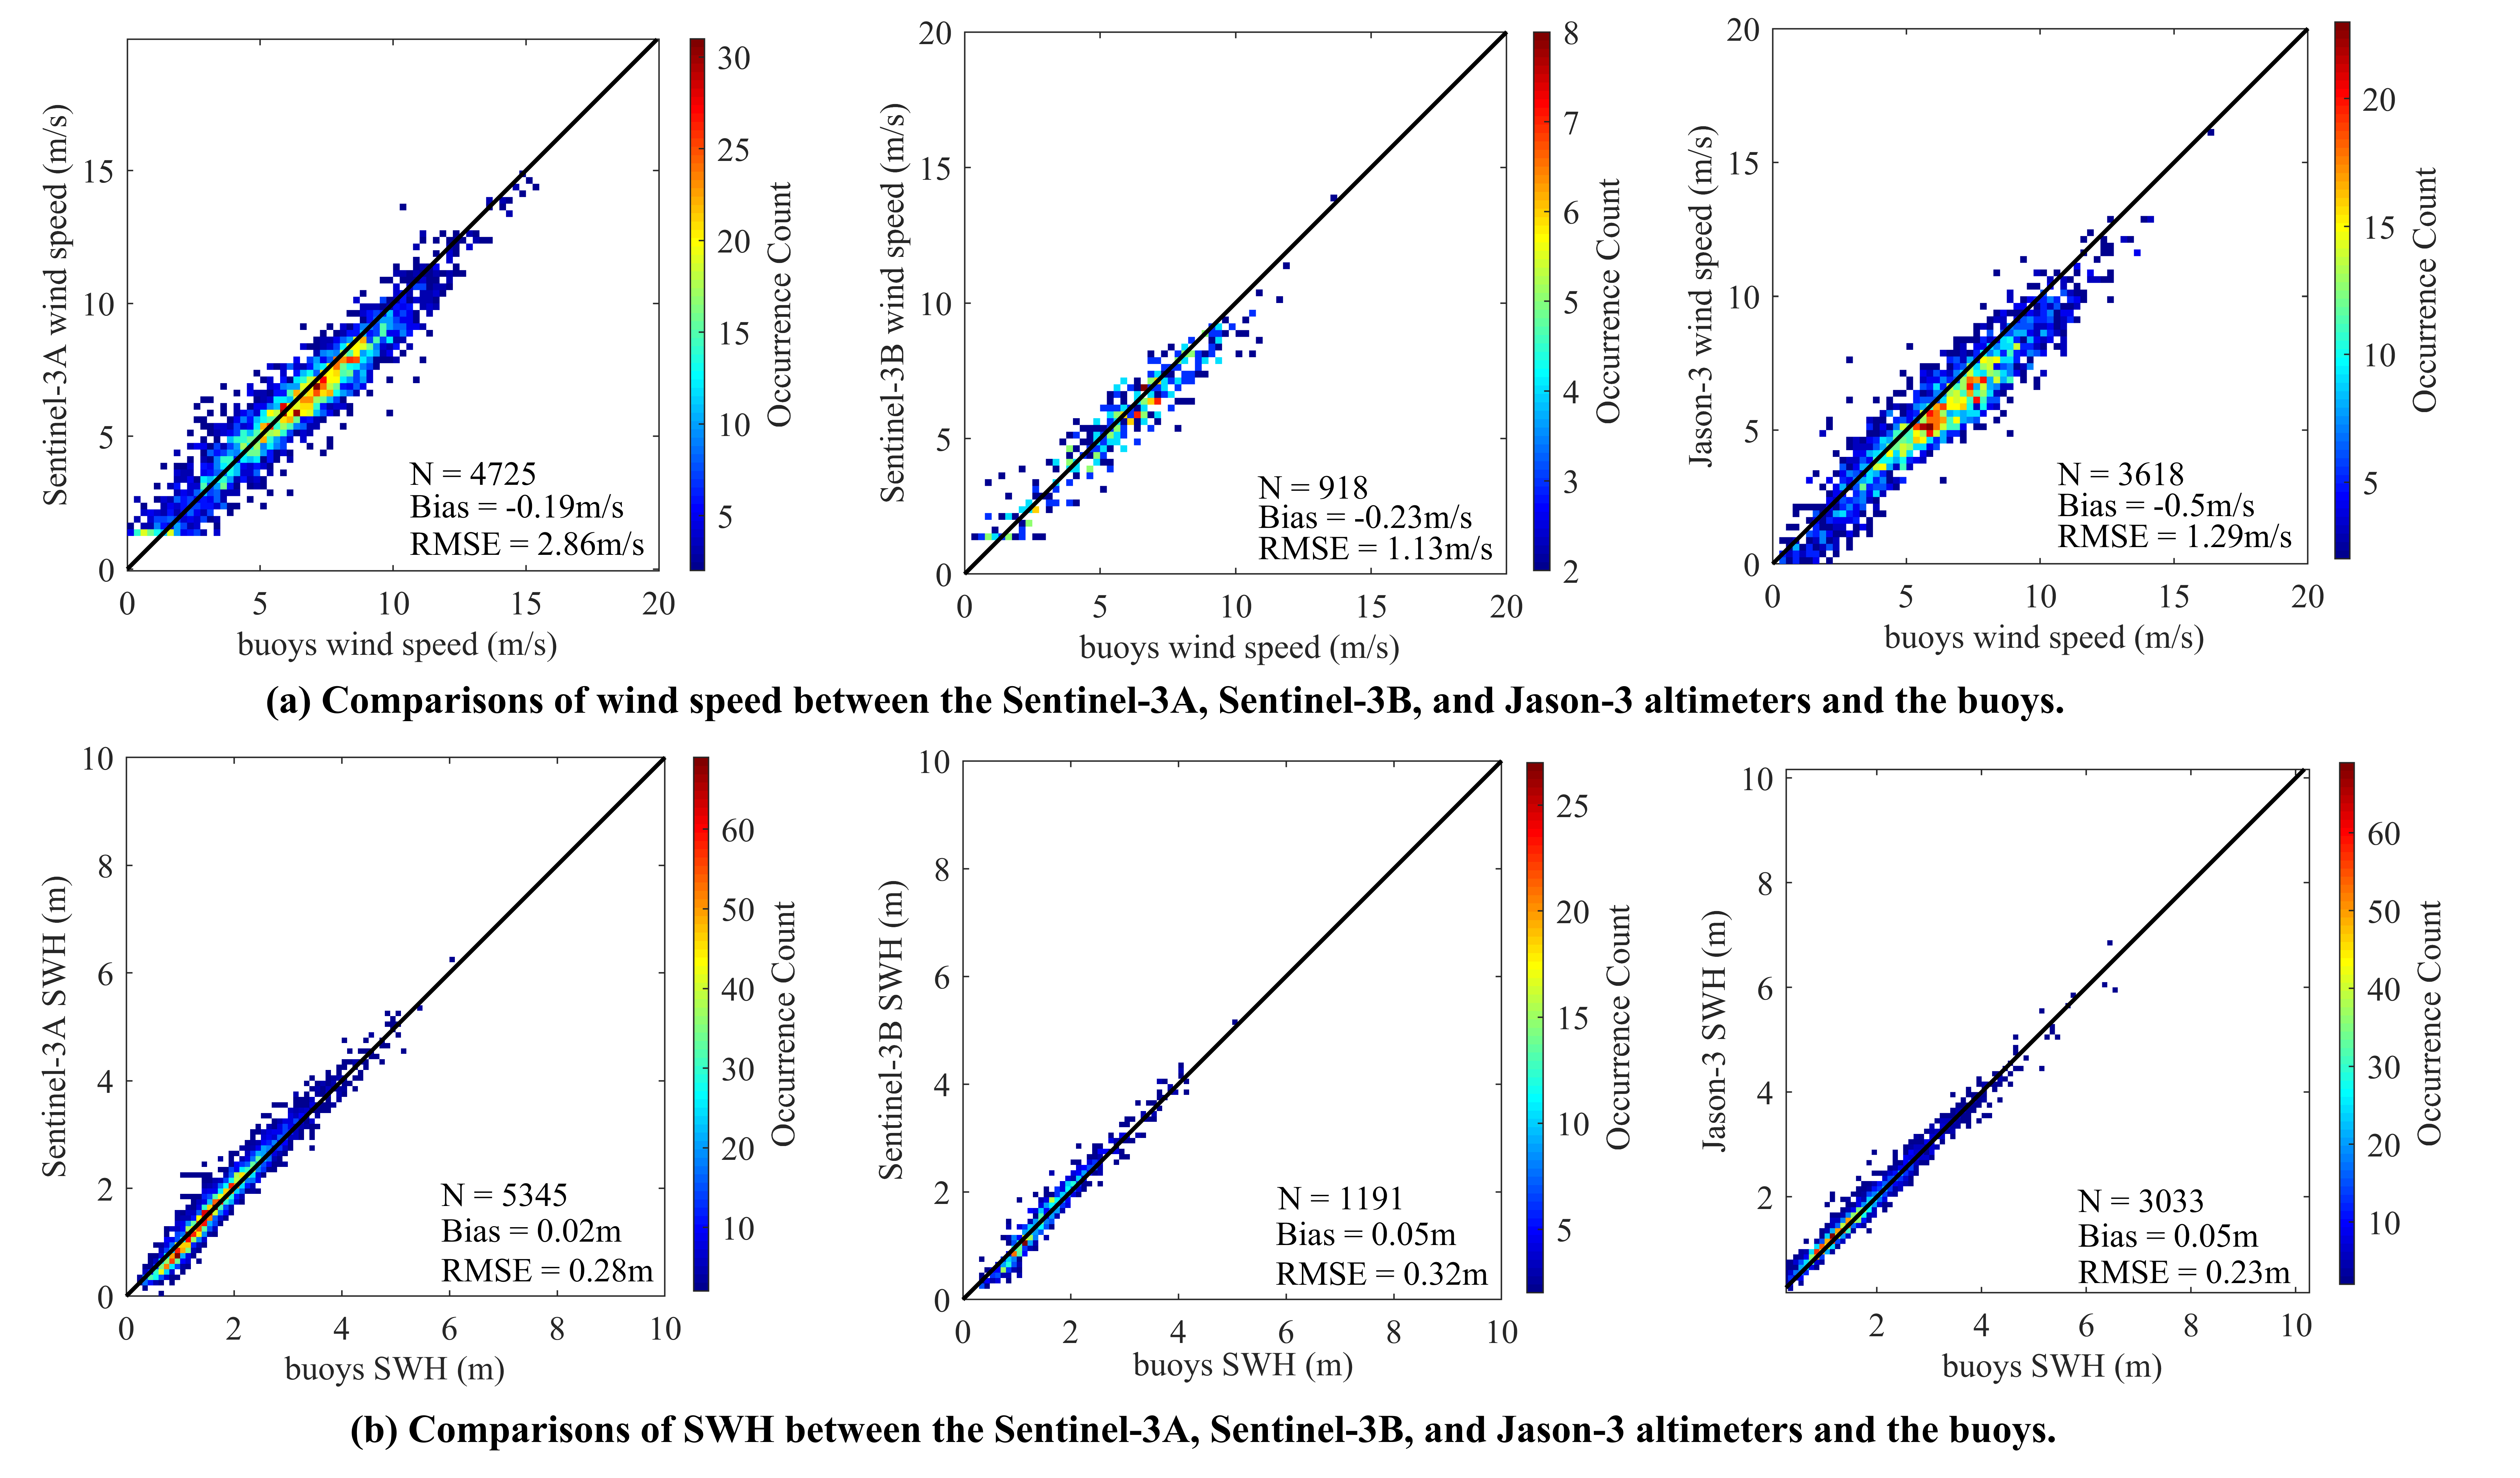
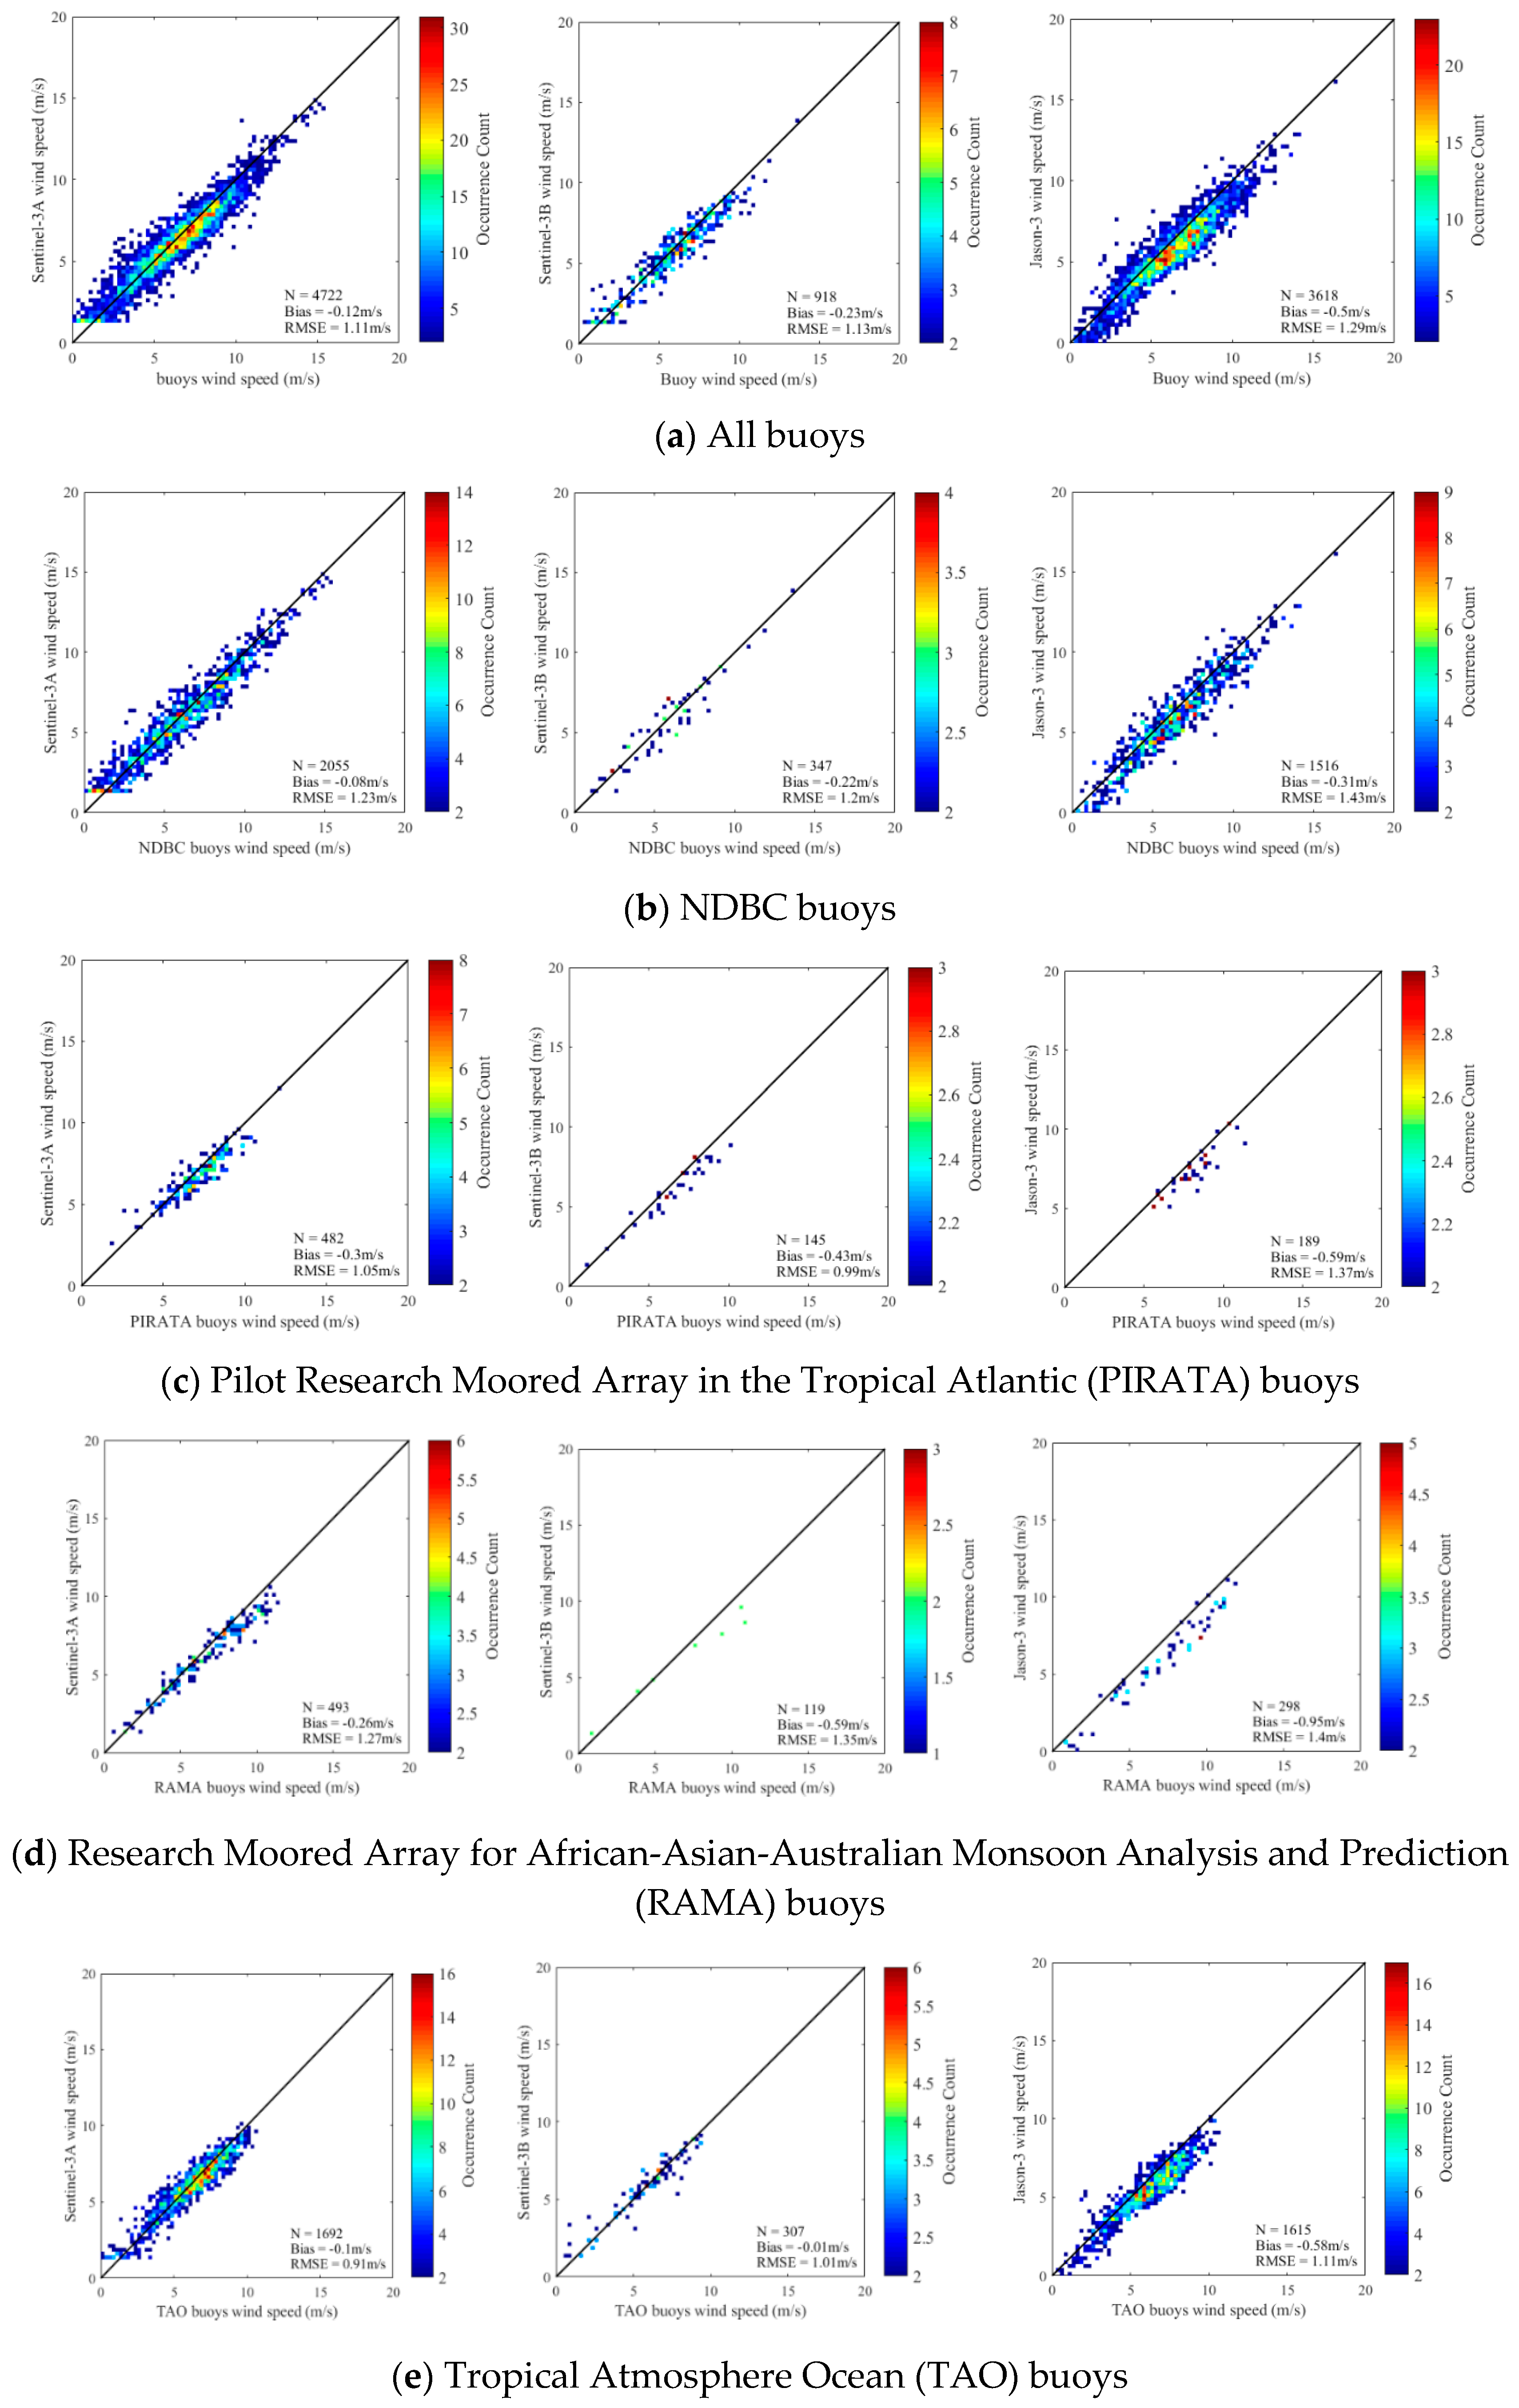
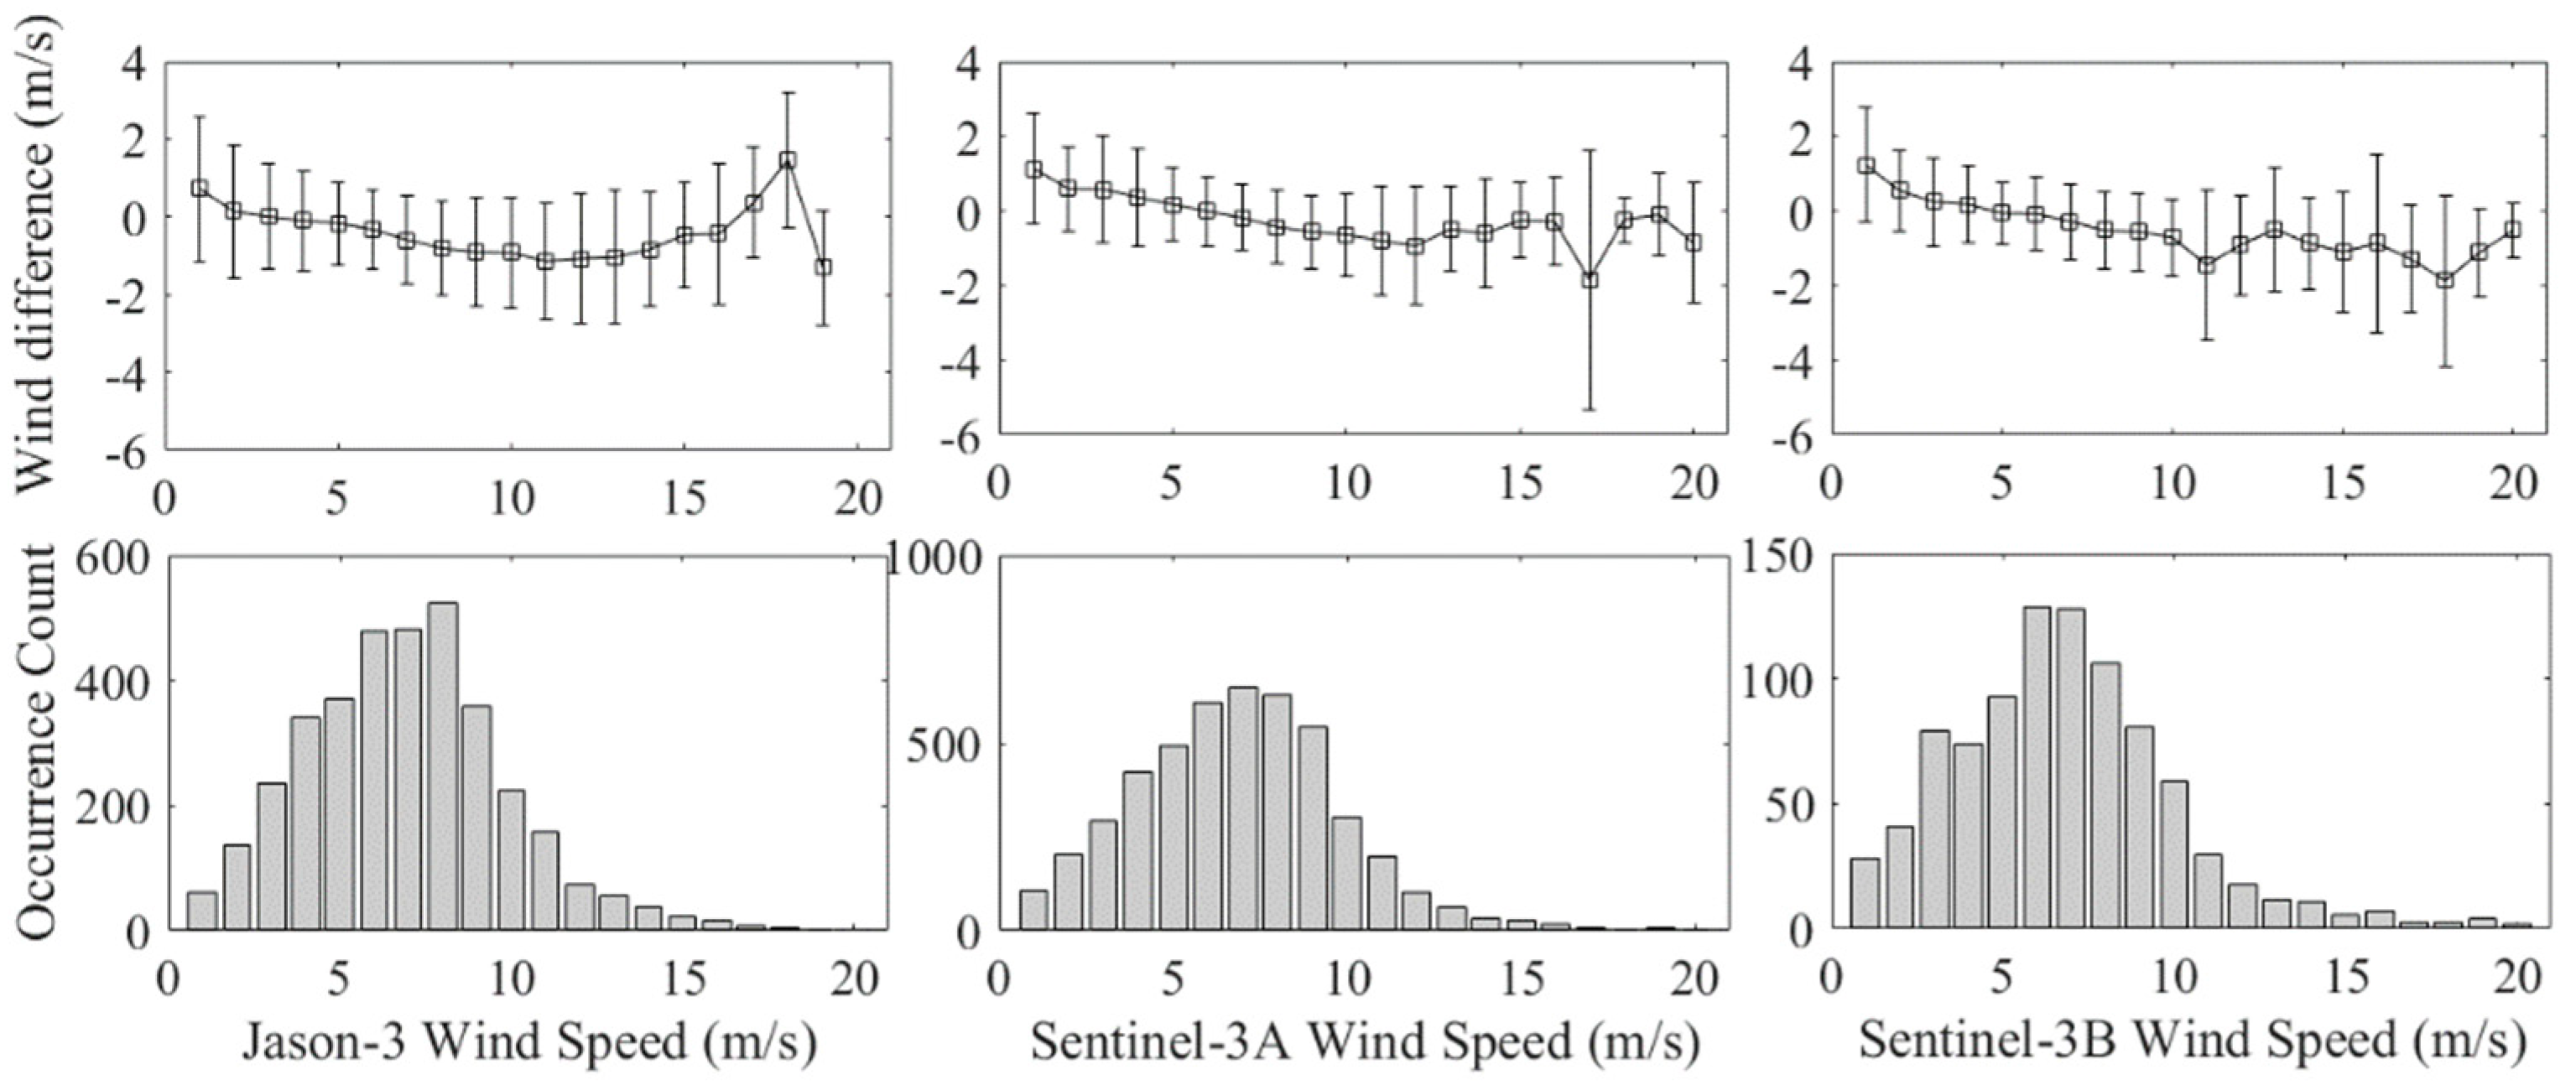
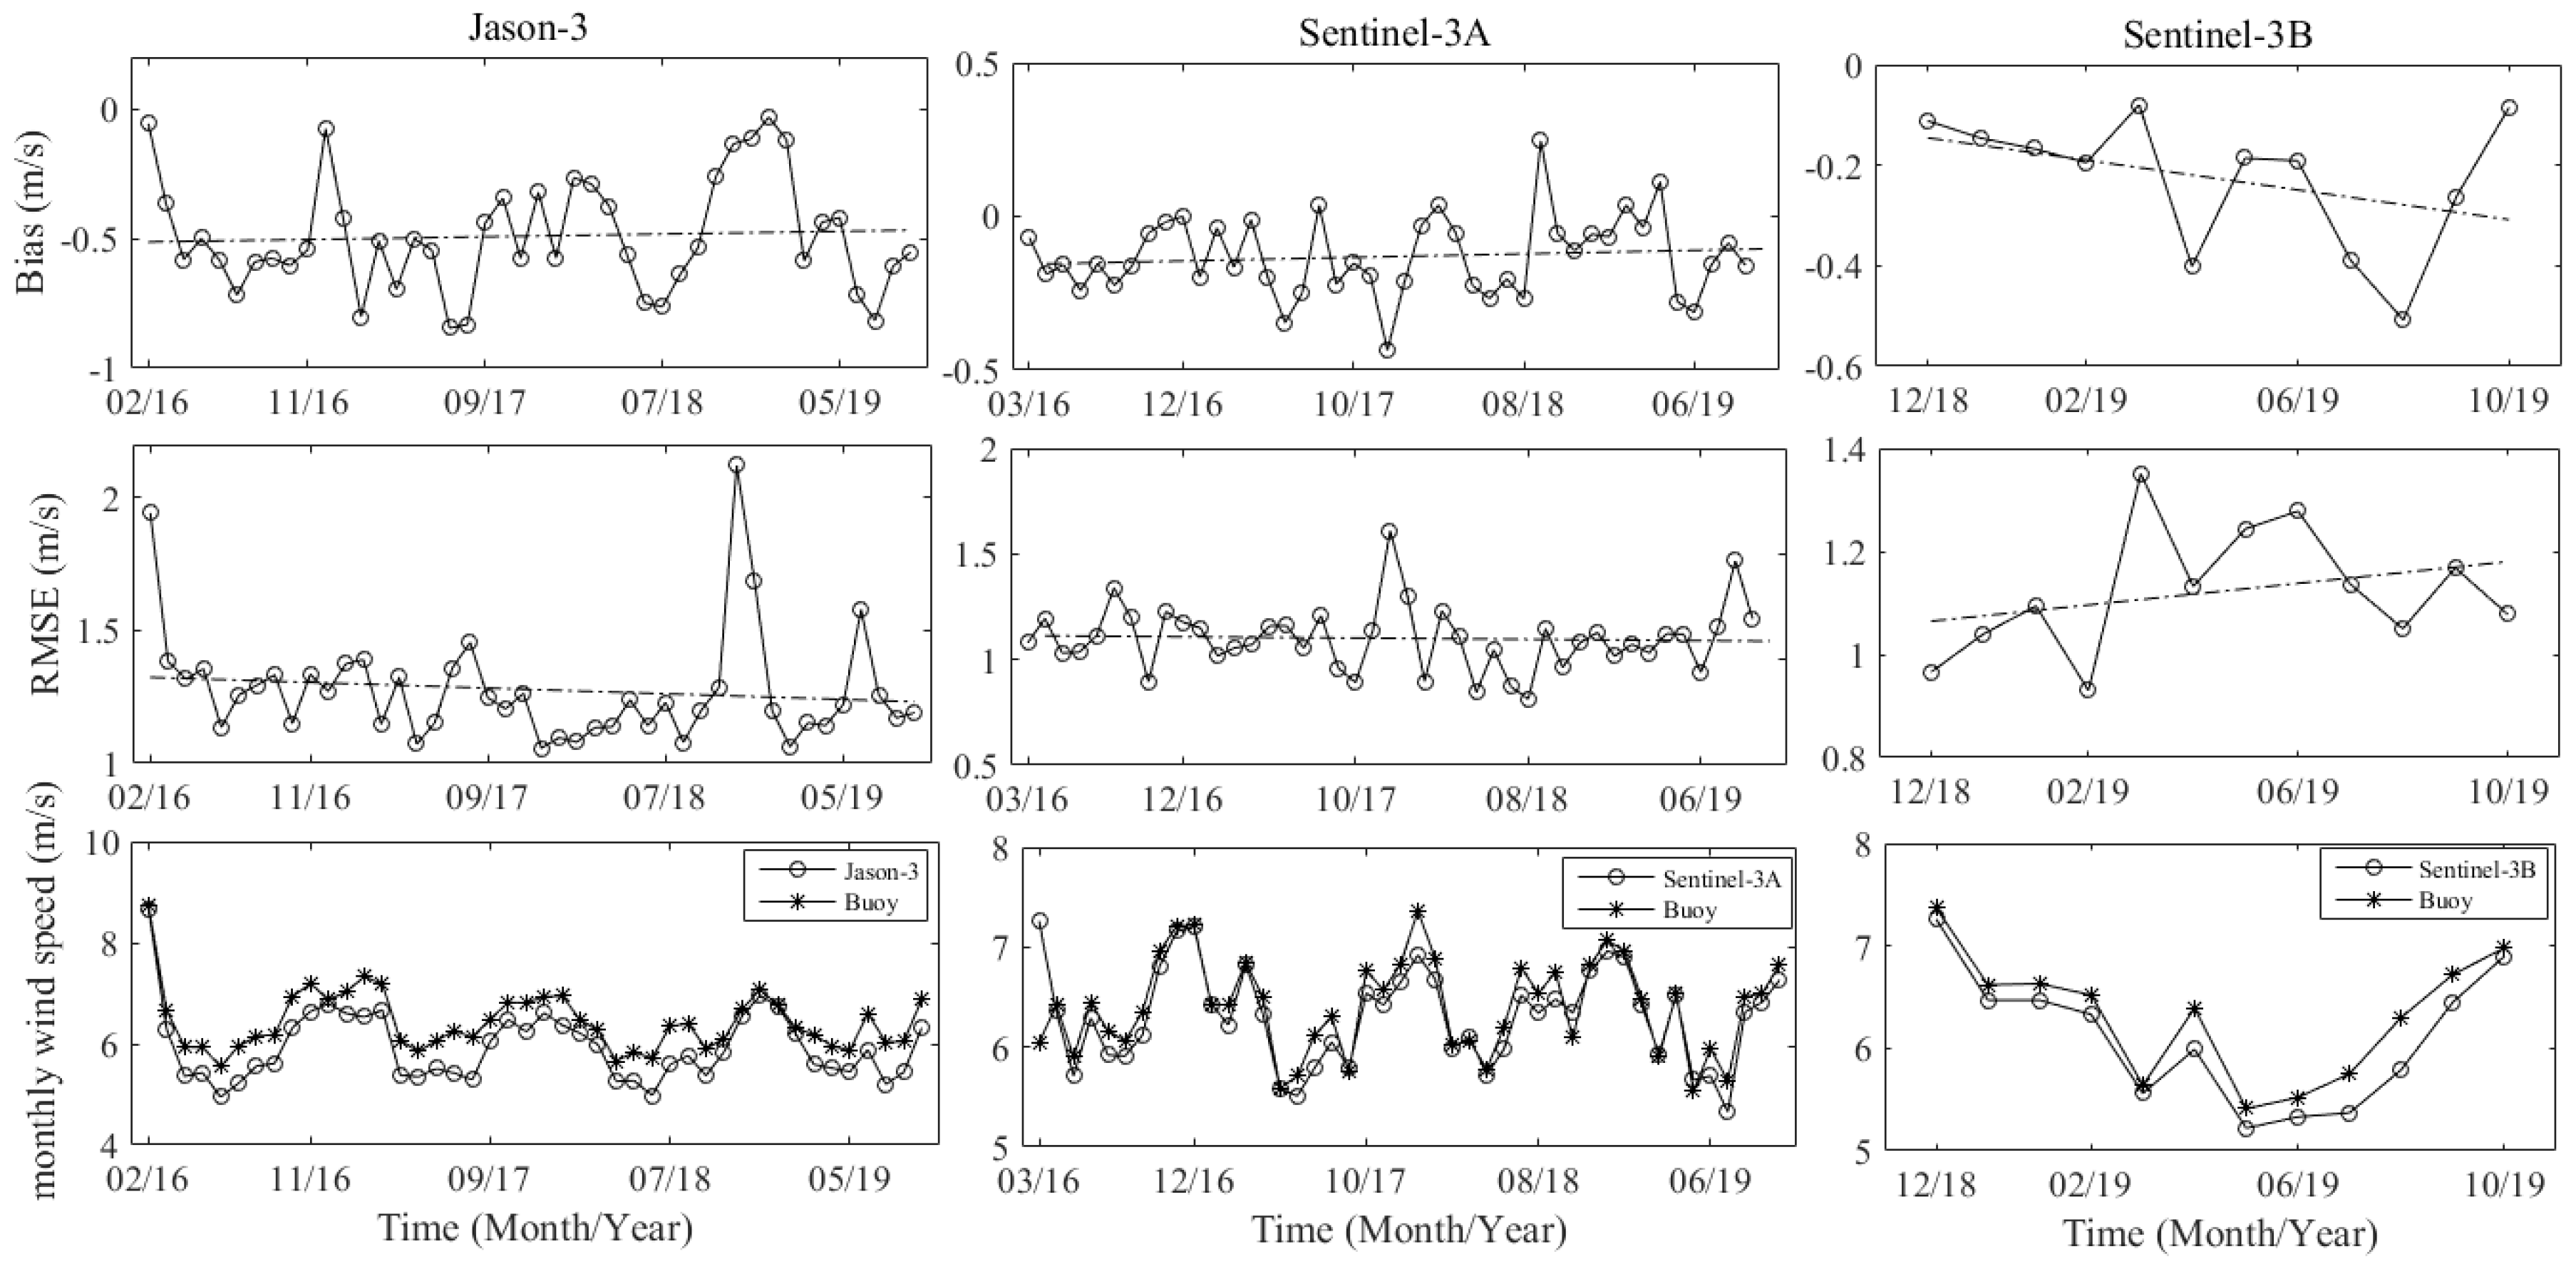
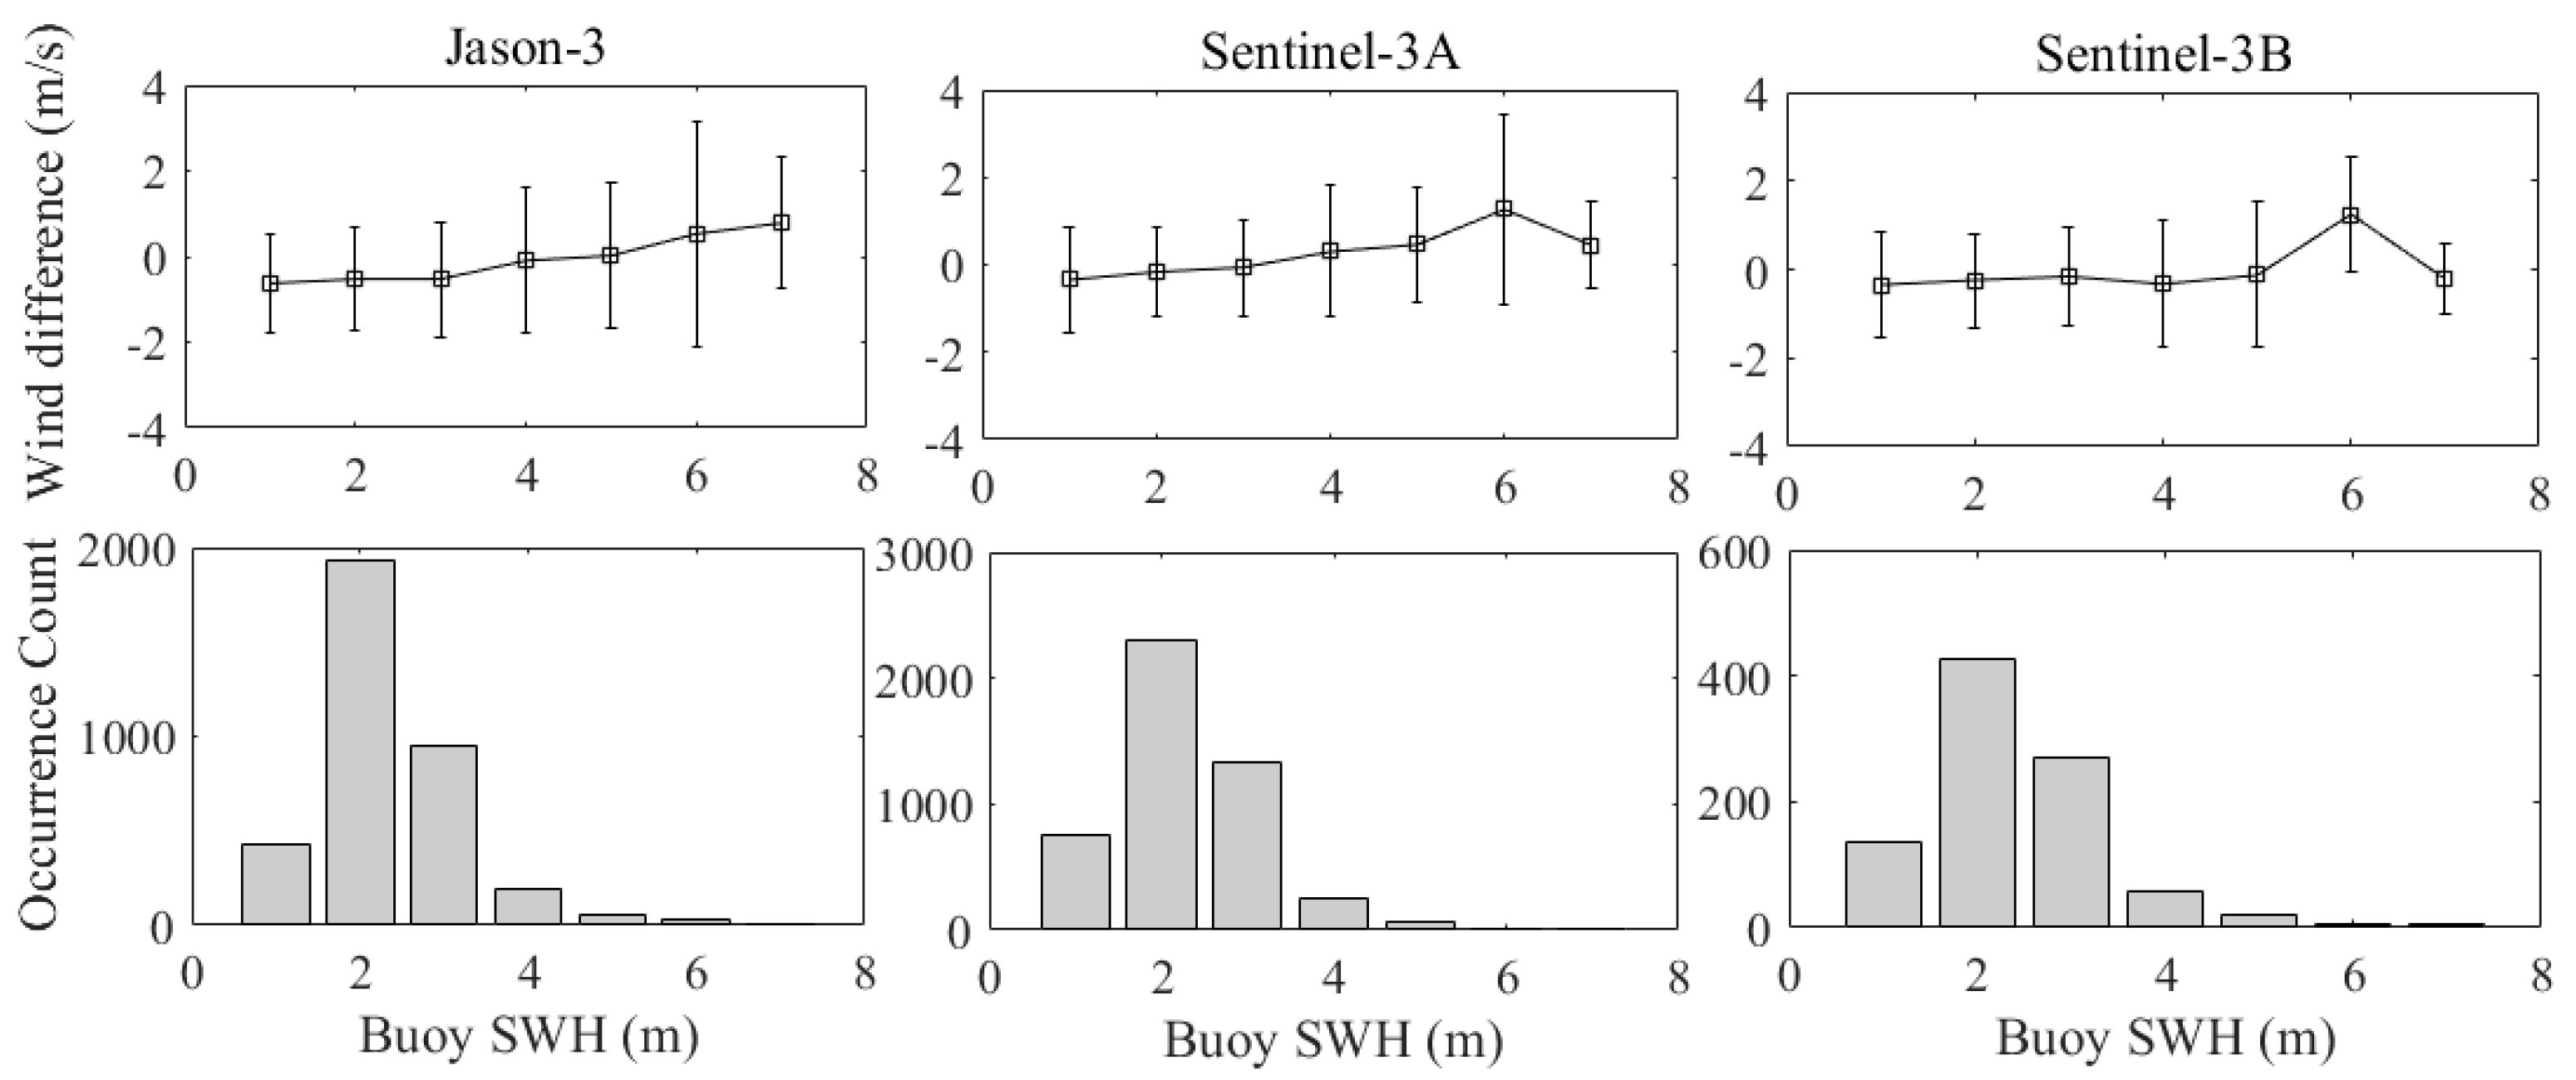
3.1. Wind Speed Validation Using Moored Buoys Data

All available historical achieved Sentinel-3A/3B and Jason-3 altimeter-derived WS data were compared against the moored buoy WS data using the matching criteria and statistical analysis outlined in Section 2.2. Scatterplots of the comparisons are illustrated in Figure 3. Owing to the short period of Sentinel-3B data, the number of collocated data for Sentinel-3B is lower than that of the Sentinel-3A and Jason-3 altimeters. The number of collocated data for Sentinel-3A is different to that of Jason-3 because their ground tracks are different. The number of collocated data and the statistical parameters (i.e., RMSE, Bias, R, and SI) of the differences in WS between the Sentinel-3A/3B and Jason-3 altimeters and the moored buoys are shown in Table 1, Table 2 and Table 3, respectively. It can be seen that the three altimeters meet the requirements of their missions in terms of WS retrievals. The R and SI values confirm the satisfactory performance of the three altimeters. The negative biases (altimeter WS minus buoy WS) show that the three altimeters underestimate the true wind (moored buoys WS), and that the underestimation of Jason-3 is more obvious than that of the others. The underestimation of TAO, RAMA, PIRATA buoy WSs by the Jason-3 altimeter is slightly greater than that of the NDBC buoys. The similar RMSEs of Sentinel-3A and Sentinel-3B indicate that these altimeters have equal performance in term of WS retrieval. The larger RMSE of Jason-3 relative to Sentinel-3A/3B highlights its poorer performance. The biases of WS differences between each of the three altimeters and the RAMA, PIRATA buoys are slightly larger than the biases of the NDBC and TAO buoys.
The differences in WS between of the Setinel-3A/3B and Jason-3 altimeters and the buoys were analyzed as a function of WS, and the RMSEs and biases of the WS differences are illustrated with intervals of 1 m/s in Figure 4. It can be seen that the WSs of all collocated data are in the range of 3–11 m/s. For Jason-3, the biases at different WSs are negative totally and they increase slightly as WS increases. However, when the WS exceeds 12 m/s, the biases start to decrease. Results of WS >16 m/s might not be representative owing to the insufficiency of matching data. The RMSEs for WS <10 m/s are relatively small, and they increase slightly when WS is >10 m/s. In addition, the variations of RMSEs at different WSs are all slight. For Sentinel-3A/3B WSs, the biases at different WSs are also negative overall; however, they are closer to zero than is the case for Jason-3. As WS increases, the variations of the biases have an increasing trend. The RMSEs are similar to those of Jason-3 with a slight increase when WS is >10 m/s; overall, the variations of RMSEs are minimal. Generally, the biases at different WSs are negative, confirming the underestimation of WS by all three altimeters. As the direction of sea surface microscale waves that interact with the radar microwaves varies with wind direction, the WS differences between the three altimeters and the buoys are also analyzed as a function of buoy-derived wind direction. The results indicated no obvious correlation with wind direction (results not shown here).
The WS differences between the three altimeters and the buoys in different months were also analyzed (Figure 5). The average monthly WSs of the collocated data are also shown in Figure 5. The dotted straight lines in Figure 5 represent the fitting trends. The negative biases of the three altimeters also prove that the altimeter-derived WSs are underestimates in comparison with the buoy WS data. The monthly biases of WS differences between Jason-3 and the buoys are all negative and the average is close to −0.5 m/s. Most RMSEs of WS differences are in the range of 1.0–1.5 m/s and the average is close to 1.3 m/s. The RMSEs of November and December of 2018 are larger than in other months. There are large WS differences of collocated data of 2–3 buoys close to the Alaska coast in winter. The monthly RMSEs and biases have slight decreasing trends, indicating that the accuracy of the Jason-3 altimeter WS is stable and that is improved slightly over time. Over a period of approximately one year, the variations of the monthly biases of WS differences between Jason-3 and the buoys reaches a maximum (minimum) in June/July (December/January). Assessing the reason for this seasonal oscillation, the average monthly WS of the collocated data shows that the variations of WSs have period of one year (shown in Figure 5). This is related to the seasonal variation of WS differences. Larger WSs are related to larger differences. The monthly biases of WS differences between Sentinel-3A and the buoys are mostly negative and the average is close to −0.2 m/s. Most of the monthly RMSEs of the differences fluctuate around 1 m/s, showing that the accuracy of WS derived by Sentinel-3A is better than from Jason-3. The lack of trend in the variations of the biases and RMSEs indicates that the accuracy of Sentinel-3A WS is temporally independent. Periodic variation of the monthly biases and RMSEs of WS differences similar to Jason-3 can also be observed. The monthly biases and RMSEs of Sentinel-3B WSs exhibit fluctuations and slight increasing or decreasing trends. This is because the period of Sentinel-3B WS data coverage is too short (i.e., <12 months) to allow the stability of Sentinel-3B WS data to be determined.
Differences in WS between the three altimeters and the buoys were also analyzed as a function of buoy-derived SWH; the RMSEs and biases of the WS differences are presented with 1-m intervals in Figure 6. Most of the SWHs are in the range of 1–4 m, and the biases and RMSEs of WS differences between the three altimeters and the buoys increase with increasing SWH. The variations associated with Jason-3 are larger than associated with Sentinel-3A/3B, indicating that the accuracy of Jason-3 WS is more sensitive to SWH than that of Sentinel-3A/3B WS.

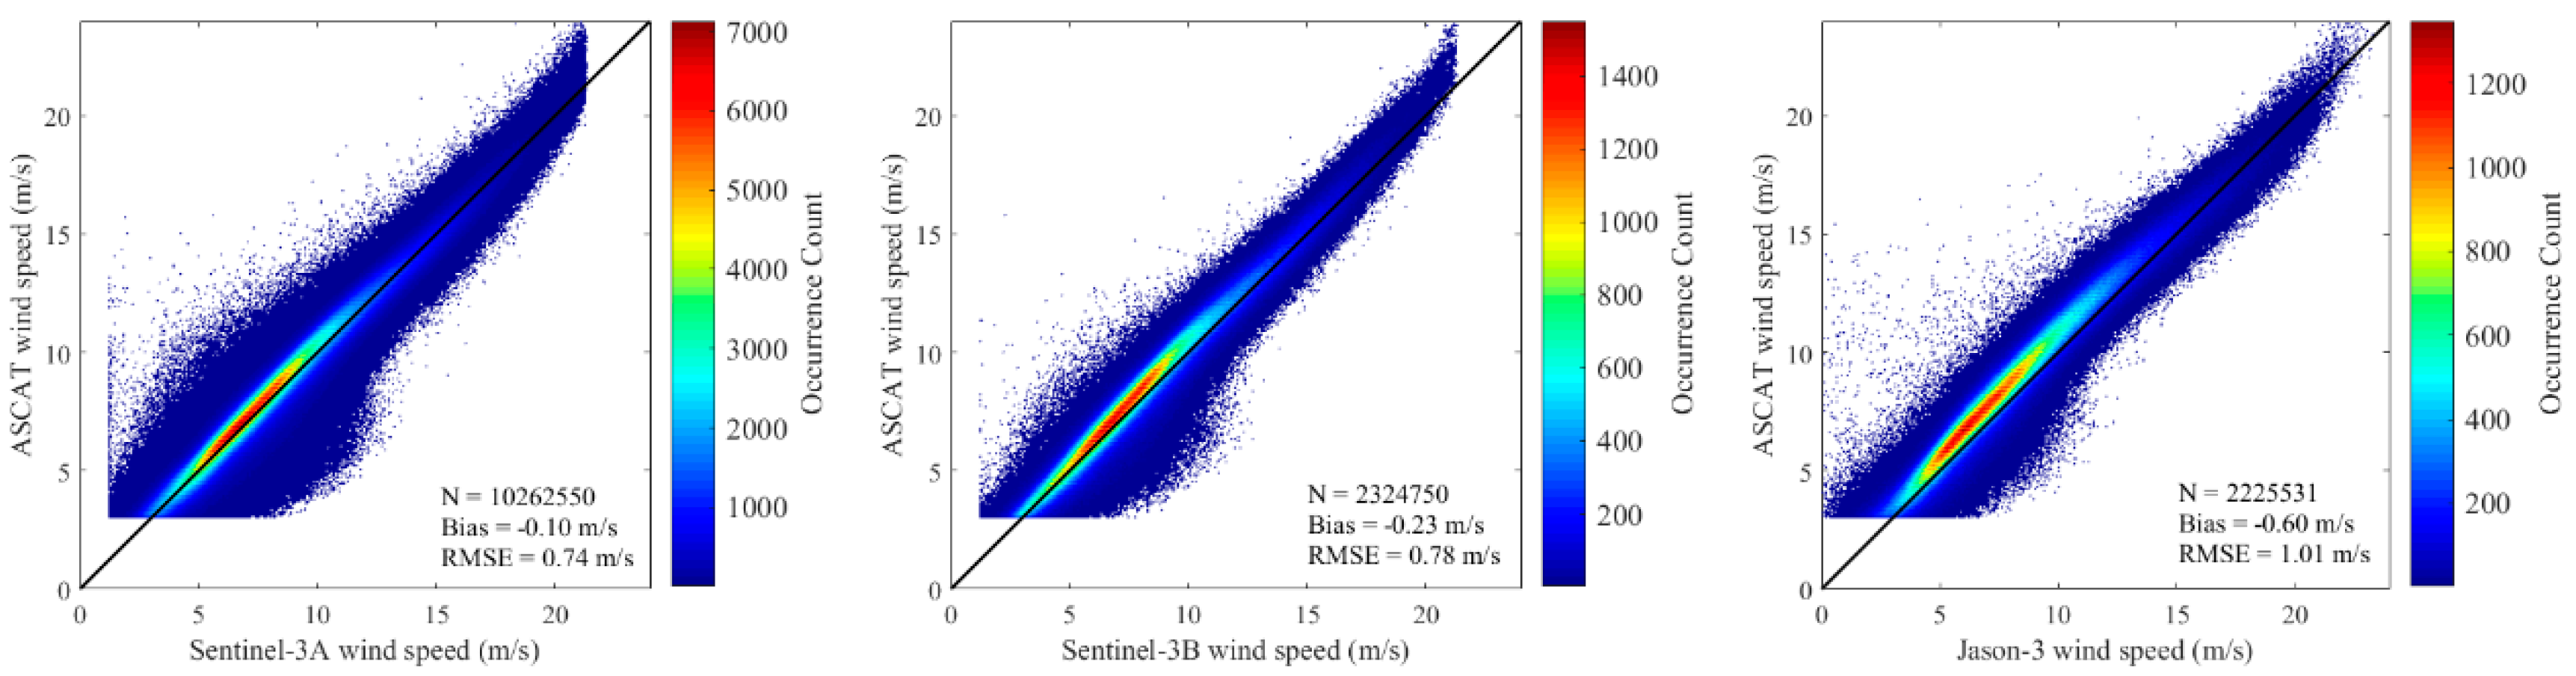
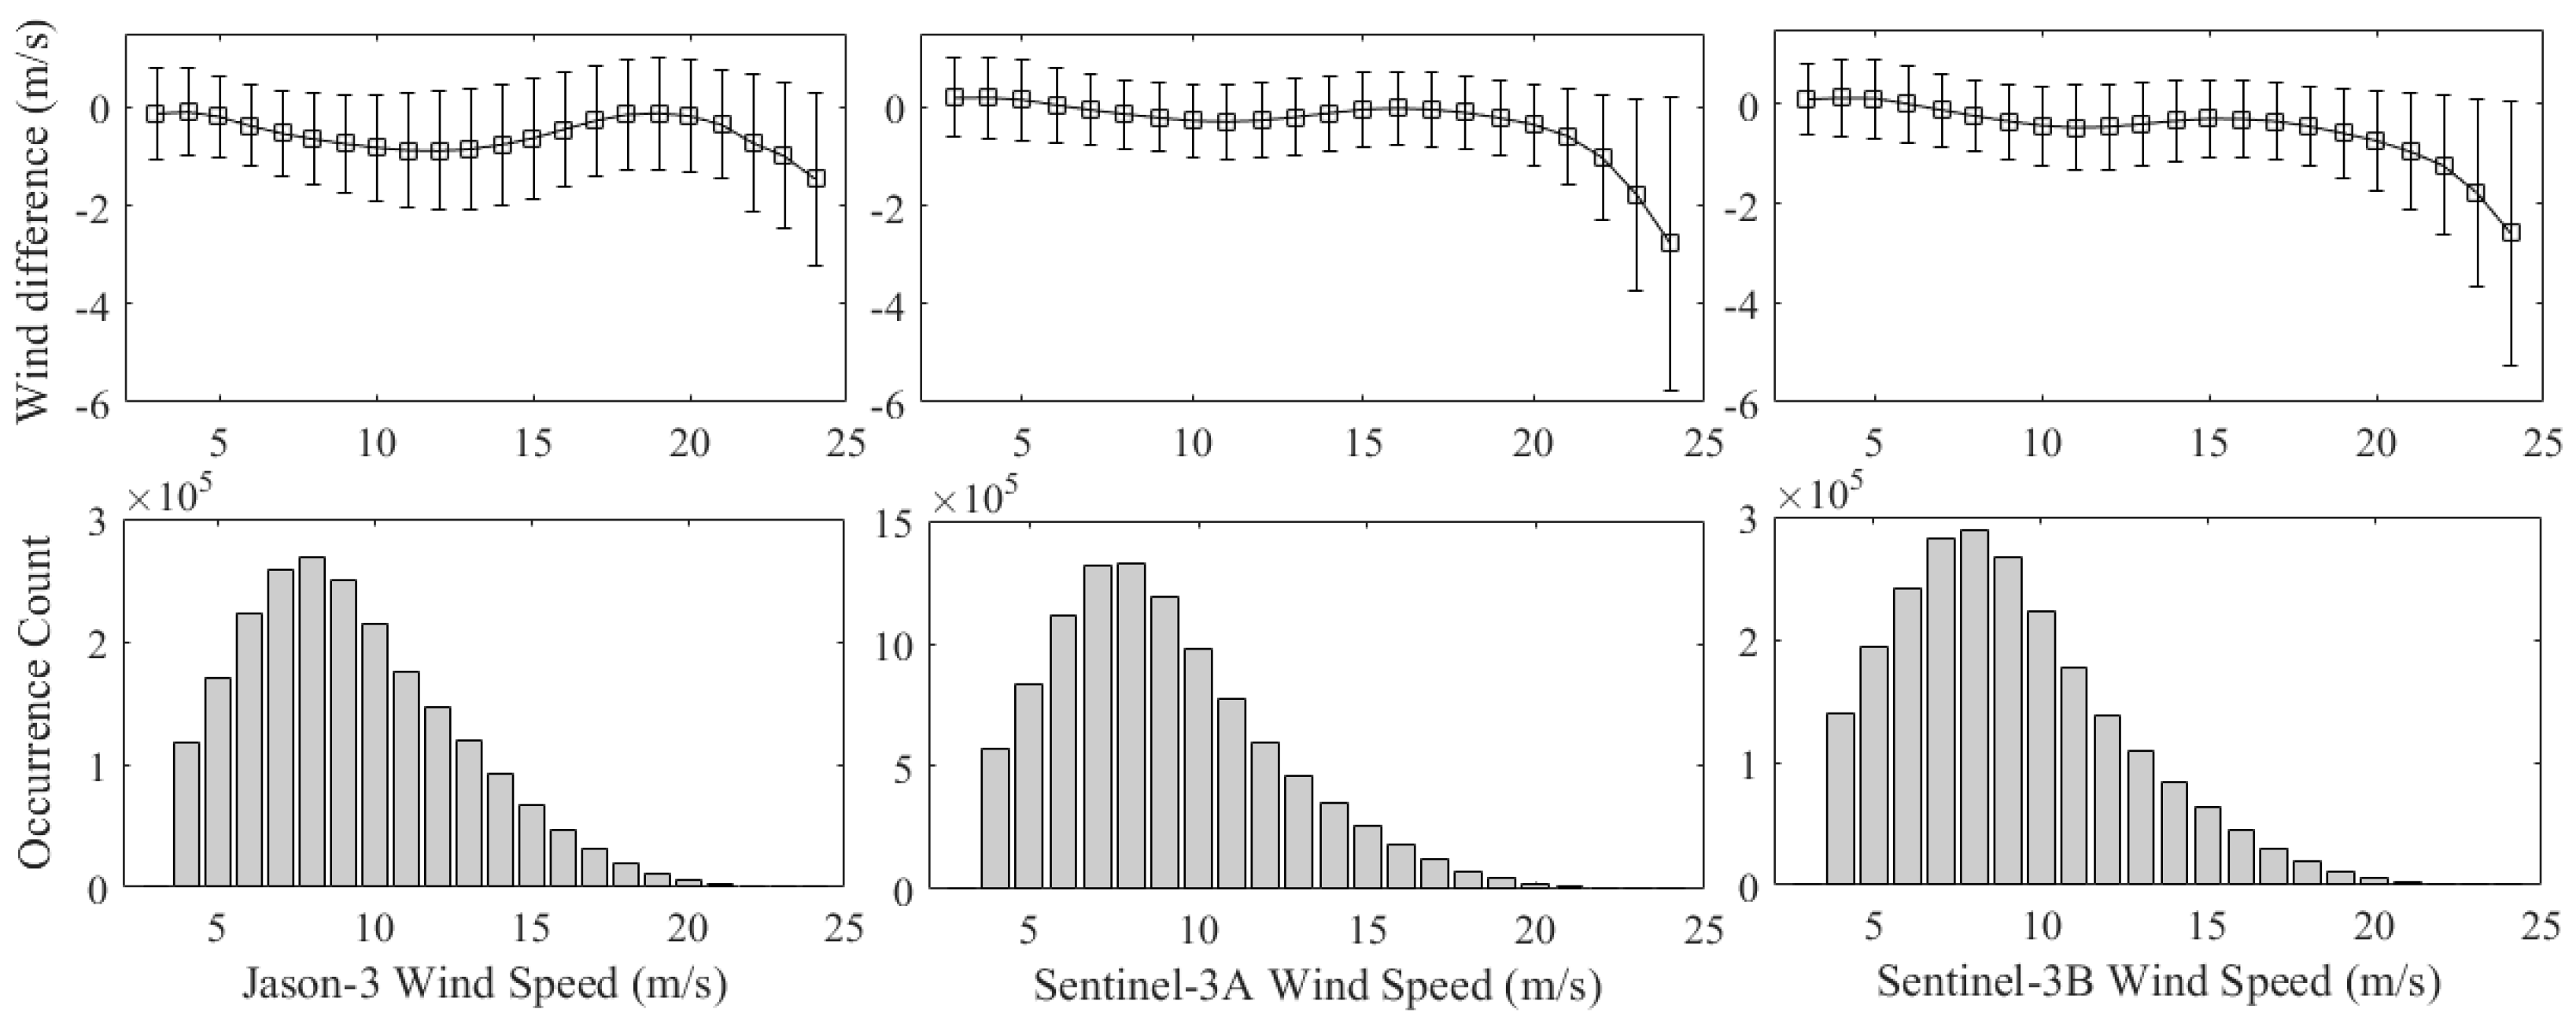
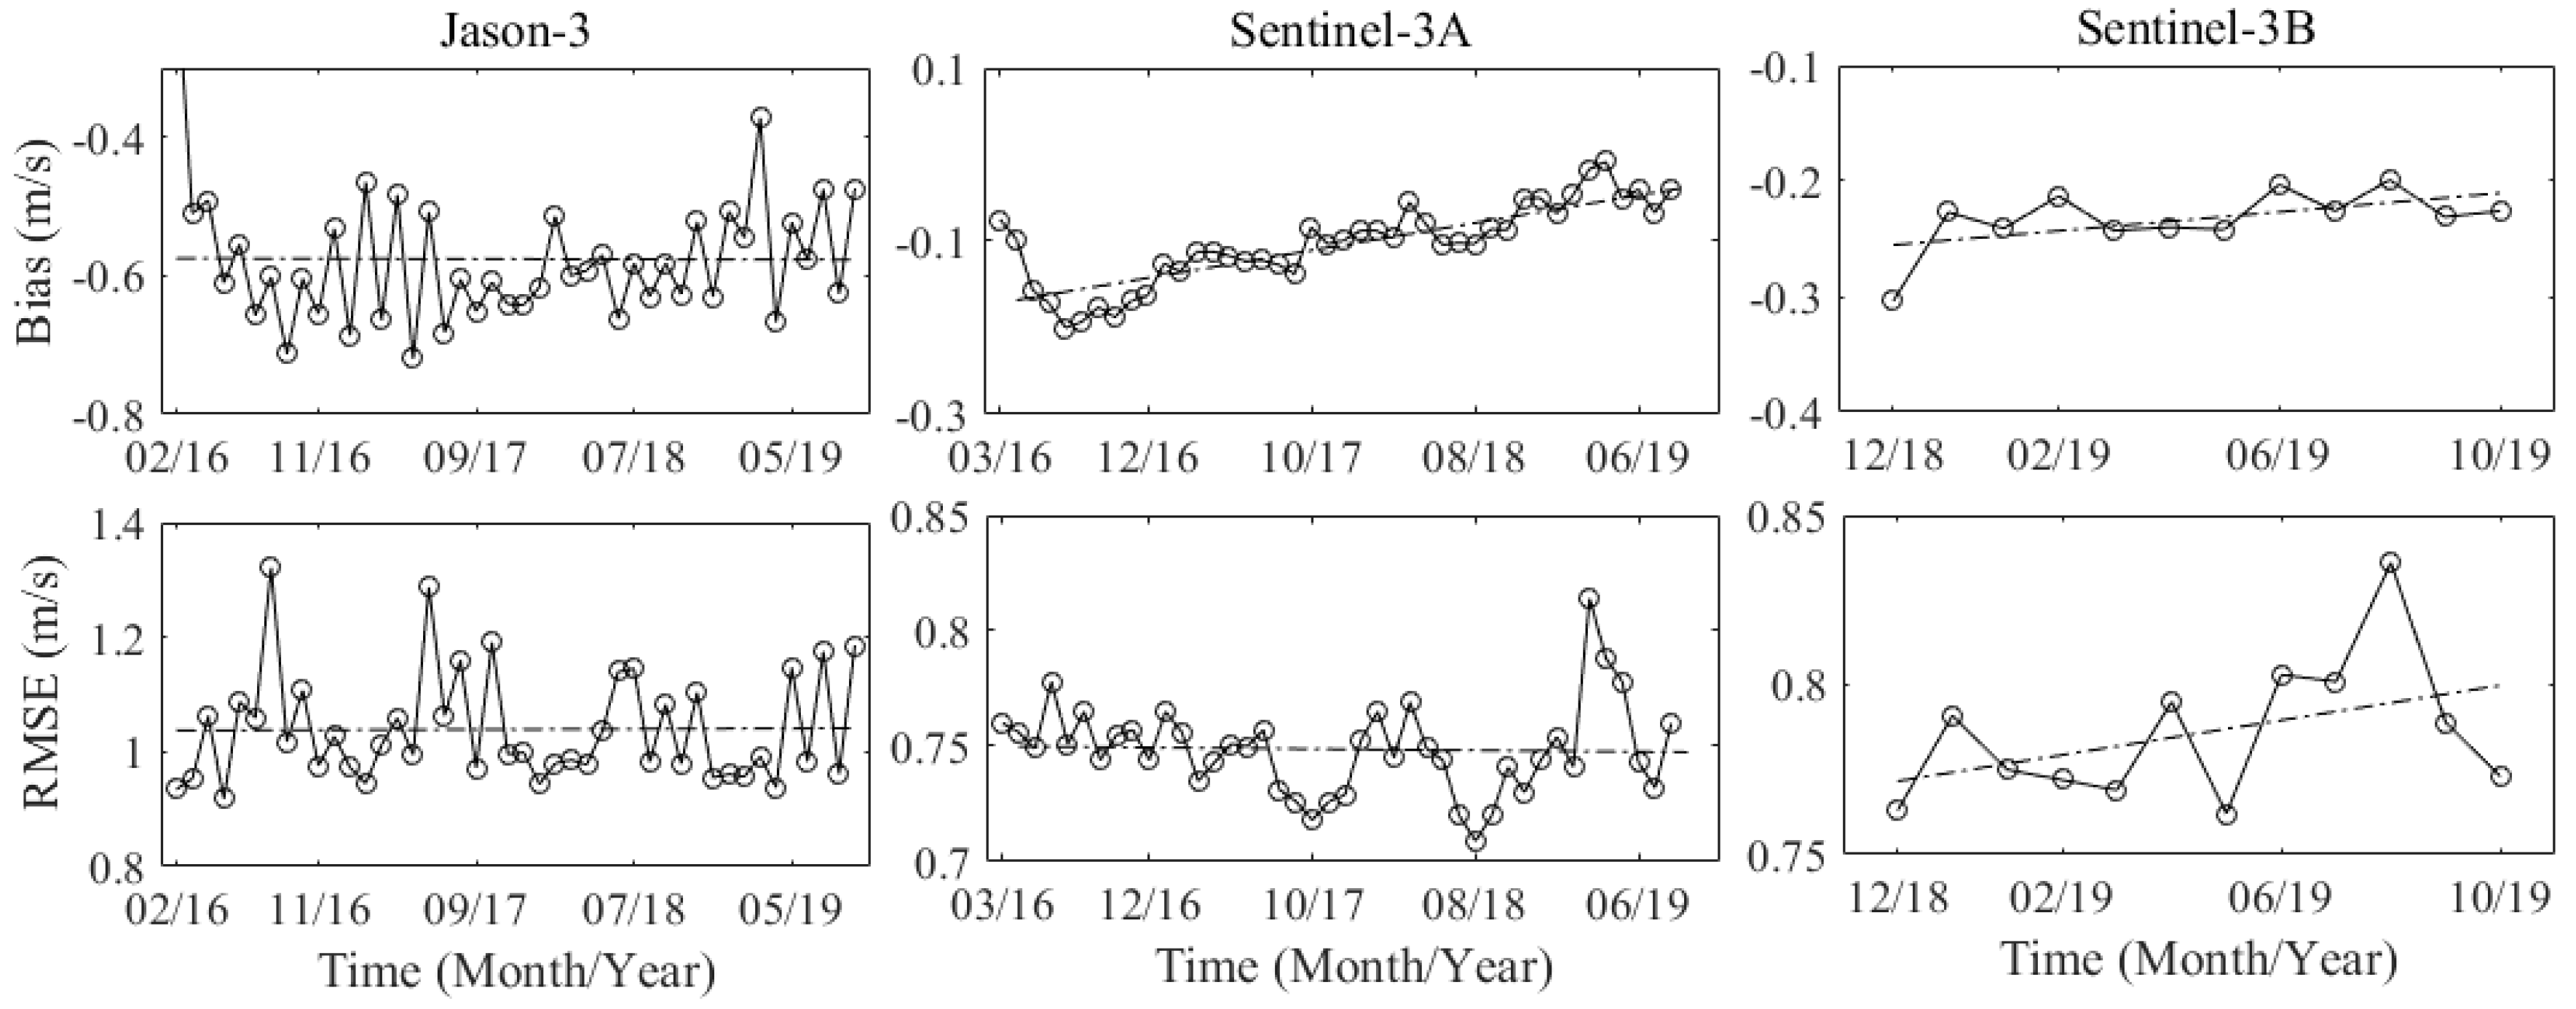
3.2. Wind Speed Validation by ASCAT Wind Data

Validation of the Sentinel-3A/3B and Jason-3 altimeter WSs against moored buoys data was limited by the locations of the buoys and the extent of the period of data coverage. To validate WS derived by the Sentinel-3A/3B and Jason-3 altimeters over the global ocean without in situ measurements, ASCAT wind data from the MetOp-A and MetOp-B satellites with proven reliable accuracy were used. WS data from the three altimeters and ASCAT were collocated using the method mentioned in Section 2.2. The large spatial coverage of ASCAT meant that large amounts of data were available for this process. Scatterplots of comparisons of the collocated data are presented in Figure 7. The negative biases mean that the WSs of all three altimeters are generally lower in comparison with ASCAT. This is consistent with the underestimation of WS by the three altimeters in comparison with the buoy data. The WS differences between the Jason-3 altimeter and ASCAT are larger than between the Sentinel-3A/3B altimeters and ASCAT. However, the Jason-3 WSs at speeds of <15 m/s are more consistent with ASCAT than are the Sentinel-3A/3B WSs. When the speed exceeds 15 m/s, the WSs derived by the Jason-3 altimeter are closer to ASCAT, whereas the Sentinel-3A/3B altimeters begin to underestimate WS in comparison with ASCAT.
The WS differences between the three altimeters and ASCAT at different speeds were also analyzed; the RMSEs and biases of the WS differences are presented at intervals of 1 m/s in Figure 8. It can be seen that the total errors of WS differences between the three altimeters and ASCAT are stable at low and medium speeds and increase when WS is >15 m/s. The negative biases of the three altimeters mean that the WSs of the altimeters are lower in comparison with ASCAT. This is consistent with the underestimation of the altimeters in comparison with the buoy wind data. The RMSEs of the three altimeters at WSs of <15 m/s are stable, which means that the accuracy of the WSs derived by the three altimeters are consistent at low and medium speeds. As WS increases, the biases and RMSEs increase rapidly, indicating deceasing accuracy of the altimeter-derived WSs. The accuracy of the Jason-3 altimeter WS decreases slightly more slowly than that of the Sentinl-3A/3B altimeters, proving that the Jason-3 altimeter WS is better in comparison with that of the Sentinel-3A/3B altimeters at high speeds.
The WS differences between the three altimeters and ASCAT in different months were analyzed (Figure 9). The dotted straight lines in Figure 9 represent the fitting trends. Generally, the trend of each of the three altimeters is close to that of the comparison with the moored buoy data. The monthly RMSEs and biases of WS derived by Jason-3 are stable and have average values of 1.05 m/s and −0.6 m/s, respectively, with no obvious trend or periodicity. The monthly biases of the Sentinel-3A WS decrease with time and the monthly RMSEs have a slight downward trend. The monthly RMSEs and biases of the Sentinel-3B WS are worse in comparison with Sentinel-3A and have sight fluctuation. Overall, the average values of the monthly RMSEs and biases are no greater than 1.1 m/s and −0.5 m/s, respectively. These findings indicate consistency in the WSs derived by the three altimeters and ASCAT, and show that the Sentinel-3A/3B and Jason-3 altimeters have reasonable accuracy in determining WS over the global ocean.

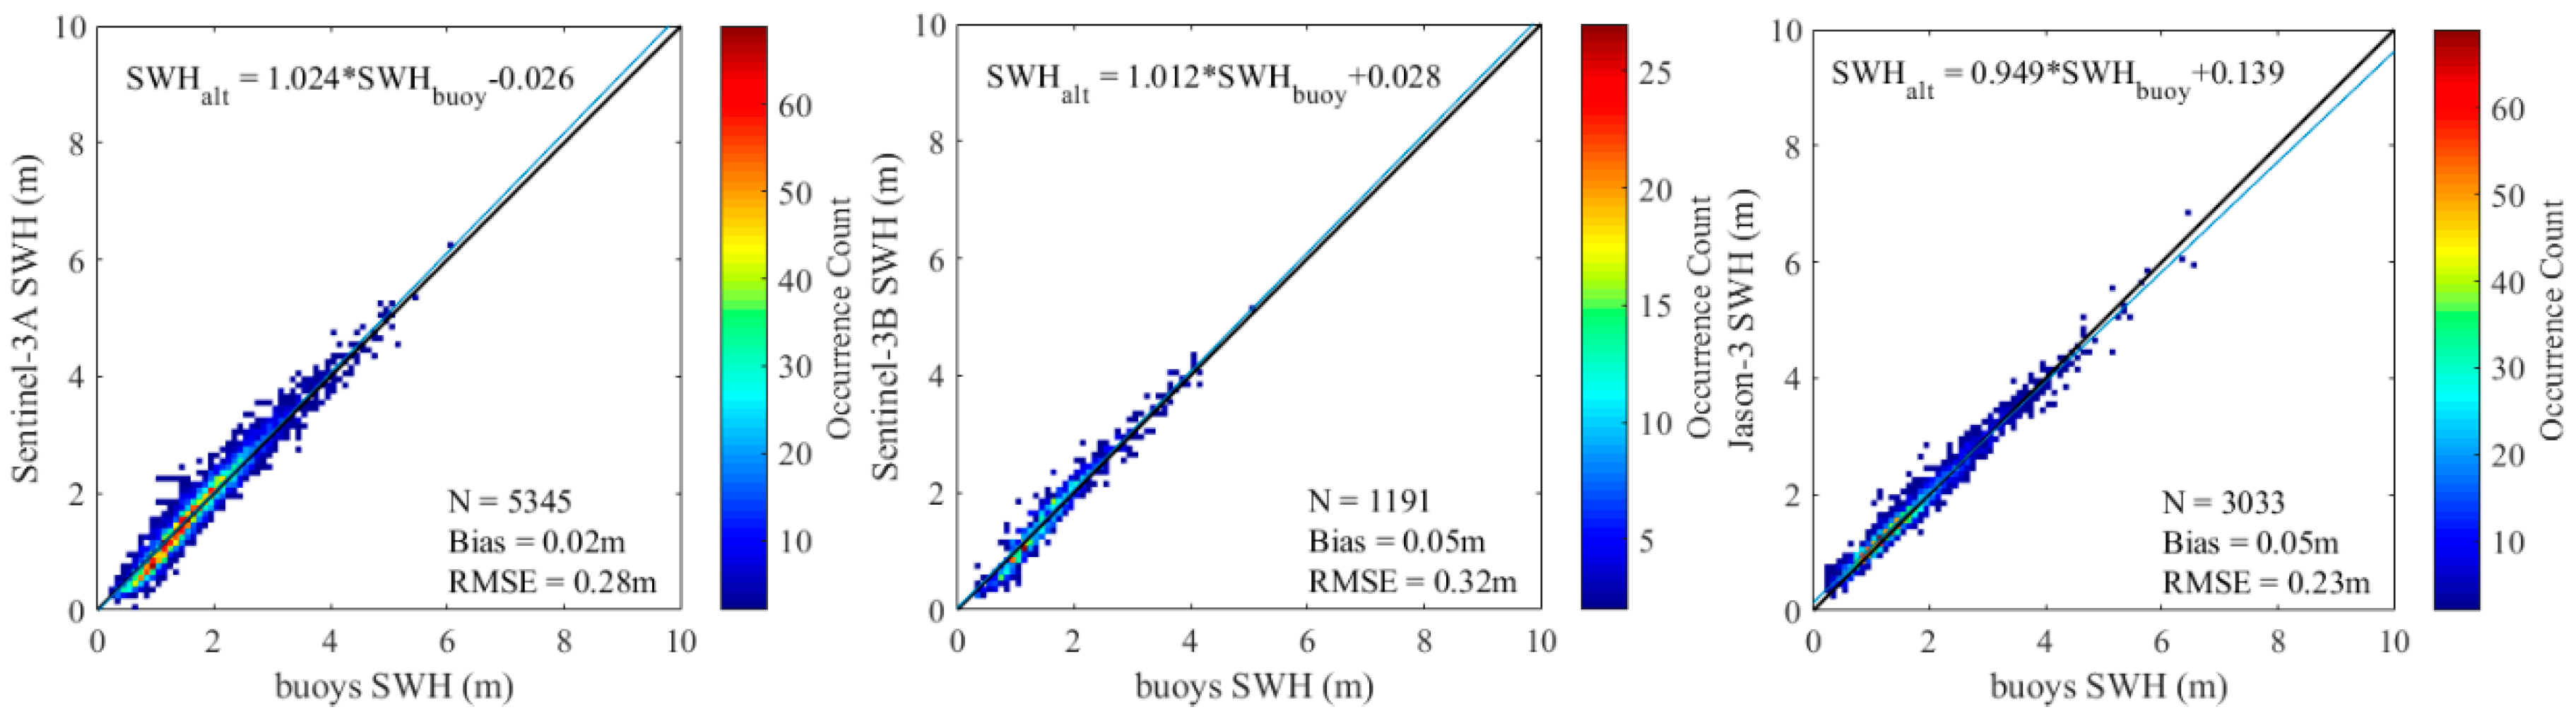
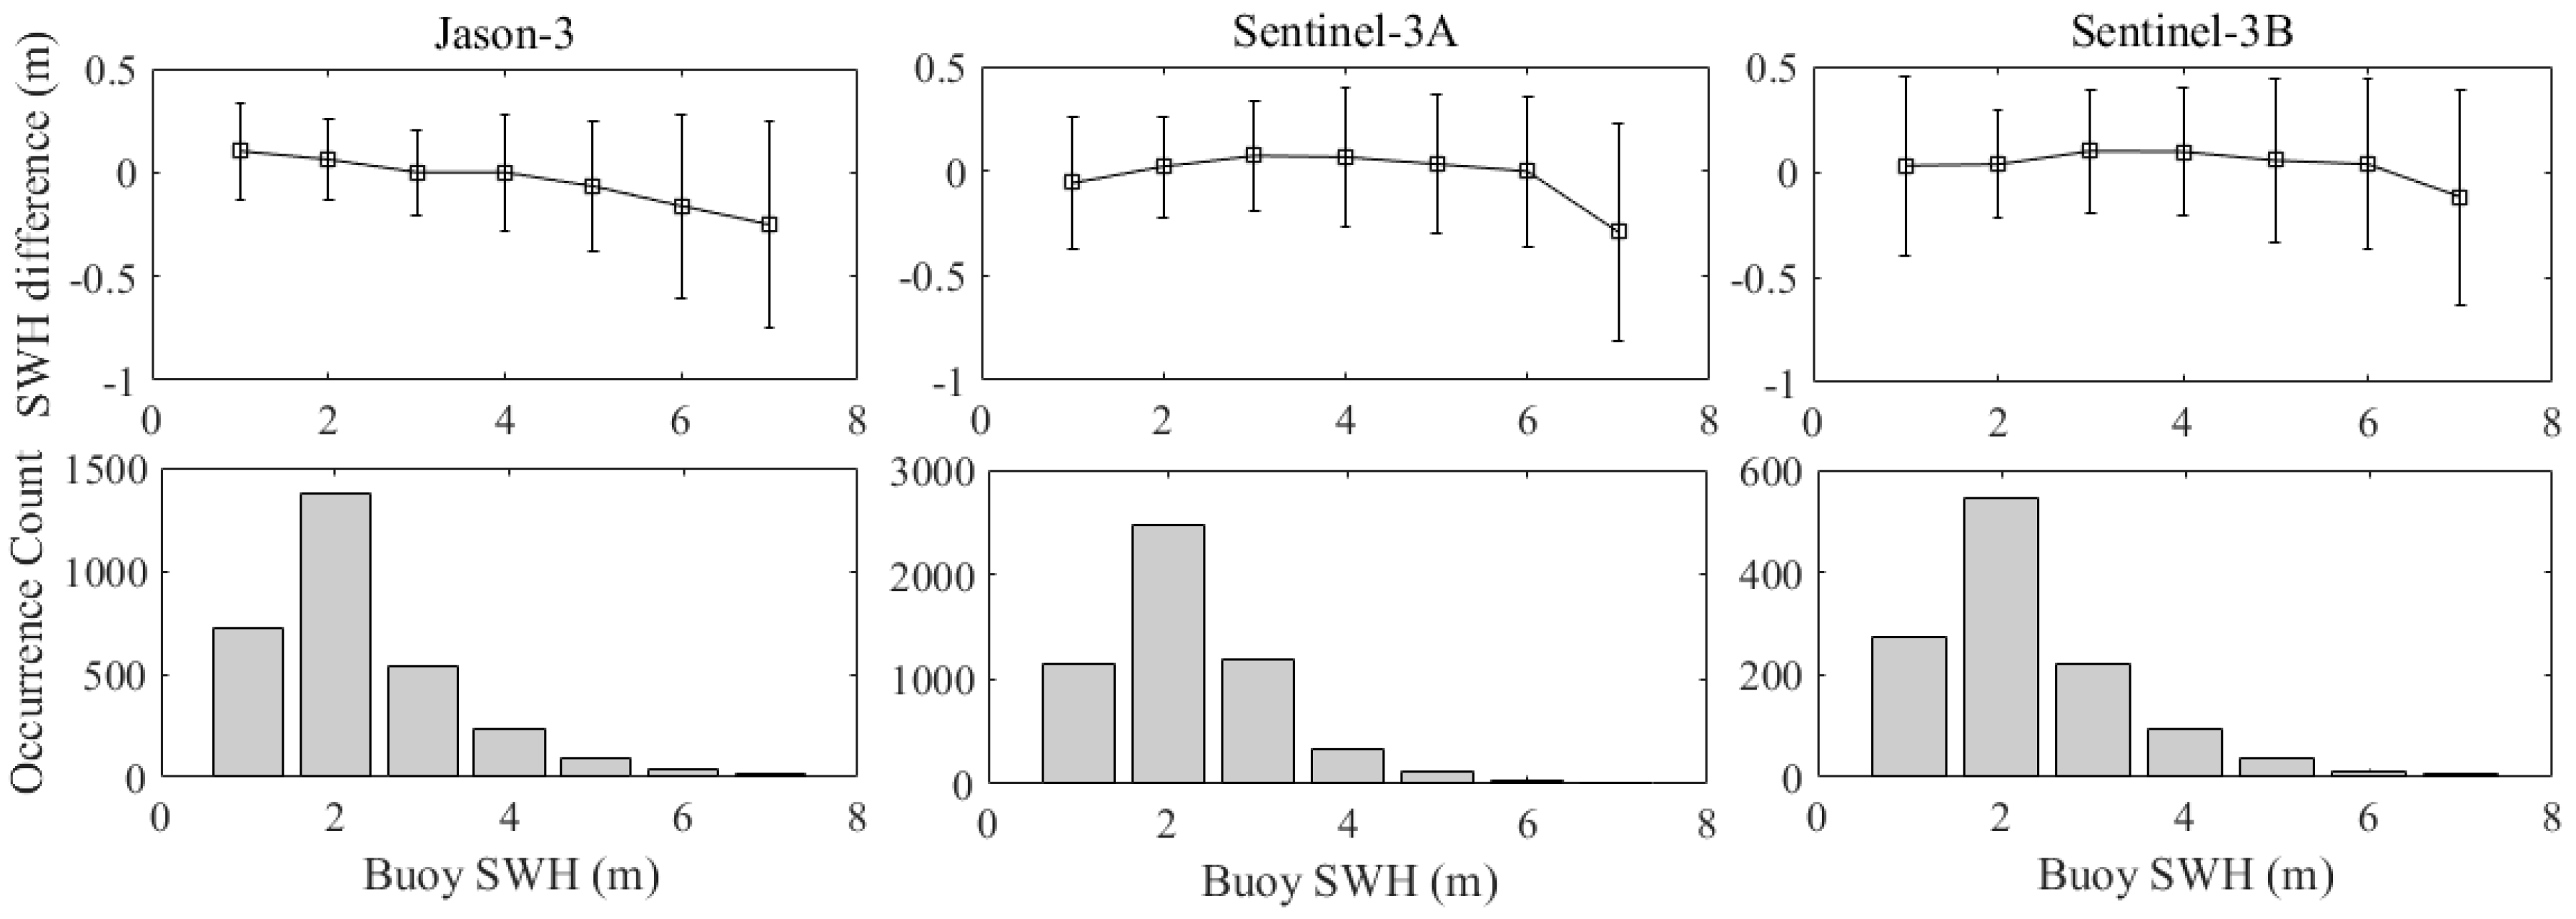
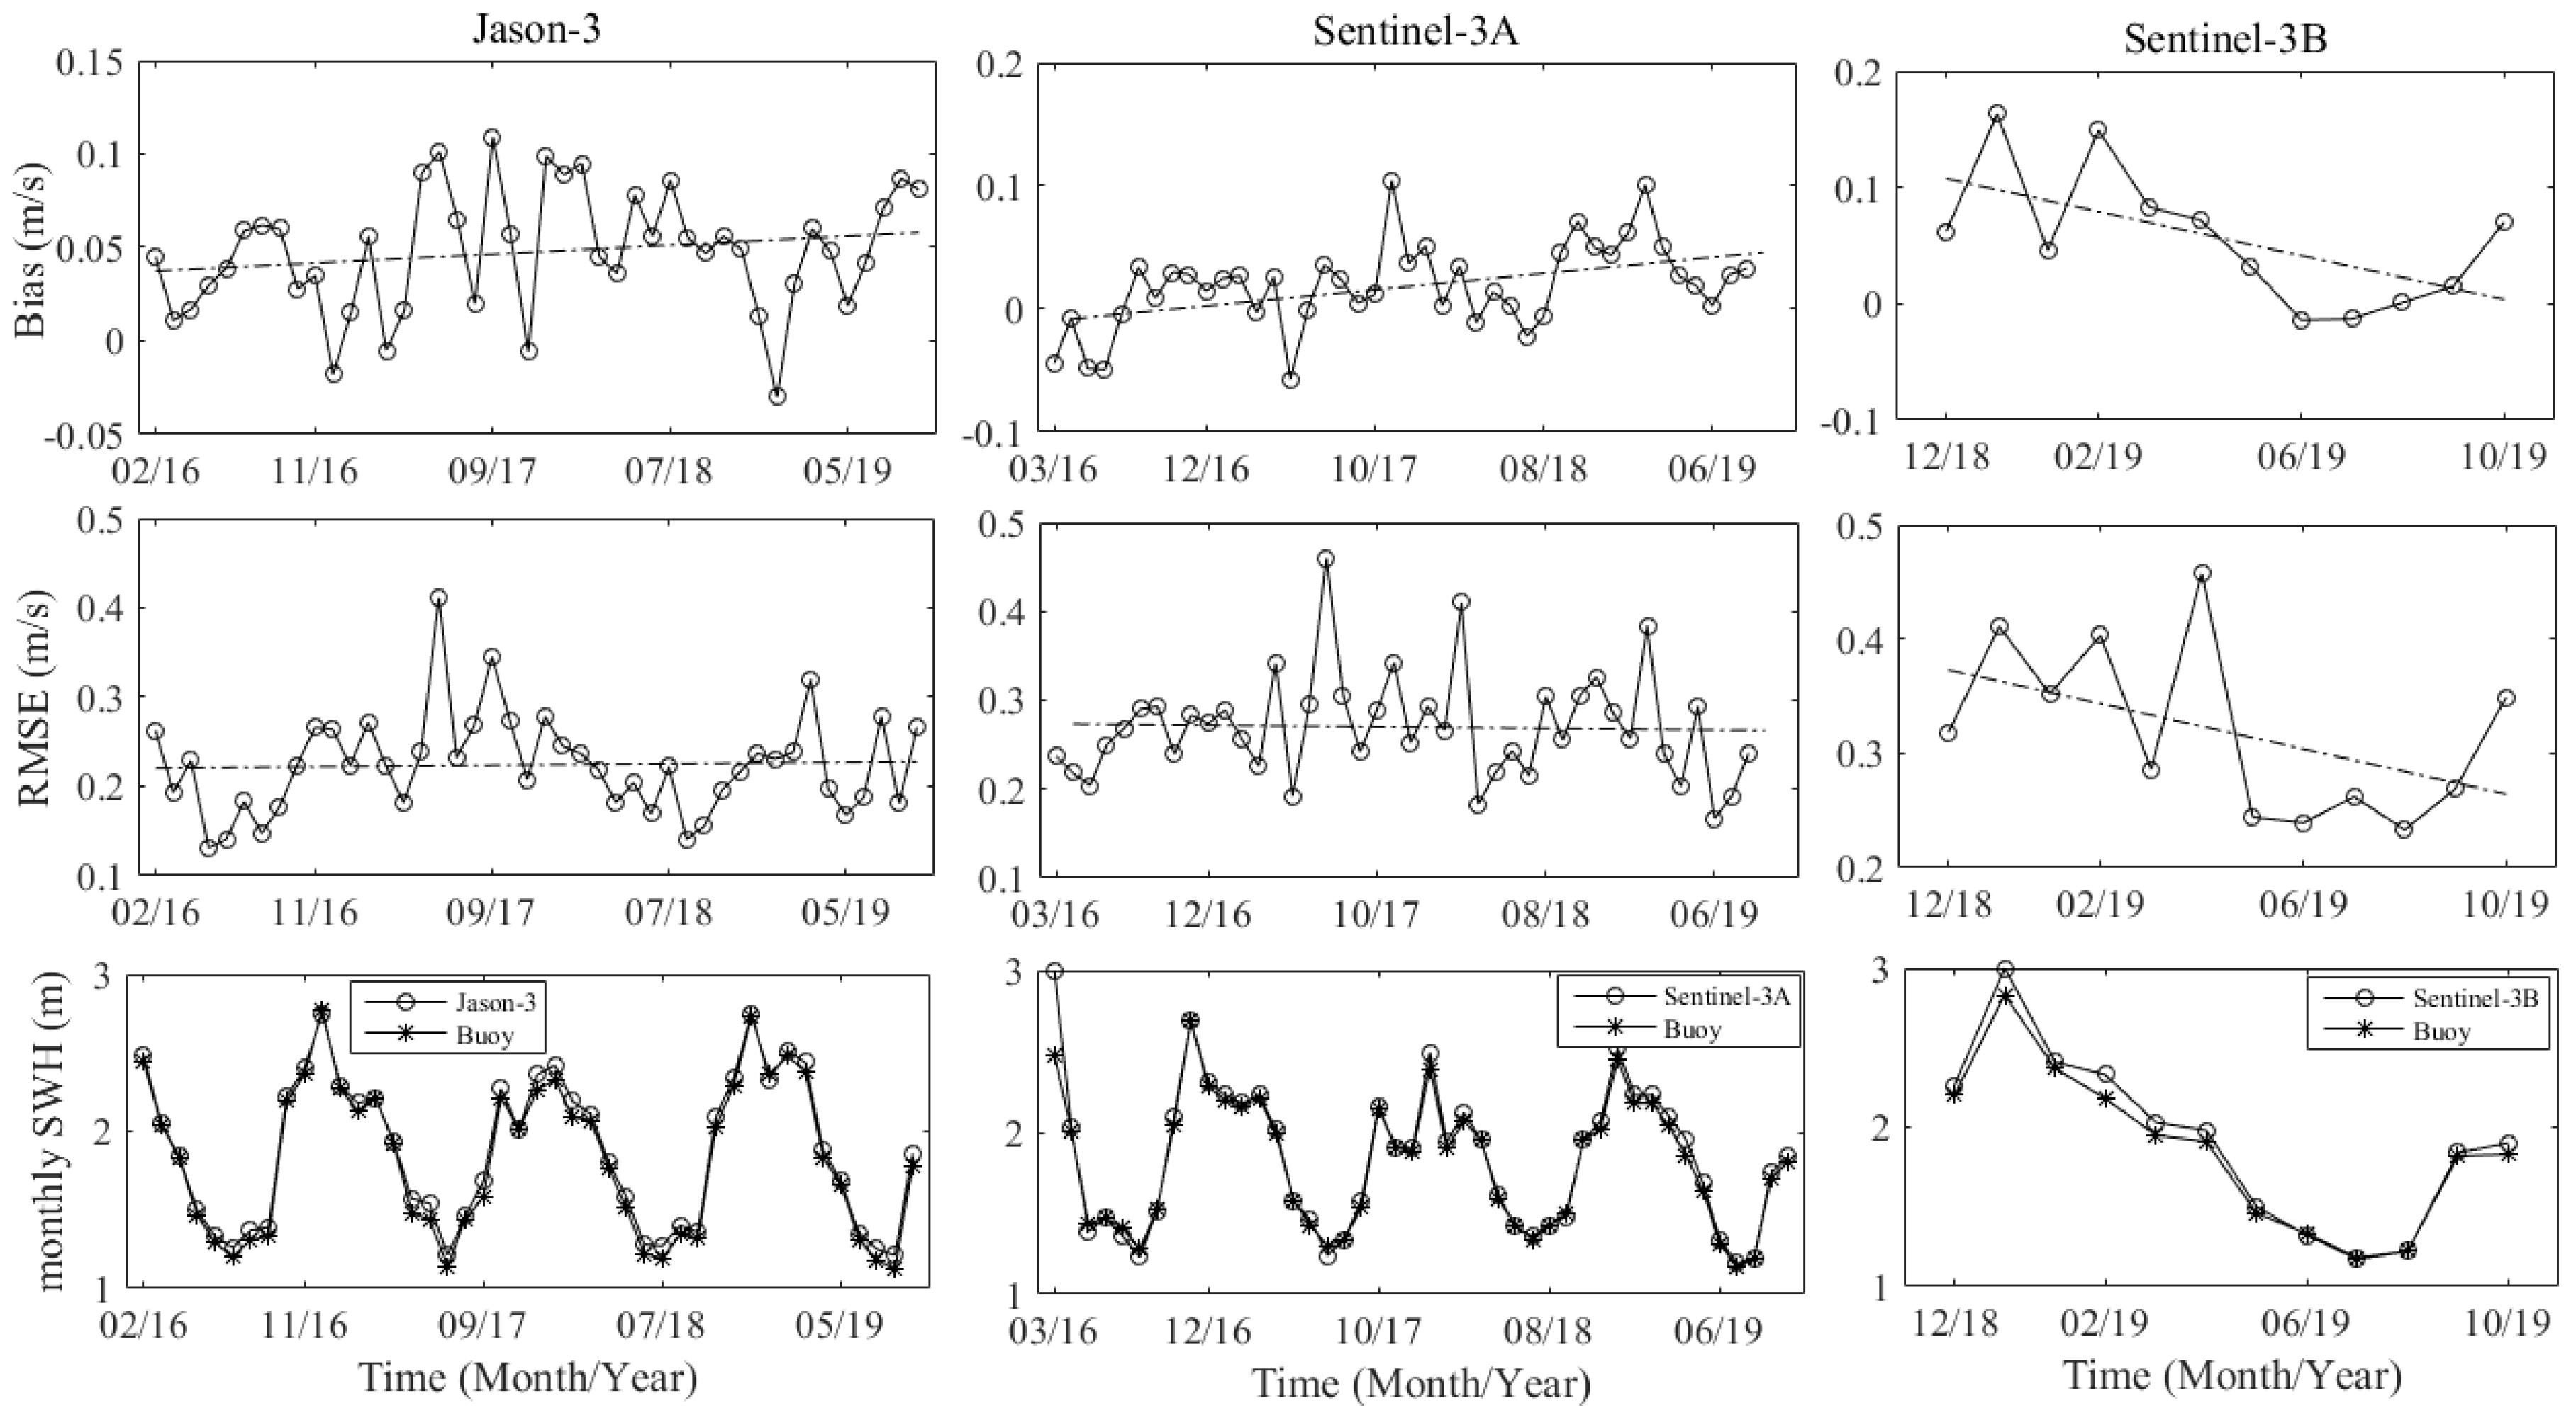
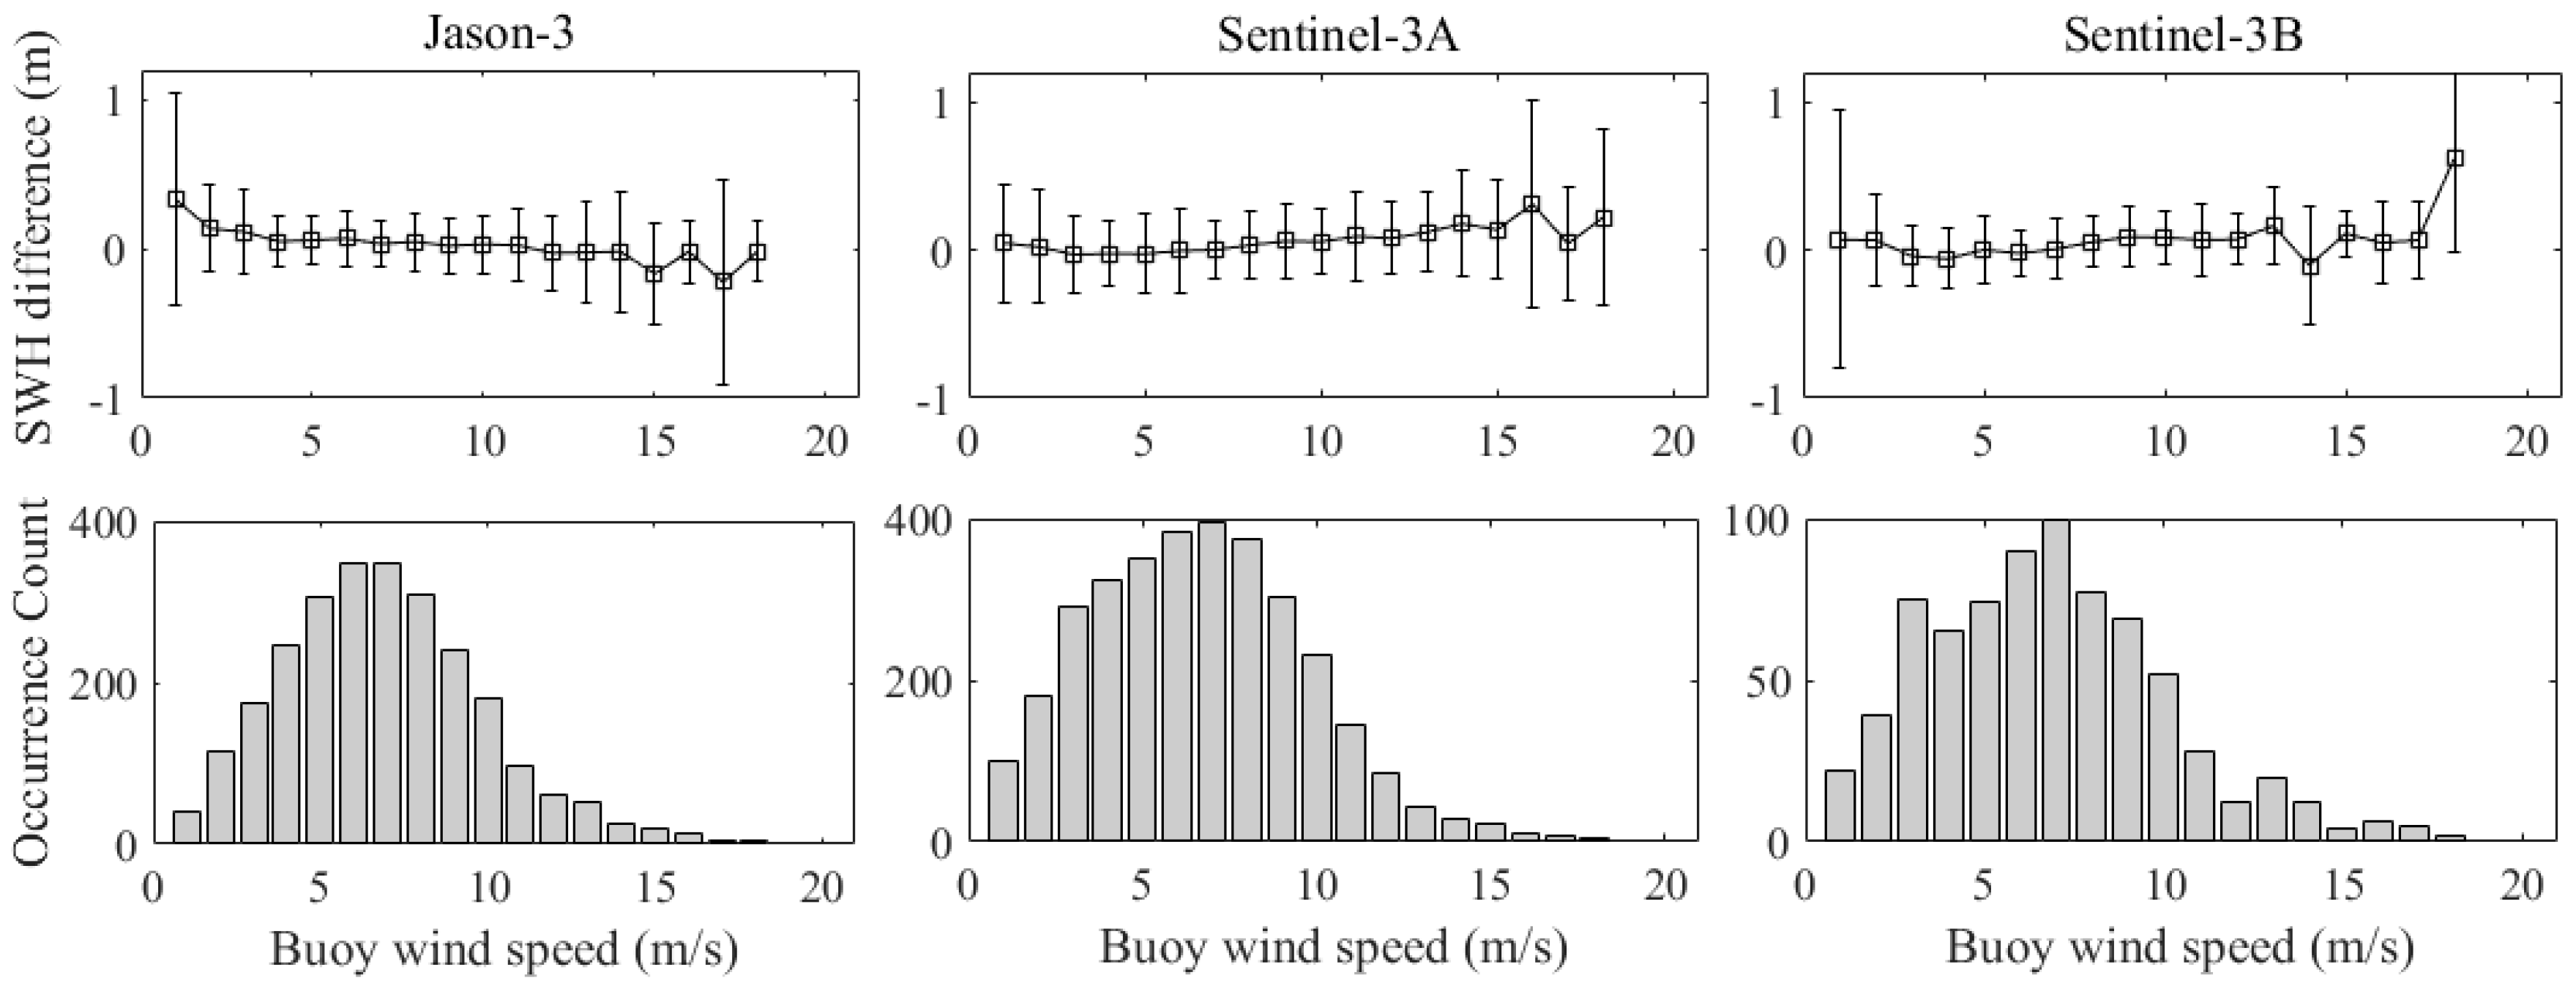
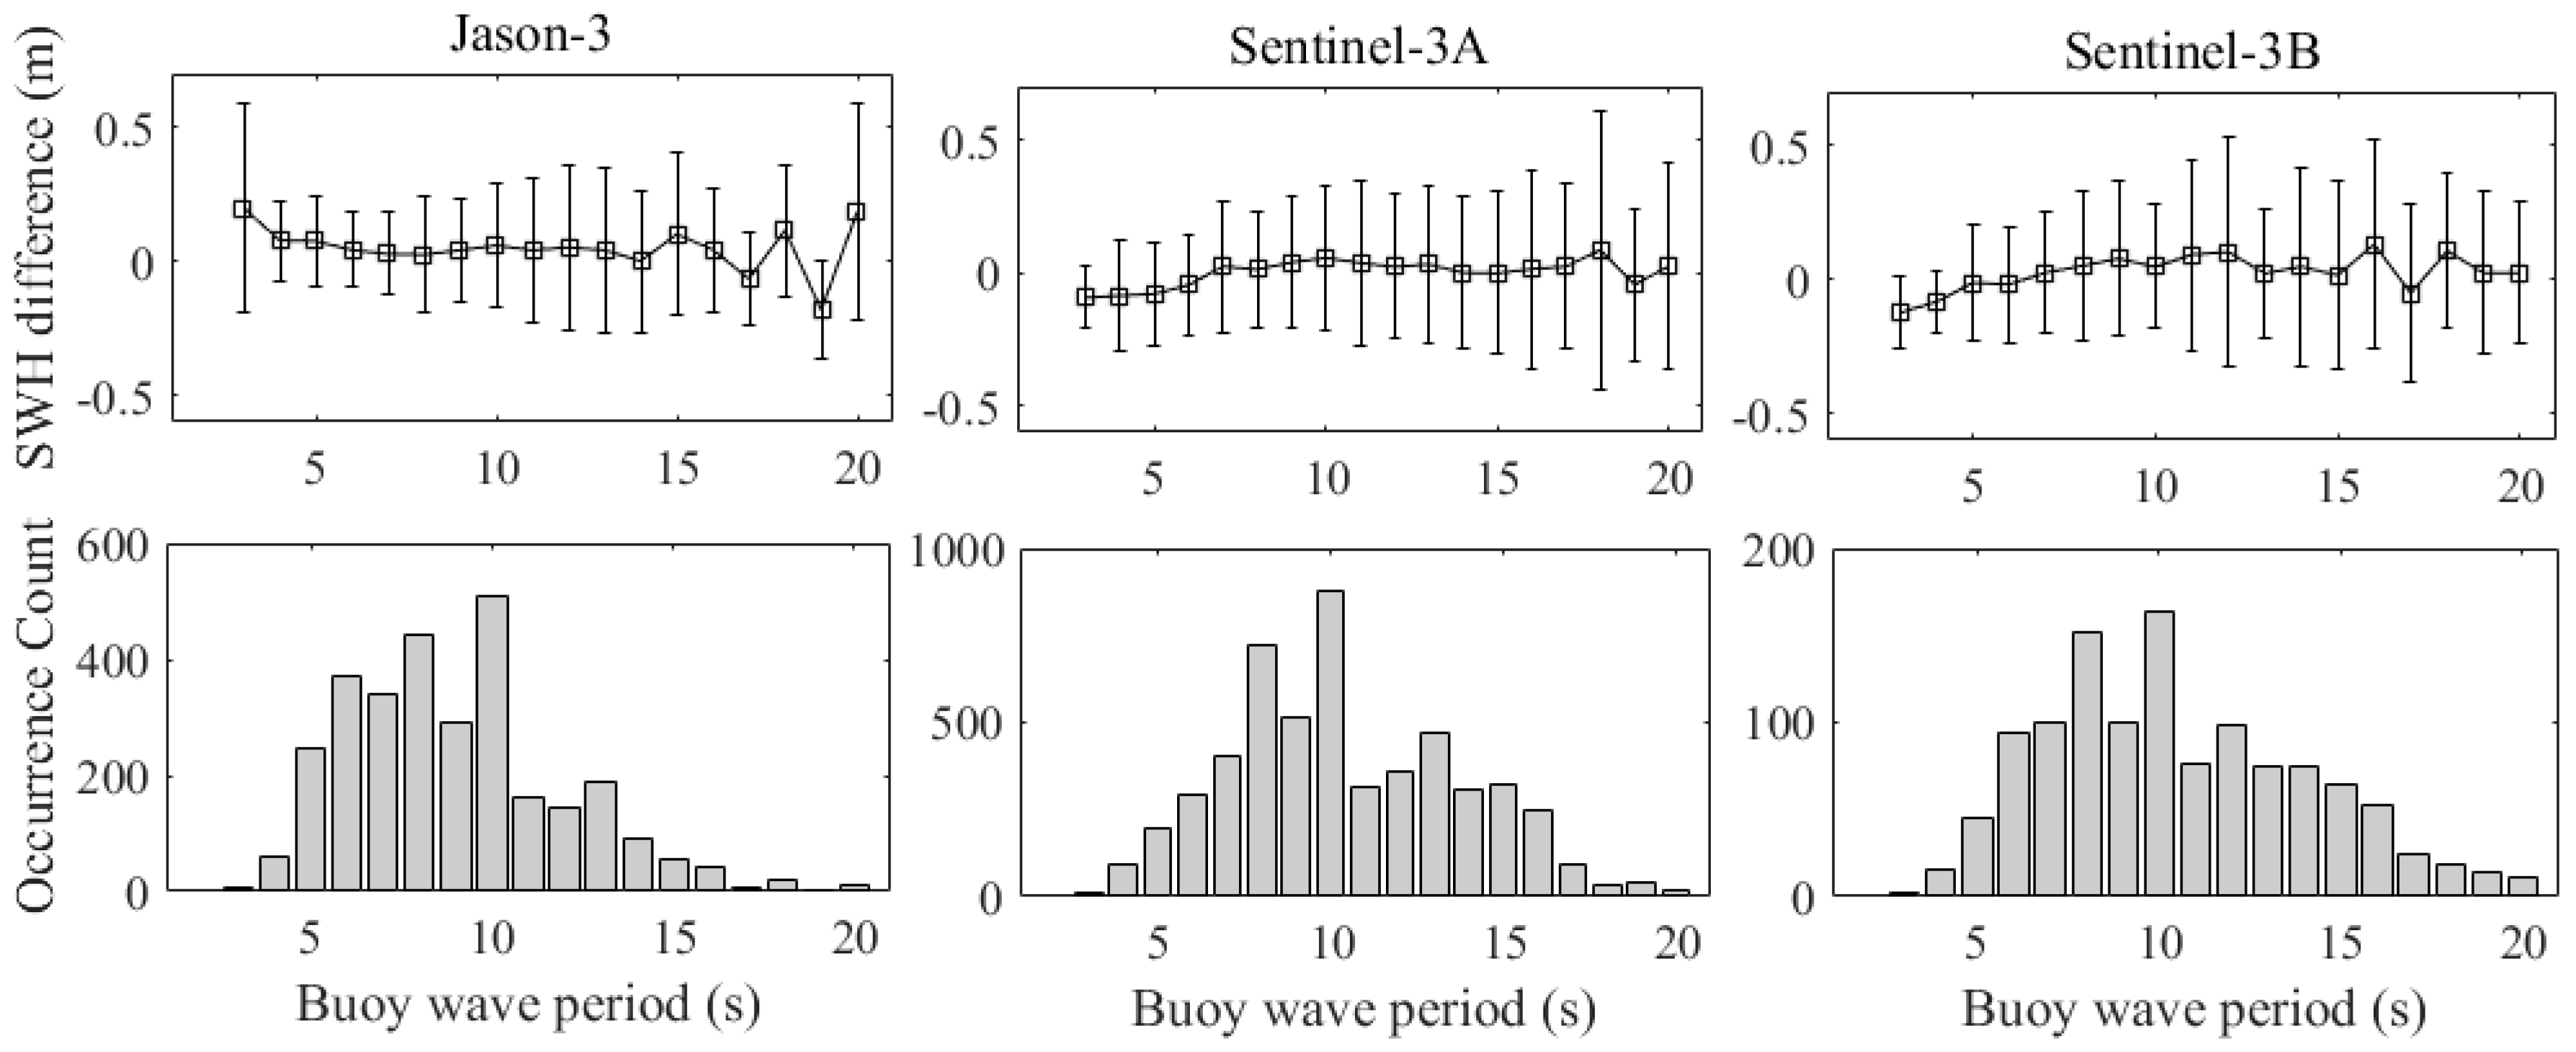
3.3. Significant Wave Height Validation Using National Data Buoy Center (NDBC) Buoy Data

The SWH data of Sentinel-3A/3B and Jason-3 altimeters were compared against the SWH data derived from NDBC buoys using the matching criteria and the statistical analysis described in Section 2.2. The statistical parameters (i.e., RMSE, Bias, R, and SI) of SWH differences between the Sentinel-3A/3B and Jason-3 altimeters and the NDBC buoys were calculated (Table 4). Scatterplots of the SWH comparisons are shown in Figure 10. It can be seen from Table 4 and Figure 10 that the SWHs of three altimeters are consistent with the NDBC buoy data, and that the accuracy of the SWH of each of the three altimeters meets the mission requirements. The positive biases (altimeter SWH minus buoy SWH) show that the SWHs of the three altimeters are all slightly larger than those derived from the NDBC buoys. The R and SI values reflect the reasonable performance of the SWH measurements by the three altimeters. Overall, the accuracy of Jason-3 SWH is better than that of Sentinel-3A/3B.
The biases and RMSEs of the SWH errors were analyzed as a function of buoy SWH with 1 m intervals (Figure 11). Most matched wave heights between the altimeters and the buoys are <4 m. The biases and RMSEs of Jason-3 SWH at different SWHs increase slightly as SWH increases. The biases and RMSEs of Jason-3 SWH are more stable in comparison with Sentinel-3A/3B, except for a slight increase when the SWH is no greater than 4 m. When SWH is >4 m, the biases and RMSEs of Sentienl-3A SWH increase considerably and those of Sentinel-3B begin to increase. Generally, the accuracy of Jason-3 SWHs is better than that of Sentinel-3A/3B at low SWH (≤4 m), but the accuracy of Sentinel-3A/3B SWHs is better than that of Jason-3 at high SWHs (>4 m).
To study the variations of the accuracy of the SWH data of each of the three altimeters, the SWH differences between the three altimeters and buoys in different months were analyzed (Figure 12). The dotted straight lines represent the fitting trends. Most monthly biases of SWH differences between the Jason-3 altimeter and the buoys are positive, meaning that the Jason-3 SWH data are slight overestimates in comparison with the buoy data. The monthly RMSEs of Jason-3 SWH differences are stable, indicating that the performance of SWH measurement by the Jason-3 altimeter is stable. The trends of biases and RMSEs of Sentinel-3A are similar to Jason-3, but the monthly bias is close to 0 m and the monthly RMSEs are larger in comparison with Jason-3. The monthly biases and RMSEs of the SWH differences of Sentinel-3B have decreasing trends, meaning that the accuracy of Sentinel-3B SWH has improved over time. Variations of the average monthly SWH of the collocated data have period of one year, as shown in Figure 12. The biases and RMSEs of the SWH differences between the Jason-3 and Sentinel-3A altimeters and the buoys have seasonal variation because large SWH is related to large differences for altimeter SWH data.
The SWH differences between the three altimeters and the buoys were analyzed as a function of buoy WS, and the RMSEs and biases of the SWH differences are presented at intervals of 1 m/s interval in Figure 13. The RMSEs of the SWH differences at low buoy WSs (≤4 m/s) increase with the decrease of buoy WS, whereas the RMSEs of the SWH differences at medium and high buoy WSs (5–15 m/s) increase with increasing buoy WS. Owing to the lack of sufficient collocated data, the RMSEs at buoy WSs of >15 m/s are unclear. The increase of RMSE for Jason-3 is faster than that for Sentinel-3A/3B. Overall, the SWH accuracy of the altimeters is low at low WSs and it decreases as WS increases to medium and high wind speeds. The SWH accuracy of Jason-3 is lower than that of Sentinel-3A/3B at high WSs.
The SWH differences between the three altimeters and the buoys were analyzed as a function of buoy wave period, and the RMSEs and biases of the SWH differences are presented at 1 s intervals in Figure 14. It can be seen that the biases of the SWH differences at different buoy wave periods for the three altimeters increase with increasing wave period. The RMSEs of SWH differences for Jason-3 are all lower in comparison with those associated with Sentinel-3A/3B for long wave periods. This means that the accuracy of Jason-3 SWH is better than that of Sentinel-3A/3B for long-period ocean waves. It is known that wavelength increases with the wave period. Therefore, the accuracy of Jason-3 SWH data is better than that of Sentienl-3A/3B for long ocean waves. This is related to the difference in the working principle between Sentinel-3A/3B (SAR altimeter) and Jason-3 (traditional altimeter), and the impact of long ocean waves on wave height retrievals for SAR altimetry has been proven [36].

4. Conclusions

The archived WS and SWH data of Sentinel-3A (1 March 2016 to 31 October 2019), Sentinel-3B (10 November 2018 to 31 October 2019) and Jason-3 (12 February 2016 to 18 September 2019) altimeters were validated comprehensively through comparisons against moored buoys and ASCAT data. WS data from more than 80 moored buoys and SWH data from more than 40 NDBC buoys were used to validate the WSs and SWHs derived by the Sentinel-3A/3B and Jason-3 altimeters within the spatial and temporal scales of 25 km and 30 min, respectively. In comparison with buoy data, the WSs derived by the Sentinel-3A/3B and Jason-3 altimeters were slight underestimates, especially for Jason-3. Analysis of WS differences of the three altimeters at different WSs indicated that the RMSEs and biases of WS increased slightly as the speed increased (at speeds of <12 m/s) and had slight increasing trends with a little fluctuation. Analysis of WS differences of the three altimeters in different months showed that the accuracy of Jason-3 WS improved slightly over time, while that of Sentinel-3A WS was stable and temporally independent. It also indicated that the accuracy of WS derived by the Sentinel-3A/3B altimeters was better than that of the Jason-3 altimeter. Analyses of WS differences between the three altimeters and the buoys as a function of buoy SWH showed that the biases and RMSEs of WS differences between the three altimeters and the buoys increased with increasing SWH, and that the errors of Jason-3 WS were larger in comparison with those associated with Sentinel-3A/3B. To validate WSs derived by the three altimeters over the global ocean without in situ measurements, the Sentinel-3A/3B and Jason-3 WSs were validated against MetOp-A/B ASCAT wind data with the spatial and temporal scales of 25 km and 30 min, respectively. Overall, the results showed that the WSs of the three altimeters were lower than the ASCAT-derived speeds. The WS differences between Jason-3 and ASCAT were larger than between Sentinel-3A/3B and ASCAT at low and medium speeds. In comparison with Sentinel-3A/3B, the Jason-3 WS was much closer to that of ASCAT when the speed was >15 m/s. Analysis of the WS differences between the three altimeters and ASCAT in different months showed that the accuracy of Jason-3 WS had no trend with time, while that of Sentinel-3A/3B WS had slight increase. The monthly RMSEs and biases of Jason-3 had slight decreasing trends.
Validation of SWHs derived by the Sentinel-3A, Sentinel-3B, and Jason-3 altimeters against NDBC buoy wave data showed that the accuracy of Jason-3 SWH was better than that of Sentinel-3A/3B. Analysis of SWH differences between the Sentinel-3A, Sentinel-3B, and Jason-3 altimeters and the buoys at different SWHs showed that the biases and RMSEs of the SWHs of the three altimeters increased when the SWH was >4 m. The accuracy of the SWH data of the three altimeters in different months was also analyzed. The results showed that the accuracy of the Sentienl-3A and Jason-3 SWHs were stable, while that of Sentinel-3B SWH improved with time. Analysis of SWH differences between the three altimeters and the buoys as a function of buoy WS showed that SWH accuracy of the altimeters was low for low WSs and decreased with the increasing WS for the medium and high WSs. Analysis of the SWH differences between the three altimeters and the buoys as a function of buoy wave period showed that the SWH accuracy of Jason-3 was better than that of Sentinel-3A/3B for long-period ocean waves.
Generally, the accuracies of WS and SWH derived by the Sentinel-3A/3B and Jason-3 altimeters satisfy their mission requirements. Overall, the WS derived by the Sentinel-3A/3B SRAL is better than that retrieved by the Jason-3 altimeter. Conversely, the SWH derived by the Jason-3 altimeter is better than that retrieved by the Sentinel-3A/3B SRAL, especially for ocean waves with a long wave period (long wavelength).

Author Contributions

J.Y. designed and performed the data processing and wrote the paper; J.Z. proposed the Project Support; Y.J., W.C. and C.F. participate in the discussions of results. All authors have read and agreed to the published version of the manuscript.

Funding

This research was funded by National Key R&D Program of China (grant number 2016YFC1401800 and 2016YFA0600102).

Acknowledgments

The authors would like to thank the EUMETSAT for the distribution of Sentinel-3A/3B, CNES AVISO for the distribution of the Jason-3 data, KNMI for the distribution of ASCAT data and the NOAA Pacific Marine Environmental Laboratory (PMEL) for NDBC, TAO, PIRATA, and RAMA buoy data.

Conflicts of Interest

The authors declare no conflict of interest.

References

  1. Nezhad, M.M.; Groppi, D.; Marzialetti, P.; Fusilli, L.; Laneve, G.; Cumo, F.; Garcia, D.A. Wind energy potential analysis using Sentinel-1 satellite: A review and a case study on Mediterranean islands. Renew. Sustain. Energy Rev. 2019, 109, 499–513. [Google Scholar] [CrossRef]
  2. Fu, L.L.; Chelton, D.B.; Zlotnicki, V. Satellite altimetry: Observing ocean variability from space. Oceanography 1988, 1, 4–11. [Google Scholar] [CrossRef]
  3. Fu, L.L.; Cazenave, A. Satellite Altimetry and Earth Sciences: A Handbook of Techniques and Applications; Academic Press: San Diego, CA, USA, 2001; pp. 95–99. [Google Scholar]
  4. Pires, N.; Fernandes, M.J.; Gommenginer, C.; Scharroo, R. Improved sea state bias estimation for altimeter reference missions with altimeter-only three-parameter models. IEEE Trans. Geosci. Remote Sens. 2018, 57, 1–15. [Google Scholar] [CrossRef]
  5. Reale, F.; Dentale, F.; Carratelli, E.P.; Fenoglio-Marc, L. Influence of sea state on sea surface height oscillation from doppler altimeter measurements in the North Sea. Remote Sens. 2018, 10, 1100. [Google Scholar] [CrossRef] [Green Version]
  6. Gommenginger, C.P.; Srokosz, M.A.; Challenor, P.G.; Cotton, P.D. Development and validation of altimeter wind speed algorithms using an extended collocated buoy/Topex dataset. IEEE Trans. Geosci. Remote Sens. 2002, 40, 251–260. [Google Scholar] [CrossRef]
  7. Monaldo, F. Expected differences between buoy and radar altimeter estimates of wind speed and significant wave height and their implications on buoy-altimeter comparisons. J. Geophys. Res. 1988, 93, 2285–2302. [Google Scholar] [CrossRef]
  8. Carter, D.J.T.; Challenor, P.G.; Srokosz, M.A. An assessment of Geosat wave height and wind speed measurements. J. Geophys. Res. 1992, 97, 11383–11392. [Google Scholar] [CrossRef]
  9. Gower, J.F.R. Intercalibration of wave and wind data from TOPEX/POSEIDON and moored buoys off the west coast of Canada. J. Geophys. Res. 1996, 101, 3817–3829. [Google Scholar] [CrossRef]
  10. Kshatriya, J.; Sarkar, A.; Kumar, R. Comparison of TOPEX/POSEIDON altimeter derived wind speed and wave parameters with ocean buoy data in the north Indian Ocean. Mar. Geod. 2001, 24, 131–138. [Google Scholar] [CrossRef]
  11. Dobson, E.; Monaldo, F.; Goldhirsh, J.; Wilkerson, J. Validation of Geosat altimeter-derived wind speeds and significant wave heights using buoy data. J. Geophys. Res. 1987, 92, 10719–10731. [Google Scholar] [CrossRef]
  12. Kumar, U.M.; Swain, D.; Sasamal, S.K.; Reddy, N.N.; Ramanjappa, T. Validation of SARAL/AltiKa significant wave height and wind speed observations over the North Indian Ocean. J. Atmos. Sol. Terr. Phys. 2015, 135, 174–180. [Google Scholar] [CrossRef]
  13. Ebuchi, N.; Kawamura, H. Validation of wind speeds and significant wave heights observed by the TOPEX altimeter around Japan. J. Oceanogr. 1994, 50, 479–487. [Google Scholar] [CrossRef]
  14. Queffeulou, P. Validation of ENVISAT RA-2 and JASON-1 altimeter wind and wave measurements. Proc. IEEE Geosci. Remote Sens. Symp. 2003, 5, 2987–2989. [Google Scholar]
  15. Young, I.R. An intercomparison of GEOSAT, TOPEX and ERS1 measurements of wind speed and wave height. Ocean Eng. 1998, 26, 67–81. [Google Scholar] [CrossRef]
  16. Abdalla, S.; Dinardo, S.; Benveniste, J.; Janssen, P.A.E.M. Assessment of CryoSat-2 SAR mode wind and wave data. Adv. Space Res. 2018, 62, 1421–1433. [Google Scholar] [CrossRef]
  17. Young, I.R.; Sanina, E.; Babanin, A.V. Calibration and cross validation of a global wind and wave database of altimeter, radiometer, and scatterometer measurements. J. Atmos. Ocean. Technol. 2017, 34, 1285–1306. [Google Scholar] [CrossRef]
  18. Ribal, A.; Young, I.R. Calibration and cross validation of global ocean wind speed based on scatterometer observations. J. Atmos. Ocean. Technol. 2020, 37, 279–297. [Google Scholar] [CrossRef]
  19. Ribal, A.; Young, I.R. 33 years of globally calibrated wave height and wind speed data based on altimeter observations. Sci. Data 2019, 6, 77. [Google Scholar] [CrossRef] [Green Version]
  20. Cotton, P.D.; Challenor, P.G.; Lefevre, J.-M. Calibration of Envisat and ERS-2 wind and wave data through comparisons with in-situ data and wave model analysis fields. In Proceedings of the 2004 Envisat & ERS Symposium (ESA SP-572), Salzburg, Austria, 6–10 September 2004. [Google Scholar]
  21. Queffeulou, P. Long-term validation of wave height measurements from altimeters. Mar. Geod. 2004, 27, 495–510. [Google Scholar] [CrossRef]
  22. Durrant, T.H.; Greenslade, D.J.M.; Simmonds, I. Validation of Jason-1 and Envisat remotely sensed wave heights. J. Atmos. Ocean. Technol. 2009, 26, 123–134. [Google Scholar] [CrossRef]
  23. Ray, R.D.; Beckley, B.D. Calibration of ocean wave measurements by the TOPEX, Jason-1, and Jason-2 satellites. Mar. Geod. 2012, 35, 238–257. [Google Scholar] [CrossRef]
  24. Passaro, M.; Fenoglio-Marc, L.; Cipollini, P. Validation of significant wave height from improved satellite altimetry in the German Bight. IEEE Trans. Geosci. Remote Sens. 2015, 53, 2146–2156. [Google Scholar] [CrossRef]
  25. Donlon, C.; Berruti, B.; Buongiorno, A.; Ferreira, M.H.; Femenias, P.; Frerick, J.; Goryl, P.; Klein, U.; Laur, H.; Mavrocordatos, C.; et al. The Global Monitoring for Environment and Security (GMES) Sentinel-3 mission. Remote Sens. Environ. 2012, 120, 37–57. [Google Scholar] [CrossRef]
  26. Abdalla, S. Ku-band radar altimeter surface wind speed algorithm. Mar. Geod. 2012, 35, 276–298. [Google Scholar] [CrossRef] [Green Version]
  27. Yang, J.; Zhang, J.; Wang, C. Sentinel-3A SRAL global statistical assessment and cross-calibration with Jason-3. Remote Sens. 2019, 11, 1573. [Google Scholar] [CrossRef] [Green Version]
  28. Handoko, E.Y.; Fernandes, M.J.; Lázaro, C. Assessment of altimetric range and geophysical corrections and mean sea surface models—Impacts on sea level variability around the Indonesian Seas. Remote Sens. 2017, 9, 102. [Google Scholar] [CrossRef] [Green Version]
  29. Gourrion, J.; Vandemark, D.; Bailey, S.; Chapron, B.; Gommenginger, G.P.; Challenor, P.G.; Srokosz, M.A. A two-parameter wind speed algorithm for Ku-band altimeters. J. Atmos. Oceanic Technol. 2002, 19, 2030–2048. [Google Scholar] [CrossRef]
  30. Collard, F. Algorithmes de Vent et P´eriode Moyenne des Vagues JASON a´ Base de Re´seaux de Neurons. BO-021-CLS-0407-RF; Boost Technologies: Plouzane´, France, 2005. [Google Scholar]
  31. Yang, J.G.; Zhang, J. Validation of Sentinel-3A/3B satellite altimetry wave heights with buoy and Jason-3 data. Sensors 2019, 19, 2914. [Google Scholar] [CrossRef] [Green Version]
  32. Liu, W.T.; Katsaros, K.B.; Businger, J.A. Bulk parameterization of air-sea exchanges of heat and water vapor including the molecular constraints at the interface. J. Atmos. Sci. 1979, 36, 1722–1735. [Google Scholar] [CrossRef] [Green Version]
  33. Liu, W.T.; Tang, W.Q. Equivalent Neutral Wind. Jet Propulsion Laboratory Publication 96-17. 1996. Available online: https://ntrs.nasa.gov/archive/nasa/casi.ntrs.nasa.gov/19970010322.pdf (accessed on 10 March 2020).
  34. Fairall, C.W.; Bradley, E.F.; Hare, J.E.; Grachev, A.A.; Edson, J.B. Bulk parameterization of air–sea fluxes: Updates and verification for the COARE algorithm. J. Clim. 2003, 16, 571–591. [Google Scholar] [CrossRef]
  35. Yang, J.G.; Zhang, J. Evaluation of ISS-RapidScat wind vectors using buoys and ASCAT data. Remote Sens. 2018, 10, 648. [Google Scholar] [CrossRef] [Green Version]
  36. Moreau, T.; Tran, N.; Aublanc, J.; Tison, C.; Le Gac, S.; Boy, F. Impact of long ocean waves on wave height retrieval from SAR altimetry data. Adv. Space Res. 2018, 62, 1434–1444. [Google Scholar] [CrossRef]
Figure 1. Spatial distributions of the moored buoys matched to (a) Sentinel-3A, (b) Sentinel-3B and (c) Jason-3 for wind speed validation.
Remotesensing 12 02079 g001aRemotesensing 12 02079 g001b
Figure 2. Spatial distributions of the National Data Buoy Center (NDBC) buoys matched to Sentinel-3A/3B and Jason-3 for significant wave height (SWH) validation.
Remotesensing 12 02079 g002
Figure 3. Comparisons of wind speed (WS) between Sentinel-3A, Sentinel-3B, and Jason-3 altimeters and moored buoys. (a) all buoys; (b) NDBC buoys; (c) PIRATA buoys; (d) RAMA buoys; (e) TAO buoys.
Remotesensing 12 02079 g003
Figure 4. Dependence of statistical parameters of WS differences between the Jason-3, Sentinel-3A, Sentinel-3B altimeters and the moored buoys on the altimeter-derived WS.
Remotesensing 12 02079 g004
Figure 5. Monthly RMSEs and biases of WS differences between the Sentinel-3A/3B and Jason-3 altimeters and the moored buoys across different months and the average monthly WSs of the collocated data. the dotted straight lines represent the fitting trends.
Remotesensing 12 02079 g005
Figure 6. Dependence of statistical parameters of WS differences between the Jason-3, Sentinel-3A, Sentinel-3B altimeters and the moored buoys on the buoy-derived SWH.
Remotesensing 12 02079 g006
Figure 7. Comparisons of WS between the Sentinel-3A/3B and Jason-3 altimeters and Advanced Scatterometer (ASCAT).
Remotesensing 12 02079 g007
Figure 8. Dependence of statistical parameters of WS differences between the Sentinel-3A/3B and Jason-3 altimeters and ASCAT on altimeter-derived WS.
Remotesensing 12 02079 g008
Figure 9. Monthly RMSEs and biases of WS differences between the Sentinel-3A/3B and Jason-3 altimeters and ASCAT across the different months. the dotted straight lines represent the fitting trends.
Remotesensing 12 02079 g009
Figure 10. Comparisons of SWH between the Sentinel-3A, Sentinel-3B, and Jason-3 altimeters and the NDBC buoys.
Remotesensing 12 02079 g010
Figure 11. Dependence of the statistical parameters of SWH differences between the Jason-3, Sentinel-3A, and Sentinel-3B altimeters and the NDBC buoys on buoy SWH.
Remotesensing 12 02079 g011
Figure 12. Monthly RMSEs and biases of SWH differences between the Sentinel-3A/3B and Jason-3 altimeters and the NDBC buoys across different months and the average monthly SWH of the collocated data. the dotted straight lines represent the fitting trends.
Remotesensing 12 02079 g012
Figure 13. Dependence of the statistical parameters of SWH differences between the Jason-3, Sentinel-3A, and Sentinel-3B altimeters and the NDBC buoys on buoy WS.
Remotesensing 12 02079 g013
Figure 14. Dependence of the statistical parameters of SWH differences between the Jason-3, Sentinel-3A, and Sentinel-3B altimeters and the NDBC buoys on buoy wave period.
Remotesensing 12 02079 g014
Table 1. WS errors between Sentinel-3A and moored buoys.
BuoyNDBCTAOPIRATARAMAALL
Number of Collocated Data205316904824934718
Bias (m/s)−0.08−0.10−0.30−0.26−0.13
RMSE (m/s)1.230.911.051.271.11
R0.940.920.890.910.93
SI0.190.150.150.190.17
Table 2. WS errors between Sentinel-3B and moored buoys.
BuoyNDBCTAOPIRATARAMAALL
Number of Collocated Data347307145119918
Bias (m/s)−0.22−0.01−0.43−0.59−0.23
RMSE (m/s)1.201.010.991.351.13
R0.960.910.940.930.94
SI0.170.180.140.190.18
Table 3. WS errors between Jason-3 and moored buoys.
BuoyNDBCTAOPIRATARAMAALL
Number of Collocated Data150616081892953598
Bias (m/s)−0.31−0.58−0.59−0.95−0.50
RMSE (m/s)1.431.101.371.401.29
R0.920.910.840.950.92
SI0.210.160.160.150.19
Table 4. SWH errors between the Sentinel-3A/3B, Jason-3 and the NDBC buoys.
AltimeterSentinel-3A SRALSentinel-3B SRALJason-3
Number of Collocation534511913033
Bias (m)0.020.050.05
RMSE (m)0.270.320.23
R0.970.960.98
SI0.160.180.13

