Letter

Insect Mass Estimation Based on Radar Cross Section Parameters and Support Vector Regression Algorithm

1
Radar Research Lab, School of Information and Electronics, Beijing Institute of Technology, Beijing 100081, China
2
Key Laboratory of Electronic and Information Technology in Satellite Navigation (Beijing Institute of Technology), Ministry of Education, Beijing 100081, China
*
Author to whom correspondence should be addressed.
Remote Sens. 2020, 12(11), 1903; https://doi.org/10.3390/rs12111903
Submission received: 12 May 2020 / Revised: 4 June 2020 / Accepted: 9 June 2020 / Published: 11 June 2020
(This article belongs to the Section Atmospheric Remote Sensing)

Abstract

:
Radar cross section (RCS) parameters of insect targets contain information related to their morphological parameters, which are helpful for the identification of migratory insects. Several morphological parameter estimation methods have been presented. However, most of these estimations are performed based on polynomial fitting methods, using only one or two parameters, which may limit the estimation accuracy. In this paper, a new insect mass estimation method is proposed based on support vector regression (SVR). Several RCS parameters were extracted for the estimation of insect mass. Support vector regression based on recursive feature elimination (SVRRFE) was used to obtain the optimal feature subset. Specifically, a dataset including 367 specimens was included to evaluate the performance of the proposed method. Fifteen features were extracted and ranked. The optimal feature subset contained six features and the optimal mass estimation accuracy was 78%. Additionally, traditional insect mass estimation methods were analyzed for comparison. The results prove that the proposed method is more effective and accurate for insect mass estimation. It needs to be emphasized that the poor number of experimental insects available may limit the further improvement of estimation accuracy.

Graphical Abstract

1. Introduction

Countless insects have long-distance migrations every year and the study of these large-scale movements can contribute to our understanding of insect migration [1]. Many major agricultural pests (such as Nilaparvata lugens [2], Mythimna separate [3] and Helicoverpa armigera [4,5]) have a strong migration capacity, which may lead to catastrophic losses of crops and disease transmission between continents [1,6,7]. Effective monitoring and early warning systems for migratory insects are critically important.
Most insects are small and fly at night, making it difficult to observe their migrations [8]. The emergence of entomological radar makes it possible to effectively monitor long-distance migrations of insects [9]. Entomological radar transmits a beam in the form of an electromagnetic wave to a high-flying insect migrant and the received signal can be used to extract its heading direction, velocity and trajectory [10,11]. Entomological radar has become a superior and irreplaceable tool in the study of insect migrations. Entomologists have conducted extensive research on migratory insects around the world using a variety of entomological radar types, such as scanning and vertical-looking radars (VLRs) [8,12,13]. VLRs that have proved particularly effective for observing insect migrations can provide information characterizing an insect target (i.e. target’s size, shape and parameters related to wing beating) [14].
Previous research discussed the relation between the shape estimates and insect target identity and proved that the shape and wingbeat frequency parameters were potential values for insect target identification [15,16,17]. However, only broad classes, such as locusts and moths, could be identified based on the estimated radar cross section (RCS) parameters [16]. The ability of entomological radar to distinguish different insect targets is insufficient, which is one of the most important issues that entomologists and pest managers are concerned about [16]. In addition, in this paper we proved that mass was the most important feature for insect identification [18]. Therefore, precise estimation of insect mass from radar data may contribute to research on insect target identification.
Several insect mass estimation methods have been presented based on RCS parameters retrieved from radar signals [14,19,20,21,22]. These methods choose only one or two RCS parameters and then adopt polynomial fitting or multiple linear regression to realize an estimation of insect mass. Only very limited useful information is utilized for each of these methods, which may limit the estimation accuracy of insect mass. Machine learning algorithms, which can synthetically use multiple parameter features, should be considered.
Support vector machine (SVM), as one of the most popular pattern recognition methods, was originally proposed by Cortes and Vapnik [23]. Support vector regression (SVR) is an important branch of SVM, and can be applied in regression and prediction [24,25]. SVR has been applied in many research fields, including remote sensing [26]. Many studies demonstrate that SVR is superior to other regression methods in many cases [27,28]. In addition, SVR has the advantages of good generalization and high performance in tackling datasets with relatively small samples [26,29]. Therefore, considering that the experimental data that can be used for insect mass estimation is limited, SVR was chosen for the estimation of insect mass in our research.
In the present study, a dataset of 367 insect specimens was collated from several sources [14,21] and several RCS parameters related to insect mass were extracted from the backscattering signals measured in the X band in a microwave anechoic chamber. Fifteen features were extracted from the RCS parameters and selected as the input variables for SVR. The optimal feature subset was determined after feature ranking and then the optimal mass estimation accuracy was achieved. The proposed method can take full advantage of various RCS parameters to acquire a higher estimation accuracy, which may contribute to the species identification of migratory insects based on radar measurement data.

2. Materials and Methods

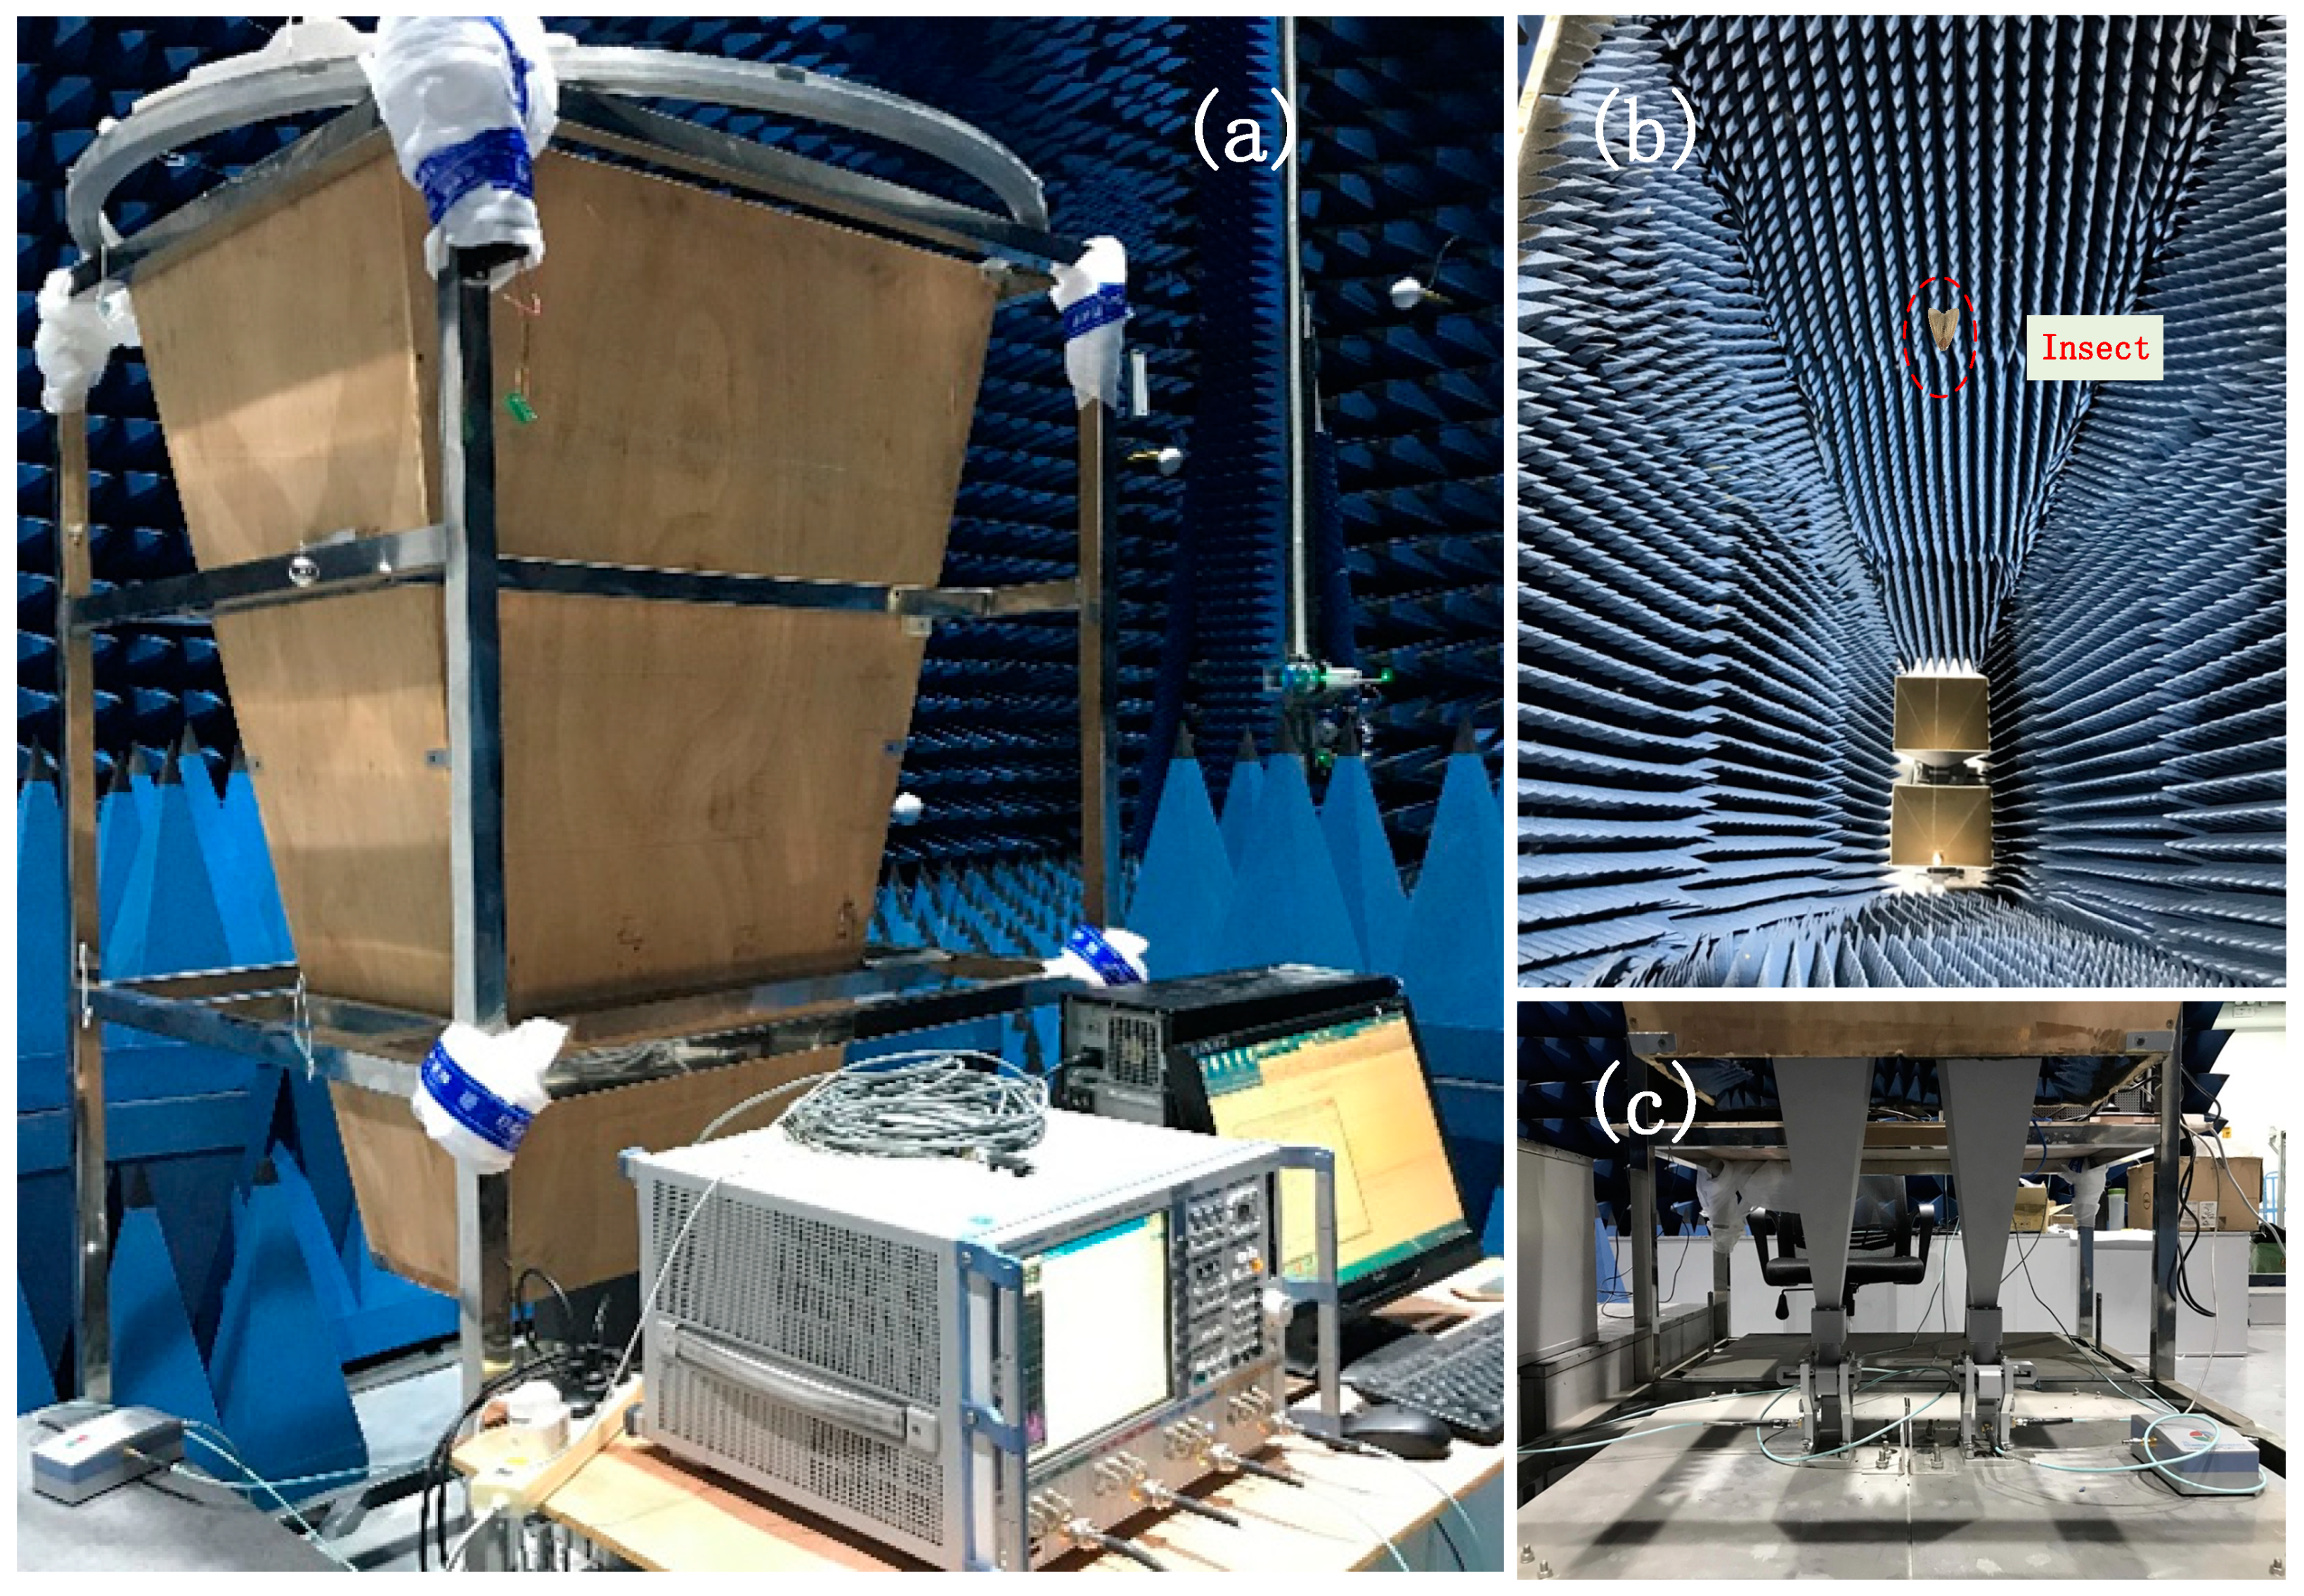
2.1. Experimental Datasets

Many X band measurements of ventral-aspect RCSs of insects have been reported [20,21,30]. Most of these measurements were made at 9.4 GHz. The measured RCS parameters of 207 specimens for which the morphological parameters were also available were compiled and summarized in the former research [21]. The estimated RCS parameters mainly consisted of three terms representing the target’s radar reflectivity ( a 0 , α 2 and α 4 ), two terms representing principal RCSs ( σ x x and σ y y ) and two terms ( d and ν ) which were calculated from the scattering matrix [21]. These measured specimens were divided into three groups (datasets D, L and M) [21]. These datasets were also included in this paper for integrative analysis.
In addition, we also carried out many experiments for measuring RCS parameters of insect specimens in a microwave anechoic chamber. As shown in Figure 1, the experimental rig mainly included a vector network analyzer (VNA), a pair of dual-polarization antennas working at X band and a horn-shaped experimental rig with absorbing materials affixed on the inside. When experiments were performed, an insect target was glued to a short polyethylene line of 0.05 mm diameter and then was hung at a distance of ~2 m from the antennas, which ensured that the insect target was in the far field. Then, the echo signal of insect target was obtained by using the above experimental device. After processing radar data by step-frequency continuous-wave (SFCW) imaging and polarimetric calibration [22], the scattering matrix of the insect targets was obtained. Then the RCS parameters mentioned above were retrieved from the scattering matrix. Note that background subtraction was performed with the SFCW range profiles of the empty scene to eliminate clutter.
A total of 169 insects belonging to 22 species (denoted here by K) were measured in our experiment (Table 1). All insects were trapped by a light trap the night before the experiment and only the specimens with no physical damage were selected for our experiment. An electronic balance with an accuracy of 0.1 mg was used to measure the mass of each specimen. The moisture content of the insects changes greatly when they are dead, which has an evident effect on the measured mass and electromagnetic scattering characteristics. Therefore, the measurements of insect mass and RCS were made with specimens that were freshly dead.
The information of the four datasets (D, L, M and K) were listed in Table 2. Four different datasets were combined into one dataset and then 367 specimens in total were included in our study. The mass of all specimens ranges from 1.83 mg to 4120 mg. It is important to note that the RCS parameters of dataset K were measured at multi-frequency points, so only the RCS parameters at 9.45 GHz were used to keep consistency with other datasets.

2.2. Support Vector Regression

SVR is one of the most common application forms of SVM and can obtain the global optimum solution based on limited samples by minimizing the generalization error bound [24,29]. Given a dataset including N vectors { x i ,   y i } ,   ( i = 1 , 2 , , N ) ,   x i R d . Each vector x i contains d-dimensional features and y i represents the target value. The linear function f ( x i ) can be represented as [29]:
f ( x i ) = ( w · x i ) + b
where w represents the weight and b represents the bias parameters, which can be determined by the training set.
When the deviation between the predicted value f ( x i ) and original target value y i is smaller than ε for every sample, the SVR model can be obtained by solving the following convex optimization problem [24,26]:
minimize   1 2 w 2 + C i = 1 N ( ξ i + ξ i ) subject   to   { y i ( w · x i ) b ε + ξ i ( w · x i ) + b y i ε + ξ i ξ i , ξ i 0
where C is a constant and determines the trade-off between the flatness of the model and the model toleration of deviations larger than ε . ξ i , ξ i represent the slack variables [24].
In general, most regression problems are nonlinear and the kernel functions should be introduced to solve the problem by mapping the input space into a high-dimensional feature space. The radial basis function (RBF) kernel is the most popular and was used in this study [31,32].
For an SVR model, the input features are critically important for the regression result. Therefore, feature importance assessment is an important and necessary step. The support vector regression based on recursive feature elimination (SVMRFE) is a popular wrapper feature selection method developed from SVM [33] and has been widely used in research [31,34]. SVRRFE obtains a ranking of features using backward feature elimination. Specifically, the feature selection algorithm starts with all the features and then the feature with the smallest weight is removed recursively at a time until only one feature remains [34].

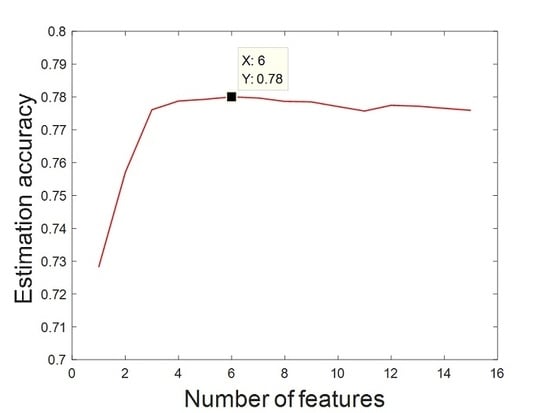
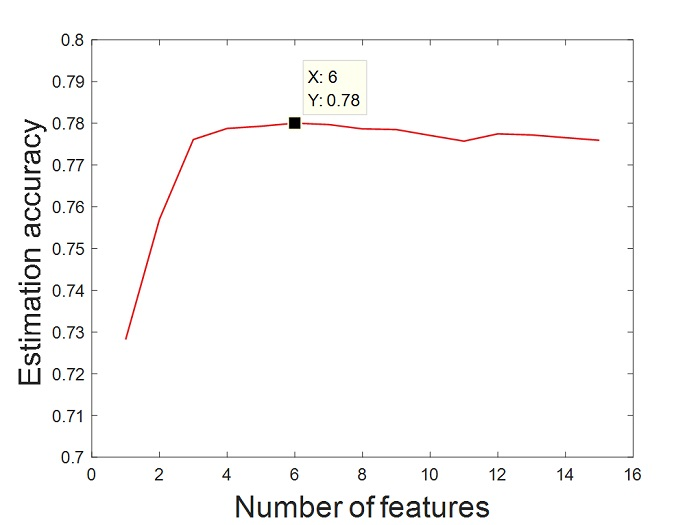
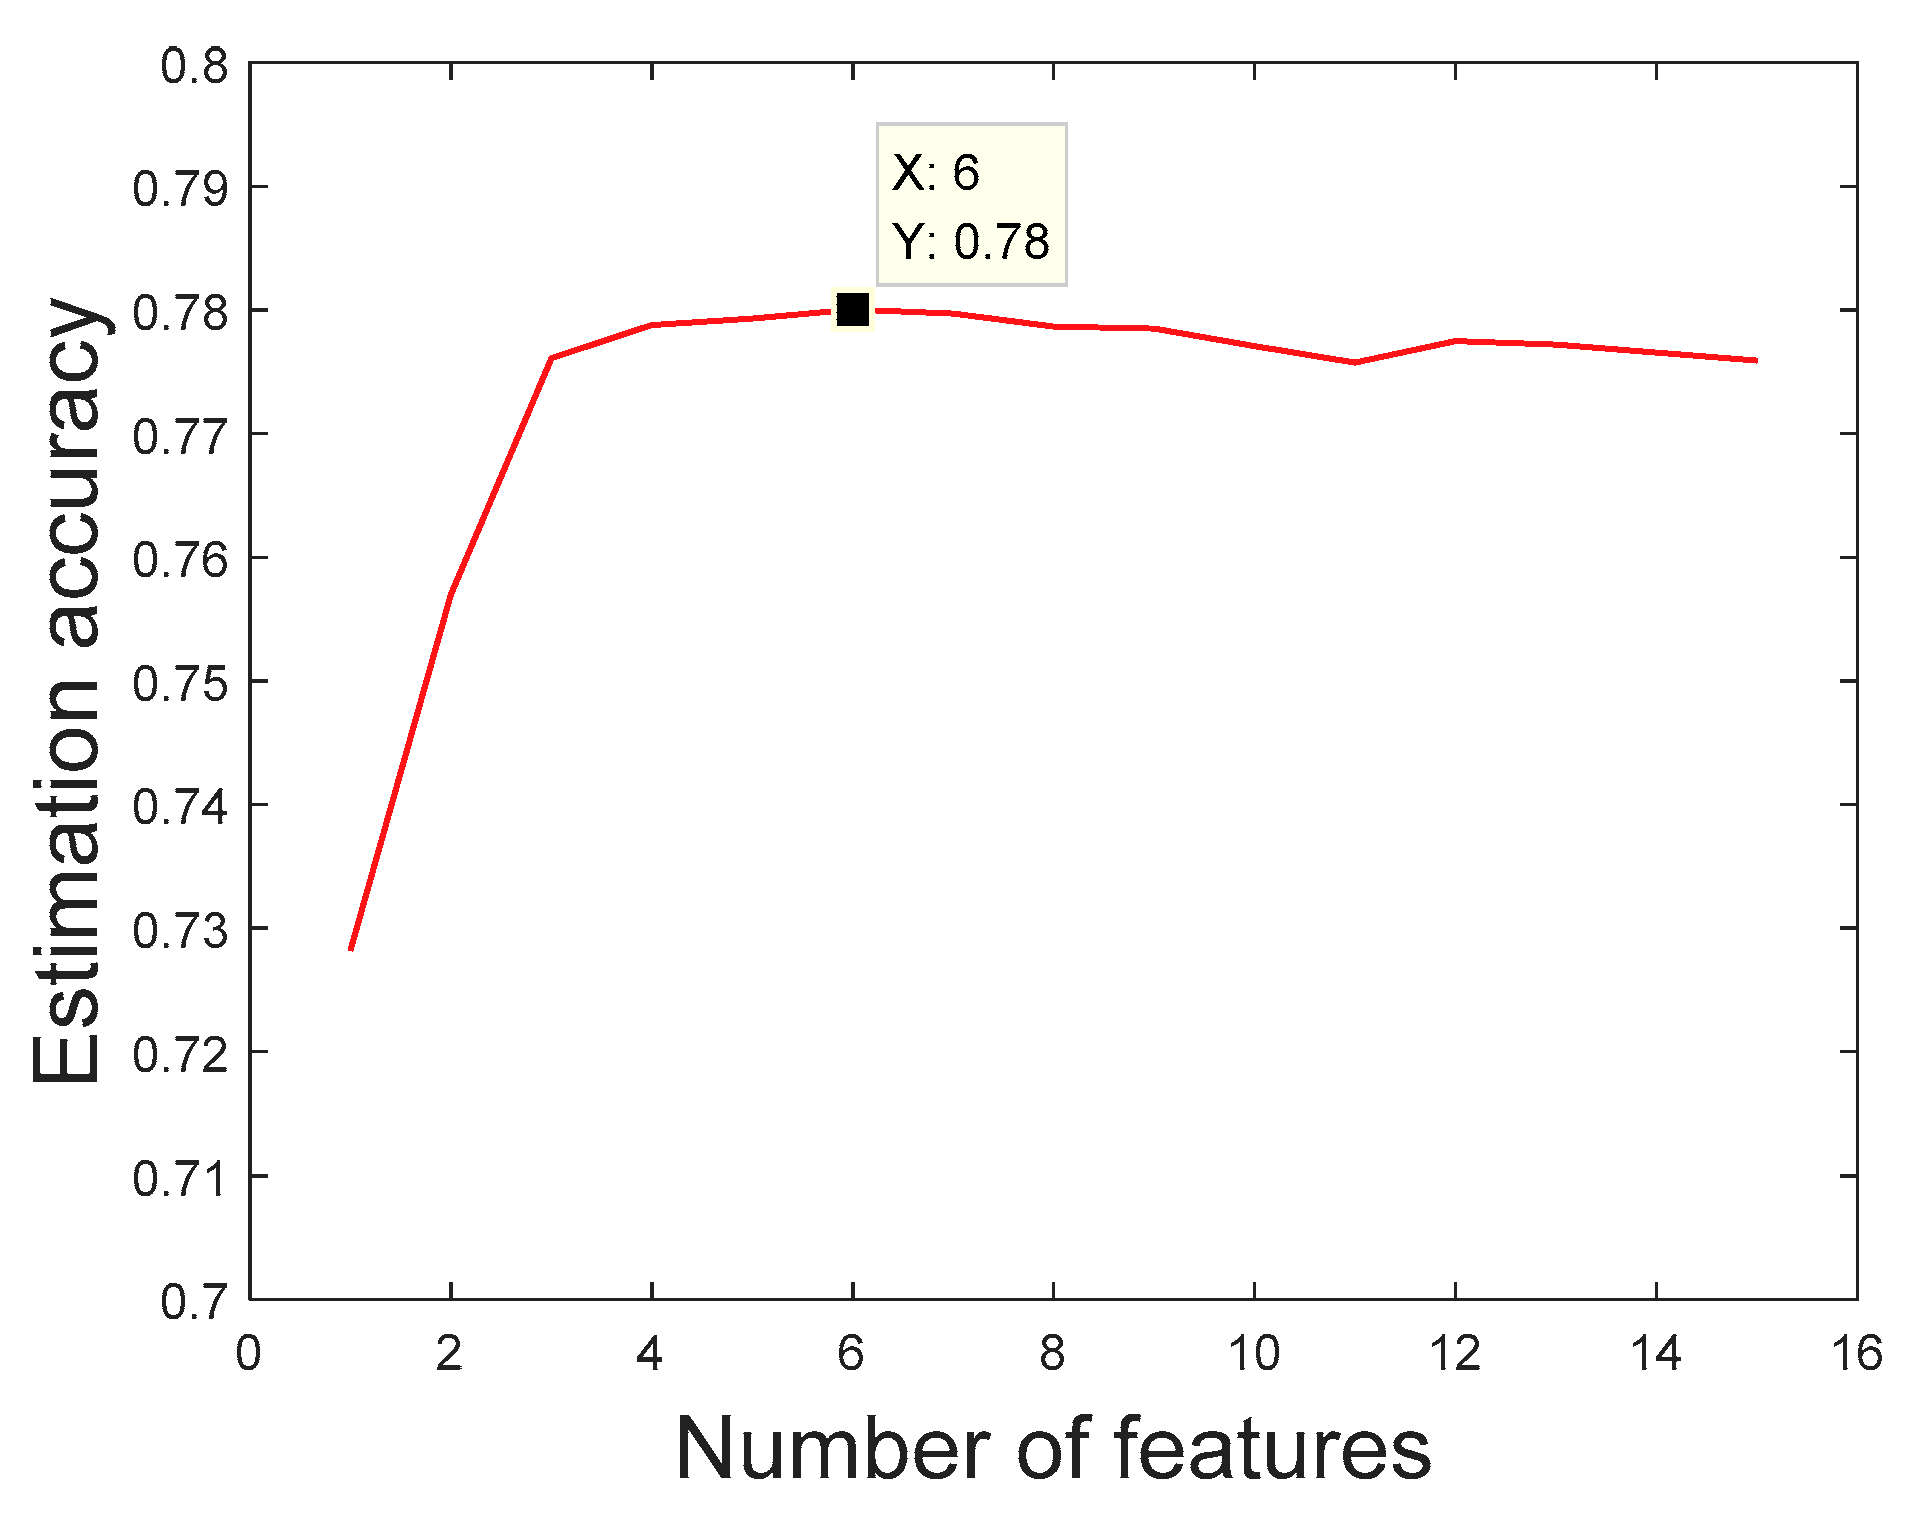
2.3. Feature Extraction

Insect RCS polarization dependence measured by a monostatic radar can be represented as:
σ = | h T S h |
where h = ( cos ϕ sin ϕ ) represents the normalized effective length for transmission and reception. ϕ represents the direction of linear polarization.
The scattering of insect target is linear, so the scatter matrix is symmetrical and can be represented as [19]:
S = e i γ [ σ x x σ x y e i α σ x y e i α σ y y e i β ]
where α , β and γ are phase factors. γ has no correlation with the RCS and is usually ignored.
Therefore, the RCS versus polarization angle can be rearranged as [15]:
σ ( ϕ ) = a 0 + a 2 cos 2 ( ϕ θ 0 ) + a 4 cos 4 ( ϕ θ 0 )
where a 0 represents polarization-averaged RCS, a 2 and a 4 represent non-negative coefficients and can be determined by the radar scattering matrix S and θ 0 represents either the orientation of the insect or the perpendicular to its orientation.
Two principal RCS terms (the parallel values σ x x and transverse values σ y y ) of the target can be obtained [19]:
σ x x = a 0 + a 2 + a 4 = a 0 ( 1 + α 2 + α 4 )
σ y y = a 0 a 2 + a 4 = a 0 ( 1 α 2 + α 4 )
where α 2 , α 4 represent dimensionless parameters.
Values of the parameters a 0 , α 2 , α 4 , σ x x and σ y y have all been utilized for the estimation of insect mass in former research [14,19,20]. In addition, the invariant target parameters d and ν calculated from the Graves power matrix were also explored to improve the estimation accuracy [21].   d represents the scattering matrix’s determinant and ν represents the RCS when the polarization direction is perpendicular to the insect’s body axis. Please refer to [21] for the calculation of parameters d and ν . The selection of features is crucial to obtain a good result. Therefore, the parameters that have proven effective in mass estimation were also selected as features in this research. The parameters a 0 , σ x x , σ y y , d and ν are often expressed logarithmically [21], therefore the logarithm-transformed parameters are also used in our research. Traditional research also demonstrates that if a third-order polynomial is employed to describe the relation between mass and RCS parameters, better fitting results can be obtained [21]; consequently, the square and cube values of RCS parameters are also selected as features. Based on the traditional insect mass estimation method, 15 variables are selected as inputs, as listed in Table 3.

3. Results

3.1. Mass Estimation Based on SVR

We studied the estimation of insect mass based on the measured RCS parameters of 367 insects. We selected 250 insect specimens as training samples and the rest were regarded as test samples. Based on the selected features listed in Table 3, a 15-dimensional dataset was constructed and was input into the SVR model for training. Then, the test data were imported into the trained model and the predicted result was obtained. In this study, the SVR algorithm was implemented based on a toolbox Lib-SVM in the MATLAB programming language [35].
The mean relative error of estimated insect mass was 22.41%. However, it should be noted that this result may not be optimal. For a small sample, with the increase of the number of features, the generalization ability of the trained model is relatively poor, which may result in an imprecise result. SVRRFE model can export the score of variable importance, which can be used to evaluate the influence of each variable on the dependent variable. The optimal subset can be constructed based on SVRRFE. Table 3 demonstrates the ranking of feature importance. We can learn that the most useful three features are log 10 d , log 10 ν and α 2 and the least important feature is ( log 10 σ y y ) 3 .
Based on the ranking results, we deleted the features that ranked last in the importance ranking one by one and then trained and tested the new model in turn. The relation between estimation accuracy and feature number is shown in Figure 2. With the removal of unimportant features in turn, the estimation accuracy of insect mass was gradually increasing as a whole and the main reason was that the elimination of irrelevant features and redundant features improved the performance of the model. When the estimation accuracy reached the highest value of 78%, it began to show a downward trend, because the useful features were eliminated, which brought down the performance of the model. Therefore, to achieve the optimal estimation accuracy, the first six features listed in Table 3 should be selected.

3.2. Comparison with Traditional Methods

In this section, we compare the SVR model with traditional insect mass estimation methods. Traditional insect mass estimation methods are mostly realized based on polynomial fittings. In this paper, five traditional methods that have been proved to have relatively good results were selected for comparative analysis. The fitting results are shown in Figure 3 and the estimation results based on traditional methods are listed in Table 4. Third-order polynomials were adopted for characterizing the relation between the logarithm of mass and the logarithm of a certain feature (namely a 0 , σ y y ,   v , or d ). The refitted empirical formulas were also calculated (see Equations (8)–(12) for details). As to traditional methods, the estimation based on parameters a 0 and α 2 achieved the best result, while estimation only based on parameter a 0 produced a relatively poor result. Compared with the traditional methods, SVR method achieved a better estimation result, which proved that the model constructed by SVR can actually be employed for insect mass estimation.
  • log 10 σ y y method (Aldhous et al. (1989), [19]).
    log 10 [ Mass ( m g ) ] = 2.6658 + 0.734 ( log 10 σ y y ) + 0.151 ( log 10 σ y y ) 2 + 0.0264 ( log 10 σ y y ) 3
  • log 10 a 0 method (Chapman et al. (2002), [13]).
    log 10 [ Mass ( m g ) ] = 2.287 + 0.881 ( log 10 a 0 ) + 0.312 ( log 10 a 0 ) 2 + 0.0638 ( log 10 a 0 ) 3
  • log 10 a 0   &   α 2 method (Drake et al. (2017), [14]).
    log 10 [ Mass ( m g ) ] = 2.6561 + 0.5303 0.4466 ( log 10 α 2 ) + 0.0046 ( log 10 a 0 ) 2
  • log 10 ν   and   log 10 d method (Hu et al. (2019), [21]).
    log 10 [ Mass ( m g ) ] = 2.5922 + 0.5796 ( log 10 ν ) + 0.066 ( log 10 ν ) 2 + 0.0132 ( log 10 ν ) 3
    log 10 [ Mass ( m g ) ] = 2.3974 + 0.8241 ( log 10 d ) + 0.2435 ( log 10 d ) 2 + 0.0485 ( log 10 d ) 3

4. Discussion

For decades, entomologists have paid close attention to the movement of migrant insect, especially the quantification and identification of migratory insects [8,16]. Great progress has been made based on current radar technology. However, reliable identification of radar targets is still a key problem for the research of insect migrations. In terms of species identification of migratory insects based on radar, the main parameters that can be used at present are wingbeat frequency, mass and size of the insect, among which the measurement of the wingbeat frequency can be realized [36], but there are still obvious deficiencies in the measurement of insect mass. In this paper, we study the estimation of insect mass by using a variety of RCS parameters and their deformations based on the SVR algorithms. The good performance of the proposed method can provide insights for the research of species identification of migratory insects.
It should be emphasized that the number of insect specimens used in this paper is relatively small. In particular, the number of experimental insects greater than 1000 mg is very limited. For machine learning methods such as SVR, the accuracy of the training model will be improved with the increase of specimens. Therefore, measurement of the RCS parameters of more insects will be done in future studies, especially for insects greater than 1000 mg. In addition, if there are enough samples of experimental insects, more features should be considered and the estimation accuracy of insect mass will be further improved accordingly.
RCS parameters proved to have the potential to improve the estimation accuracy of insect mass. Mass and other shape parameters of insects are important characteristics to recognize their identity. Therefore, the features used for mass estimation can also be applied to the study of species identification of insects. However, in this study, most species only have less than 20 samples, which limits our further study of species identification based on RCS parameters. If there are a large number of samples of the concerned species, we can do the research of insect species identification based on machine learning methods. More specimens for each species should be included in our future experiments.
In addition, it was proved that the feature parameters extracted from a multi-frequency scattering curve could also be used to estimate insect mass [22]. The scatterings of almost all insects at Ku band are generally in the resonance region [22], where the variation of scattering with frequency is very complex and is difficult to be described by a mathematical formula for various insects. Therefore, it is challenging to extract more useful information from Ku band for insect mass estimation. Machine learning methods may be optional and effective for overcoming the difficulty. However, not enough multi-frequency scattering data of insects have been published, which is insufficient for building a complicated and ideal machine learning model. Therefore, if enough multi-frequency RCS data are accumulated in the future, the estimation of insect mass based on multi-frequency information can be considered.

5. Conclusions

In this paper, a method based on SVR is proposed for the estimation of insect mass. Fifteen features were extracted and evaluated. For insect mass estimation, the most important three features were log 10 d , log 10 ν and α 2 . The optimal estimation model was also determined when the most important six features were utilized. The best estimation accuracy of insect mass was 78%. In conclusion, the proposed method can accurately measure insect mass, which provides effective support for species identification in entomological radar. It can be predicted that, in the future, multi-frequency and full-polarization scattering information will be used comprehensively to achieve optimal insect species identification performance. In addition, if more experimental insects are available, the estimation accuracy of insect mass may be further improved accordingly.

Author Contributions

Methodology, C.H. and S.K.; software, S.K.; validation, S.K. and R.W.; resources, R.W.; writing—original draft preparation, S.K.; writing—review and editing, C.H., S.K., F.Z. and L.W. All authors have read and agreed to the published version of the manuscript.

Funding

This research was funded by the Special Fund for Research on National Major Research Instruments (Grant No. 31727901).

Acknowledgments

In this section you can acknowledge any support given which is not covered by the author contribution or funding sections. This may include administrative and technical support, or donations in kind (e.g., materials used for experiments). The authors would like to express their thanks to Prof. K. Wu from the Chinese Academy of Agricultural Sciences, Beijing, China for his support in collecting the insects.

Conflicts of Interest

The authors declare no conflict of interest.

References

  1. Holland, R.A.; Wikelski, M.; Wilcove, D.S. How and why do insects migrate. Science 2006, 313, 794–796. [Google Scholar] [CrossRef] [Green Version]
  2. Riley, J.R.; Reynolds, D.R.; Farrow, R.A. The migration of Nilaparvata lugens (Stal) (Delphacidae) and other Hemiptera associated with rice during the dry season in the Philippines: A study using radar, visual observations, aerial netting and ground trapping. Bull. Entomol. Res. 1987, 77, 145–169. [Google Scholar] [CrossRef]
  3. Feng, H.Q.; Zhao, X.C.; Wu, X.F.; Wu, B.; Wu, K.M.; Cheng, D.F.; Guo, Y.Y. Autumn Migration of Mythimna separata (Lepidoptera: Noctuidae) Over the Bohai Sea in Northern China. Environ. Entomol. 2008, 37, 774–781. [Google Scholar] [CrossRef]
  4. Wu, K.M.; Guo, Y.Y.; Head, G. Resistance Monitoring of Helicoverpa armigera (Lepidoptera: Noctuidae) to Bt Insecticidal Protein During 2001–2014 in China. J. Econ. Entomol. 2006, 99, 893–898. [Google Scholar] [CrossRef] [PubMed]
  5. Feng, H.Q.; Gould, F.; Huang, Y.X.; Jiang, Y.Y.; Wu, K.M. Modeling the Population Dynamics of Cotton Bollworm Helicoverpa armigera (Hübner) (Lepidoptera: Noctuidae) Over a Wide Area in Northern China. Ecol. Model. 2010, 221, 1819–1830. [Google Scholar] [CrossRef]
  6. Altizer, S.; Bartel, R.; Han, B.A. Animal migration and infectious disease risk. Science 2011, 331, 296–302. [Google Scholar] [CrossRef] [Green Version]
  7. Bauer, S.; Hoye, B.J. Migratory animals couple biodiversity and ecosystem functioning worldwide. Science 2014, 344, 1242552. [Google Scholar] [CrossRef]
  8. Hu, G.; Lim, K.S.; Horvitz, N.; Clark, S.J.; Reynolds, D.R.; Sapir, N.; Chapman, J.W. Mass seasonal bioflows of high-flying insect migrants. Science 2016, 354, 1584–1587. [Google Scholar] [CrossRef] [Green Version]
  9. Chapman, J.W.; Drake, V.A.; Reynolds, D.R. Recent insights from radar studies of insect flight. Annu. Rev. Entomol. 2011, 56, 337–356. [Google Scholar] [CrossRef] [Green Version]
  10. Chapman, J.W.; Reynolds, D.R.; Smith, A.D. Vertical-looking radar: A new tool for monitoring high-altitude insect migration. BioScience 2003, 53, 503–511. [Google Scholar] [CrossRef] [Green Version]
  11. Cui, K.; Hu, C.; Wang, R.; Sui, Y.; Mao, H.F.; Li, H.Y. Deep-learning-based extraction of the animal migration patterns from weather radar images. Sci. China Inf. Sci. 2020, 63, 140304. [Google Scholar] [CrossRef] [Green Version]
  12. Schaefer, G.W. Radar observations of insect flight. Proc. Symp. R. Entomol. Soc. Lond. 1976, 7, 157–197. [Google Scholar]
  13. Chapman, J.W.; Smith, A.D.; Woiwood, I.P.; Reynolds, D.R.; Riley, J.R. Development of Vertical-Looking Radar Technology for Monitoring Insect Migration. Comput. Electron. Agric. 2002, 35, 95–110. [Google Scholar] [CrossRef]
  14. Drake, V.A.; Chapman, J.W.; Lim, K.S.; Reynolds, D.R.; Riley, J.R.; Smith, A.D. Ventral-aspect radar cross sections and polarization patterns of insects at X band and their relation to size and form. Int. J. Remote Sens. 2017, 38, 5022–5044. [Google Scholar] [CrossRef]
  15. Dean, T.J.; Drake, V.A. Monitoring insect migration with radar: The ventral-aspect polarization pattern and its potential for target identification. Int. J. Remote Sens. 2005, 26, 3957–3974. [Google Scholar] [CrossRef]
  16. Drake, V.A. Distinguishing target classes in observations from vertically pointing entomological radars. Int. J. Remote Sens. 2016, 37, 3811–3835. [Google Scholar] [CrossRef]
  17. Riley, J.R.; Reynolds, D.R. Radar-based Studies of the Migratory Flight of Grasshoppers in the Middle Niger Area of Mali. Proc. R. Soc. B Biol. Sci. 1979, 204, 67–82. [Google Scholar]
  18. Hu, C.; Kong, S.Y.; Wang, R.; Long, T.; Fu, X.W. Identification of Migratory Insects from their Morphological Features using a Decision-Tree Support Vector Machine and its Application to Radar Entomology. Sci. Rep. 2018, 8, 5449. [Google Scholar] [CrossRef] [PubMed] [Green Version]
  19. Aldhous, A.C. An Investigation of the Polarisation Dependence of Insect Radar cross Sections at Constant Aspect. Ph.D. Thesis, Cranfield Institute Technology, Cranfield, UK, 1989. [Google Scholar]
  20. Hobbs, S.E.; Aldhous, A.C. Insect ventral radar cross section polarisation dependence measurements for radar entomology. IEE Proc. Radar Sonar Navig. 2006, 153, 502–508. [Google Scholar] [CrossRef] [Green Version]
  21. Hu, C.; Li, W.D.; Wang, R.; Long, T.; Liu, C.J.; Drake, V.A. Insect Biological Parameter Estimation Based on the Invariant Target Parameters of the Scattering Matrix. IEEE Trans. Geosci. Remote Sens. 2019, 57, 6212–6225. [Google Scholar] [CrossRef]
  22. Wang, R.; Hu, C.; Liu, C.J.; Kong, S.Y.; Lang, T.J. Migratory Insect Multifrequency Radar Cross Sections for Morphological Parameter Estimation. IEEE Trans. Geosci. Remote Sens. 2018, 57, 3450–3461. [Google Scholar] [CrossRef]
  23. Cortes, C.; Vapnik, V.N. Support-vector networks. Mach. Learn. 1995, 20, 273–297. [Google Scholar] [CrossRef]
  24. Smola, A.J.; Schölkopf, B. A tutorial on support vector regression. Stat. Comput. 2004, 14, 199–222. [Google Scholar] [CrossRef] [Green Version]
  25. Brereton, R.G.; Lloyd, G.R. Support vector machines for classification and regression. Analyst 2010, 135, 230–267. [Google Scholar] [CrossRef] [PubMed]
  26. Pasolli, E.; Melgani, F.; Alajlan, N.; Bazi, Y. Active learning methods for biophysical parameter estimation. IEEE Trans. Geosci. Remote Sens. 2012, 50, 4071–4084. [Google Scholar] [CrossRef]
  27. Schwieder, M.; Leitaoão, P.J.; Suess, S.; Senf, C.; Hostert, P. Estimating Fractional Shrub Cover Using Simulated EnMAP Data: A Comparison of Three Machine Learning Regression Techniques. Remote Sens. 2014, 6, 3427–3445. [Google Scholar] [CrossRef] [Green Version]
  28. Sasan, V.; Javad, S.; Kamran, A.; Hadi, F.; Hamed, N.; Tien, P.; Dieu, B. Improving accuracy estimation of forest aboveground biomass based on incorporation of ALOS-2 PALSAR-2 and Sentinel-2A imagery and machine learning: A case study of the hyrcanian forest area (Iran). Remote Sens. 2018, 10, 172. [Google Scholar]
  29. Basak, D.; Srimanta, P.; Patranbis, D.C. Support vector regression. Neural Inf. Process. 2007, 11, 10. [Google Scholar]
  30. Wolf, W.W.; Vaughn, C.R.; Harris, R.; Loper, G.M. Insect radar cross-sections for aerial density measurements and target classification. Trans. Am. Soc. Agric. Eng. 1993, 36, 949–954. [Google Scholar] [CrossRef]
  31. Fang, J.; Tai, D. Evaluation of mutual information, genetic algorithm and SVR for feature selection in QSAR regression. Curr. Drug Discov. Technol. 2011, 8, 107–111. [Google Scholar] [CrossRef]
  32. Huang, C.; Davis, L.S.; Townshend, J.R.G. An assessment of support vector machines for land cover classification. Int. J. Remote Sens. 2002, 23, 725–749. [Google Scholar] [CrossRef]
  33. Guyon, I.; Weston, J.; Barnhill, S.; Vapnik, V. Gene selection for cancer classification using support vector machines. Mach. Learn. 2002, 46, 389–422. [Google Scholar] [CrossRef]
  34. Ren, X.; Li, Y.; Liu, X.; Shen, X.; Gao, W.; Li, J. Computational identification of antigenicity-associated sites in the hemagglutinin protein of A/H1N1 seasonal influenza virus. PLoS ONE 2015, 10. [Google Scholar] [CrossRef] [PubMed] [Green Version]
  35. Chang, C.C.; Lin, C.J. Libsvm: A library for support vector machines. ACM Trans. Intell. Syst. Technol. 2011, 2, 27. [Google Scholar] [CrossRef]
  36. Wang, R.; Hu, C.; Fu, X.W.; Long, T.; Zeng, T. Micro-doppler measurement of insect wing-beat frequencies with W-band coherent radar. Sci. Rep. 2017, 7, 1396. [Google Scholar] [CrossRef] [PubMed] [Green Version]
Figure 1. Laboratory equipment for the measurement of insect radar cross section (RCS) parameters in the microwave anechoic chamber. (a) Experimental rig; (b) experimental insect attached to a short polyethylene line; (c) transmitting and receiving dual-polarization antennas working in the X band.
Remotesensing 12 01903 g001
Figure 2. Relation between insect mass estimation accuracy and the number of features. Note: the number of features was selected based on the importance ranking.
Remotesensing 12 01903 g002
Figure 3. The fitting relation of RCS parameters and mass: (a) logarithm of a 0 versus mass; (b) logarithm of σ y y versus mass; (c) logarithm of ν versus mass; (d) logarithm of d versus mass; (e) logarithm of a 0 and α 2   versus mass. Note: For (a–d), □ represents dataset D; ◁ represents dataset L; ❉ represents dataset L; and ○ represents dataset K.
Remotesensing 12 01903 g003
Table 1. Species and mass of experimental insects.
Species NumberSpeciesQuantityMass (mg)
1Helicoverpa armigera (Hübner)3167.8–199.2
2Loxostege sticticalis (Linnaeus)1926–101.5
3Mythimna separata (Walker)15103.7–234.8
4Ascotis selenaria (Schiffermuller et Denis)1340.9–172.3
5Agrotis ypsilon (Rottemberg)13134.8–401.3
6Psilogramma menephron (Gramer)11314.6–964
7Conogethes punctiferalis (Guenée)1126.5–47.3
8Holotrichia convexopyga (Moser)9301.3–735.4
9Diaphania quadrimaculalis (Bremer et Grey)725.6–80.1
10Agrotis putris (Linnaeus)640.1–102.8
11Semiothisa cinerearia (Bremer et Grey)577.3–96.4
12Theretra japonica (Orza)4294.9–387.7
13Deilephila elpenor (Linnaeus)4456.1–722.6
14Macdunnoughia crassisigna (Warren)460.6–85
15Diaphania indica (Saunders)430.8–52
16Percnia luridaria nominoneura (Prout)357.5–116
17Reticulitermes chinensis (Snyder)335.5–44.7
18Emmelia trabealis (Scopoli)225.8–34.7
19Stilprotia salicis (Linnaeus)2131.9–298.5
20Melicleptria scutosa (Schiffermüller)257.6–94
21Ostrinia nubilalis (Hübner)137.8
Table 2. Experimental datasets included in this research 1.
DatasetQuantityMass (mg)Measurement Range (GHz)
D1569–41209.4 or 10
L391.83–80.19.4
M1233–1094.110
K16925.6–9648.25–11.75
1 See Section 2.1. for details of sources of datasets (D, L, M and K).
Table 3. Extracted features for insect mass estimation based on support vector regression (SVR). Note: the features were ranked based on the feature importance in estimating insect mass.
No.FeatureNo.FeatureNo.Feature
1 log 10 d 6 ( log 10 a 0 ) 2 11 ( log 10 d ) 2
2 log 10 ν 7 α 4 12 ( log 10 ν ) 3
3 α 2 8 log 10 ( σ x x / σ y y ) 13 ( log 10 σ y y ) 2
4 log 10 a 0 9 ( log 10 a 0 ) 3 14 ( log 10 d ) 3
5 log 10 σ y y 10 ( log 10 ν ) 2 15 ( log 10 σ y y ) 3
Table 4. Comparison of mean relative error (MRE) between traditional methods and SVR in estimating insect mass.
MethodMRE
Aldhous et al. (1989) log 10 σ y y 29.03%
Chapman et al. (2002) log 10 a 0 33.91%
Drake et al. (2017) log 10 a 0   &   α 2 24.50%
Hu et al. (2019) log 10 ν 27.24%
log 10 d 27.43%
SVR22.00%

