Abstract
Individual tree detection (ITD) locates plants from images to estimate monitoring parameters, helping the management of forestry and agriculture systems. As a low-cost solution to help farm monitoring, digital surface models are increasingly involved together with mathematical morphology techniques within the framework of ITD tasks. However, morphology-based approaches are prone to omission and commission errors due to the shape and size of structuring elements. To reduce the error rate in ITD tasks, we introduce a morphological transform that is based on the local maxima segmentation (Cumulative Summation of Extended Maxima transform (SEMAX)) with the aim to enhance the seed selection by extracting information collected from different heights. Validation is performed on data collected from the plantations of citrus and avocado using different measures of precision. The results obtained by the SEMAX approach show that the devised ITD algorithm provides enough accuracy, and achieves the lowest false-negative rate than other compared state-of-art approaches do.
1. Introduction
Individual tree detection (ITD) locates plants from images to estimate agronomic parameters (like spatial distribution, crown sizes, and vegetation fraction), promoting the management of forestry and agriculture systems []. In fruit plantations, the monitoring parameters allow assessing tree density growth, orchard biomass changes, and fruit yield production []. At vast plantations, remote sensing technologies facilitate the extraction of ITD-based parameters, employing satellite images that may be acquired by a wide variety of sensors at several spectral and spatial resolutions [,]. Nonetheless, related to ITD systems, the use of satellite data suffers from a long repetition cycle and coarse resolutions, limiting its usage in those applications that involve small areas or time-sensitive decisions []. So, both (spatial and temporal) resolutions could be improved using private satellites, but they are more expensive [].
To alleviate the monitoring expenses of small or medium-size areas, recent technological advances in aerospace engineering have introduced airborne imagery through cameras mounted on unmanned aerial vehicles (UAV), offering a trade-off between cost and spatial resolution []. Additional benefits of UAV images may include: collecting data from areas in short times, gathering data without affecting the crop, and flight mission scheduling according to the growth stages of plantations []. Besides, the UAV sensors can combine information acquired from several imaging modalities (like LIDAR, hyperspectral, multispectral, and RGB). In practice, aircraft can be outfitted with either LIDAR or photogrammetric technology surveying, being the first one an accurate alternative for getting a bare earth survey on land cluttered with vegetation. However, we employ the latter type, relying on new software advances that can achieve similar results using more affordable equipment []. In particular, modern photogrammetry incorporates automatic methods for the acquisition of digital surface models (DSM), which supply elevation data with accurate information about shape, size, and height of trees [,]. Although basic feature extraction techniques can be applied to these surface models (e.g., Hough transform in []), some factors may deter the accuracy of estimated tree patterns, like the type, ages, and the presence of overlapping canopies. To overcome this issue, the DSM-based approaches can benefit from the regularity of tree forms using mathematical morphology techniques, which are specially developed for geometrical structure analysis of object-based images []. Morphological methods include opening and closing transforms, as well as the Gaussian-based multi-scale watershed transforms that reduce the acquisition and registration noise, raising the detection accuracy of trees [,]. Nonetheless, these approaches based on structuring elements necessitate an internal parameter tuning that may result in procedures with an exhaustive computational burden [].
Under the assumption that every pruned tree holds a single treetop, morphological filtering of local maxima (LM) is frequently applied to produce a binary image that contains the local contrast information, showing to be less sensitive to the variability of structuring elements. Thus, within a region growing procedure, the LM filter is employed to designate as a treetop each local maximum [,,]. However, the terrain slope of hillsides may distort the false local maximum []. To cope with this issue, a morphology-based approach suggested in [] incorporates a detection strategy using cells, which have a single potential treetop, matching each cell with the available template sets. Besides, the FindTreesCHM algorithm introduces a piecewise threshold tuning within sliding windows []. A probabilistic approach is also proposed to combine LM with orientating information to extract treetops, utilizing several height thresholds to reduce the false positive rate []. However, the above-described LM procedures still have several difficulties in dealing with irregular patterns of hillside terrains [].
Intending to improve the ITD precision, we develop an LM-based filter that enhances the region growing procedure by extracting more information from different tree heights planted at irregular patterns and hillside terrain. We use widely-known metrics for evaluating tree-object extraction to assess the algorithm performance in three farms, holding plantations of citrus and avocado trees and having different orchard field types: tree height, species, stand ages, and spacing. The obtained results show that the devised LM-based filter provides enough accuracy of individual tree detection at distinct heights, and achieves the lowest false-negative rate than other compared state-of-art approaches do.
This paper is organized as follows: Section 2 “Materials and Methods” describes the tested regions for validating our proposal and explains the proposed ITD procedures using the extended maxima transform summation; Section 3 “Results and Discussion” contains several state-of-the-art methods followed by their analysis; and finally, Section 4 concluding remarks are provided.
2. Materials and Methods
Study Area and Dataset: We evaluate the methodology for individual tree detection that relies on the local maxima summation to improve the seed selection by extracting information from several heights (The source code and dataset could be found in the repository (https://github.com/dggarciam/Treedetection_citrus_and_avocado)). The data is recorded by a Phantom 3 Professional equipped with its commercial sensor (flight parameters and sensor specifications are shown in Table 1 and Table 2). The tested DSM data are obtained from three farms, each one having an orchard field with a different type of trees (height, species, stand ages, and spacing). As displayed in Figure 1a, we select six images with the following orchard tree characteristics: From Farm # 1, region A that holds 132 avocado trees with regular spacing, region B, having 89 citrus trees with overlapping canopies as well as different stand ages. From Farm # 2, region C (193 citrus trees) and region D (83 citrus trees) that present the most overlapped canopies and the lowest image resolution (see Figure 1b). Lastly, region E (with 172 citrus trees) and region F (203 citrus trees) are collected from Farm # 3, both of them varying in height and slightly intersecting the tree canopies (see Figure 1c). Note that the chosen plantations have been pruned, and therefore almost every tree holds a single treetop. Besides, we do not use the ground control points in the present work.

Table 1.
Flight unmanned aerial vehicles (UAV) parameters employed for collecting aerial data from the tested orchard farms.
Table 2.
Technical specifications of the UAV camera used for image acquisition.
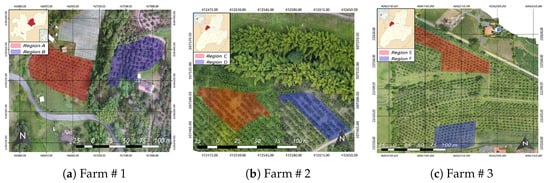
Figure 1.
Tested Colombian orchard fields. Scenes and crop locations of evaluated trees: citrus (shaded in red color) and avocado (shaded in blue).
As a rule, tree labeling is not usually performed on the DSM representation due to the presence of noisy regions that may resemble some plantation shapes. Instead, labeling is performed on the RGB representation that allows identifying directly from the original picture, whether one region can be labeled as a single tree. As stated in [,], this situation makes many studies use manually delineated tree crowns as reference data. However, such data could include subjective errors [].
Preprocessing stage: The DSM models are created using Pix4Dmapper Pro photogrammetry software (version 4.1.3) that imports a densified point cloud set that is generated by an external source of UAV imagery. Then, we calculate the corresponding DSM, extracting high-quality maps []. Then, we calculate a single high-quality DSM map per each farm [], obtaining the following number of matching points: 2,479,502, 16,664.3, and 15,556.9, for each one of the orchard areas, denoted as Farm # 1, #2, and #3, respectively). Afterward, the filter noise procedure smooths surfaces and merges tiles, resulting in DSM data with a spatial resolution adjusted to cm, cm, and cm in each one of the tested orchard farms, respectively.
Image Segmentation using Extended Maxima Transform: Let be a real-valued function that maps a gray-tone pixel into a subset f. Thus, the morphological reconstruction yields a scalar-valued image, , computed as follows []:
where is a template image, is a functional that provides the convergence rule: , and is a geodesic dilation of f performed at step i as . Notation ∧ stands for the pixel-wise minimum operator.
Further, the tree detection relies on the extracted information from an individual interest region. Thus, using the morphological reconstruction in Equation (1), the objects of interest are initially detected by Extended Maxima transform (EMAX), noted as , and performed as follows []:
where is the regional maxima transform that operates on the shifted argument by saturating the pixels, which have an intensity higher than a given threshold of .
Therefore, an object represented by Equation (2) yields a binary image of connecting pixels, given as , where is the set of pixel coordinates, belonging to k-th regional maxima, and K is the total number of linked components. A frequently employed method of linking components is to connect neighboring pixels pairwise, describing a closed-form object with the largest perimeter. Thus, object segmentation is accomplished through an algorithm of region growing (namely, the watershed transform), segmenting images from their local minima set to the corresponding peaks. Nonetheless, the object images of considered farms hold high spatial resolution, so that they may have more than one maximum within each tree crown, causing over-segmentation. To cope with this situation, watershed approaches can be combined with local maxima detection to restrict the number of local maxima to one within one segment []. Concretely, we apply the marker-controlled watershed strategy that limits the number of the local maximum of f through a marker image, , containing the connected components of nonzero pixels within each of the desired objects. For the latter representation, we assume that the minima imposition is an image transformation that modifies an input grayscale image in such a way that the only remaining minima are those given by an additional input image []. Thus, we define the marker image as follows:
where , is the image functional that provides the convergence rule , and is the geodesic erosion of performed at step i. Notation ∨ stands for the pixel-wise maximum operator.
Cumulative Summation of Extended Maxima Transform: For diminishing the threshold influence on Equations (2) and (3), we propose to evaluate the Cumulative Summation of Extended Maxima transform (SEMAX) and computed over a query image as below:
where is a set of N ranked threshold values, . Hence, the SEMAX rule aggregates stepwise each one of the ranked regional maxima values, which are ordered from the least to the most restrictive threshold.
To make clear our rationale behind the proposed SEMAX transform, Figure 2 displays a 1-D scenario of tree detection through morphological mapping using a region of interest extracted from DSM data. The top plot in Figure 2b shows the trees and noise objects, which are placed in a single row (marked with a magenta line), and denoted by blue and red circles, respectively. The bottom plot of Figure 2b shows one slide of heights (marked with the red line) for which SEMAX and EMAX are performed. For illustration, the latter transform is computed at different values of h (blue lines). Note that the ground-truth trees are shadowed by gray color. As seen, the EMAX transform is highly dependent on the considered threshold, resulting in several spurious maxima, while the high thresholds neglect low-height objects. The dashed line draws the optimal EMAX result, showing that not all the trees are extracted due to the differences between the treetop heights. Besides, both extracted regions (related to noise and trees) are very alike. Instead, the slide performed by SEMAX (marked with a black line) shows that the transform performs as a detrending filter so that a single threshold is required to detect all objects. Furthermore, the 1-D representation of SEMAX shows that the noise regions fade faster and become smoother than the ones performed by the trees, enabling a better object distinction from noise. Relying on this fact, we assess the evenness of the SEMAX morphological gradient for a region as below:
where denotes -norm.
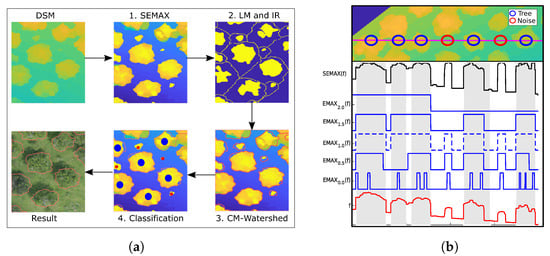
Figure 2.
Framework of the proposed Cumulative Summation of Extended Maxima transform (SEMAX) methodology for automatic tree detection. (a) Pipeline of processing stages; (b) 1-D representation of compared morphological transforms.
Figure 2a displays the framework proposed for enhanced tree detection that is computed following the algorithm displayed in Algorithm 1. Initially, the SEMAX transform is applied over each image region using the mesh of linearly distributed thresholds , being the threshold step that is adjusted to the image resolution. Secondly, the EMAX transform over the SEMAX map provides a binary image of candidate treetops. Next, we compute the controlled-marker watershed over the SEMAX morphological gradient, imposing the candidate treetops and the boundaries among them as seeds. Lastly, we label each region as a tree that assesses a higher evenness measure, exceeding a given decision threshold that is denoted as . As seen in in Figure 2b, the high values of h reduce the number of noisy seeds at the cost of vanishing short trees. To overcome this limitation, we carry out an exhaustive search to adjust both thresholding parameters, h and , maximizing the F1-score.
| Algorithm 1 Proposed SEMAX algorithm for individual tree detection. | ||
| 1: | procedure SEMAX() | ▹ Inputs |
| 2: | ||
| 3: | ||
| 4: | ||
| 5: | ||
| 6: | ||
| 7: | for do | |
| 8: | ||
| 9: | ||
| 10: | ||
| 11: | ▹ Cumulative summation | |
| 12: | ||
| 13: | end for | |
| 14: | ||
| 15: | ▹ Seeds via extended maxima | |
| 16: | ||
| 17: | ▹ Influence zones | |
| 18: | ||
| 19: | ▹ Marker image | |
| 20: | ||
| 21: | ▹ Morphological gradient | |
| 22: | ||
| 23: | ▹ Watershed with minima imposition | |
| 24: | ||
| 25: | ▹ Tree classification | |
| 26: | ||
| 27: | return | |
| 28: | ||
| 29: | end procedure | |
3. Results and Discussion
In the validation stage, the classifier performance obtained by SEMAX for the considered orchard field data is contrasted with three state-of-the-art methods for ITD: morphological gradient Hough transform (GHT) [], controlled marker watershed with imposed LM from DSM (LGW) [], and probabilistic LM with orientation information (PLO) []. For measuring the performance, the tree location reference (selected manually from UAV true-color orthophotos) is contrasted with the one provided automatically by each tested approach using the following evaluating metrics:
where notations , , and are the outcomes of true positive, false positive, and false negative, respectively. The true negative rate is not included in the present evaluation since one image can contain millions of non-tree pixels, producing quite large values of this rate. In addition, to determine whether the detection is correct, we set a maximum distance of 20 cm from the ground-truth to a given detected object.
As shown in Table 3, regions E and F present the highest false-positive values, meaning a lot of noisy objects. This result is explained by the fact that the DSMs extracted from both regions enable high rates of tree misdetection, at least, using GHT, LGW, and PLO algorithms. Instead, our proposal notably reduces the false positive rate of either area. In the remaining regions (A–D), the corresponding DSM representations are less influenced by noise and have about less quantity of false positives. Therefore, we can assume that the ITD approaches benefit from the provided tree shape information so that the extracted DSM data are less affected by noisy objects. This conclusion becomes more evident in the case of region A that achieves the best false positive error.
Table 3.
Classifier accuracy performed by the compared individual tree detection (ITD) approaches. Notation * stands for SEMAX version that incorporates a classifier stage.
As regards the averaged false positive rate, the PLO approach gets, on average, the worst value while achieving the best false-negative error. By contrast, the SEMAX* version that incorporates a classifier stage reaches the best , outperforming notably other contrasting methods. Moreover, the proposed approach decreases the false-positive error in about while increments in the F1-score that is also reported to reflect the balance between both decision-making frameworks ( and ). It is worth noting that both proposed versions (SEMAX and SEMAX*) do not demand additional information about variables like shadows, which can be conditioned by the sun position or the weather, and thus proving to be a promising ITD algorithm.
For illustration, Figure 3 draws the processing stages performed by SEMAX through the evolution of DSM representation for regions A and B, having different types of trees. Both input RGB images in the left column exemplify a tree distribution, which in the concrete case is manually labeled and denoted by the red dots. The middle column pictures the color maps to explain the differences in the terrain level estimated by DSM, while the right column depicts the resulting SEMAX data. In the case of region A (top row), all treetops are disseminated evenly, and the DSM representation reveals that the separation between ground and canopies is not constant. Thus, the affecting height variations are adjusted to the same level by the proposed operator in Equation (4). However, the landscape of region B holds differences in height with such an uneven tree distribution that causes subtle variations in elevation between the overlapped tree canopies. Consequently, the SEMAX* approach wrongly identifies several cumulus of trees as a single one. Therefore, additional restrictions to the detection task should be incorporated when dealing with overlapped canopies together with uneven sowing patterns.

Figure 3.
Stepwise illustration of the developed SEMAX algorithm for regions A and B of the validated Orchard Fields.
The following aspect of consideration is the parameter influence (namely, the threshold) on the tree detection rate that is depicted in Figure 4. The X-axis denotes the recall value that is the fraction of the total amount of relevant instances (trees) that are actually retrieved, and the Y-axis represents the precision value that is the fraction of relevant instances among the retrieved ones []. Thus, whenever the threshold increases in LGW, PLO, SEMAX, and SEMAX* algorithms, the recall value also rises, meaning that more trees are correctly detected. However, this behavior continues to a certain degree. So, by raising the threshold too high, several noisy regions can be wrongly identified as trees, as more clearly perceived for regions E and F in Figure 3. Note that this situation holds for all algorithms except the case of GHT that should be more related to canopy shape detection rather than treetop identification. Lastly, LGW performs about less true positive rate, on average across regions, due to the treetop heights are highly variable, hindering the tree identification by a single threshold value.
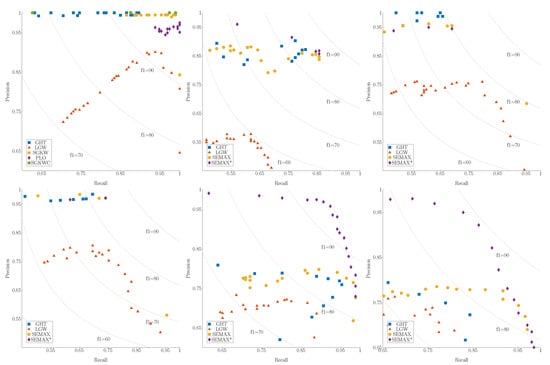
Figure 4.
Precision-recall values for evaluated ITD parameters.
Another aspect to discuss is the algorithm performance in farms having different orchard field types. The region A holds plantations of citrus and avocado trees with regular spacing and soft terrain slope, enabling to extract information from various heights. Hence, the performance of PLO, SEMAX, and SEMAX* provide a similar value. However, the GHT algorithm gets the worst true positive value because of the high variance between the sizes and shapes of trees. Further, the tree detection becomes more complicated in region B that contains citrus trees with overlapping canopies as well as different stand ages, and thus resulting in poor recall and precision values, as seen in Figure 4. Once again, the LGW algorithm fails, obtaining the highest errors of and . In turn, the regions C and D present the most overlapped canopies and the lowest image resolution so that the tested ITD approaches get negligible differences in precision and recall values. Still, the fact that the regions have a high terrain slope results in dropping the LGW precision. Finally, the regions E and F include significant variations in height with slightly intersecting tree canopies, yielding the lowest precision values in almost all algorithms.
Nevertheless, the SEMAX* algorithm performs the best values, and therefore, it can better deal with noisy DSM data. Even though our method achieves the highest precision, there are still large values of (that is, trees are not detected) when dealing with inaccurate DSM data. In particular, the omission error can arise due to a couple of factors: (i) soft DSM changes between terrain and tree-levels, as shown within a white frame in Figure 5; (ii) high-tree density having their canopies overlapped. One more important issue is the commission error, which is mostly promoted by low spatial resolution. Thus, some shadows are wrongly calculated in the DSM representation as the tree height, misleading the algorithms (see left plot Figure 6). In turn, trees with large canopies tend to have considerable height variations in the DSM data, resulting in two or more local maxima. That is, instead of detecting a single tree, our algorithm may incorrectly yield two or more trees (see the frame of right plot Figure 6).
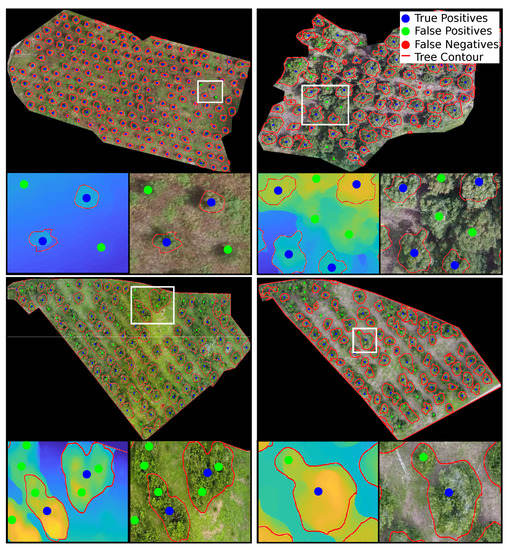
Figure 5.
Results of and 3 data set using SEMAX* approach, where blue, red and green dots represent true positives, false negatives and false positives, respectively.
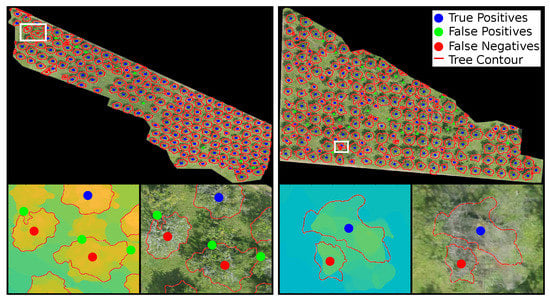
Figure 6.
Results obtained by Farm 2 data set using SEMAX* approach, where blue, red, and green dots represent true positives, false negatives, and false positives, respectively.
Finally, we remark that many false positives and negatives may appear in this study due to the ground-truth is hand-annotated over the RGB image, raising a limitation. Namely, the DSM map is not always aligned with the RGB image, meaning that the treetops selected in the RGB do not correspond to the maxima regions in the DSM map. In consequence, our algorithm does not classify those regions as trees, decreasing the performance.
4. Concluding Remarks
In this study, a new approach is presented to detect citrus and avocado trees from using DSM data. The approach mixes both different height thresholds and a classification step that enhances seed selection. The validated accuracy proves that our proposal reaches an average value of of , providing superior results in comparison with other considered state-of-the-art techniques.
The results obtained in real-world data suggest a potential application of the proposed technique for extracting useful parameters of orchard fields in extensive agricultural areas, and especially, is cases demanding low sensitivity ( values) to overlapped canopies. The information provided, along with smart agriculture techniques, will enhance the efficiency of decision processes like fertilization, detection of crop diseases, update inventories, or crop yield estimation.
Nevertheless, an issue with applying the SEMAX* approach is the tree shape that should have adjacent branches immediately above the main trunk (e.g., olive trees). Otherwise, the number of false positives may increase. Another restriction that may arise is that SEMAX* is developed focusing in orchard zones so that its straightforward application in urban zones is likely to be strongly influenced by buildings or constructions, which may be incorrectly labeled as trees. This issue can be faced by using RGB image sets to extract distinguishing information from color and texture.
One of the challenging issues in the generation of digital surface models from optical stereo imageries is noise reduction that significantly increases the probability of noisy objects wrongly detected as trees []. Therefore, we put more attention into the decision-making framework based on false-positive error. However, in agricultural practices, the optimization must be performed in terms of the decision-making framework that reduces the risk of wasting financial resources derived from each particular case of implementation of individual tree detection systems.
Lastly, we deal with noisy digital surface models that tend to increase the error rate. Therefore, more attention is given to false-positive decision-making framework. As future work, the authors plan to extend the decision-making rule to more performance measures of implementing individual tree detection systems. The validation is to be carried out in plantations with more complex patterns.
Author Contributions
All the authors have made substantial contribution towards this manuscript. All authors have read and agreed to the published version of the manuscript.
Funding
This work was developed under the research project: Caracterización de Cultivos Agrícolas mediante Estrategias de Teledetección y Técnicas de Procesamiento de Imágenes (Hermes-36719) funded by Universidad Nacional de Colombia; CEIBA Foundation (Scholarship Bécate Nariño), and the research project 110180763808 founded by COLCIENCIAS.
Conflicts of Interest
The authors declare no conflicts of interest.
References
- Recio, R.; Hermosilla, T.; Ruiz, L.; Palomar, J. Automated extraction of tree and plot-based parameters in citrus orchards from aerial images. Comput. Electron. Agric. 2013, 90, 24–34. [Google Scholar] [CrossRef]
- Koc-San, D.; Selim, S.; Aslan, N.; San, B. Automatic citrus tree extraction from UAV images and digital surface models using circular Hough transform. Comput. Electron. Agric. 2018, 150, 289–301. [Google Scholar] [CrossRef]
- Zanter, K. Landsat 8 (L8) Data Users Handbook; Landsat Science Offical Website; U.S. Geological Survey: Reston, VA, USA, 2016. [Google Scholar]
- Team, P. Planet Imagery Product Specifications; Planet Team: San Francisco, CA, USA, 2018. [Google Scholar]
- Bausch, W.; Halvorson, A.; Cipra, J. Quickbird satellite and ground-based multispectral data correlations with agronomic parameters of irrigated maize grown in small plots. Biosyst. Eng. 2008, 101, 306–315. [Google Scholar] [CrossRef]
- Rudd, J.; Roberson, G.; Classen, J. Application of satellite, unmanned aircraft system, and ground-based sensor data for precision agriculture: A review. In Proceedings of the ASABE Annual International Meeting, American Society of Agricultural and Biological Engineers, Spokane, WA, USA, 16–19 July 2017; p. 1. [Google Scholar]
- Candiago, S.; Remondino, F.; De Giglio, M.; Dubbini, M.; Gattelli, M. Evaluating multispectral images and vegetation indices for precision farming applications from UAV images. Remote. Sens. 2015, 7, 4026–4047. [Google Scholar] [CrossRef]
- Thomasson, J.; Shi, Y.; Olsenholler, J.; Valasek, J.; Murray, S.; Bishop, M. Comprehensive UAV agricultural remote-sensing research at Texas A and M University. In Autonomous Air and Ground Sensing Systems for Agricultural Optimization and Phenotyping; International Society for Optics and Photonics, 2016; Volume 9866, p. 986602. Available online: https://doi.org/10.1117/12.2234052 (accessed on 20 March 2020).
- Sofonia, J.; Shendryk, Y.; Phinn, S.; Roelfsema, C.; Kendoul, F.; Skocaj, D. Monitoring sugarcane growth response to varying nitrogen application rates: A comparison of UAV SLAM LiDAR and photogrammetry. Int. J. Appl. Earth Obs. Geoinf. 2019, 82, 101878. [Google Scholar] [CrossRef]
- Ok, A.; Ozdarici-Ok, A. 2-D delineation of individual citrus trees from UAV-based dense photogrammetric surface models. Int. J. Digit. Earth 2018, 11, 583–608. [Google Scholar] [CrossRef]
- Díaz-Varela, R.; de la Rosa, R.; León, L.; Zarco-Tejada, P. High-resolution airborne UAV imagery to assess olive tree crown parameters using 3D photo reconstruction: Application in breeding trials. Remote Sens. 2015, 7, 4213–4232. [Google Scholar] [CrossRef]
- Soille, P. Morphological Image Analysis: Principles and Applications; Springer: Berlin/Heidelberg, Germany, 2013. [Google Scholar]
- Jing, L.; Hu, B.; Noland, T.; Li, J. An individual tree crown delineation method based on multi-scale segmentation of imagery. ISPRS J. Photogramm. Remote Sens. 2012, 70, 88–98. [Google Scholar] [CrossRef]
- Huang, H.; Li, X.; Chen, C. Individual tree crown detection and delineation from very-high-resolution UAV images based on bias field and marker-controlled watershed segmentation algorithms. IEEE J. Sel. Top. Appl. Earth Obs. Remote Sens. 2018, 11, 2253–2262. [Google Scholar] [CrossRef]
- Makhlouf, Y.; Daamouche, A. Automatic generation of adaptive structuring elements for road identification in VHR images. Expert Syst. Appl. 2019, 119, 342–349. [Google Scholar] [CrossRef]
- Rizaev, I.; Pogorelov, A.; Krivova, M. A technique to increase the efficiency of artefacts identification in lidar-based canopy height models. Int. J. Remote. Sens. 2016, 37, 1658–1670. [Google Scholar] [CrossRef]
- Mohan, M.; Silva, C.; Klauberg, C.; Jat, P.; Catts, G.; Cardil, A.; Hudak, A.; Dia, M. Individual tree detection from unmanned aerial vehicle (UAV) derived canopy height model in an open canopy mixed conifer forest. Forests 2017, 8, 340. [Google Scholar] [CrossRef]
- Nevalainen, O.; Honkavaara, E.; Tuominen, S.; Viljanen, N.; Hakala, T.; Yu, X.; Hyyppä, J.; Saari, H.; Pölönen, I.; Imai, N.; et al. Individual tree detection and classification with UAV-based photogrammetric point clouds and hyperspectral imaging. Remote Sens. 2017, 9, 185. [Google Scholar] [CrossRef]
- Khosravipour, A.; Skidmore, A.; Wang, T.; Isenburg, M.; Khoshelham, K. Effect of slope on treetop detection using a LiDAR Canopy Height Model. ISPRS J. Photogramm. Remote Sens. 2015, 104, 44–52. [Google Scholar] [CrossRef]
- Yao, C.; Zhang, X.; Liu, H. Section-based tree species identification using airborne lidar point cloud. Int. Arch. Photogramm. Remote Sens. Spat. Inf. Sci. 2017, 42, 1001–1007. [Google Scholar]
- Otero, V.; Van De Kerchove, R.; Satyanarayana, B.; Martínez-Espinosa, C.; Fisol, M.; Ibrahim, M.; Sulong, I.; Mohd-Lokman, H.; Lucas, R.; Dahdouh-Guebas, F. Managing mangrove forests from the sky: Forest inventory using field data and Unmanned Aerial Vehicle (UAV) imagery in the Matang Mangrove Forest Reserve, peninsular Malaysia. For. Ecol. Manag. 2018, 411, 35–45. [Google Scholar] [CrossRef]
- Ok, A.; Ozdarici-Ok, A. Combining Orientation Symmetry and LM Cues for the Detection of Citrus Trees in Orchards From a Digital Surface Model. IEEE Geosci. Remote Sens. Lett. 2018, 15, 1817–1821. [Google Scholar] [CrossRef]
- Pearse, G.; Dash, J.; Persson, H.; Watt, M. Comparison of high-density LiDAR and satellite photogrammetry for forest inventory. ISPRS J. Photogramm. Remote Sens. 2018, 142, 257–267. [Google Scholar] [CrossRef]
- Tochon, G.; Feret, J.; Valero, S.; Martin, R.; Knapp, D.; Salembier, P.; Chanussot, J.; Asner, G. On the use of binary partition trees for the tree crown segmentation of tropical rainforest hyperspectral images. Remote Sens. Environ. 2015, 159, 318–331. [Google Scholar] [CrossRef]
- Zhen, Z.; Quackenbush, L.; Stehman, S.; Zhang, L. Agent-based region growing for individual tree crown delineation from airborne laser scanning (ALS) data. Int. J. Remote Sens. 2015, 36, 1965–1993. [Google Scholar] [CrossRef]
- Liu, T.; Im, J.; Quackenbush, L. A novel transferable individual tree crown delineation model based on Fishing Net Dragging and boundary classification. ISPRS J. Photogramm. Remote Sens. 2015, 110, 34–47. [Google Scholar] [CrossRef]
- Pix4D. Generate 2D and 3D Information, Purely from Images. 2016. Available online: https://pix4d.com/ (accessed on 20 March 2020).
- Duncanson, L.; Cook, B.; Hurtt, G.; Dubayah, R. An efficient, multi-layered crown delineation algorithm for mapping individual tree structure across multiple ecosystems. Remote Sens. Environ. 2014, 154, 378–386. [Google Scholar] [CrossRef]
- Soille, P. Advances in the analysis of topographic features on discrete images. In Proceedings of the International Conference on Discrete Geometry for Computer Imagery, Bordeaux, France, 3–5 April 2002; Springer: Berlin/Heidelberg, Germany, 2002; pp. 175–186. [Google Scholar]
- Murashkin, D.; Spreen, G.; Huntemann, M.; Dierking, W. Method for detection of leads from Sentinel-1 SAR images. Ann. Glaciol. 2018, 59, 124–136. [Google Scholar] [CrossRef]
- Takaku, J.; Iwasaki, A.; Tadono, T. Adaptive filter for improving quality of ALOS PRISM DSM. In Proceedings of the 2016 IEEE International Geoscience and Remote Sensing Symposium (IGARSS), Beijing, China, 10–15 July 2016; pp. 5370–5373. [Google Scholar]
© 2020 by the authors. Licensee MDPI, Basel, Switzerland. This article is an open access article distributed under the terms and conditions of the Creative Commons Attribution (CC BY) license (http://creativecommons.org/licenses/by/4.0/).