The Combined Effect of Orientation Angle and Material on PolSAR Images of Urban Areas

Abstract

1. Introduction
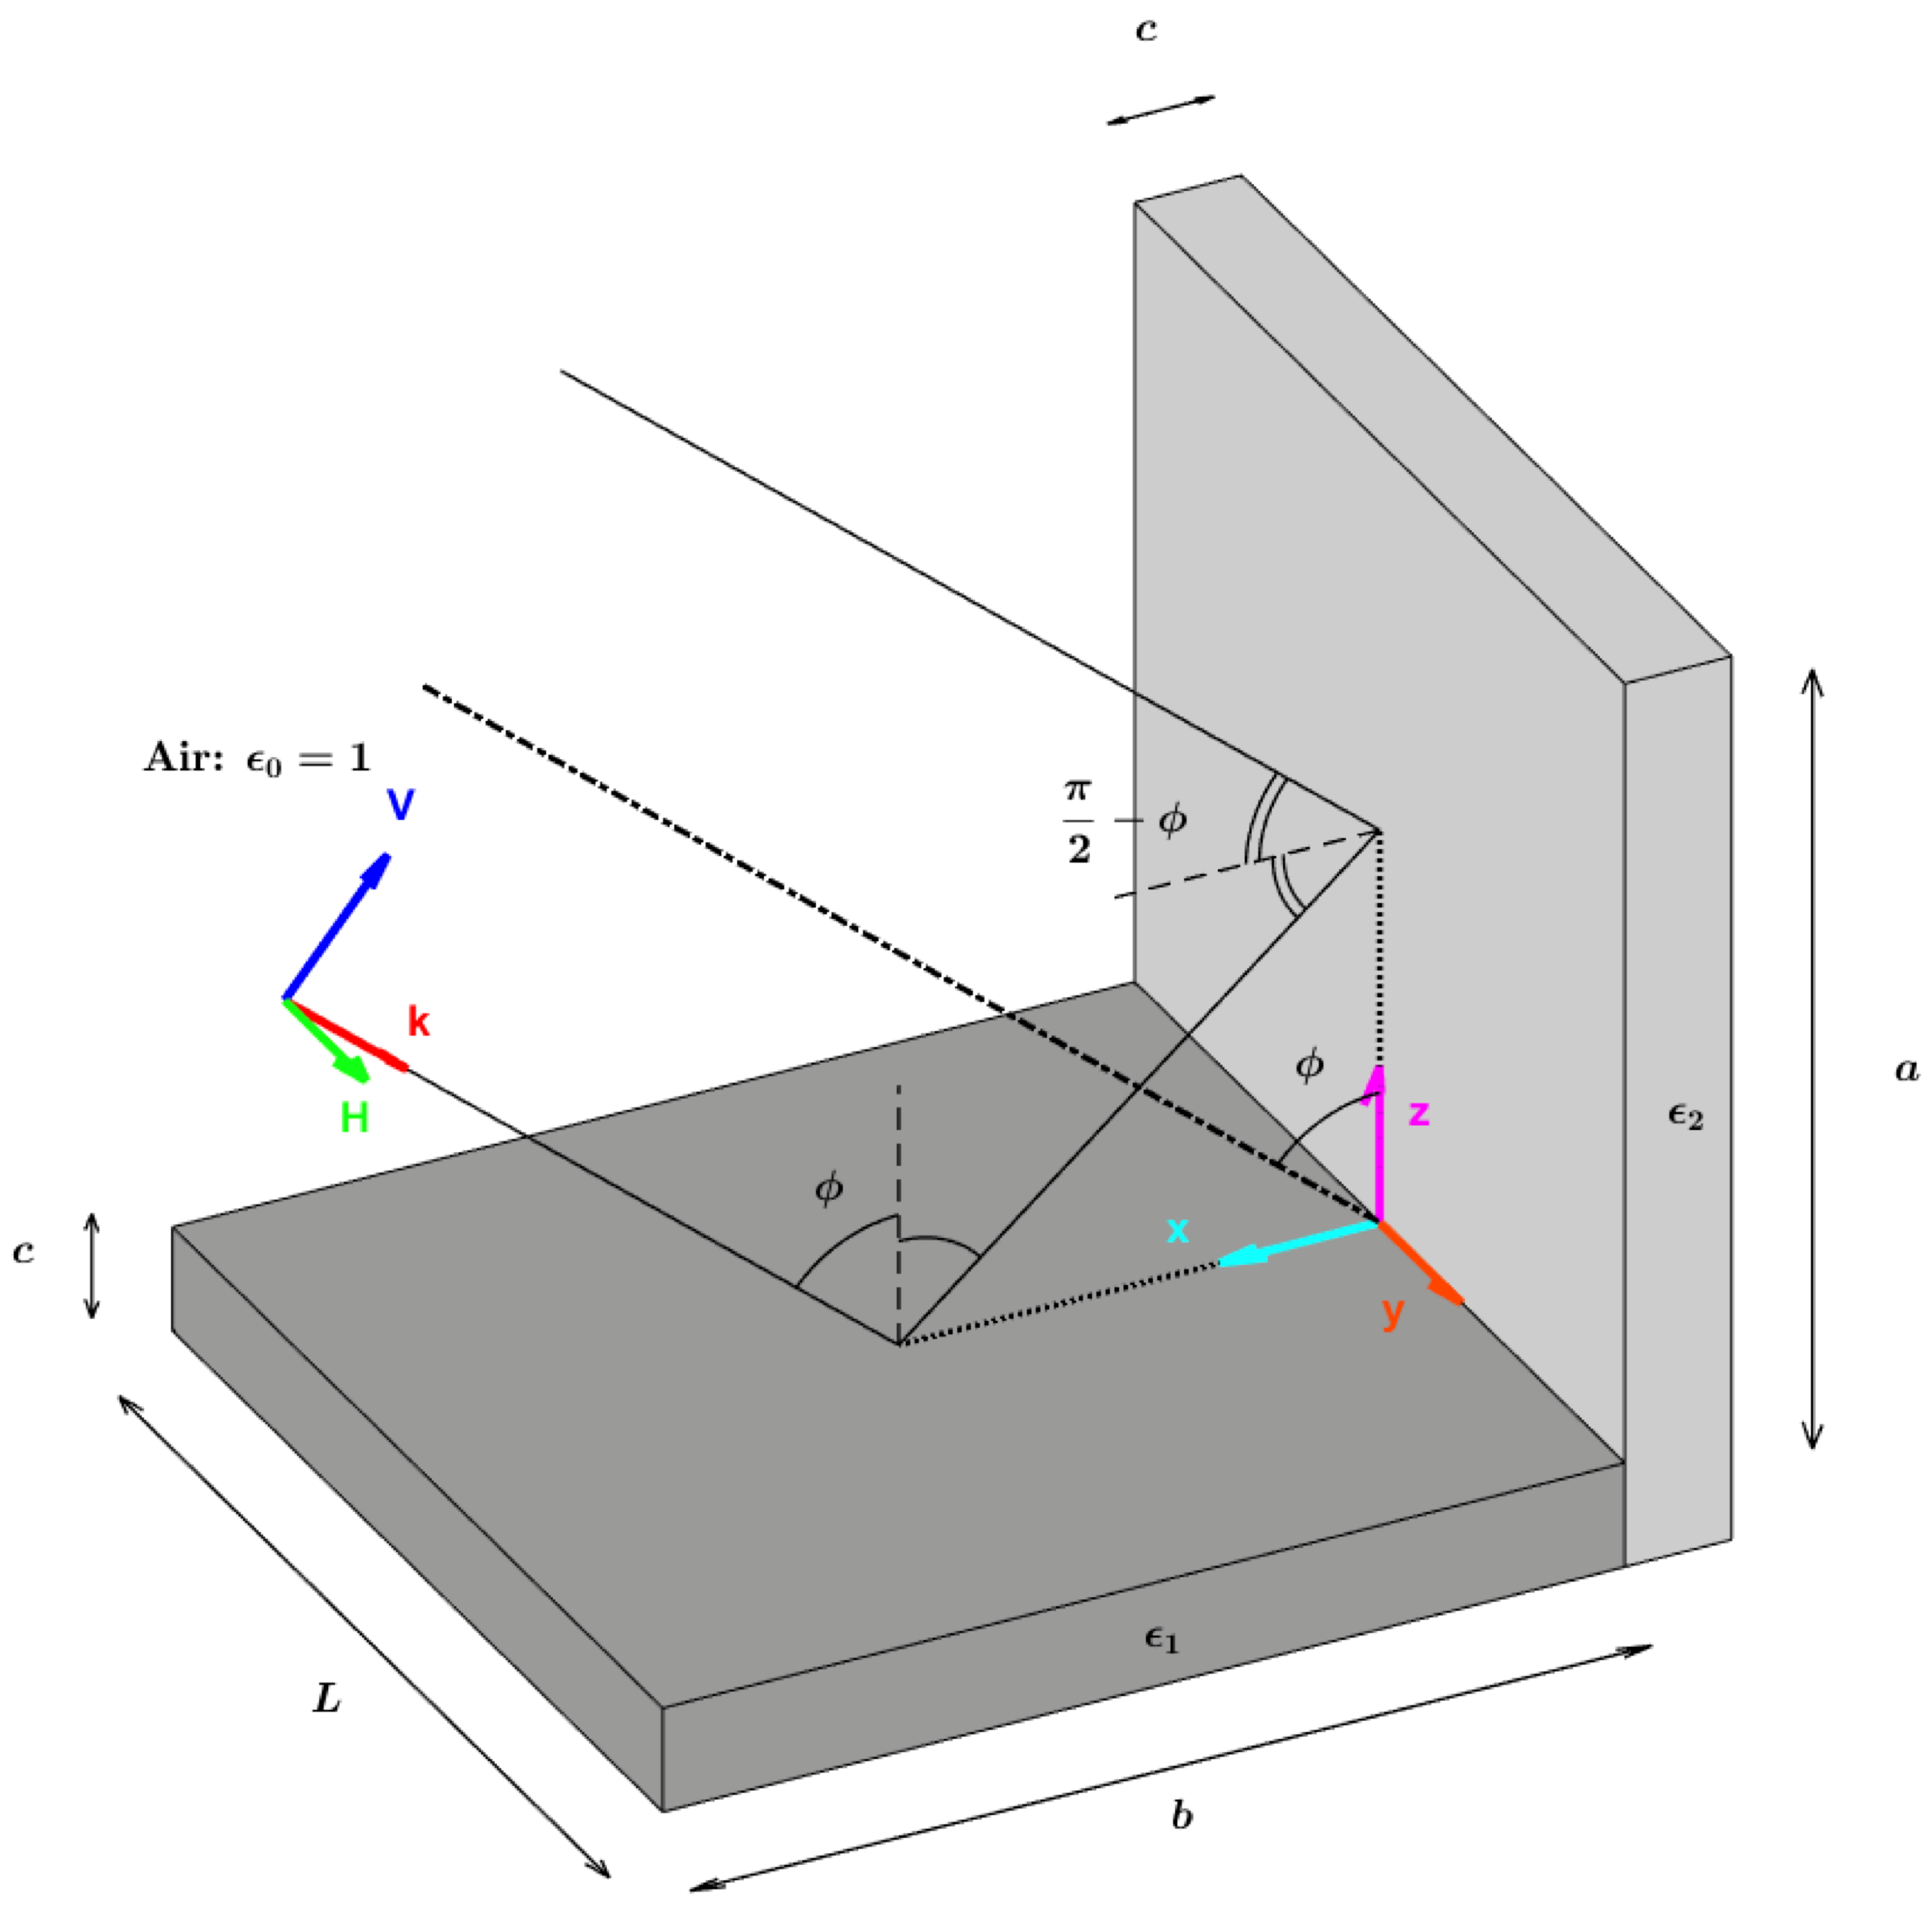
2. The Dielectric Dihedral and the Double Brewster’s Angle Effect
3. Methodology and Data Sets
3.1. Methodology
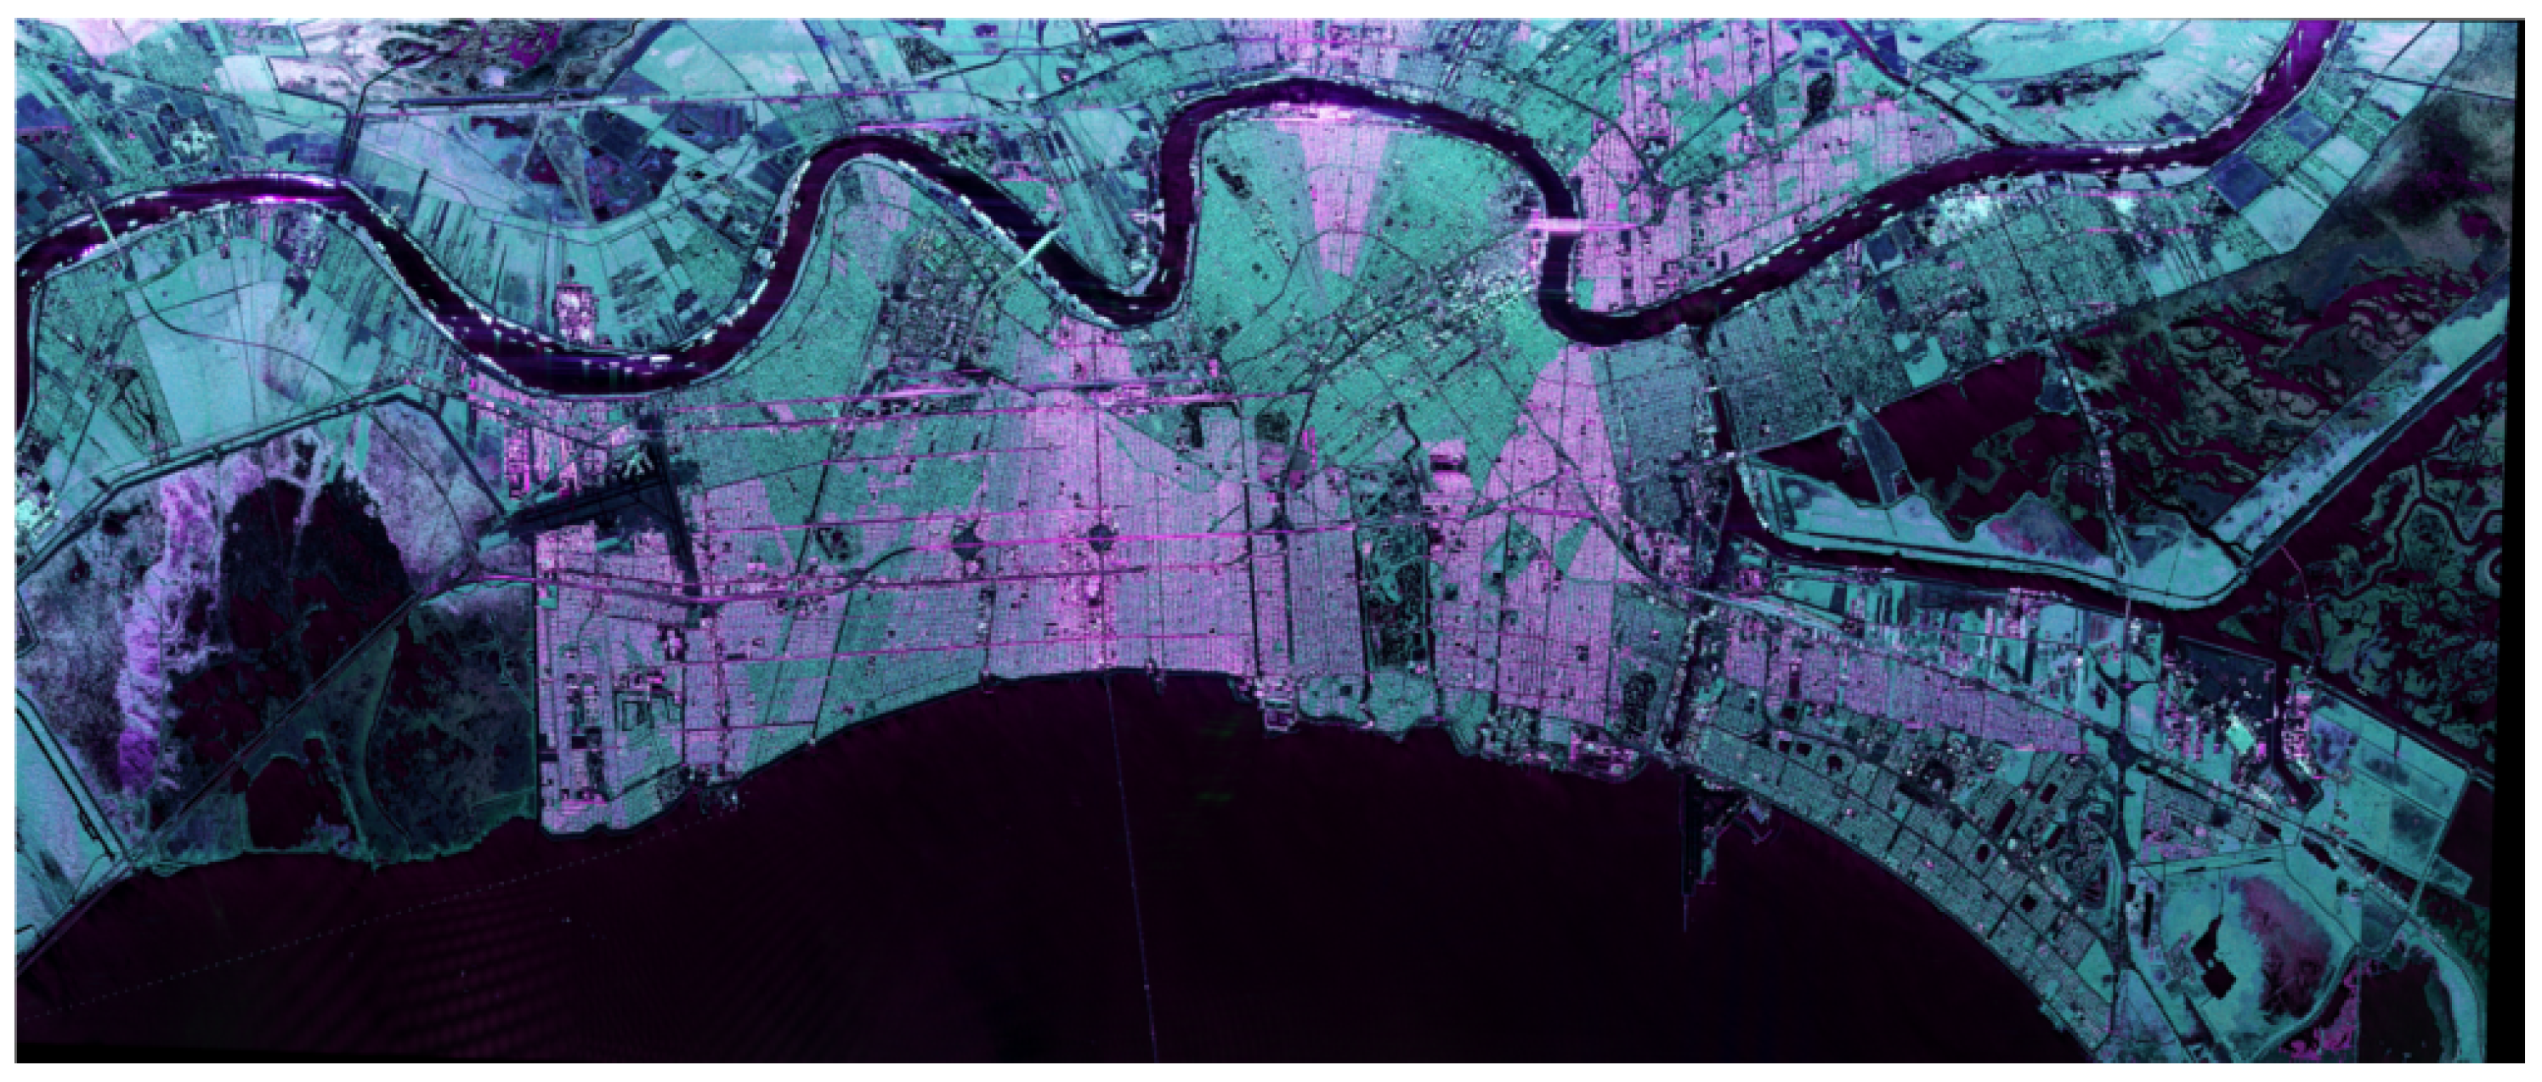
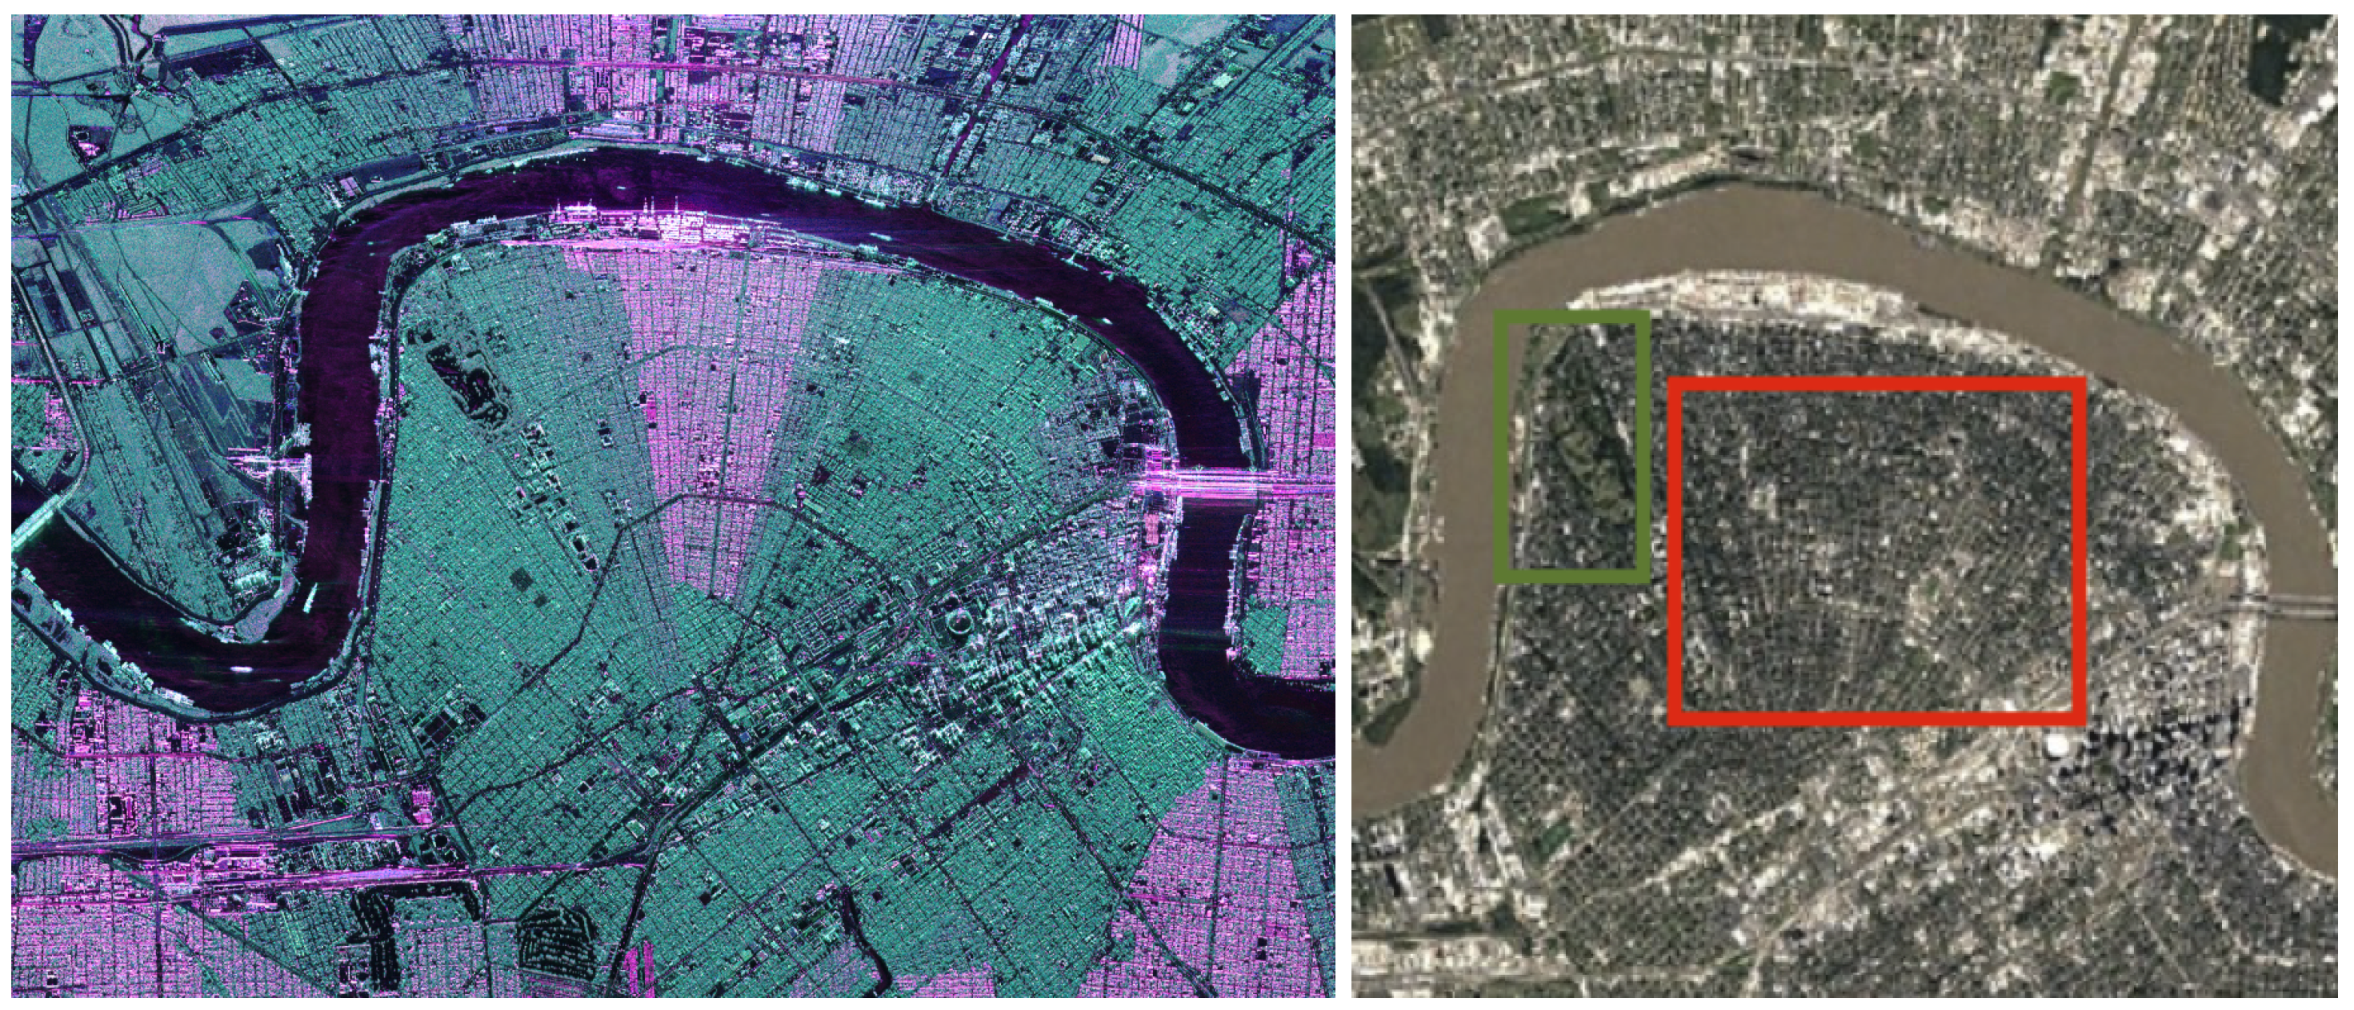
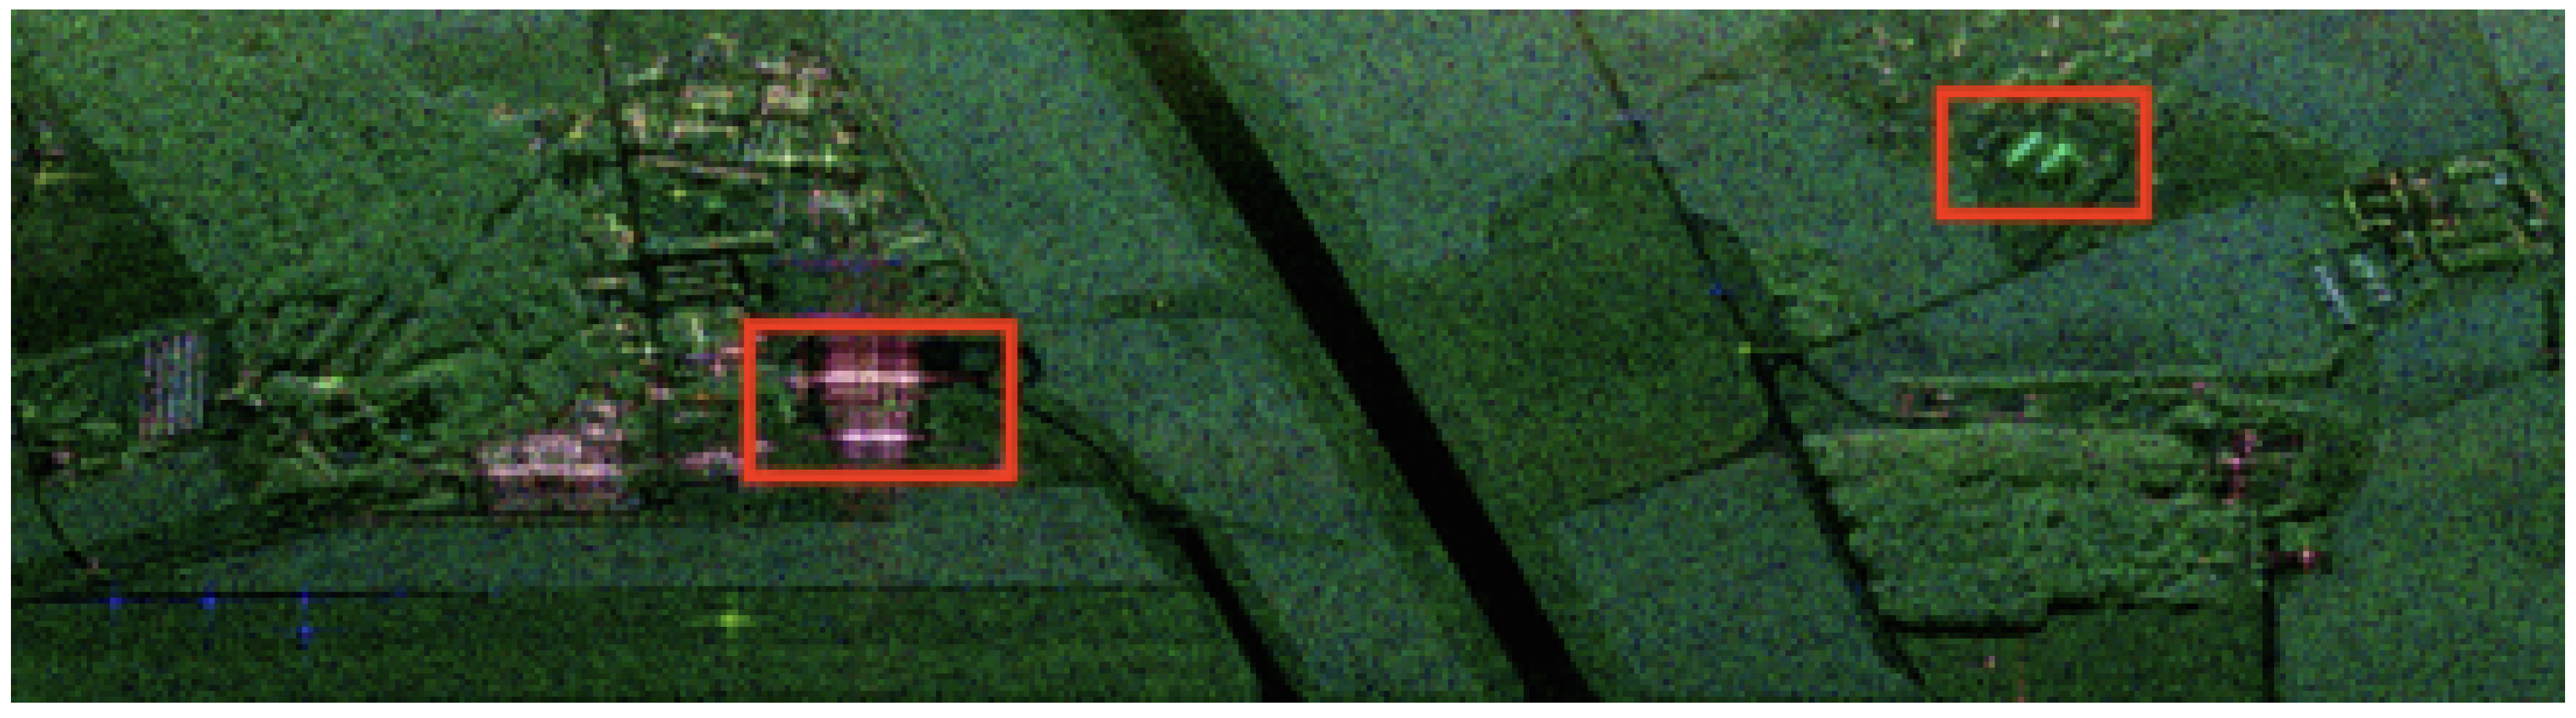
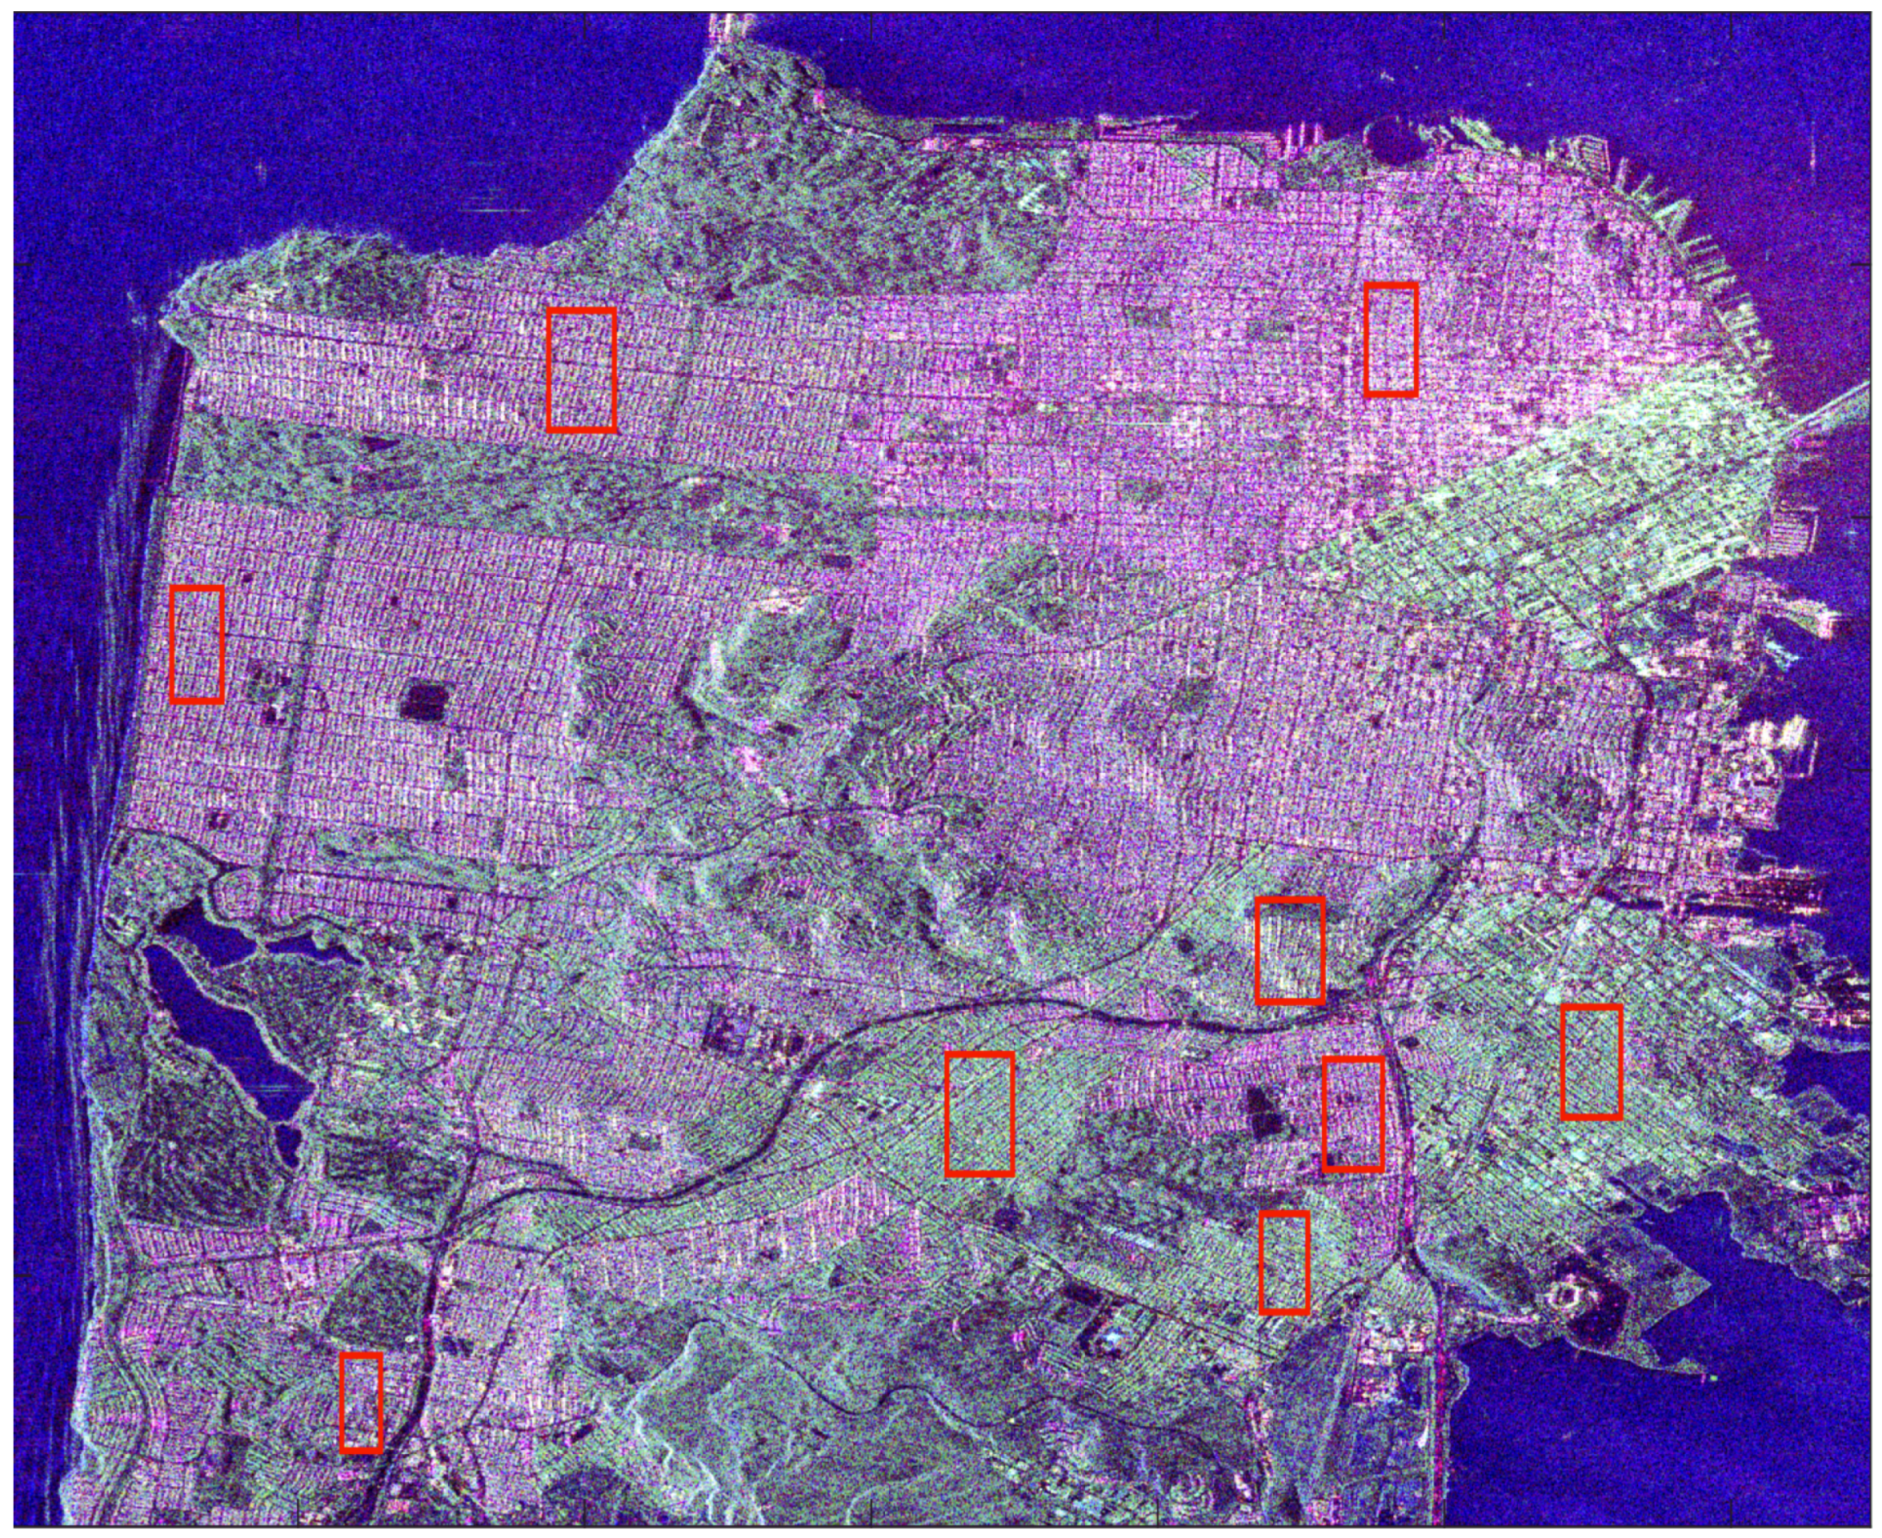
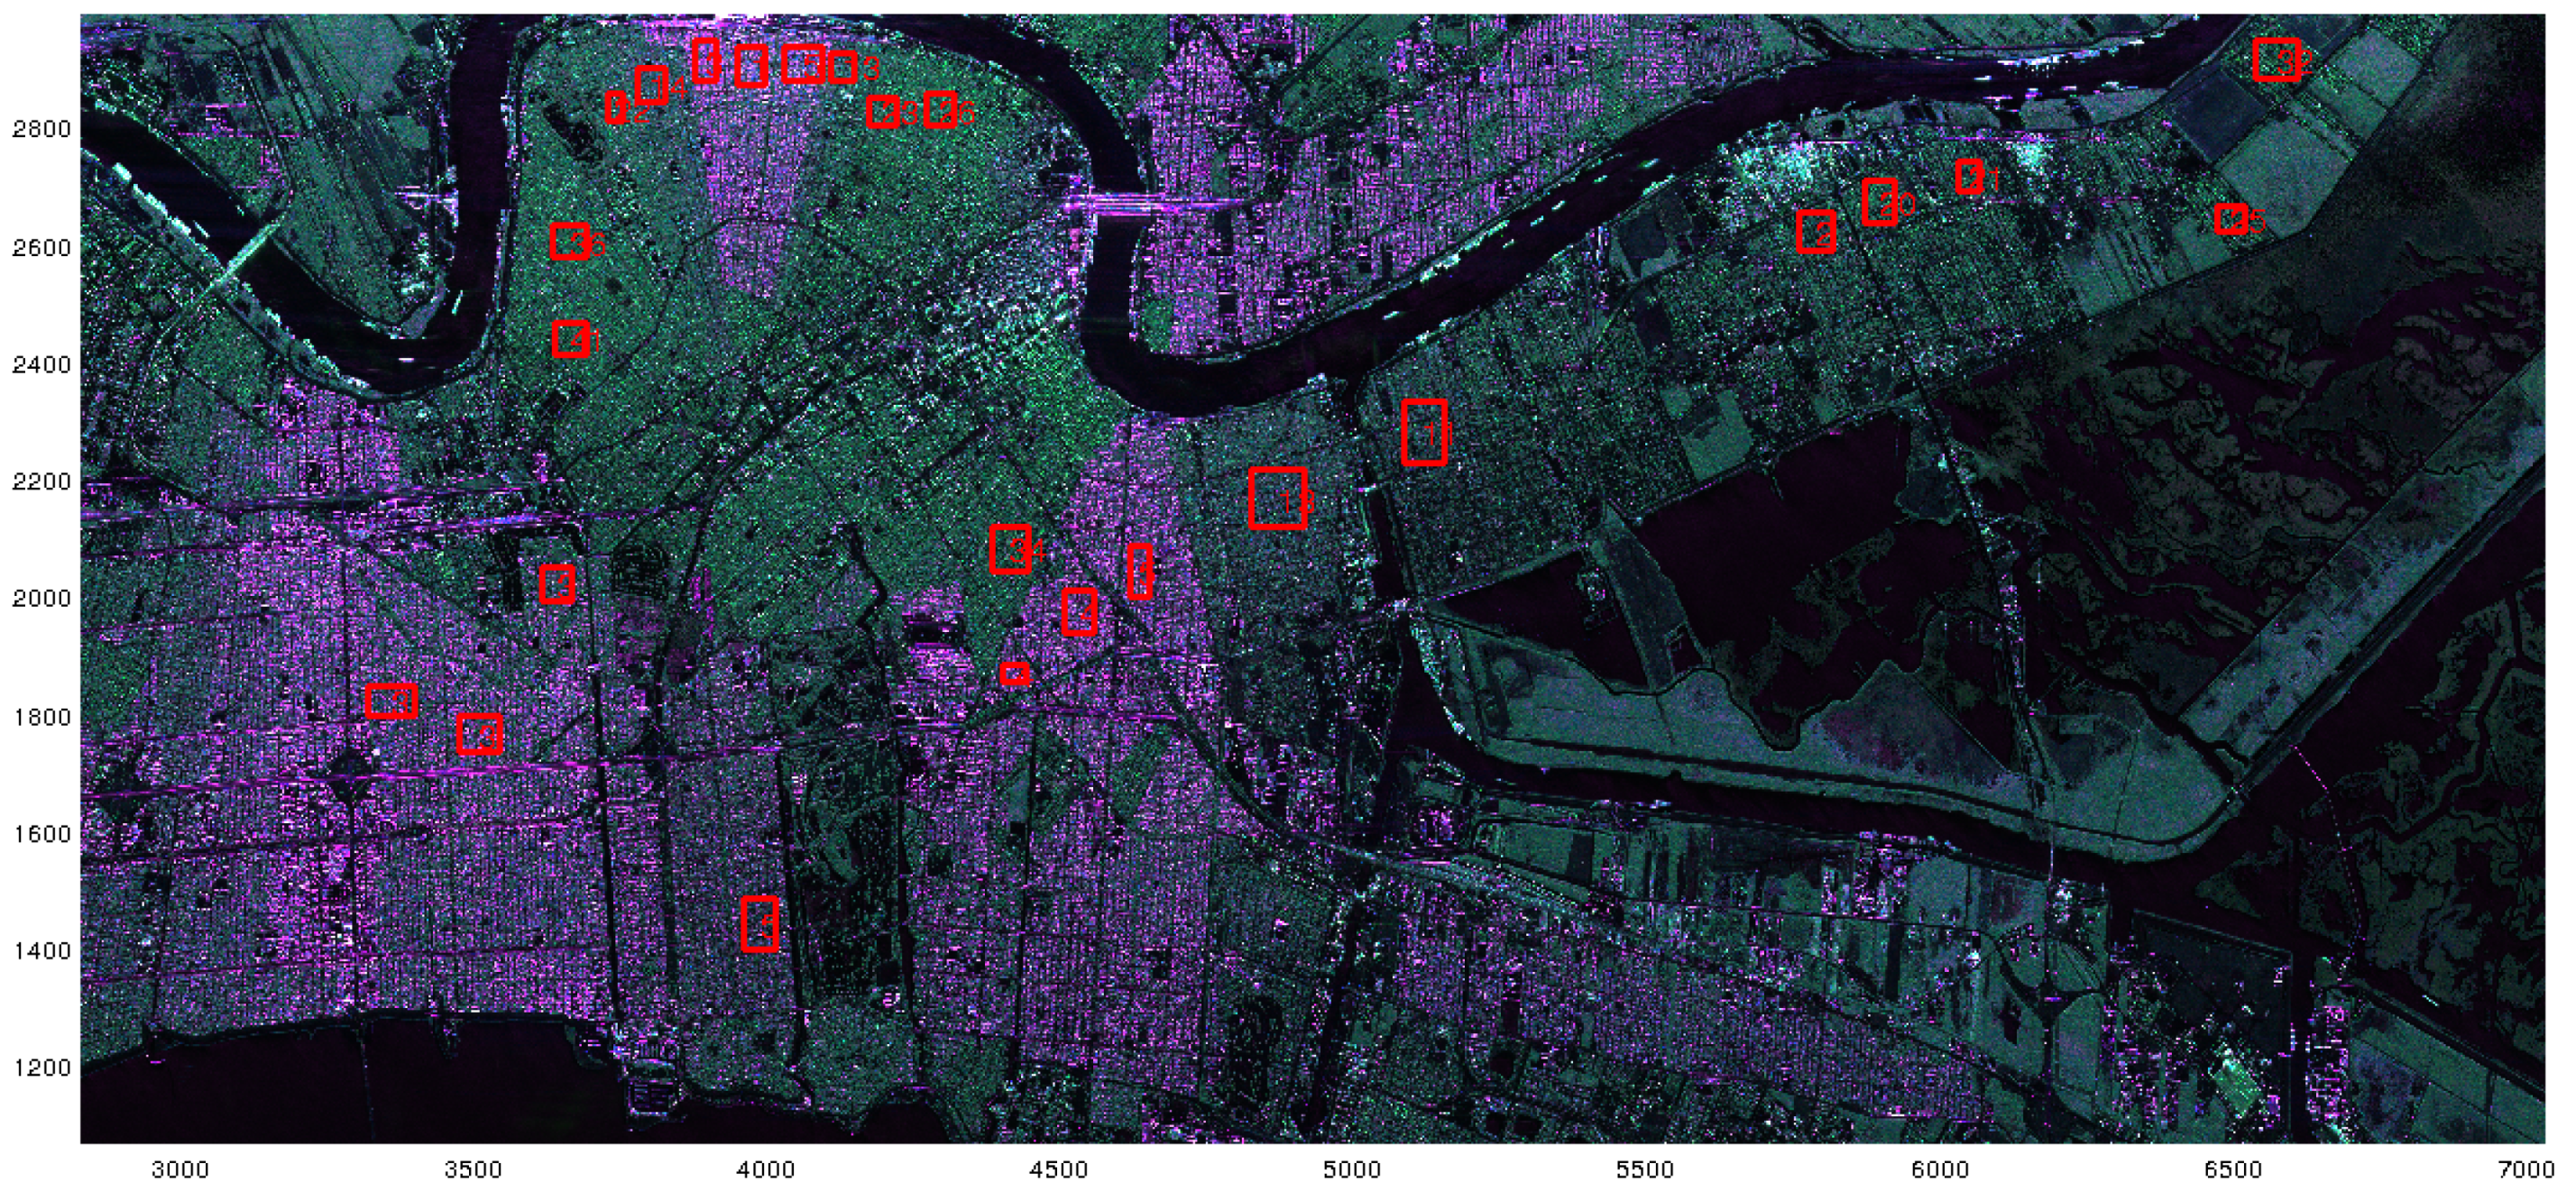
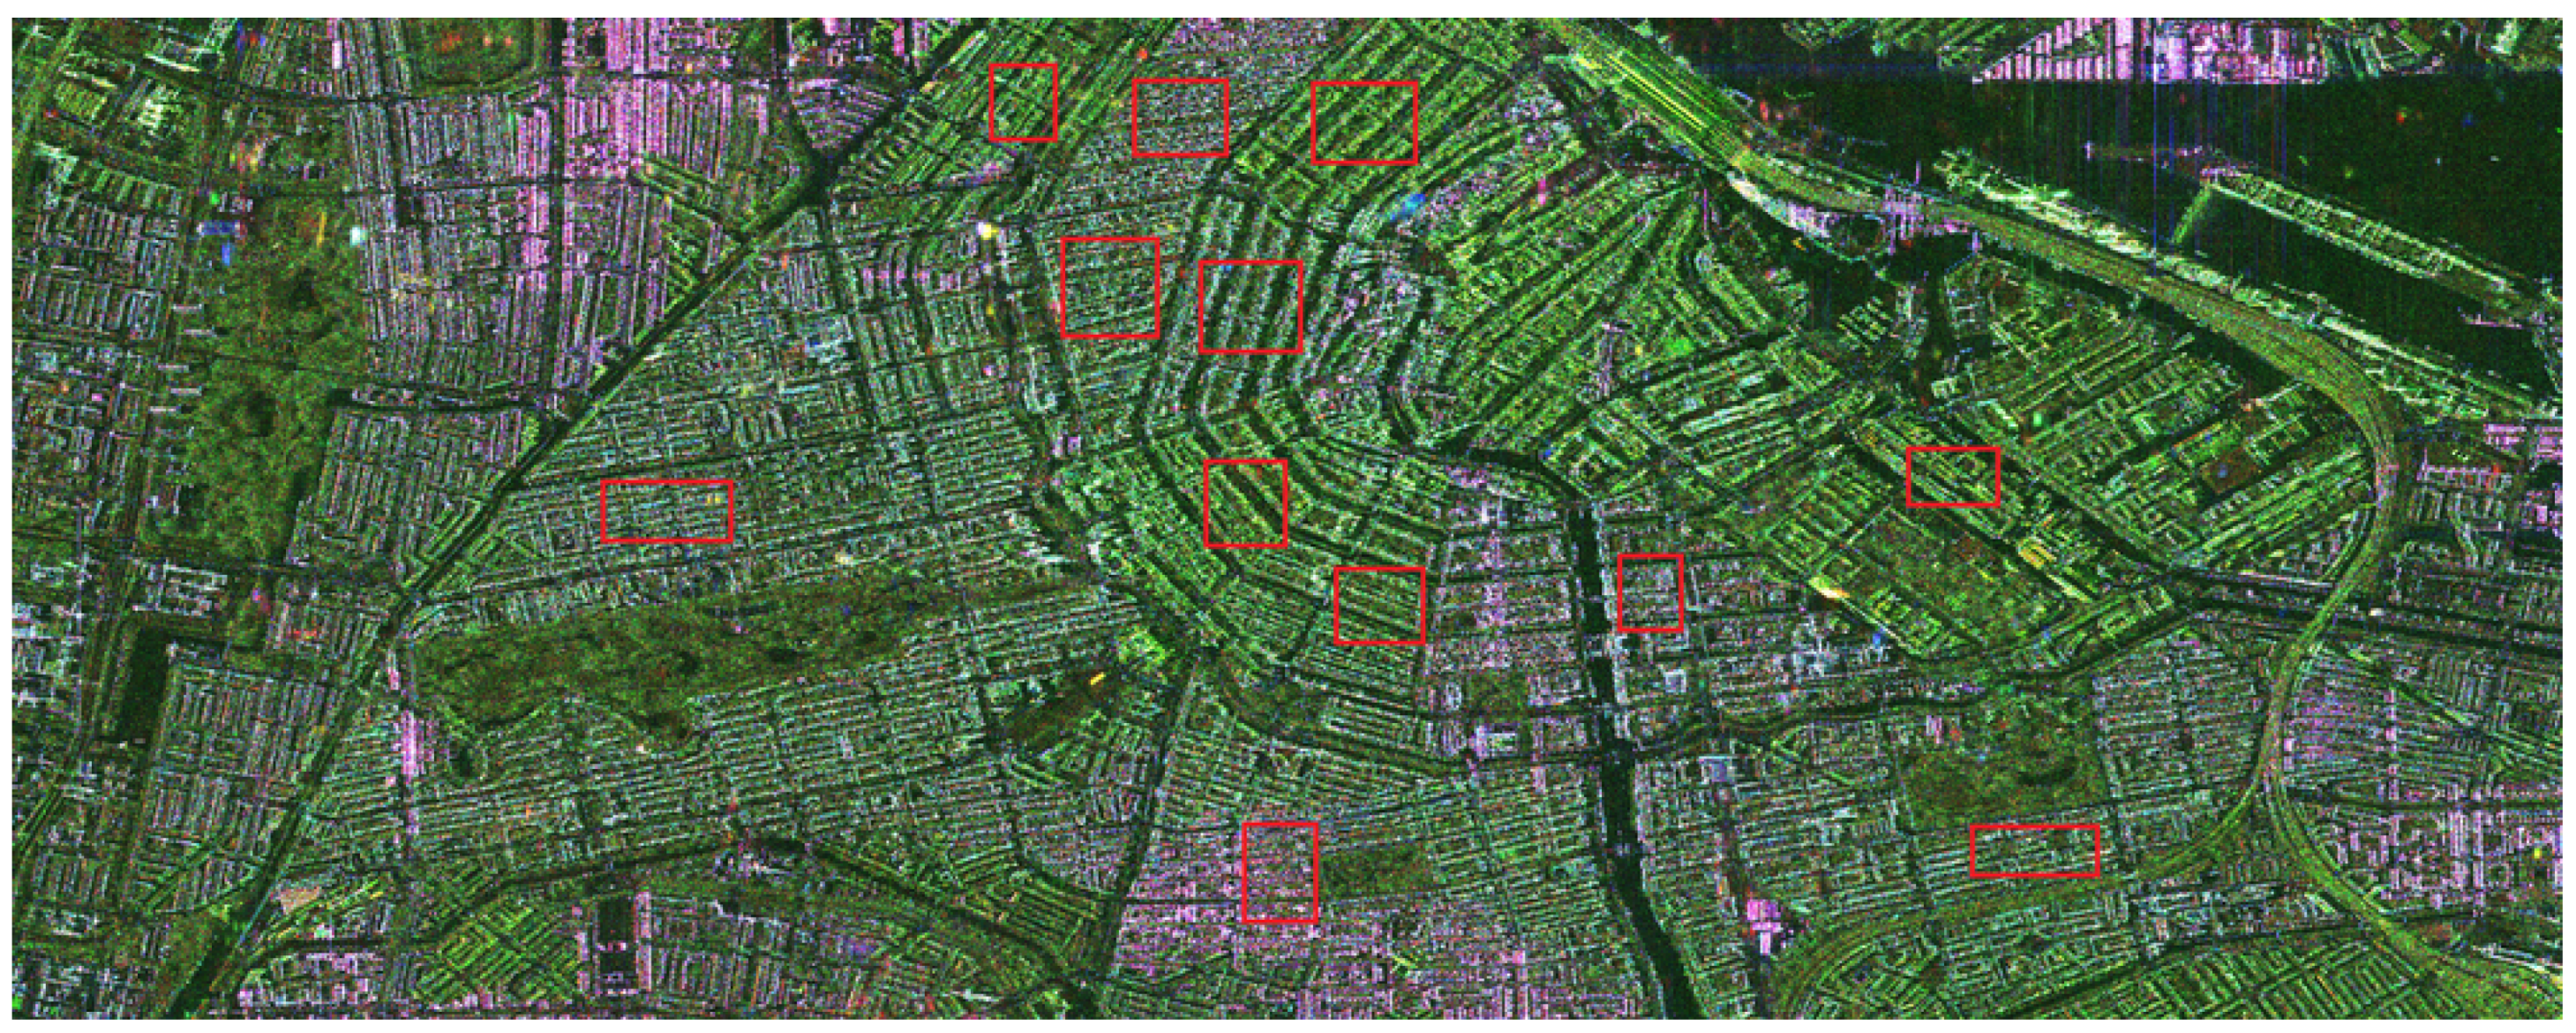
3.2. The Data Sets
4. Results and Analysis
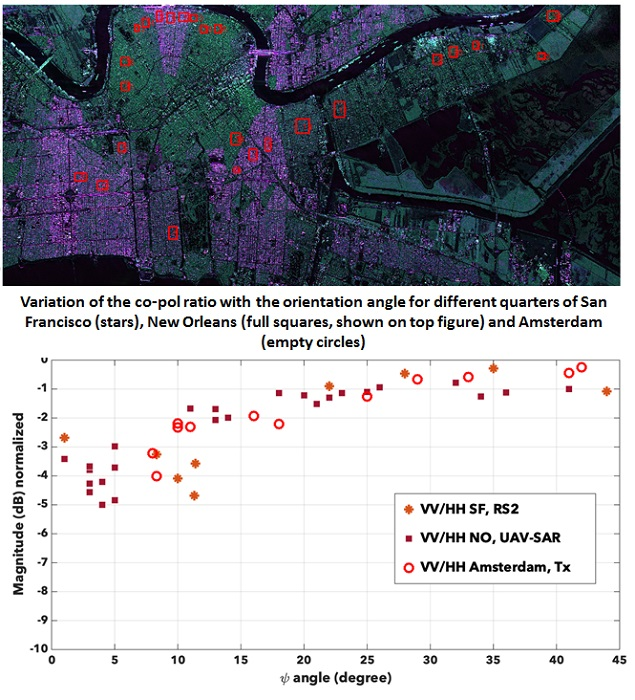
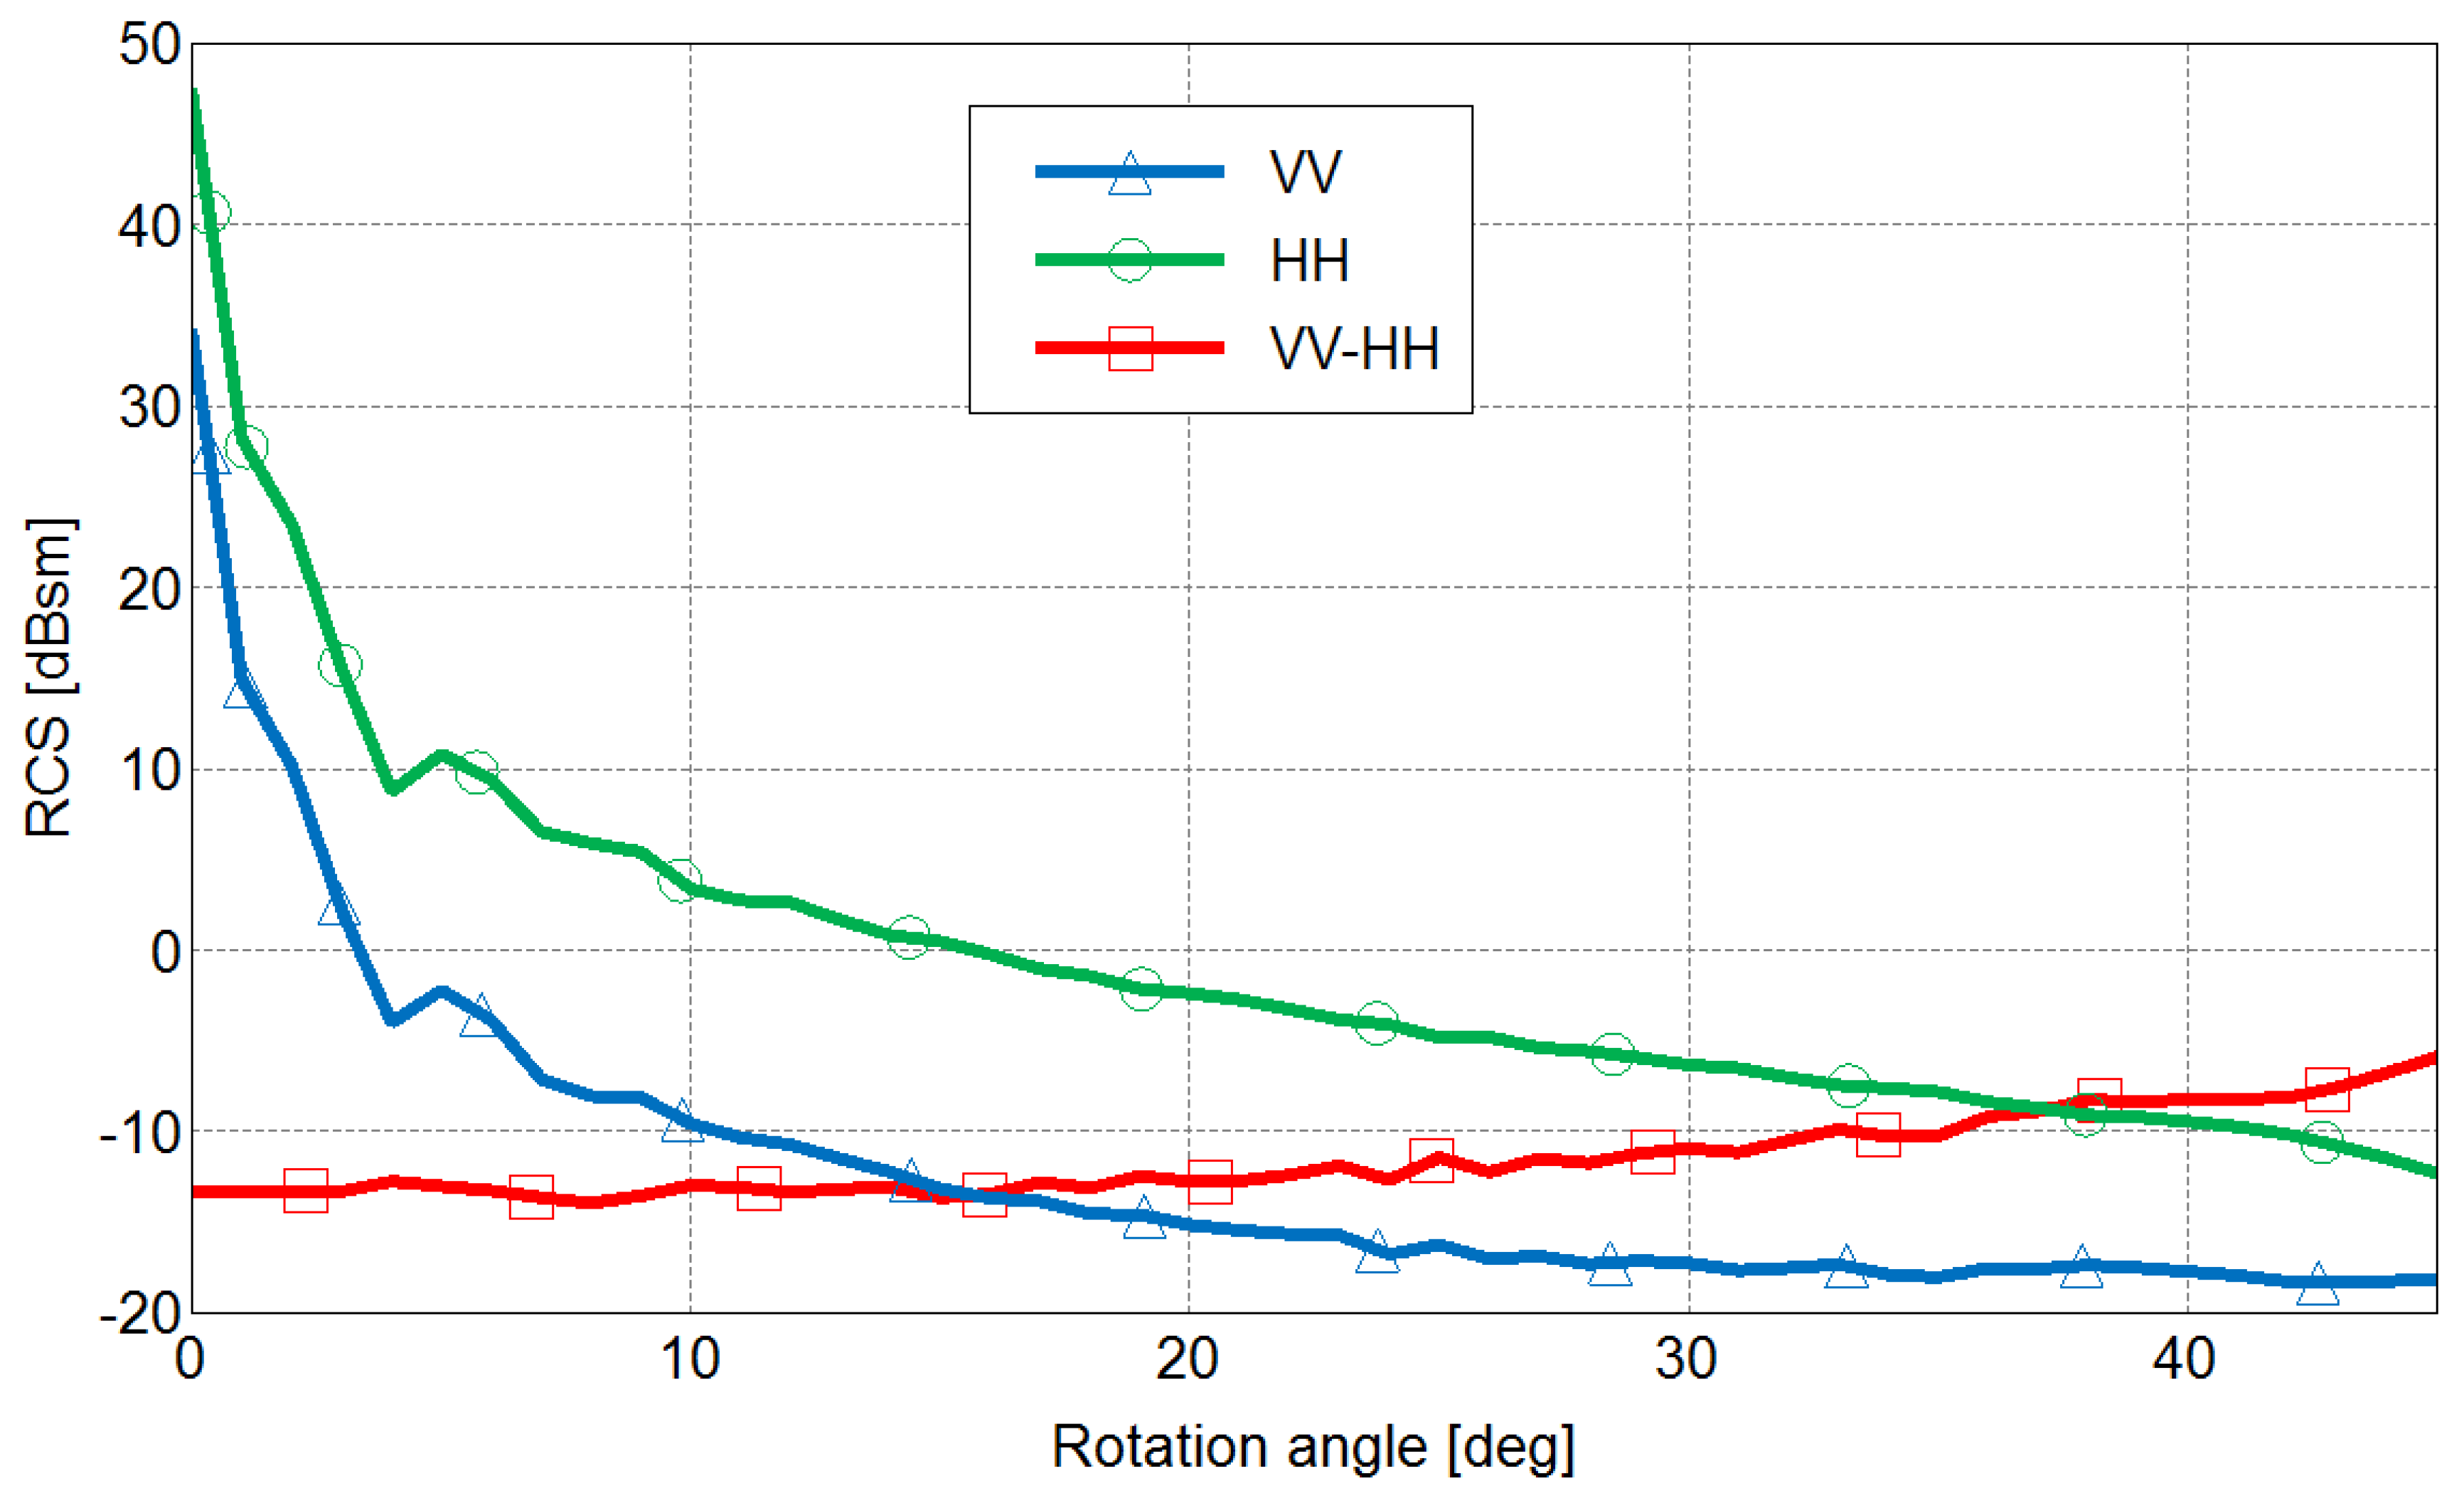
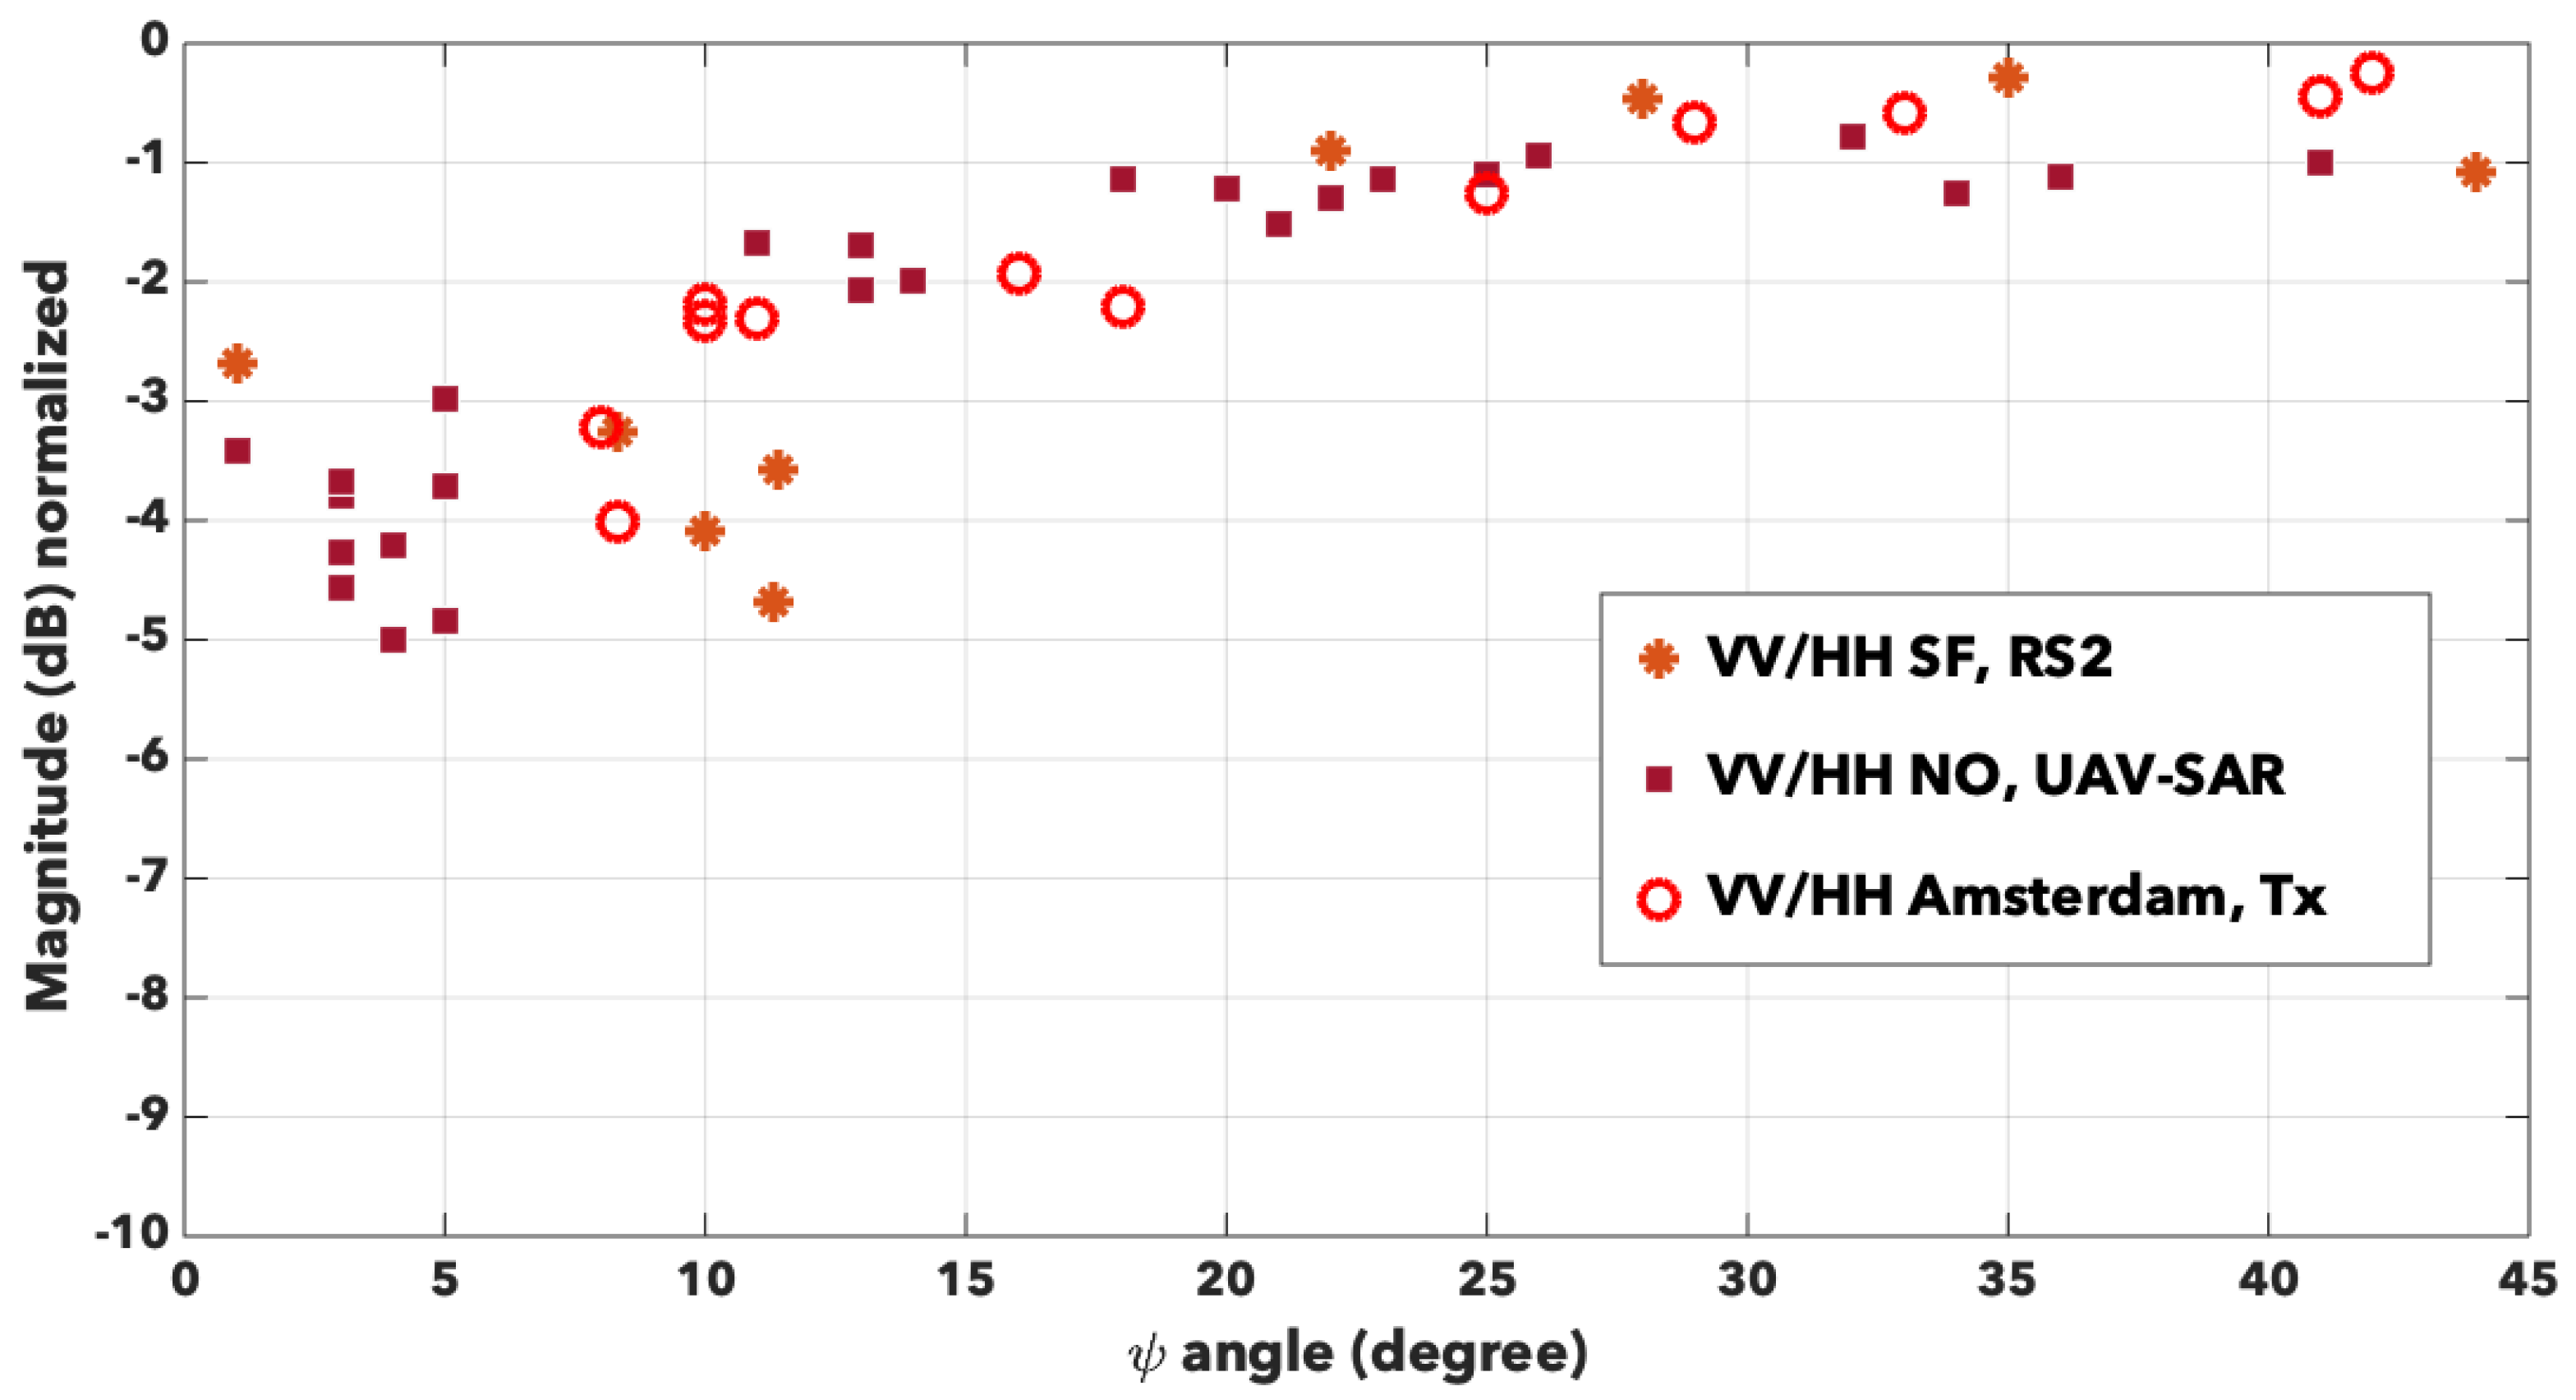
4.1. Co-Pol Response
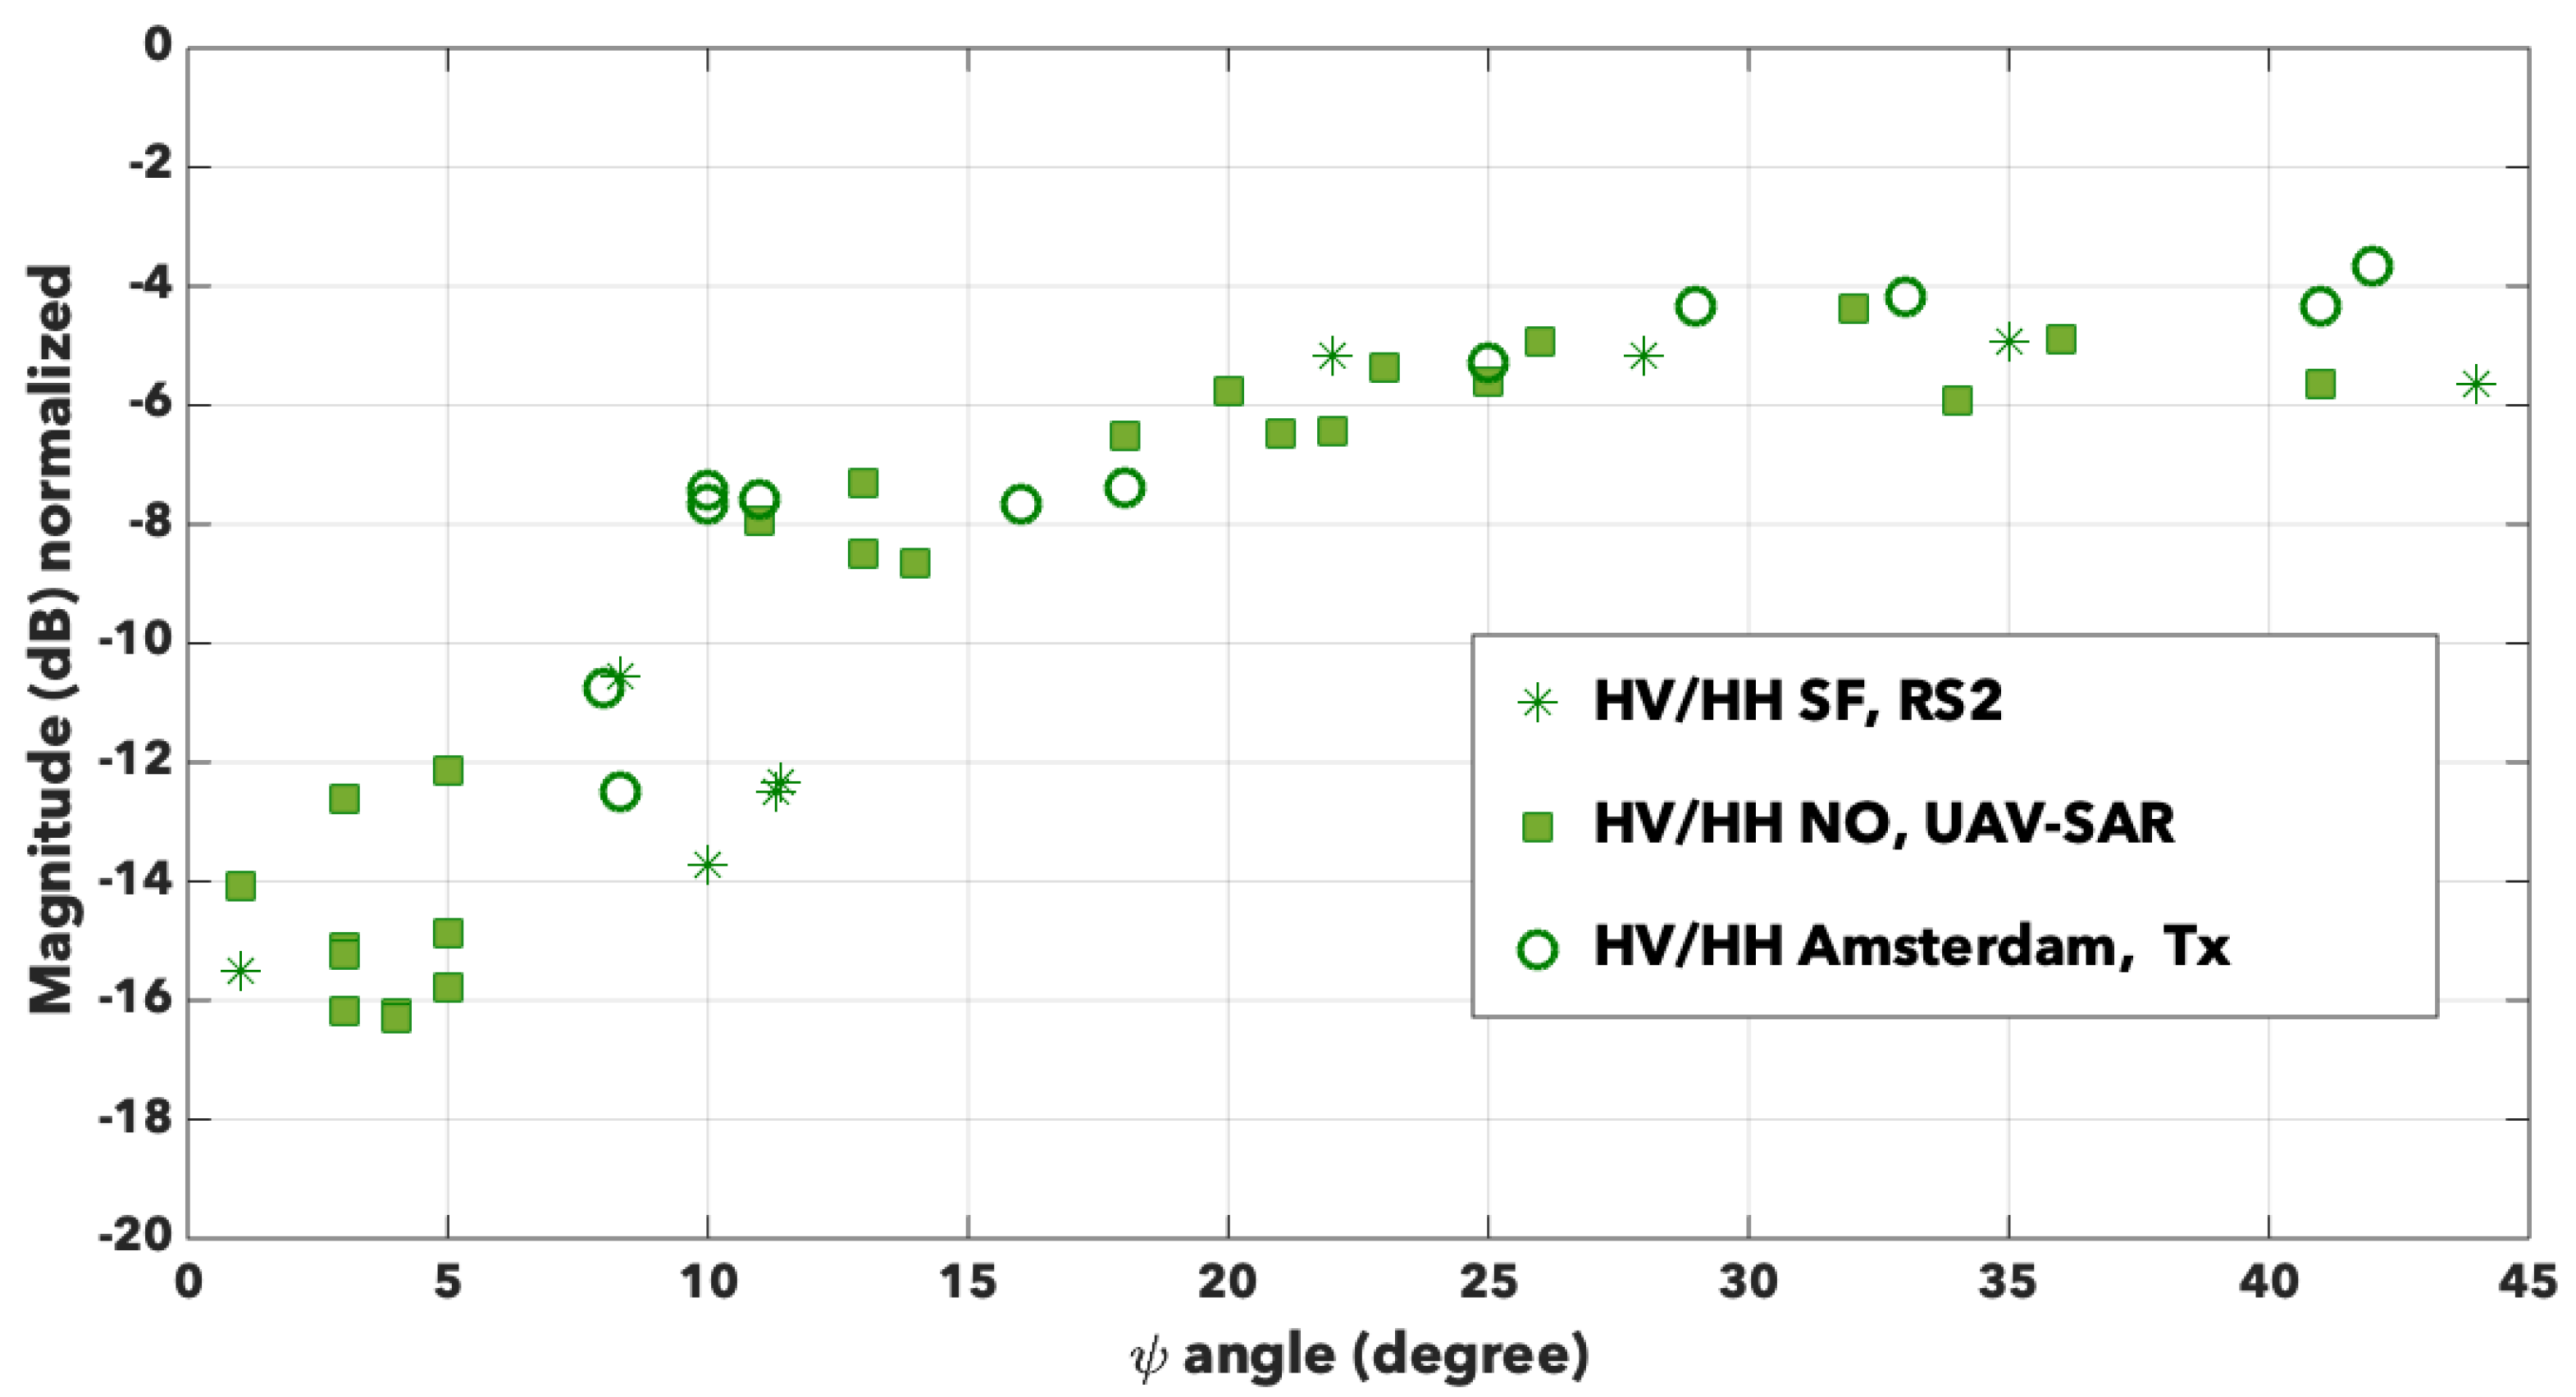
4.2. Cross-Pol Response
5. Discussion and Conclusions
Author Contributions
Funding
Conflicts of Interest
References
- Freeman, A.; Durden, S.L. A three-component scattering model for polarimetric SAR data. IEEE Trans. Geosci. Remote Sens. 1998, 36, 963–973. [Google Scholar] [CrossRef]
- Yamaguchi, Y.; Moriyama, T.; Ishido, M.; Yamada, H. Four-component scattering model for polarimetric SAR image decomposition. IEEE Trans. Geosci. Remote Sens. 2005, 43, 1699–1706. [Google Scholar] [CrossRef]
- Lee, J.S.; Ainsworth, T.L.; Wang, Y. Generalized polarimetric model-based decompositions using incoherent scattering models. IEEE Trans. Geosci. Remote Sens. 2014, 52, 2474–2491. [Google Scholar] [CrossRef]
- Singh, G.; Malik, R.; Mohanti, S.; Rathore, V.S.; Yamada, K.; Umemura, M.; Yamaguchi, Y. Seven-component scattering power decomposition of POLSAR Coherency matrix. IEEE Trans. Geosci. Remote Sens. 2019, 57, 8371–8382. [Google Scholar] [CrossRef]
- Hong, S.H.; Wdowinski, S. Double-Bounce Component in Cross-Polarimetric SAR From a New Scattering Target Decomposition. IEEE Trans. Geosci. Remote Sens. 2014, 52, 3039–3051. [Google Scholar] [CrossRef]
- Chen, S.; Ohki, M.; Shimada, M.; Sato, M. Deorientation Effect Investigation for Model-Based Decomposition Over Oriented Built-Up Areas. IEEE Geosci. Remote Sens. Lett. 2013, 10, 273–277. [Google Scholar] [CrossRef]
- Yamaguchi, Y.; Sato, A.; Boerner, W.M.; Sato, R.; Yamada, H. Four-Component Scattering Power Decomposition With Rotation of Coherency Matrix. IEEE Trans. Geosci. Remote Sens. 2011, 49, 2251–2258. [Google Scholar] [CrossRef]
- Guinvarc’h, R.; Thirion-Lefevre, L. Cross-Polarization Amplitudes of Obliquely Orientated Buildings With Application to Urban Areas. IEEE Geosci. Remote Sens. Lett. 2017, 14, 1913–1917. [Google Scholar] [CrossRef]
- Koeniguer, E.C.; Weissgerber, F.; Trouve, N.; Nicolas, J.; Onera, F. A new light on origins of polarimetric misclassification of the SoMa district due to the difficulty to predict entropy. In Proceedings of the POLINSAR, Frascati, Italy, 26–30 January 2015; pp. 1–5. [Google Scholar]
- Shang, F.; Huang, X.; Liu, H.; Hirose, A. Data Arrangement With Rotation Transformation for Fully Polarimetric Synthetic Aperture Radar. IEEE Geosci. Remote Sens. Lett. 2020, 17, 436–440. [Google Scholar] [CrossRef]
- Thirion-Lefevre, L.; Guinvarc’h, R. The Double Brewster Angle Effect. C.-R. Phys. 2018, 19, 43–53. [Google Scholar] [CrossRef]
- Azzam, R.M.A.; Ugbo, E.E. Contours of constant pseudo-Brewster angle in the complex ϵ plane and an analytical method for the determination of optical constants. Appl. Opt. 1989, 28, 5222–5228. [Google Scholar] [CrossRef] [PubMed]
- Le Toan, T.; Beaudoin, A.; Riom, J.; Guyon, D. Relating forest biomass to SAR data. IEEE Trans. Geosci. Remote Sens. 1992, 30, 403–411. [Google Scholar] [CrossRef]
- Di Simone, A.; Fuscaldo, W.; Millefiori, L.M.; Riccio, D.; Ruello, G.; Braca, P.; Willett, P. Analytical Models for the Electromagnetic Scattering From Isolated Targets in Bistatic Configuration: Geometrical Optics Solution. IEEE Trans. Geosci. Remote Sens. 2020, 58, 861–880. [Google Scholar] [CrossRef]
- Altair. FEKO™: A Comprehensive Computational Electromagnetics Code. Introduction. Available online: https://altairhyperworks.com/product/FEKO (accessed on 25 April 2020).
- Couderc, O.; Thirion-Lefevre, L.; Guinvarc’h, R. Analytical Solution for Permittivities of a Dihedral Configuration. IEEE Antennas Wirel. Propag. Lett. 2018, 17, 485–488. [Google Scholar] [CrossRef]
- Atwood, D.K.; Thirion-Lefevre, L. Polarimetric Phase and Implications for Urban Classification. IEEE Trans. Geosci. Remote Sens. 2018, 56, 1278–1289. [Google Scholar] [CrossRef]


| Center Frequency (GHz) | Incidence Angle | Range res. (*)/ Pix. Spacing (m) | Az. res. (*)/ Pix. Spacing (m) | City | Year | |
|---|---|---|---|---|---|---|
| RAMSES | 10 | 60° | 1.3 (*) | 1.4 (*) | Bretigny France | 1999 |
| UAVSAR | 1.2 | 30° | 5 | 7.2 | New Orleans USA | 2016 |
| RADARSAT-2 (FQ9) | 5.3 | 29° | 4.7 | 5.1 | San Francisco USA | 2008 |
| TerraSAR-X | 10 | 35° | 2 | 1 | Amsterdam The Netherlands | 2015 |
© 2020 by the authors. Licensee MDPI, Basel, Switzerland. This article is an open access article distributed under the terms and conditions of the Creative Commons Attribution (CC BY) license (http://creativecommons.org/licenses/by/4.0/).
Share and Cite
Thirion-Lefevre, L.; Guinvarc’h, R.; Colin-Koeniguer, E. The Combined Effect of Orientation Angle and Material on PolSAR Images of Urban Areas. Remote Sens. 2020, 12, 1632. https://doi.org/10.3390/rs12101632
Thirion-Lefevre L, Guinvarc’h R, Colin-Koeniguer E. The Combined Effect of Orientation Angle and Material on PolSAR Images of Urban Areas. Remote Sensing. 2020; 12(10):1632. https://doi.org/10.3390/rs12101632
Chicago/Turabian StyleThirion-Lefevre, Laetitia, Régis Guinvarc’h, and Elise Colin-Koeniguer. 2020. "The Combined Effect of Orientation Angle and Material on PolSAR Images of Urban Areas" Remote Sensing 12, no. 10: 1632. https://doi.org/10.3390/rs12101632
APA StyleThirion-Lefevre, L., Guinvarc’h, R., & Colin-Koeniguer, E. (2020). The Combined Effect of Orientation Angle and Material on PolSAR Images of Urban Areas. Remote Sensing, 12(10), 1632. https://doi.org/10.3390/rs12101632