High-Resolution Fengyun-4 Satellite Measurements of Dynamical Tropopause Structure and Variability
Abstract
1. Introduction
2. Materials and Methods
2.1. Data
2.2. Methods
2.2.1. Linear Regression
2.2.2. KNN Regression
2.2.3. GBDT Regression
2.2.4. RF Regression
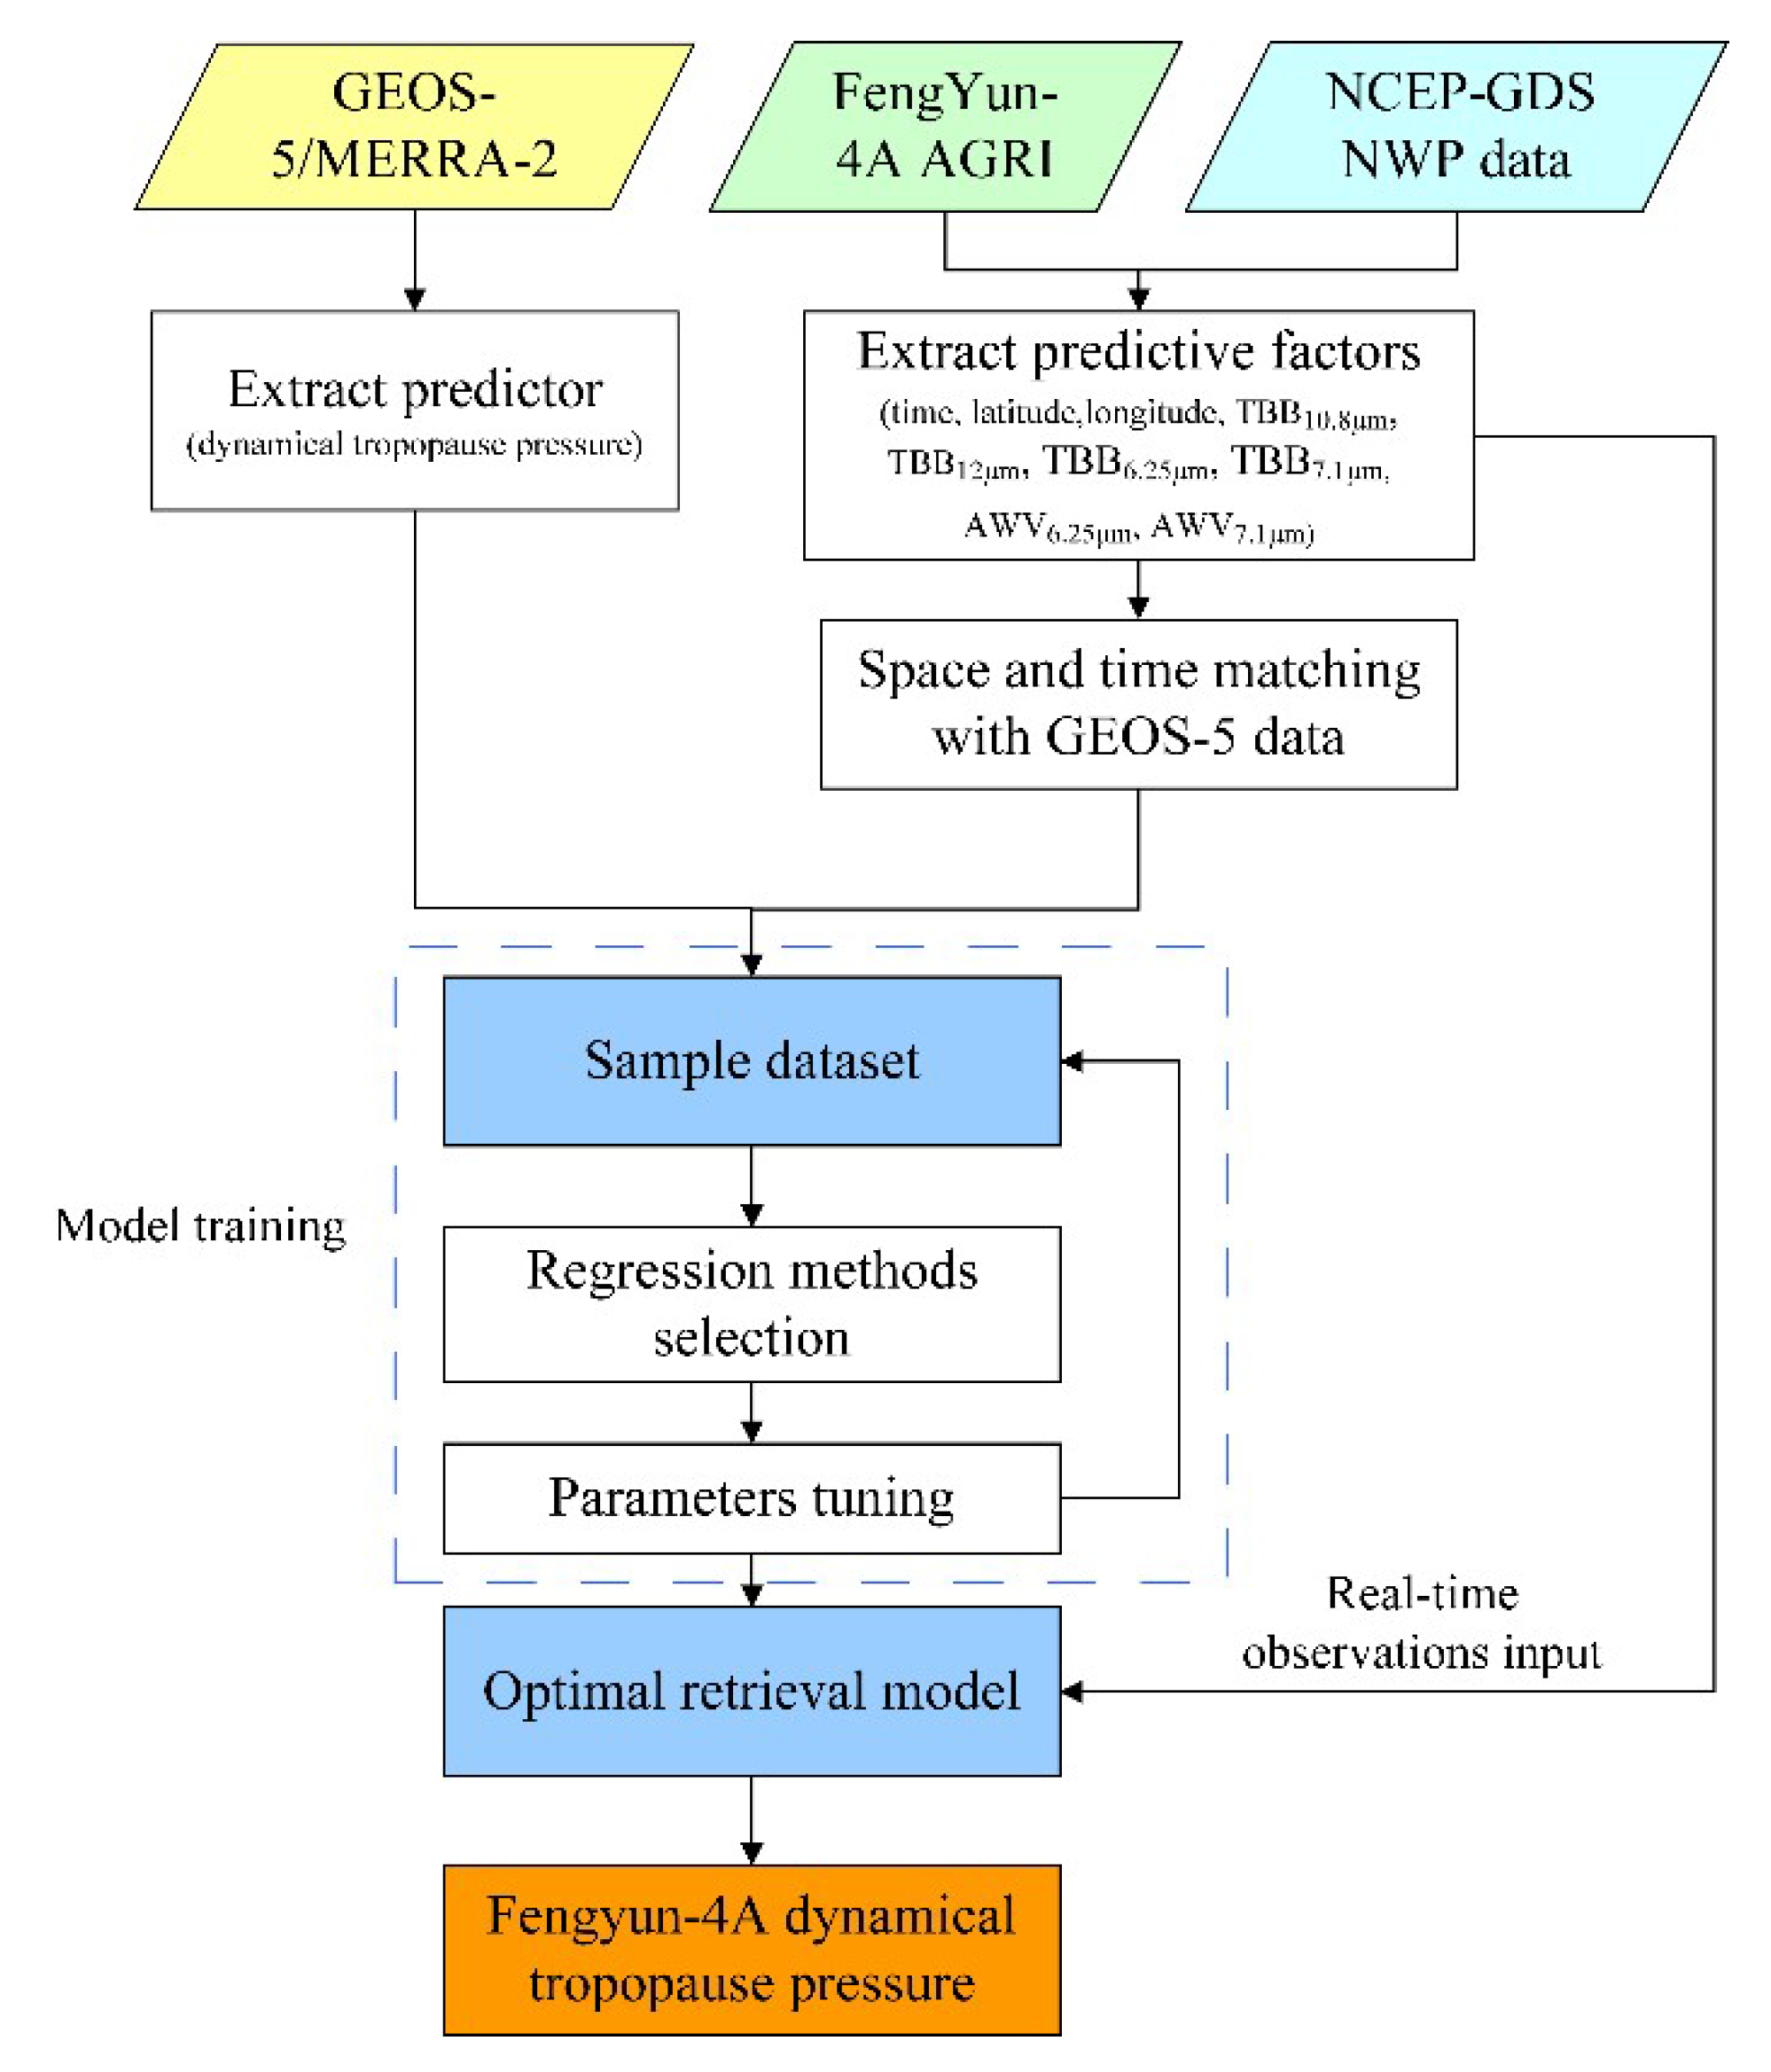
2.3. Process Flow
3. Results
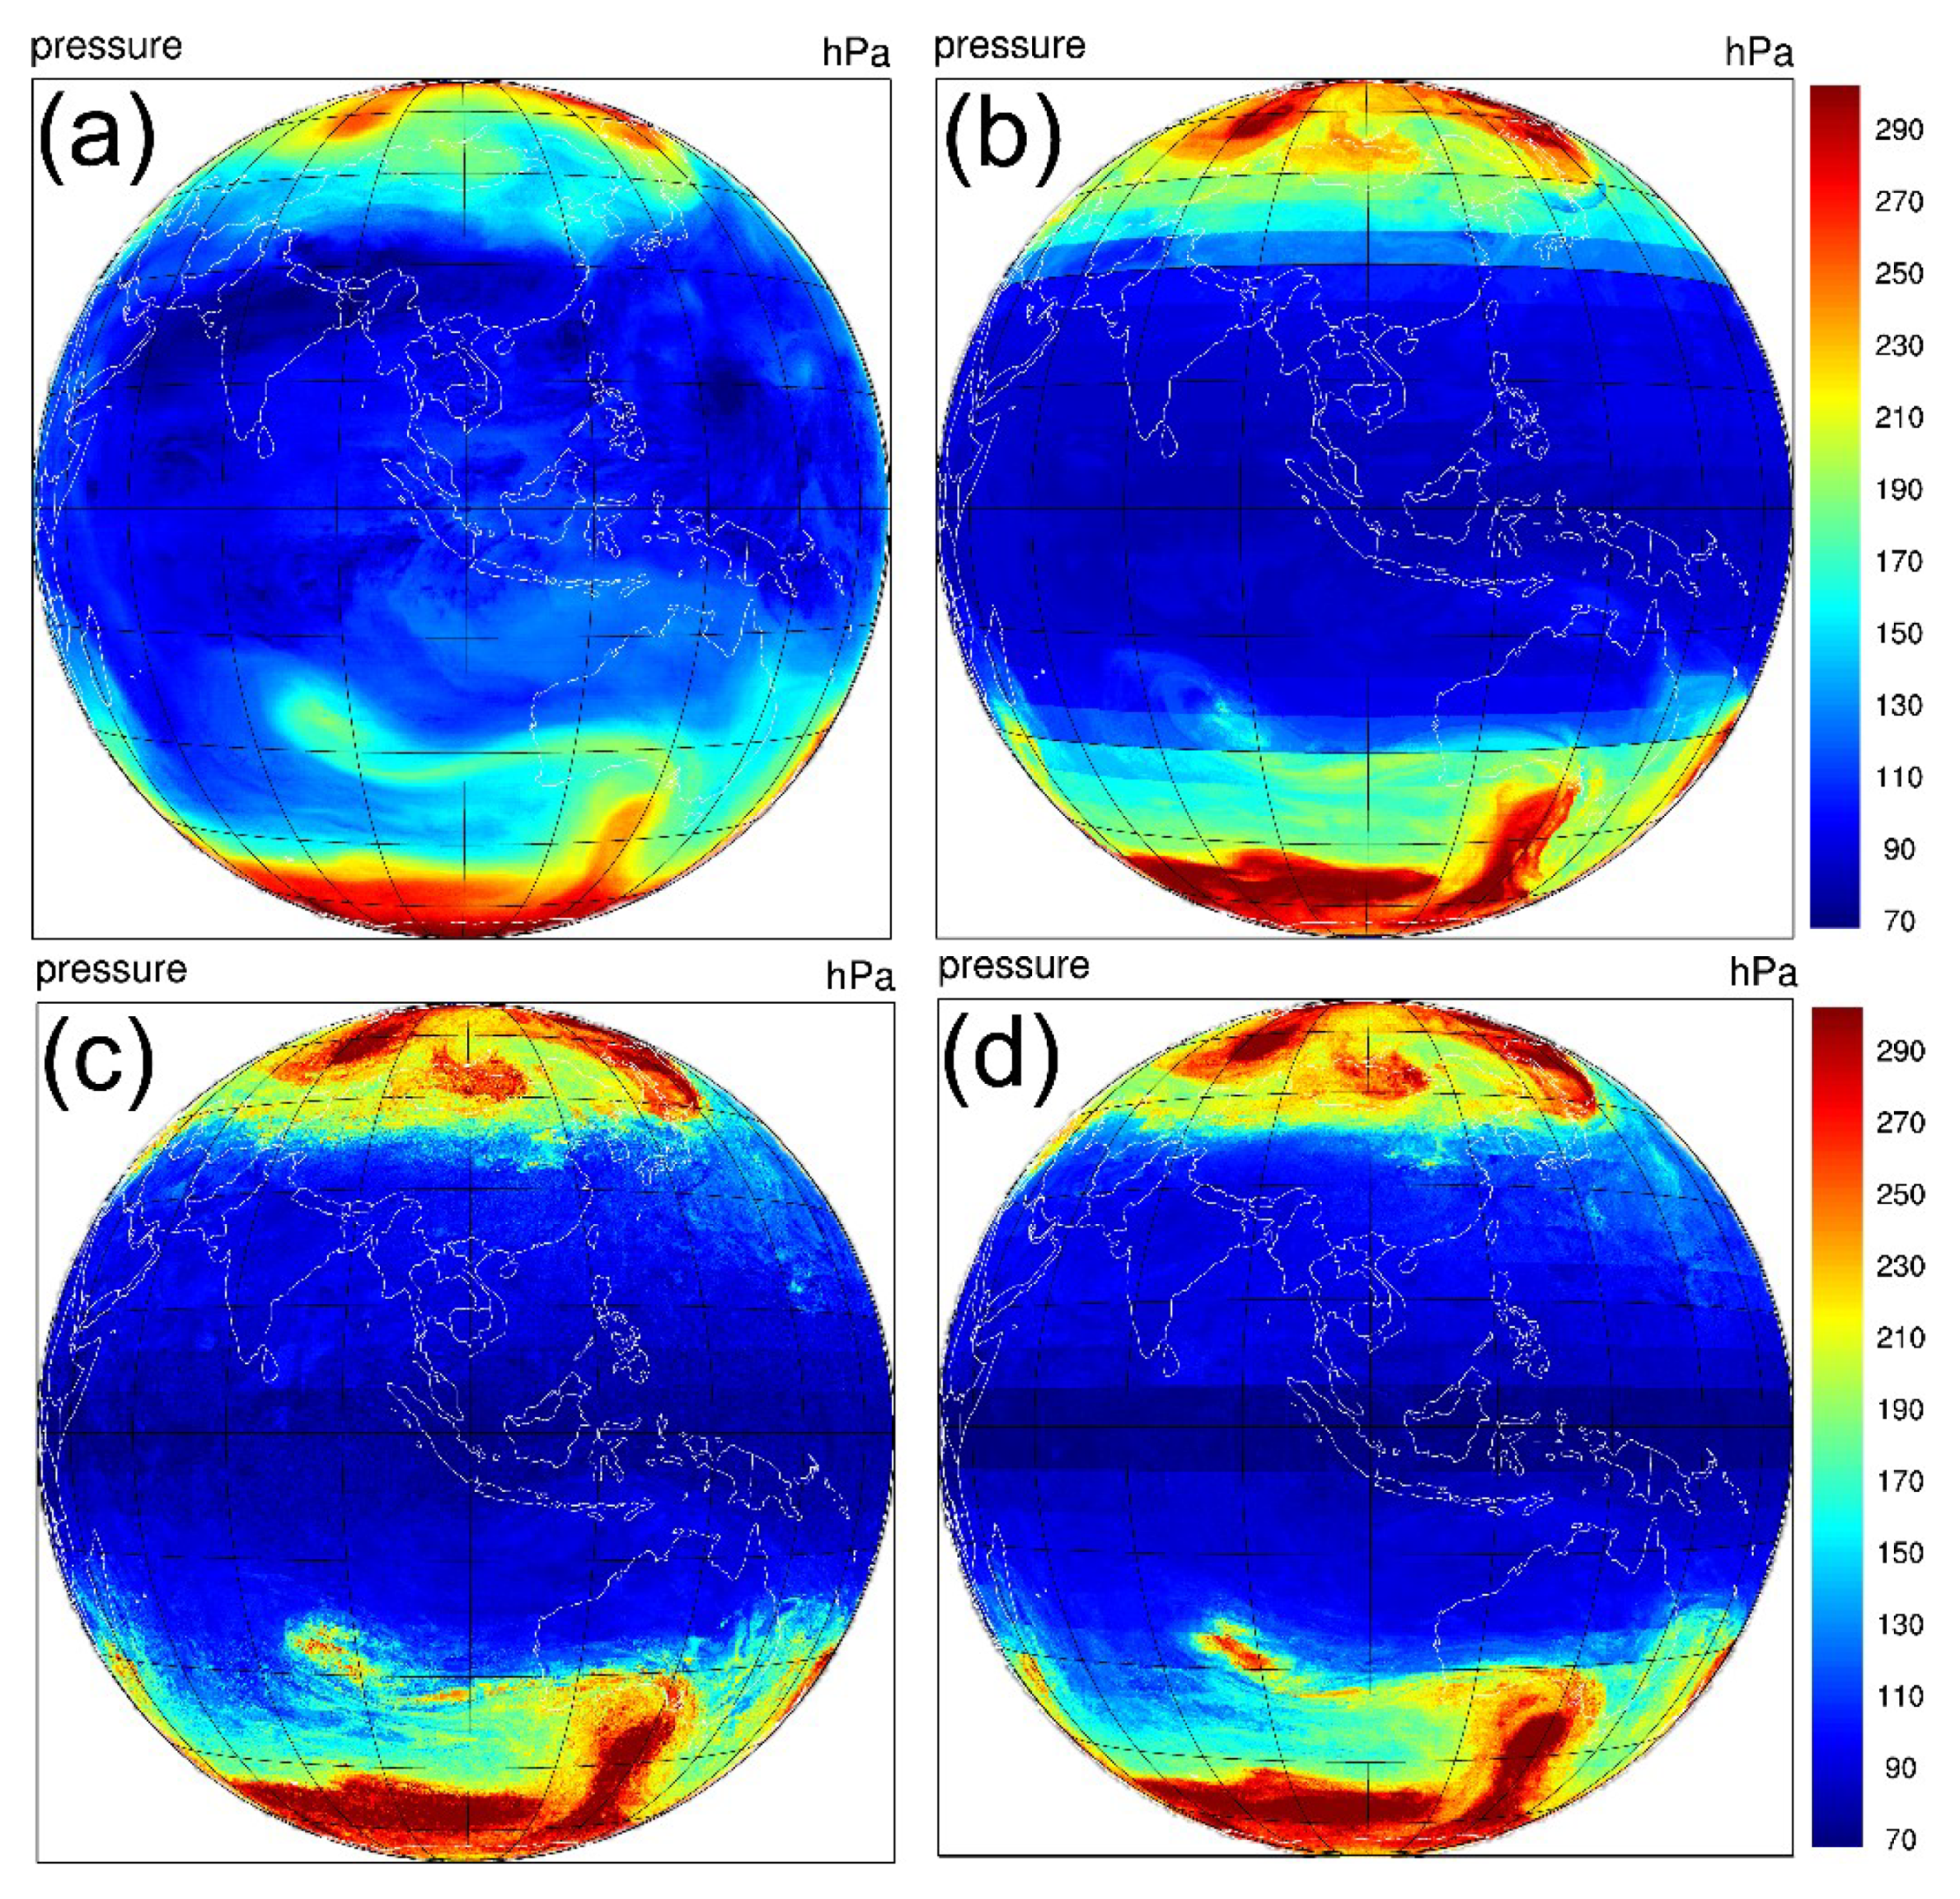
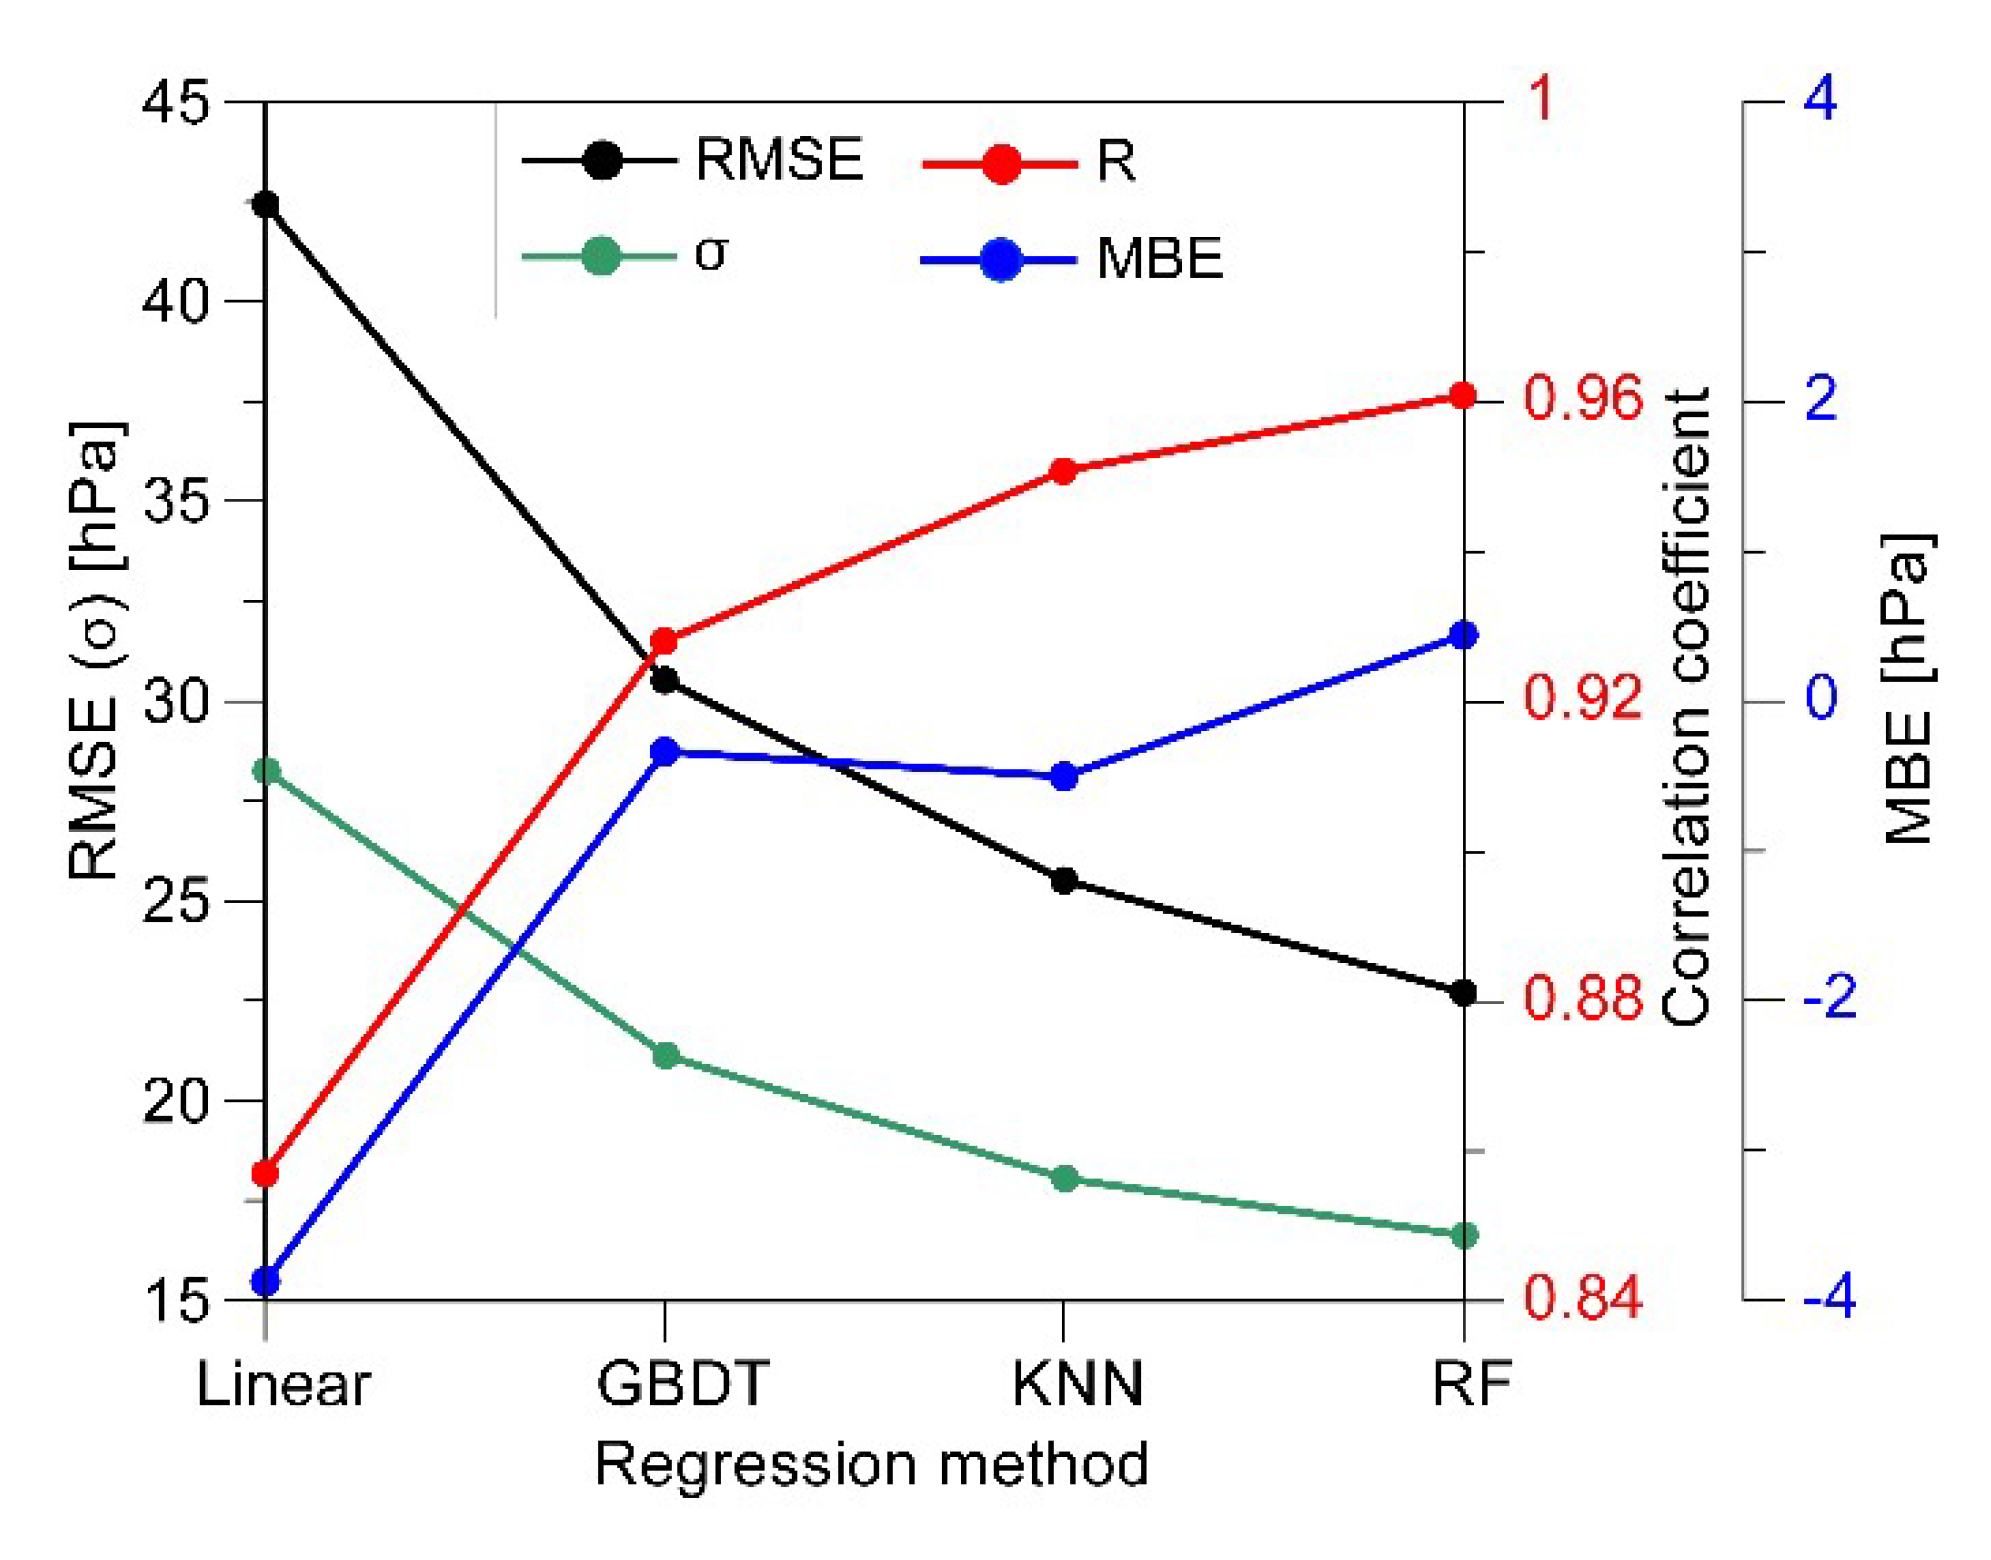
3.1. Comparison of Four Retrieval Models
3.2. A Yearly Validation
3.3. Vertical Distribution Relative to Dynamical Tropopause
3.4. Comparison of Seasonal Variation
4. Discussion
5. Conclusions
Supplementary Materials
Author Contributions
Funding
Acknowledgments
Conflicts of Interest
References
- World Meteorological Organization (WMO). Yearbook United Nations 2014 1985, 39, 1350–1355. [CrossRef]
- Fueglistaler, S.; Dessler, A.; Dunkerton, T.J.; Folkins, I.; Fu, Q.; Mote, P.W. Tropical tropopause layer. Rev. Geophys. 2009, 47. [Google Scholar] [CrossRef]
- Sausen, R.; Santer, B.D. Use of changes in tropopause height to detect human influences on climate. Meteorol. Z. 2003, 12, 131–136. [Google Scholar] [CrossRef]
- Hoinka, K.P. Statistics of the Global Tropopause Pressure. Mon. Weather. Rev. 1998, 126, 3303–3325. [Google Scholar] [CrossRef]
- Gettelman, A.; Geller, M.A.; Haynes, P.H. A SPARC tropopause initiative. Sparc Newslett. 2007, 29, 14–20. [Google Scholar]
- Gettelman, A.; Hoor, P.; Pan, L.L.; Randel, W.J.; Hegglin, M.I.; Birner, T. The extratropical upper troposphere and lower statrosphere. Rev. Geophys. 2011, 49, RG3003. [Google Scholar] [CrossRef]
- Zängl, G.; Hoinka, K.P. The Tropopause in the Polar Regions. J. Clim. 2001, 14, 3117–3139. [Google Scholar] [CrossRef]
- World Meteorological Organization (WMO). Definition of the Tropopause; WMO Bull.: Geneva, Switzerland, 1957. [Google Scholar]
- Seidel, D.J.; Randel, W.J. Variability and trends in the global tropopause estimated from radiosonde data. J. Geophys. Res. Space Phys. 2006, 111, 21. [Google Scholar] [CrossRef]
- Zeng, Z.; Sokolovskiy, S.; Schreiner, W.S.; Hunt, D. Representation of Vertical Atmospheric Structures by Radio Occultation Observations in the Upper Troposphere and Lower Stratosphere: Comparison to High-Resolution Radiosonde Profiles. J. Atmos. Ocean. Technol. 2019, 36, 655–670. [Google Scholar] [CrossRef]
- Alexander, S.P.; Murphy, D.J.; Klekociuk, A.R. High resolution VHF radar measurements of tropopause structure and variability at Davis, Antarctica (69°S, 78°E). Atmos. Chem. Phys. Discuss. 2013, 13, 3121–3132. [Google Scholar] [CrossRef]
- Liu, Z.; Sun, Y.; Bai, W.; Xia, J.; Tan, G.; Cheng, C.; Du, Q.; Wang, X.; Zhao, D.; Tian, Y.; et al. Validation of Preliminary Results of Thermal Tropopause Derived from FY-3C GNOS Data. Remote. Sens. 2019, 11, 1139. [Google Scholar] [CrossRef]
- Birner, T. Fine-scale structure of the extratropical tropopause region. J. Geophys. Res. Space Phys. 2006, 111. [Google Scholar] [CrossRef]
- Hu, S.; Vallis, G.K. Meridional structure and future changes of tropopause height and temperature. Q. J. R. Meteorol. Soc. 2019, 145, 2698–2717. [Google Scholar] [CrossRef]
- Santer, B.D.; Boyle, J.S.; AchutaRao, K.; Doutriaux, C.; Roeckner, E.; Ruedy, R.; Schmidt, G.; Sausen, R.; Wigley, T.M.L.; Hansen, J.E.; et al. Behavior of tropopause height and atmospheric temperature in models, reanalyses, and observations: Decadal changes. J. Geophys. Res. Space Phys. 2003, 108, 4002. [Google Scholar] [CrossRef]
- Nielsen-Gammon, J.W. A Visualization of the Global Dynamic Tropopause. Bull. Am. Meteorol. Soc. 2001, 82, 1151–1167. [Google Scholar] [CrossRef]
- Pan, L.L.; Randel, W.J.; Gary, B.L.; Mahoney, M.J.; Hintsa, E.J. Definitions and sharpness of the extratropical tropopause: A trace gas perspective. J. Geophys. Res. Space Phys. 2004, 109. [Google Scholar] [CrossRef]
- Hoskins, B.; McIntyre, M.; Robertson, A. On the use and significance of isentropic potential vorticity maps. Q. J. R. Meteorol. Soc. 1985, 111, 877–946. [Google Scholar] [CrossRef]
- Holton, J.R.; Haynes, P.H.; McIntyre, M.E.; Douglass, A.R.; Rood, R.B.; Pfister, L. Stratosphere–Troposphere Exchange. Rev. Geophys. 1995, 33, 403–439. [Google Scholar] [CrossRef]
- Reed, R.J. A Study of a Characteristic Tpye of Upper-Level Frontogenesis. J. Meteorol. 1955, 12, 226–237. [Google Scholar] [CrossRef]
- Wernli, H.; Sprenger, M. Identification and ERA-15 Climatology of Potential Vorticity Streamers and Cutoffs near the Extratropical Tropopause. J. Atmos. Sci. 2007, 64, 1569–1586. [Google Scholar] [CrossRef]
- Krichak, S.O.; Alpert, P.; Dayan, M. An evaluation of the role of hurricane Olga (2001) in an extreme rainy event in Israel using dynamic tropopause maps. Appl. Clim. 2006, 98, 35–53. [Google Scholar] [CrossRef]
- Zurita-Gotor, P.; Vallis, G.K. Dynamics of Midlatitude Tropopause Height in an Idealized Model. J. Atmos. Sci. 2011, 68, 823–838. [Google Scholar] [CrossRef]
- Wimmers, A.J.; Moody, J.L.; Browell, E.V.; Hair, J.W.; Grant, W.B.; Butler, C.F.; Fenn, M.A.; Schmidt, C.C.; Li, J.; Ridley, B.A. Signatures of tropopause folding in satellite imagery. J. Geophys. Res. Space Phys. 2003, 108. [Google Scholar] [CrossRef]
- Michel, Y.; Bouttier, F. Automated tracking of dry intrusions on satellite water vapour imagery and model output. Q. J. R. Meteorol. Soc. 2006, 132, 2257–2276. [Google Scholar] [CrossRef]
- Shou, Y.; Lu, F.; Shou, S. Satellite Assessments of Tropopause Dry Intrusions Correlated to Mid-Latitude Storms. Atmosphere 2016, 7, 128. [Google Scholar] [CrossRef]
- Yang, J.; Zhang, Z.; Wei, C.; Lu, F.; Guo, Q. Introducing the New Generation of Chinese Geostationary Weather Satellites, Fengyun-4. Bull. Am. Meteorol. Soc. 2017, 98, 1637–1658. [Google Scholar] [CrossRef]
- Gelaro, R.; Mccarty, W.; Suárez, M.J.; Todling, R.; Molod, A.; Takacs, L.; Randles, C.; Darmenov, A.; Bosilovich, M.G.; Reichle, R.; et al. The Modern-Era Retrospective Analysis for Research and Applications, Version 2 (MERRA-2). J. Clim. 2017, 30, 5419–5454. [Google Scholar] [CrossRef]
- Bonamente, M. Multi-Variable Regression. In Statistics and Analysis of Scientific Data; Springer: New York, NY, USA, 2017; pp. 165–175. [Google Scholar]
- Coomans, D.; Massart, D. Alternative k-nearest neighbour rules in supervised pattern recognition. Anal. Chim. Acta 1982, 136, 15–27. [Google Scholar] [CrossRef]
- Altman, N.S. An introduction to kernel and nearest-neighbor nonparametric regression. Am. Stat. 1992, 46, 175–185. [Google Scholar]
- Friedman, J.H. Greedy function approximation: A gradient boosting machine. Ann. Stat. 2001, 29, 1189–1232. [Google Scholar] [CrossRef]
- Friedman, J.H. Stochastic gradient boosting. Comput. Stat. Data Anal. 2002, 38, 367–378. [Google Scholar] [CrossRef]
- Strobl, C.; Malley, J.; Tutz, G. An introduction to recursive partitioning: Rationale, application, and characteristics of classification and regression trees, bagging, and random forests. Psychol. Methods 2009, 14, 323–348. [Google Scholar] [CrossRef] [PubMed]
- Breiman, L. Random forests. Machine Learning. 2001, 45, 5–32. [Google Scholar] [CrossRef]
- Wimmers, A.J.; Moody, J.L. A fixed-layer estimation of upper tropospheric specific humidity from the GOES water vapor channel: Parameterization and validation of the altered brightness temperature product. J. Geophys. Res. Space Phys. 2001, 106, 17115–17132. [Google Scholar] [CrossRef]
- Shi, C.-H.; Guo, D.; Li, H.; Zheng, B.; Liu, R.-Q. Stratosphere-troposphere exchange corresponding to a deep convection in the warm sector and abnormal subtropoical front induced by a cutoff low over east Asia. Chin. J. Geophys. 2014, 57, 1–10. [Google Scholar]
- Sprenger, M.; Maspoli, M.C.; Wernli, H. Tropopause folds and cross-tropopause exchange: A global investigation based upon ECMWF analyses for the time period March 2000 to February 2001. J. Geophys. Res. Space Phys. 2003, 108, 8518. [Google Scholar] [CrossRef]
- Škerlak, B.; Sprenger, M.; Pfahl, S.; Tyrlis, E.; Wernli, H. Tropopause folds in ERA-Interim: Global climatology and relation to extreme weather events. J. Geophys. Res. Atmos. 2015, 120, 4860–4877. [Google Scholar] [CrossRef]
- Antonescu, B.; Vaughan, G.; Schultz, D.M. A five-year radar-based climatology of tropopause folds and deep convection ove Wales, United Kingdom. Mon. Wea. Rev. 2013, 141, 1693–1707. [Google Scholar] [CrossRef]
- Shepherd, T.G. Issues of stratosphere-troposphere coupling. J. Met. Soc. Jpn. 2002, 80, 769–792. [Google Scholar] [CrossRef]
- Stohl, A.; Bonasoni, P.; Collins, W.J.; Feichter, J.; Forster, C.; Gerasopoulos, E.; Gaggeler, H.; Kentarchos, T.; Kromp-Kolb, H.; Meloen, J.; et al. Stratosphere-troposphere exchange: A review, and what we have learned from STACCATO. J. Geophys. Res. Space Phys. 2003, 108, 8516. [Google Scholar] [CrossRef]
- Li, Y.; Niu, S.; Lü, J.; Wang, J.; Wang, T.; Hunag, Q.; Wang, Y. Analysis on Microphysical Characteristics of Three Blizzard Processes in Nanjing in the Winter of 2018. Chin. J. Atmos. Sci. 2019, 43, 1095–1108. [Google Scholar] [CrossRef]
- Hall, C.M.; Röttger, J.; Kuyeng, K.; Sigernes, F.; Claes, S.; Chau, J.L. First results of the refurbished SOUSY radar: Tropopause altitude climatology at 78°N, 16°E, 2008. Radio Sci. 2009, 44, 5008. [Google Scholar] [CrossRef]
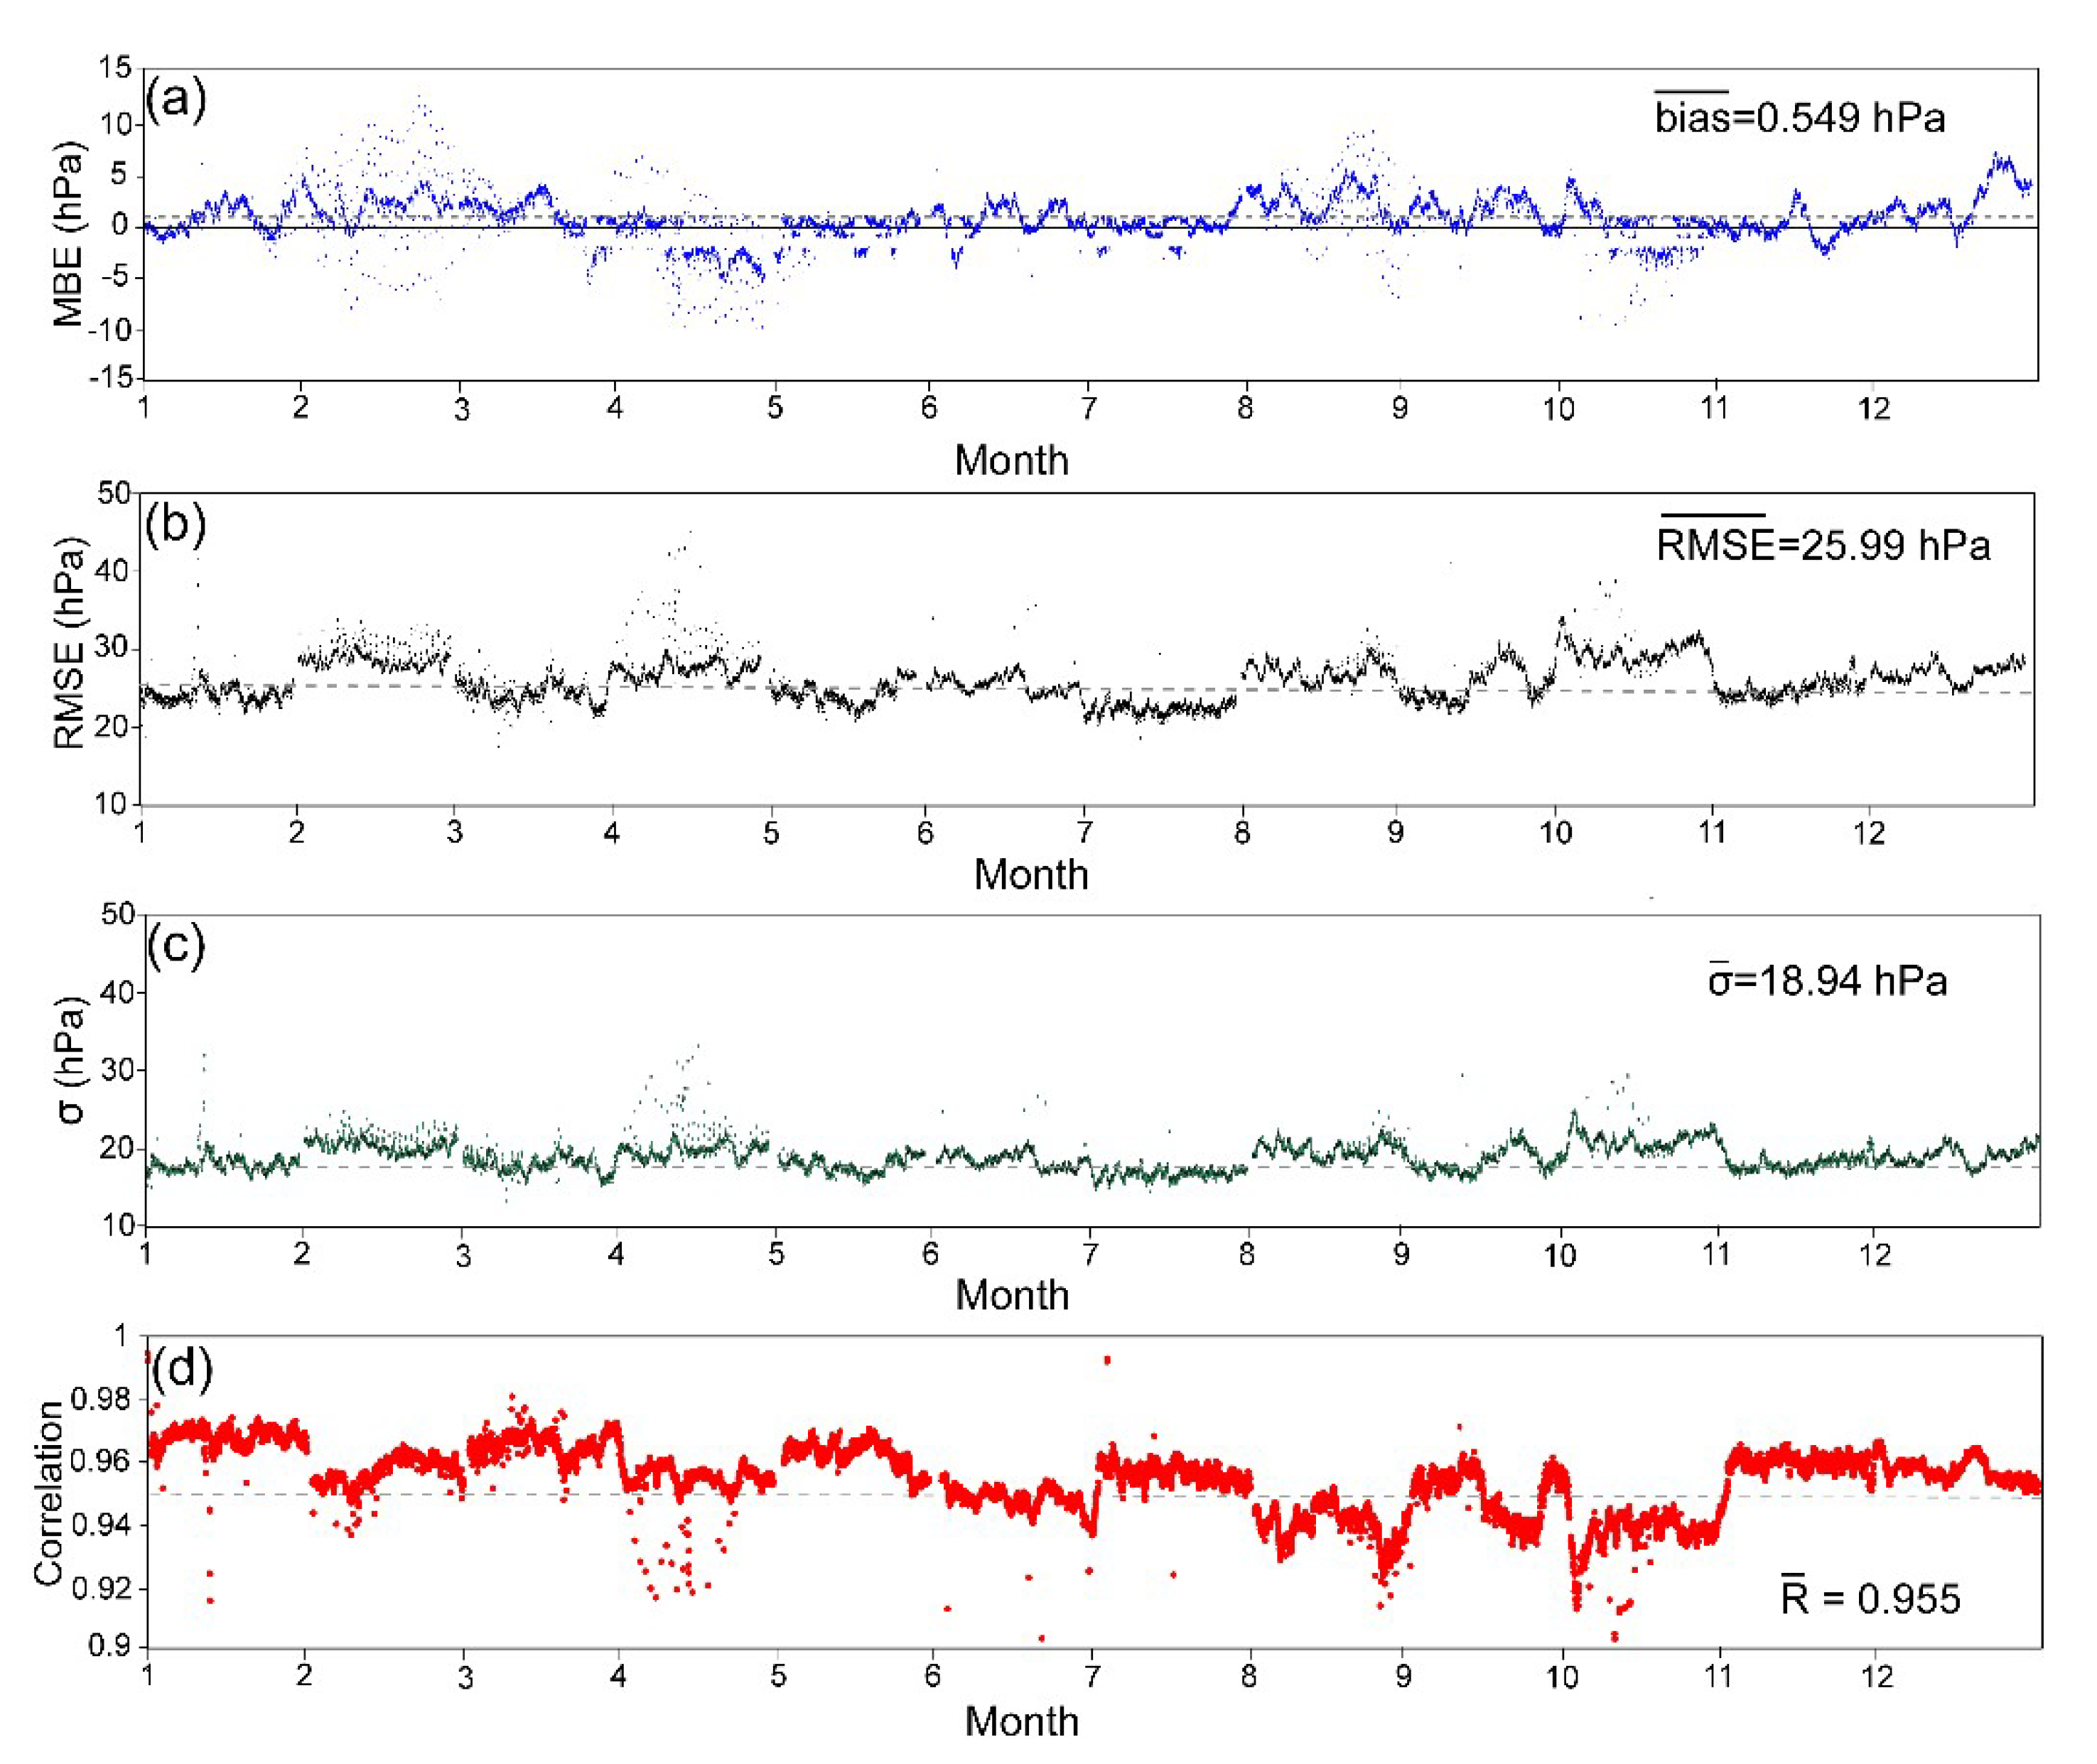
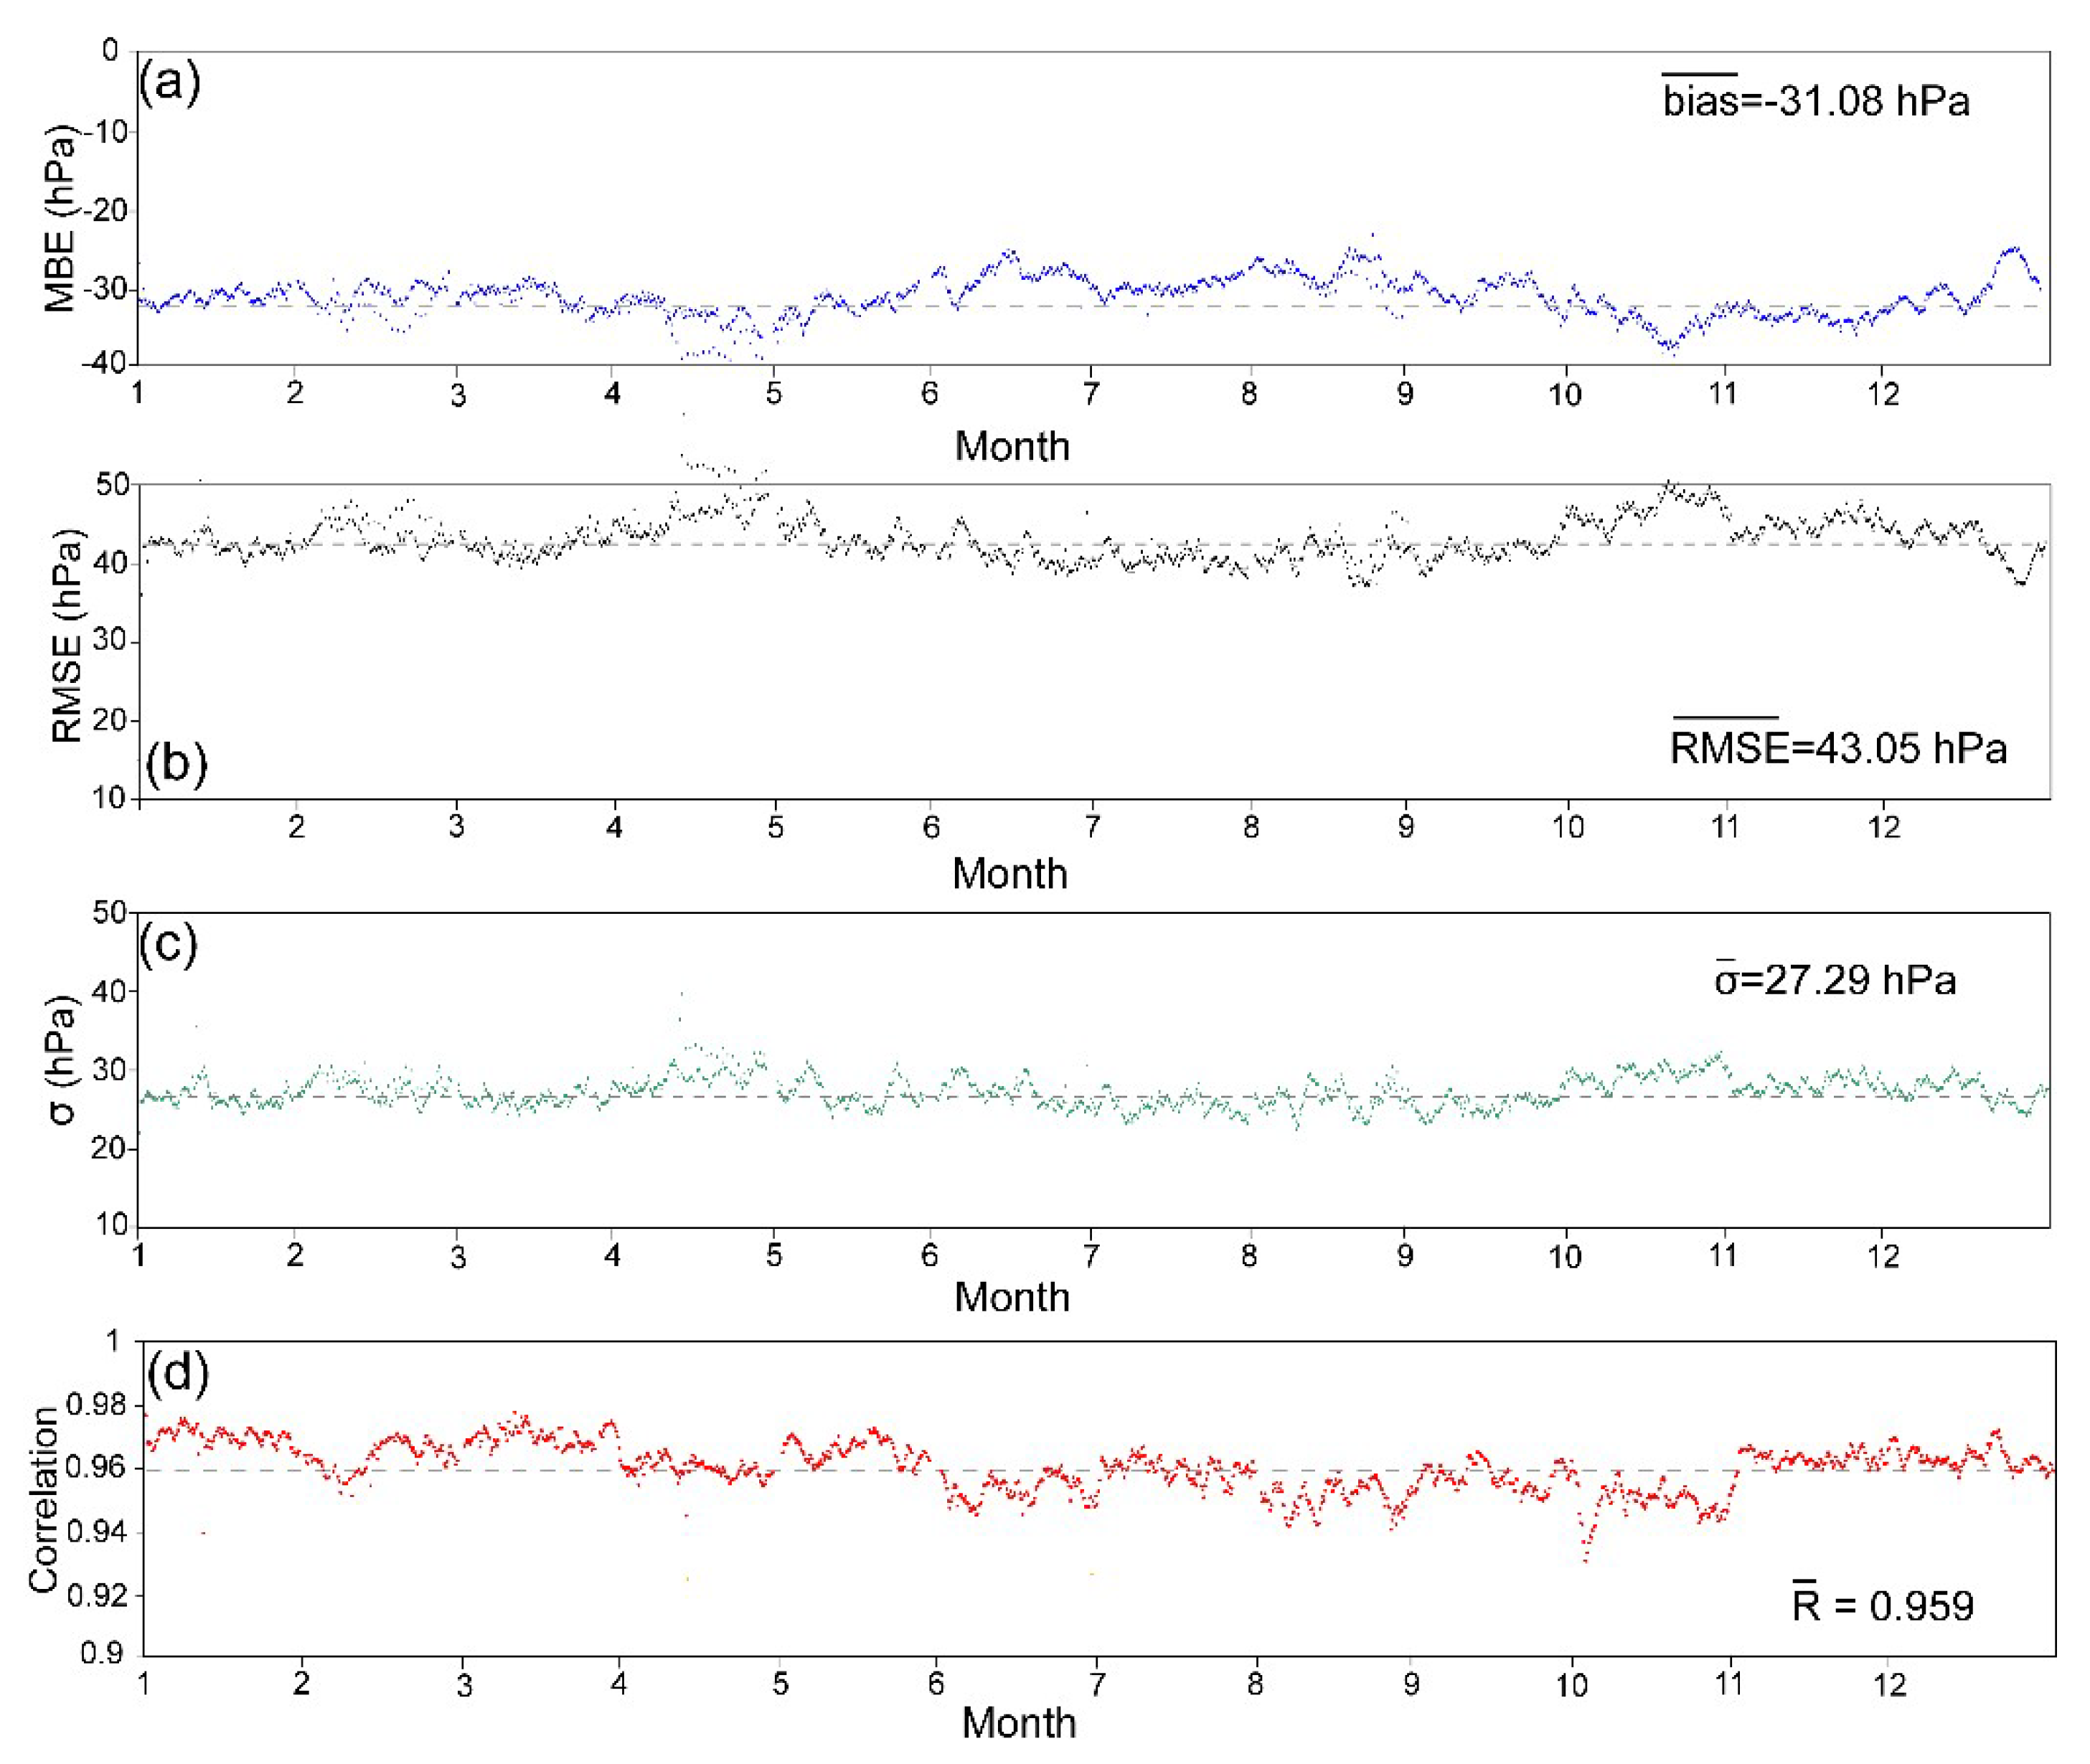
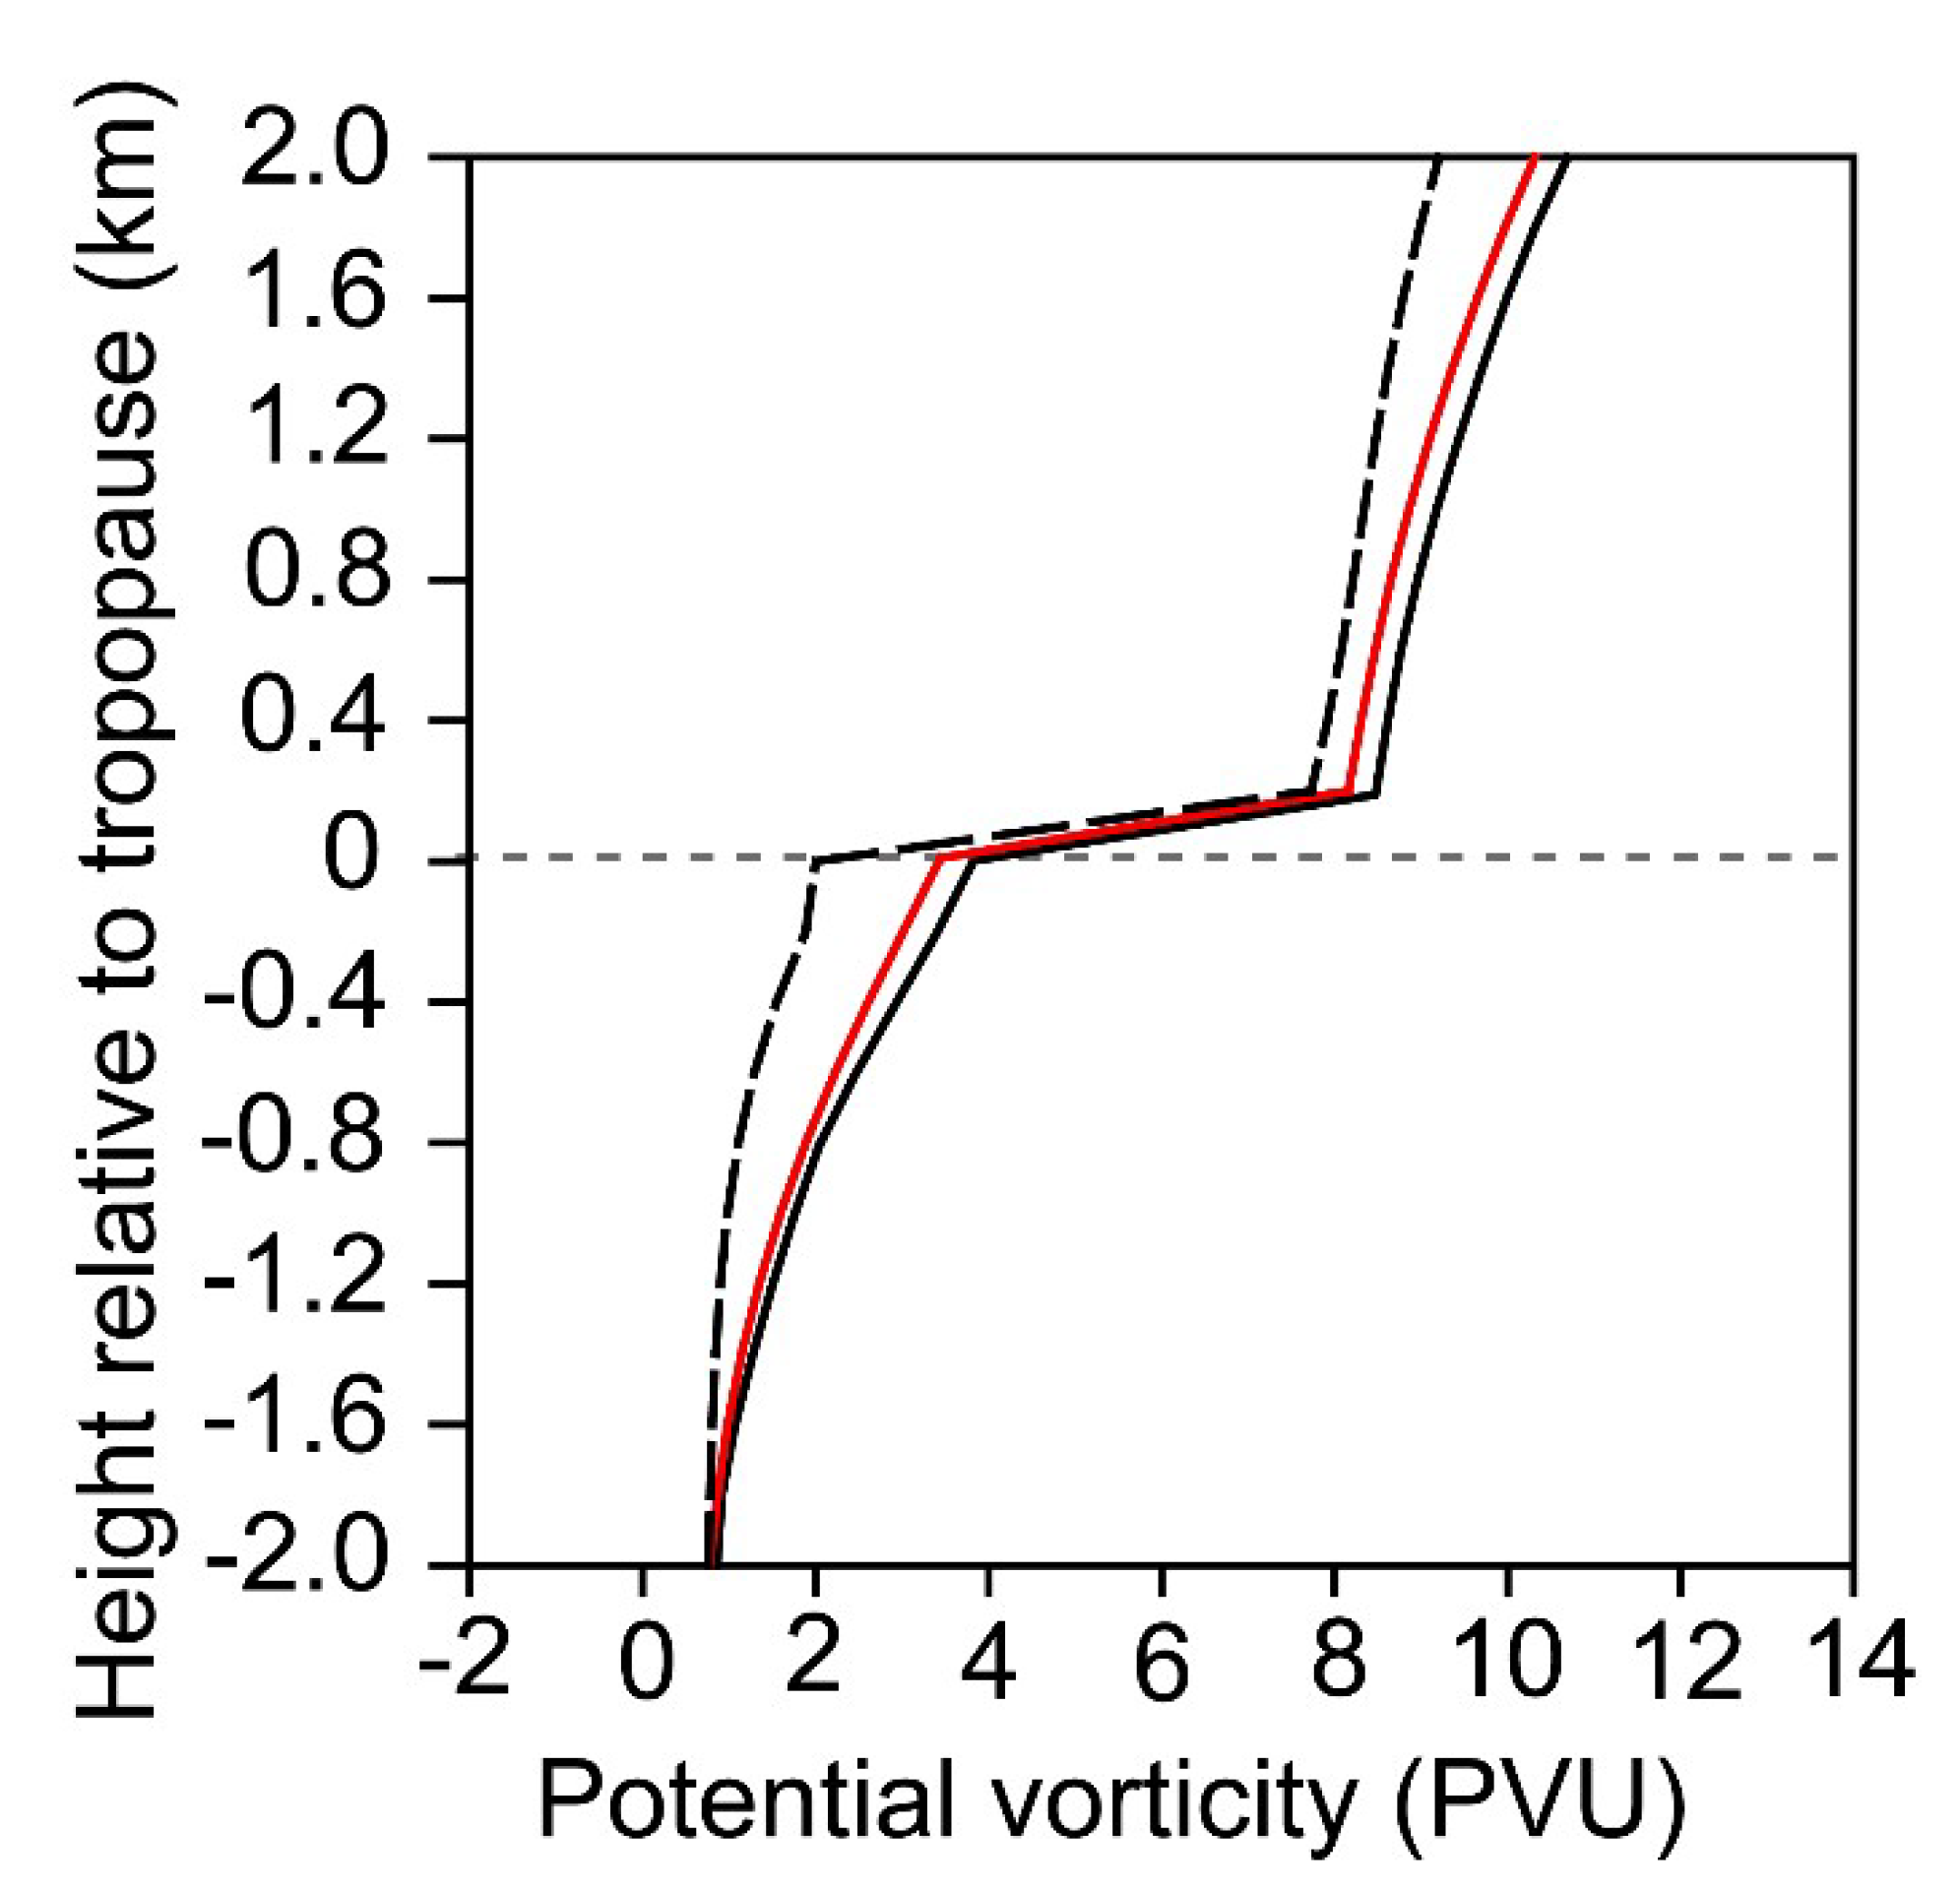
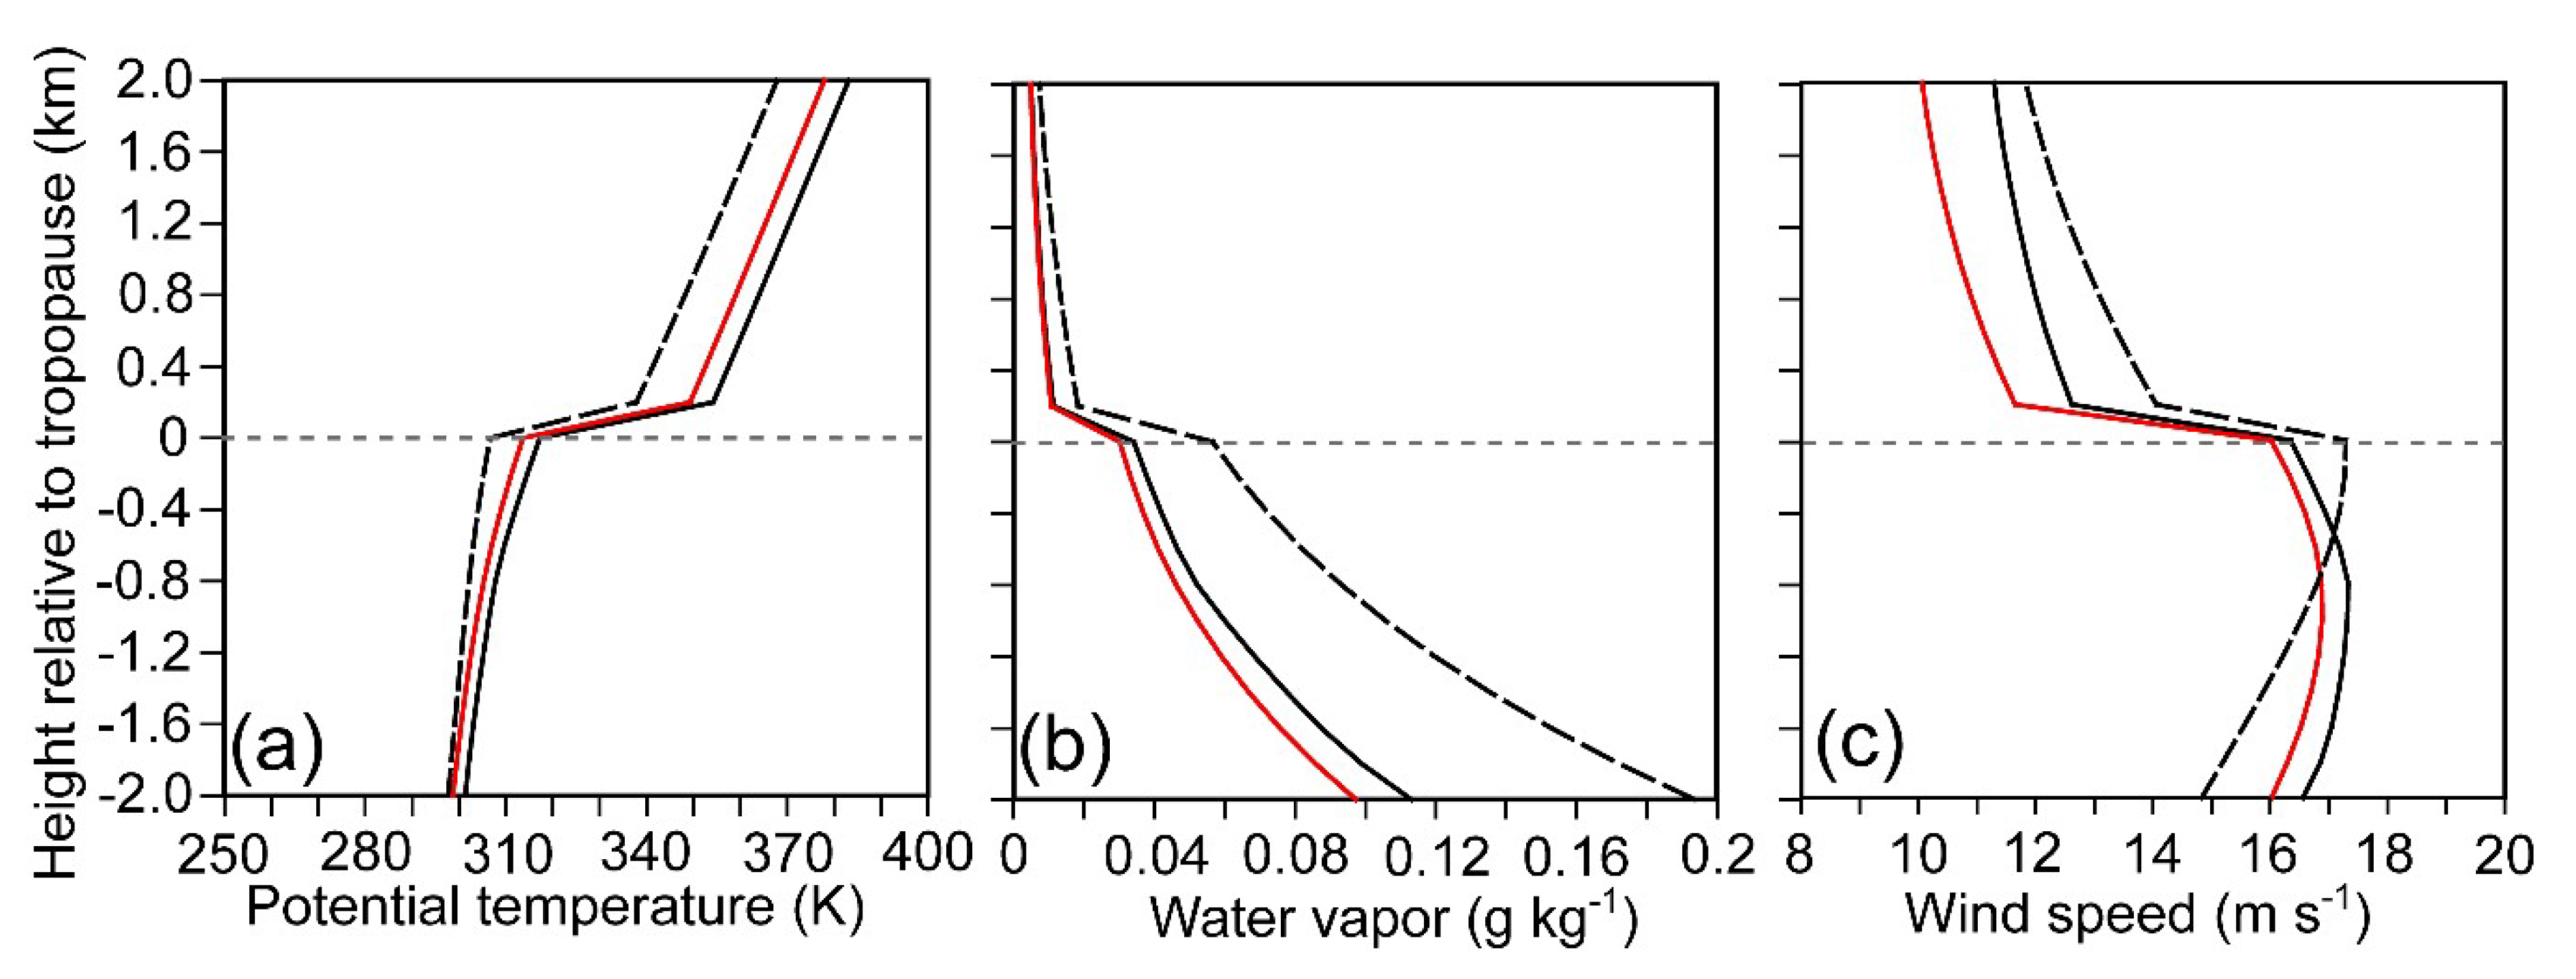

| Variables. | Physical Bases |
|---|---|
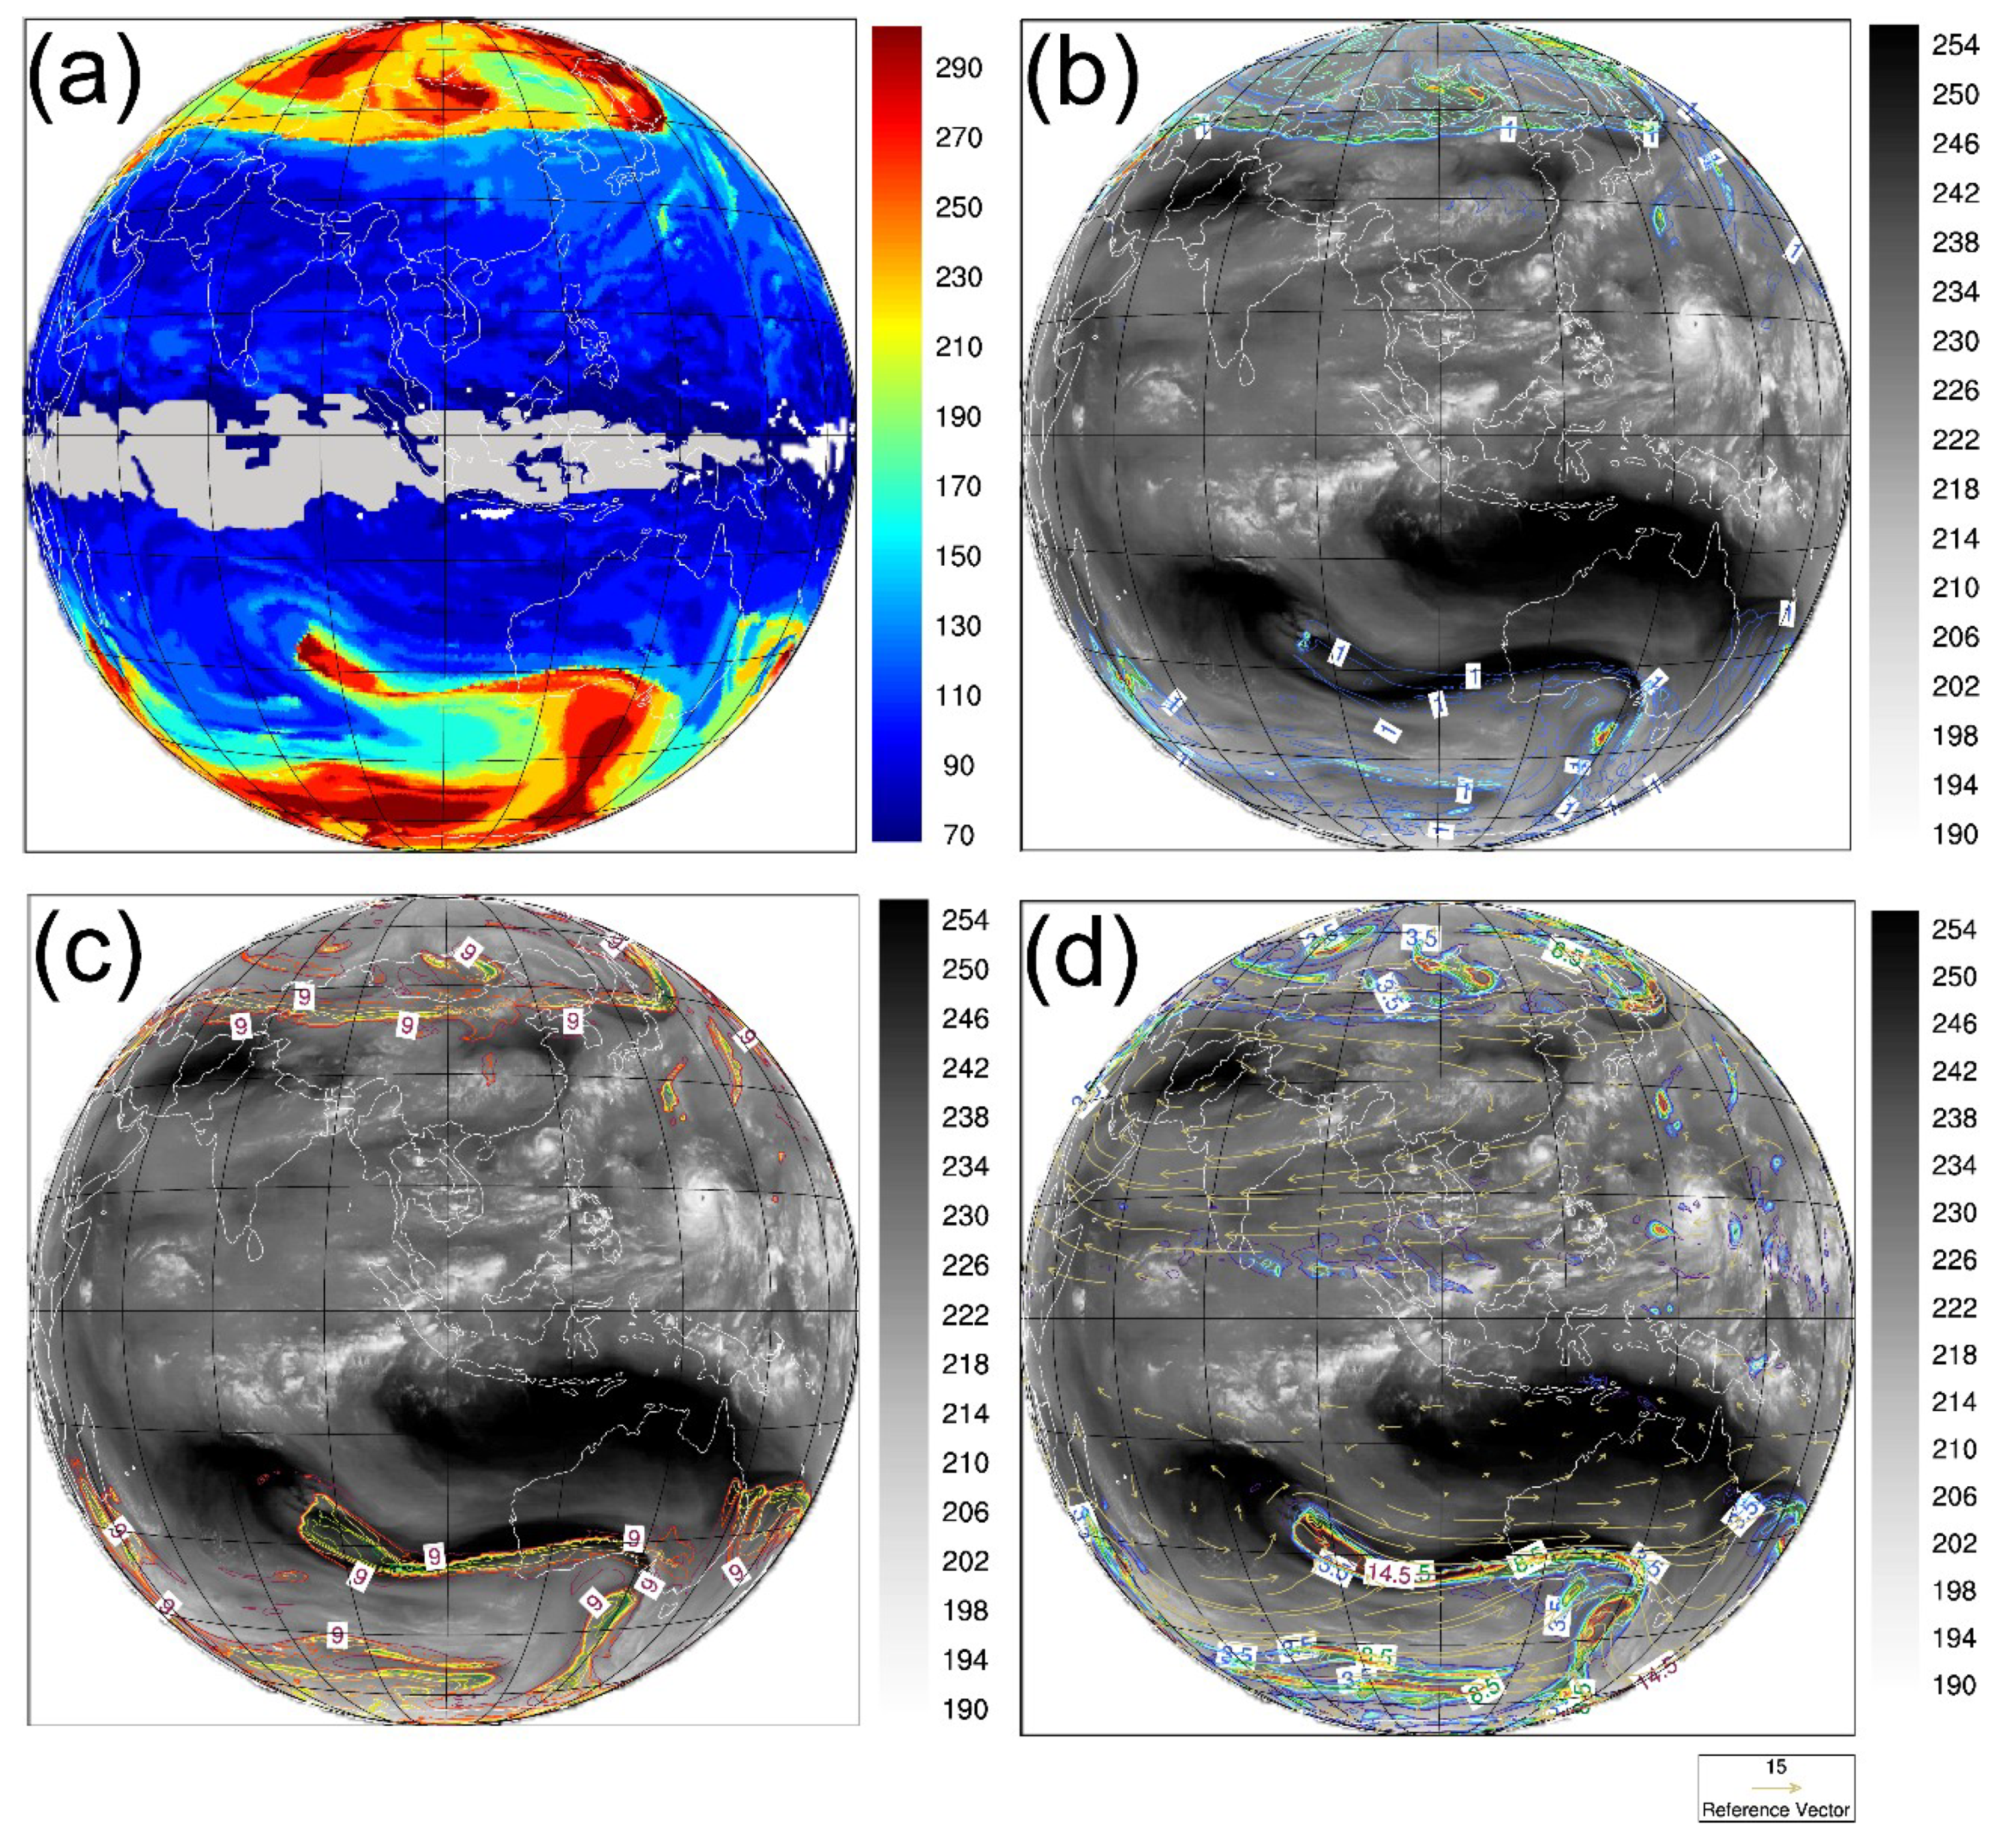
| TBB6.25 μm | Upper-tropospheric water vapor content, upper-level jets, turbulence |
| AWV6.25 μm | Upper-tropospheric water vapor content, upper-tropospheric potential vorticity |
| TBB7.1 μm | Mid-tropospheric water vapor content, upper-level jets, turbulence |
| AWV7.1 μm | Mid-tropospheric water vapor content, mid-tropospheric potential vorticity |
| TBB10.8 μm | Convection, cloud-top height, columnar water vapor content |
| TBB12.0 μm | Convection, cloud-top height, columnar water vapor content |
| Latitudinal Zone | 0°–30° | 30°–60° | |||||||
|---|---|---|---|---|---|---|---|---|---|
| Method | MBE (hPa) | RMSE (hPa) | σ (hPa) | R | MBE (hPa) | RMSE (hPa) | σ (hPa) | R | |
| Linear | 11.983 | 27.75 | 17.35 | 0.530 | −25.60 | 49.85 | 32.37 | 0.814 | |
| GBDT | −3.237 | 19.03 | 13.61 | 0.734 | 0.8645 | 39.23 | 24.59 | 0.846 | |
| KNN | −3.031 | 17.73 | 12.69 | 0.762 | 0.705 | 31.86 | 21.41 | 0.895 | |
| RF | −1.784 | 15.65 | 11.77 | 0.838 | 1.942 | 28.22 | 19.74 | 0.919 | |
| Experiment | Description |
|---|---|
| CNTL | Retrieval model is built based on predictors of time, latitude, longitude, TBBs of 10.8 μm, 12 μm, 6.25 μm, 7.1 μm, and the AWVs of 6.25 μm and 7.1 μm |
| NTIM | Remove time |
| NLAT | Remove latitude |
| NCLD | Remove TBBs of 10.8 μm and 12 μm |
| NHWV | Remove TBB and AWV of 6.25 μm |
| NMWV | Remove TBB and AWV of 7.1 μm |
| Statistics | CNTL | NTIM | NLAT | NCLD | NHWV | NMWV |
|---|---|---|---|---|---|---|
| RMSE (hPa) | 22.7 | 26.19 | 34.12 | 30.94 | 35.74 | 32.81 |
| Correlation | 0.96 | 0.94 | 0.9077 | 0.9229 | 0.8947 | 0.9123 |
© 2020 by the authors. Licensee MDPI, Basel, Switzerland. This article is an open access article distributed under the terms and conditions of the Creative Commons Attribution (CC BY) license (http://creativecommons.org/licenses/by/4.0/).
Share and Cite
Shou, Y.-X.; Lu, F.; Shou, S. High-Resolution Fengyun-4 Satellite Measurements of Dynamical Tropopause Structure and Variability. Remote Sens. 2020, 12, 1600. https://doi.org/10.3390/rs12101600
Shou Y-X, Lu F, Shou S. High-Resolution Fengyun-4 Satellite Measurements of Dynamical Tropopause Structure and Variability. Remote Sensing. 2020; 12(10):1600. https://doi.org/10.3390/rs12101600
Chicago/Turabian StyleShou, Yi-Xuan, Feng Lu, and Shaowen Shou. 2020. "High-Resolution Fengyun-4 Satellite Measurements of Dynamical Tropopause Structure and Variability" Remote Sensing 12, no. 10: 1600. https://doi.org/10.3390/rs12101600
APA StyleShou, Y.-X., Lu, F., & Shou, S. (2020). High-Resolution Fengyun-4 Satellite Measurements of Dynamical Tropopause Structure and Variability. Remote Sensing, 12(10), 1600. https://doi.org/10.3390/rs12101600


