Article

Spatial–Temporal Wetland Landcover Changes of Poyang Lake Derived from Landsat and HJ-1A/B Data in the Dry Season from 1973–2019

1
Aerospace Information Research Institute, Chinese Academy of Sciences, Beijing 100094, China
2
University of Chinese Academy of Sciences, Beijing 100049, China
3
Institute of Surface-Earth System Science, Tianjin University, Tianjin 300072, China
*
Author to whom correspondence should be addressed.
Remote Sens. 2020, 12(10), 1595; https://doi.org/10.3390/rs12101595
Submission received: 20 April 2020 / Revised: 12 May 2020 / Accepted: 14 May 2020 / Published: 17 May 2020

Abstract

:
As China’s largest freshwater lake and an important wintering ground for white cranes in Asia, the Poyang Lake wetland has unique ecological value. However, wetland cover types have changed dynamically and have attracted the attention of society and researchers over the past few decades. To obtain detailed knowledge and understanding of the long-term landcover dynamics of Poyang Lake and the associated driving forces, Landsat and HJ-1A/B images (31 images) were used to acquire classification and frequency maps of Poyang Lake in the dry season from 1973–2019 based on the random forest (RF) algorithm. In addition, the driving forces were discussed according to the Geodetector model. The results showed that the coverage of water and mudflat showed opposite trends from 1987–2019. Water and vegetation exhibited a significant decreasing trend from 1981–2003 and from 1996–2004 (p < 0.01), respectively. A phenomenon of vegetation expanding from west to east was found, and the expansion areas were mainly concentrated in the central zone of Poyang Lake, while vegetation in the northern mountainous area of Songmen (region 1) and eastern Songmen Mountain (region 2), showed a significantly expanded trend (R2 > 0.6, p < 0.01) during the five-decade period. The year-long dominant distribution of water occurred mainly in the two deltas formed by the Raohe and Tongjin rivers and the Fuhe and Xinjiang rivers, with deep water. In the 1973–2003 and 2003–2019 periods, a total of 313.522 km2 of water turned into swamp and mudflat and 478.453 km2 of swamp and mudflat transitioned into vegetation, respectively. Elevation and temperature appeared to be the main factors affecting the regional wetland evolution in the dry season and should be considered in the management of Poyang Lake. The findings of this work provide detailed information for spatial–temporal landcover changes of Poyang Lake, which could help policymakers to formulate scientific and appropriate policies and achieve restoration of the Poyang Lake wetland.

1. Introduction

Wetland ecosystems, which provide unique ecological structures and functions, are considered to be important environmental assets for humankind [1,2,3]. Wetlands are rich in biological diversity and wildlife resources. For example, they are the breeding grounds and wintering lands for many species of wildlife, especially rare waterfowl [4,5]. The environmental conditions of wetlands directly impact the reproduction of migratory birds and the balance of the ecosystem. Wetlands are considered to be a Gen-bank of natural life. Wetlands also provide production and living material resources for people. For example, wetland water can be used for fishing in certain seasons. Wetlands also play an important role in overcoming floods and drought, helping to control soil and water losses, environmental degradation, and protecting biodiversity. As a result, Wetlands are viewed as the kidneys of nature [6,7,8]. The diversity of wetlands is determined by their sources of water (such as rainfall, groundwater, tides, and rivers), the depth of water, and their persistence and frequency of flooding. However, the landscapes of wetlands have changed or even been lost due to negligent wetland management, including digging channels, building dams, and over-development [9,10]. These activities have seriously threatened wetland biodiversity and threaten human development [11,12].
As the most frequently flooded lake in China, Poyang Lake is located in the middle–lower reaches of the Yangtze River south bank (Figure 1) [13,14,15]. It is a typical seasonal lake. Generally, the dry season occurs from October to March, while the other times are known as the wet season. The surface area of Poyang Lake varies seasonally, from less than 1000 km2 to more than 3000 km2 in the wet season [16]. When the water level is low during the dry season, the wetland vegetation is exposed on the flood plain. These characteristics form the unique ecological structure of Poyang Lake. However, large amounts of land were reclaimed in the Poyang Lake area, covering a total area of 1210 km2, from 1954–1999. As a result, the lake area decreased from 5050 km2 in 1954 to 3840 km2 in 1997 [17]. This reclamation led to a decrease in lake volume and vegetation; simultaneously, the fish spawning and migration channels were destroyed. In this way, the Poyang Lake wetland ecosystem has been gradually degraded. Moreover, since the mid-1980s, breeding populations of greater white-fronted geese and bean geese have declined by 80% and 65%, respectively, in Poyang Lake, and the local government has constructed plenty of small and medium-sized dams (>3000); further, an eco-economic development zone is being planned, which may lead to the destruction of the ecological environment within Poyang Lake [18]. To protect the Poyang Lake wetland ecosystem, since 1998, the local government of Poyang Lake has implemented a plan to restore farmland to lake [19,20]. Located in the upper stream of the Yangtze, the Three Gorges Dam (TGD, the world’s largest hydroelectric dam) has been storing water since 2003 and, in doing so, has changed the structure of the local ecological environment [21,22,23,24,25,26,27]. For example, Poyang Lake’s inundation area decreased from 2000–2010 since the TGD began retaining water in 2003 [28,29]. Therefore, detailed long-term information on the spatial–temporal landcover dynamic changes, as well as their driving factors, is essential for understanding and monitoring the wetland environment. In particular, knowledge of the distribution of perennial water and the vegetation changes before and after the implementation of the TGD is important for the successful management and protection of the Poyang Lake wetland.
Remote sensing satellite imagery provides long-term earth observations, accumulating a large amount of time series data and providing a possible means to learn the long-term spatial–temporal distribution of wetland landcover types. Various researchers have obtained results using remote sensing images to research the Poyang Lake wetland [6,30,31,32]. The vegetation in the Poyang lake wetland experienced an increasing trend from 1973 to 2013 based on eleven Landsat images (15.9 km2/year) [4]. Four vegetation species of the Poyang Lake wetland were classified and analyzed during the period of 2010–2016 based on seven Landsat images between October and December [33]. These discontinuous results are insufficient for long-term analyses, and some changing trends could have been missed. Moderate resolution imaging spectroradiometer (MODIS) resolution (250 m) data were used to analyze the characteristics of Poyang Lake’s inundation from 2000–2010 [28]. Another study calculated the inundation frequency of all the Landsat images available on the Google Earth Engine (GEE) from 1988–2016 [29]. However, these researchers only studied the patterns of lake inundation; the driving factors were not quantitatively analyzed. If a detailed analysis of changes among other landcover types, such as vegetation, swamp, marsh and mudflat were conducted, the results could lead to more accurate guidelines for policymakers.
In this study, Poyang Lake was divided according to its hydrological characteristics into six different zones to obtain detailed information about wetland landcover dynamic changes and driving forces. We constructed wetland classification maps based on 31 remote sensing images in the dry season with the RF algorithm with the following targets: (1) to record and analyze the spatial–temporal wetland landcover changes from 1973–2019 and to map the long-term distribution of landcover; (2) to compare and analyze the major landcover changes and transition between the two periods of 1973–2003 and 2003–2019; and (3) to analyze and discuss quantitatively the driving forces affecting landcover changes in the long-term.

2. Materials and Methods
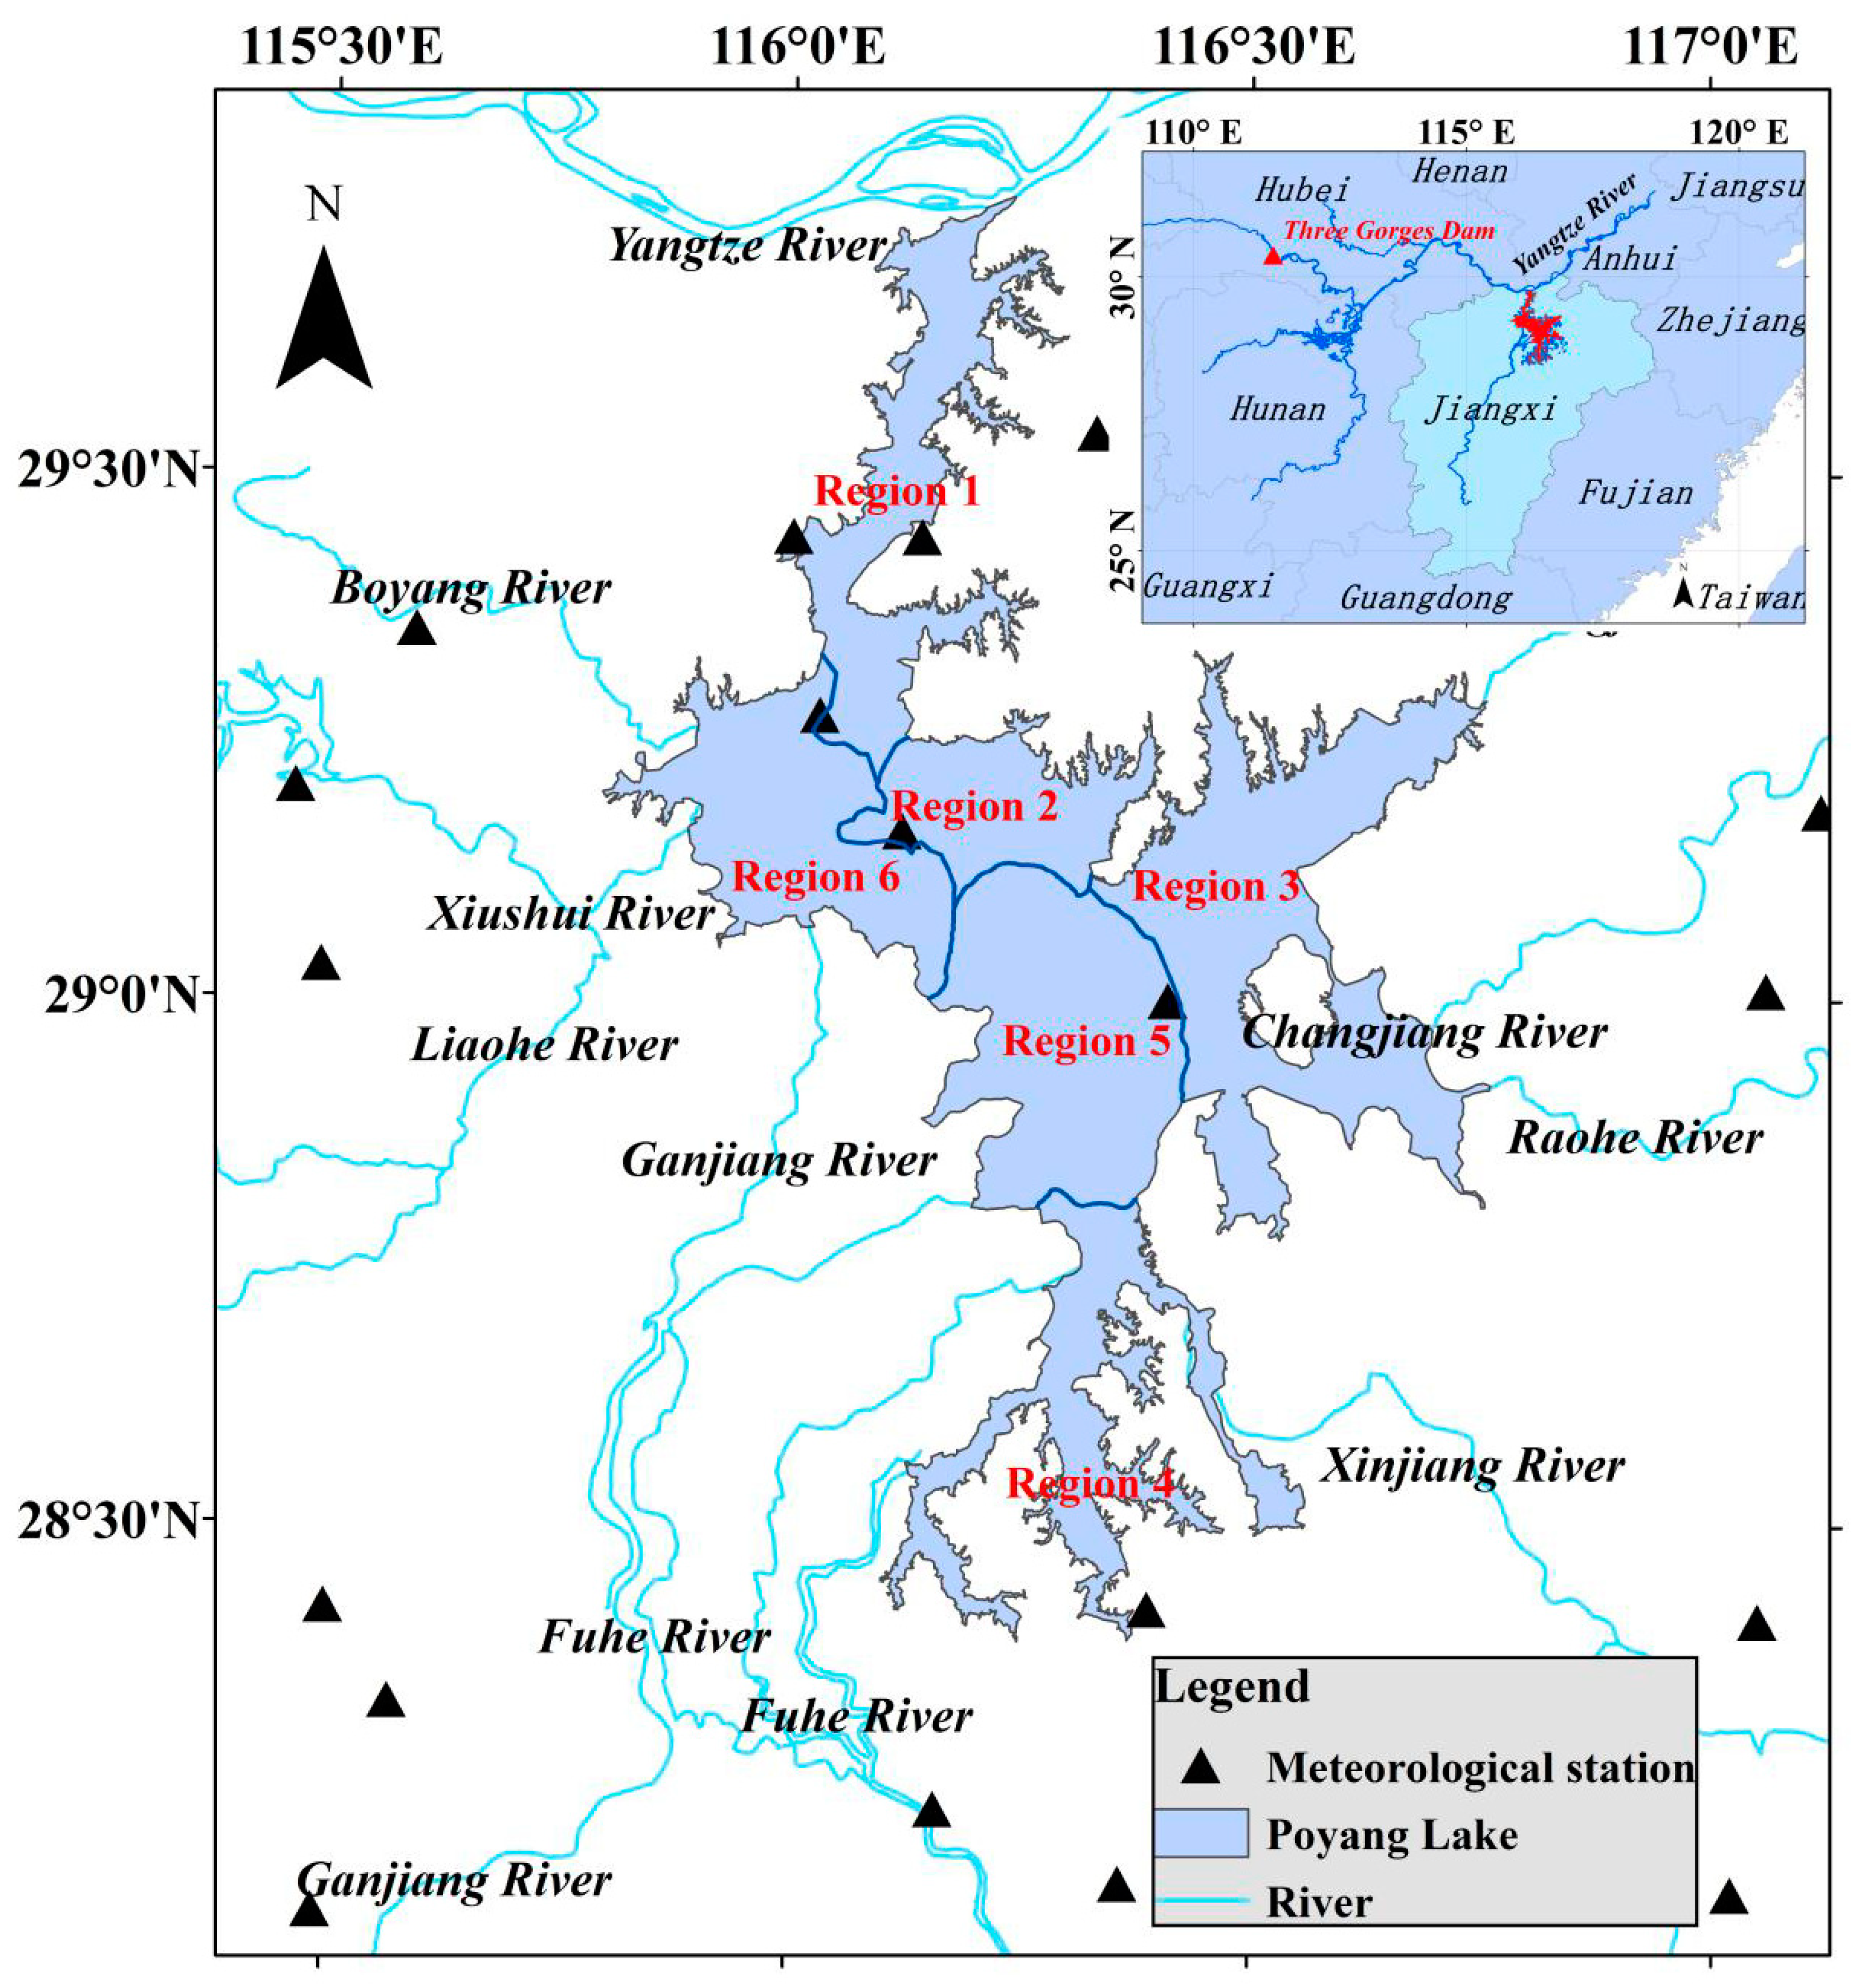
2.1. Study Area

Poyang Lake is located at 28°22′–29°45′N and 115°47′–116°45′E (Figure 1) [34]. It is one of the first wetlands in China to be included in the list of the internationally most important wetlands and the world’s most important wetlands [29,33,35]. Five local rivers (Raohe, Xinjiang, Fuhe, Ganjiang, and Xiushui rivers) and precipitation are the main sources of Poyang Lake’s water [36]. Poyang Lake also interacts with the Yangtze River at Hukou in the north [4,35]. During the wet season (April to September), the water is endless, and the inundated area exceeds 3000 km2; during the dry season (October to March), the sandy beaches and vegetation are exposed, and the water area is less than 1000 km2 [28,37]. A river–lake reversal phenomenon can occur when the water level of the Yangtze is greater than that of Poyang Lake, allowing the maximum submerged area to be observed. This process forms the unique hydrological characteristics of the Poyang lake wetland, which is rich in biological resources, such as vegetation and mudflats, and provides a large number of wildlife habitats, thus enabling growth and reproduction. Poyang Lake also provides the world’s most important wintering grounds for white cranes and the largest wintering ground for migratory birds in Asia [29,38].
Wang et al. [29] divided Poyang Lake into five regions according to its spatial hydro–geomorphological characteristics. To obtain more information in this study, we divided the lake into six regions based on this strategy and the distribution of the national nature reserves: region 1, located in the northern mountainous area of Songmen, mainly deep water; region 2, located in the eastern Songmen mountainous area, mainly a distributed water body; region 3, the delta formed by the Raohe and Tongjin rivers; region 4, the delta formed by the Fuhe and Xinjiang rivers; region 5, the Poyang Lake Nanjishan Wetland National Reserve in the Ganjiang delta; and region 6, mainly the Poyang Lake National Reserve, a delta formed by the Ganjiang and Xiushui rivers that was established in 1983.

2.2. Datasets

In this paper, we used Landsat and HJ1A/B images from 1973–2019 to investigate the wetland changes of Poyang Lake in the dry season (Table 1). To ensure that the long-term results were comparable, the images were acquired between late November and early February of the following year (Table 1) when the regional environmental characteristics of the lake were relatively stable and similar [4,33]. Based on this, 31 cloud-free images (mainly taken in December and January of several years between 1973 and 2019) were selected. Among these data, 26 Landsat satellite series data, Landsat 1–4 Multi Spectral Scanner (MSS), Landsat 5 Thematic Mapper (TM), and Landsat 8 Operational Land Imager (OLI), were obtained and downloaded from the United States Geological Survey (USGS, https://earthexplorer.usgs.gov/). All Landsat data were geometrically corrected (Level 1T, L1T) using USGS. The data collected by the Landsat TM included the surface reflectance generated by the USGS with the Landsat Ecosystem Disturbance Adaptive Processing System algorithm [39,40] using the Landsat Surface Reflectance Code algorithm [41], and the OLI surface reflectance image was produced. The radiometric calibration coefficient and FLAASH algorithm were used in ENVI 5.3 software to convert Landsat MSS images into surface reflectance.
HJ-1A/B satellites were launched from China on 6 September 2008 at the Taiyuan satellite launch center in Shanxi Province and were designed to monitor the ecological environment and natural disasters [42,43]. The HJ-1A/1B images have four spectral bands: blue (430–520 nm), green (520–600 nm), red (630–690 nm), and near-infrared (760–900 nm), with a spatial resolution of 30 m. Five HJ-1A/1B satellite images with little cloud coverage were downloaded from the China Center for Resources Satellite Data and Application (CCRSDA, http://www.cresda.com/CN/) as additional data for December 2010–2012, 2014, and 2019. All HJ datasets were geometrically corrected based on the Landsat OLI image, which was taken on 24 December 2013, and the errors were controlled within 1 pixel.
The digital elevation model (DEM) of Poyang Lake from the Shuttle Radar Topography Mission (SRTM) Version 4 with a spatial resolution of 90 m was download from the Geospatial Data Cloud site, Computer Network Information Center, Chinese Academy of Sciences.
Meteorological data acquired from 19 meteorological stations (Boyang, Hukou, Xingzi, Douchang, Yugan, Jiujiang, etc.) were used to analyze and discuss the driving factors of landcover changes. These data were obtained from the National Meteorological Information Center, China.

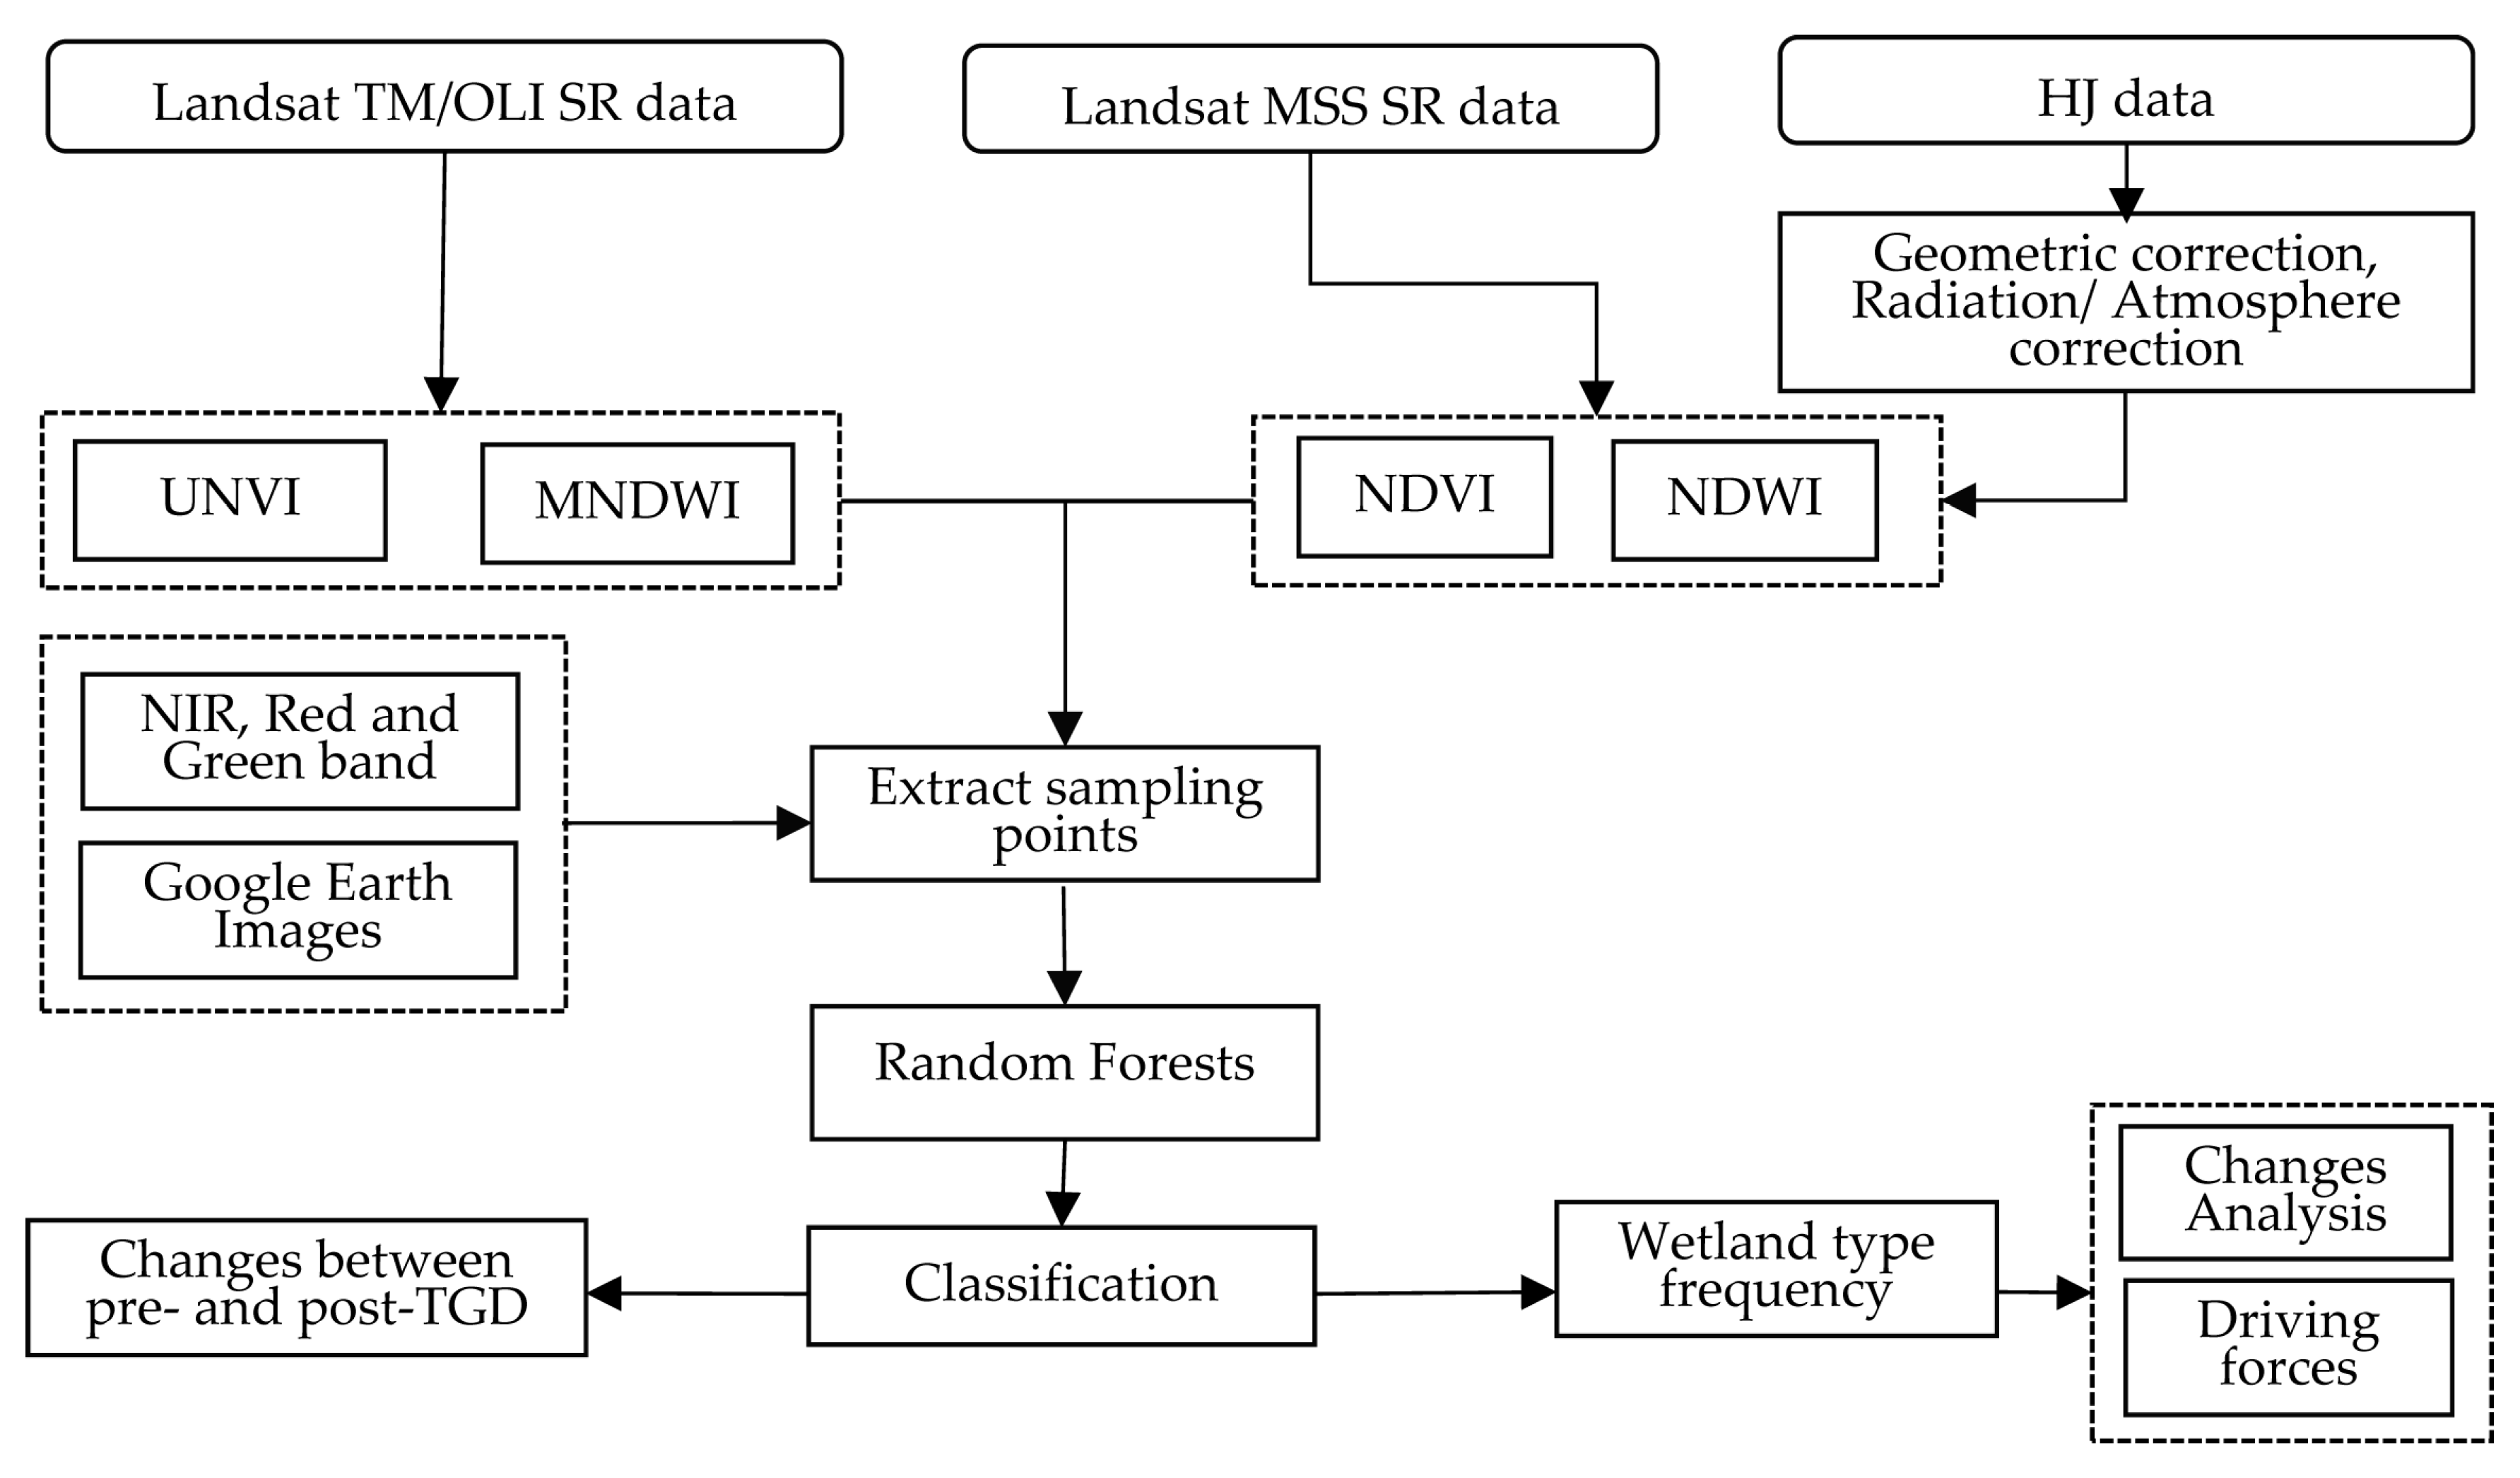
2.3. Image Classification

Four major types, vegetation, water, sand, and finally swamp, marsh, and mudflat [4,27,33,44,45], were classified in Poyang Lake. As a branch of machine learning, the random forest (RF) algorithm can process input samples with high dimensional characteristics without requiring reduction and has a good ability to resist noise components [46,47,48]. The decision tree is the most basic unit of an RF. The core concept of RF is that, by combining several weak classifiers, a strong classifier with superior classification performance is obtained. More details about RF can be found in [49]. In this study, the RF method was used to classify wetland landcover types, vegetation, water, sand, and swamp & mudflat, in dry seasons during the period of 1973–2019.
Researchers proposed the universal normalized vegetation index (UNVI) to overcome the weakness of the normalized difference vegetation index (NDVI), which is calculated based on the universal pattern decomposition method (UPDM) and is an improved vegetation index. It takes full advantage of all spectral information [50,51], and UNVI was successfully used in the assessment the vegetation dynamics [51]. According to UPDM, the spectra of each pixel are represented as the linear sum of spectral patterns: water, vegetation, soil and yellow leaves [50]. Therefore, the reflectance of each pixel measured by a sensor can be expressed as:
R ( i ) C w × P w ( i ) + C v × P v ( i ) + C s × P s ( i ) + C 4 × P 4 ( i )
where (Cw, Cv, Cs, C4) are the decomposition coefficients, and (Pw(i), Pv(i), Ps(i), P4(i)) are the standard spectral model for sensor band i of water, vegetation, soil, and yellow leaves. Zhang et al. [51] derived a simple coefficient matrix M for different satellite sensors, and the matrix parameters M of the Landsat TM and OLI sensors are provided in [51]. The calculation of UNVI can be expressed as:
C = M R U N V I = C v 0.1 C s C 4 C w + C v + C s
here R represents reflectance data, and R = [R1, R2, …, Rn]T; n is the number of spectral bands. M represents the coefficient matrix M, and M = [Mw, Mv, Ms, M4]T; the coefficient M is the 4 × n matrix. C represents the UPDM coefficients, and C = [Cw, Cv, Cs C4]T.
The normalized difference water index (NDWI), calculated as (RGreen – RNIR)/(RGreen + RNIR), was proposed by Mcfeeters [52]. Xu proposed a modified NDWI (MNDWI), calculated as (RGreen – RMIR)/(RGreen + RMIR), which solves the problem of shadows in water extraction and increases the accuracy of water extraction [53]. We selected UNVI, MNDWI, and the original near infra-red (NIR), red, and green bands as the predictors of the RF method for the Landsat TM and OLI sensors. For the Landsat MSS and HJ sensors, we selected the NDVI, NDWI, NIR, red, and green bands due to the lack of a mid-infrared band. We selected these predictors because NDVI and UNVI have been successfully used to extract vegetation information [51,54,55]. NDWI and MNDWI can enhance the water information to extract water in wetlands [56,57]. More information for sand, as well as for swamp, marsh, and mudflat can be obtained from the near infrared (NIR), red, and green bands. We selected samples of the four wetland types based on these predictors through visual interpretation and Google Earth, which provides more easily accessible high-resolution images to help determine the accuracy rate. After classification, we calculated the frequency of wetland types during the dry seasons of 1973–2019 for future analysis. The work flow of this paper is shown in Figure 2.

2.4. GeoDetector Model

The spatial distribution of geographical phenomena is affected by many factors. A new statistical algorithm for detecting the corresponding variables or the key driving factors that influence this change is the GeoDetector model, which was proposed by Wang et al. [58]. GeoDetector was successfully applied in many areas [59,60,61,62] and has shown compatibility and superiority in exploring interactions. The main advantages of this method are that no linear assumptions between the driving factors and phenomena are required and that the calculation results are not affected by multi-variable correction [63]. The geographical detector is composed of a factor detector, an interaction detector, a risk detector, and an ecological detector [58]. In this study, we used the factor detector and the interaction detector to analyze the driving force of long-term wetland changes in Poyang Lake during the dry season. For the factor detector, q was used to explore the ability of driving factors X to explain the spatial variability Y. The larger the q value, the greater the contribution of the factor to explaining the changes. The q value can be expressed as:
q = 1 1 N σ 2 i = 1 L N i σ i 2
where N is the number of Y values and σ 2 is the variance within Y in the study area, i represents the strata of Y (i = 1, 2, 3, …, L), and q denotes the degree of independent variables X that explain Y. The value range of q is 0 to 1.
The interaction detector explores whether two or more driving factors have an interaction effect (an increase or decrease) on the response variable Y. Compare the q values of q(X1), q(X2), and q(X1 ∩X2) to determine these relationships. If the q value of q (X1 ∩X2) is greater than q(X1) or q(X2), the two factors X1 and X2 produce more of an effect than each of them in isolation. More information could be found in [58].
In this analysis, the response variable was taken as the frequency value of different wetland types from 1973–2019. According to previous research results, a zonal distribution of vegetation communities along elevation exists in Poyang Lake wetlands. The average, maximum, and minimum temperatures, total precipitation, and the number of days with daily precipitation ≥0.1 mm for September to November from 1973–2019 were chosen as the climate factors [4,29,60]. The topographical factors included the elevation, slope, aspect, and curvature [64,65]. The elevation was divided into seven categories (≤10.5, ≥15.5, and 10.5–15.5 m in 1 m intervals). The slope, aspect, and curvature were divided into five categories; the ranges were: ≤0.1°, 0.1–0.27°, 0.27–0.67°, 0.67–1.89°, and >1.89°; ≤50°, 50–137°, 137–209°, 209–280°, and >280°; and (≤–0.03, –0.03 to –0.0003, –0.003 to 0.02, 0.02 to 0.11, and >0.11, respectively.

3. Results: Long-Term Landcover Changes

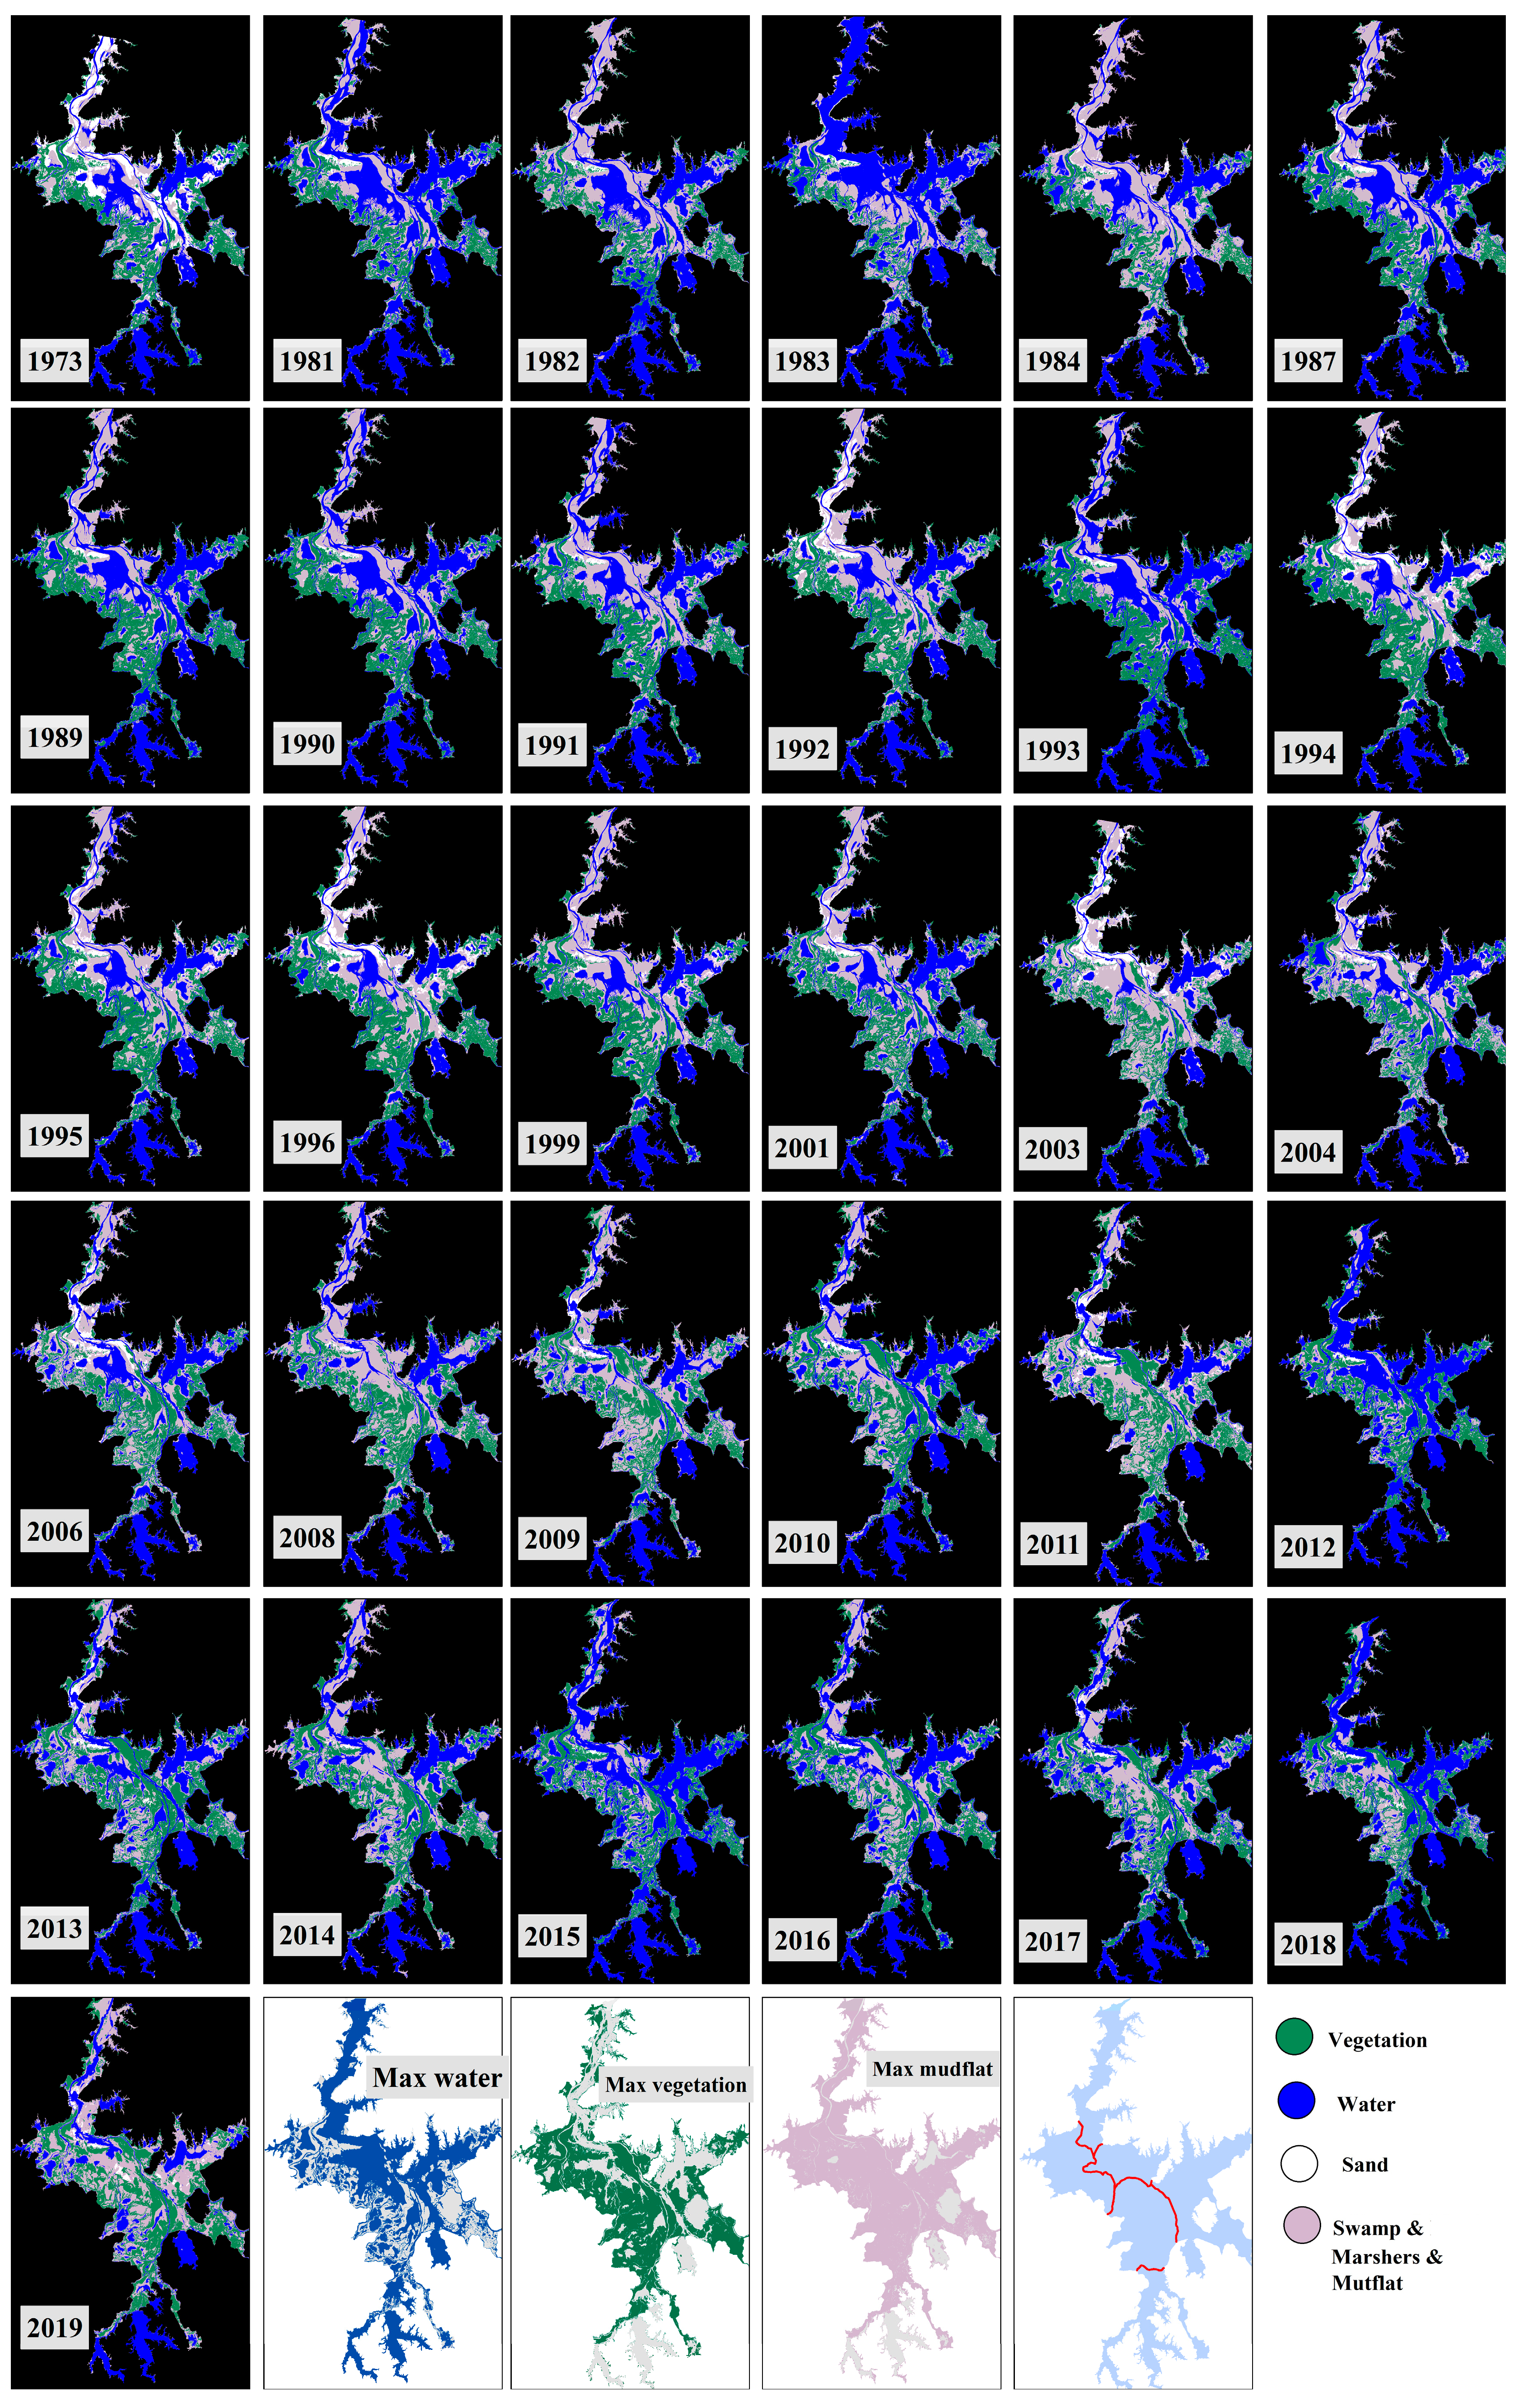
3.1. Image Classification

The time-series wetland landcover types of Poyang Lake in the dry season from 1973 to 2019 are shown in Figure 3. The spatial distribution of the wetland landcover types varied among the six regions. To ensure classification accuracy, all the classification results were examined using the remote sensing images and Google Earth. Manually interpreted samples were used to verify the accuracy of the assessment reports. The reports for 2017 are shown in Table 2, and the kappa coefficient was 0.96. The overall accuracy, producer accuracy, and kappa coefficient of all the classification results were above 90%. For Landsat TM and OLI sensors, UNVI, MNDWI, NIR, Red, and Green were selected as the predictors of the RF method, and NDVI, NDWI, NIR, Red, and Green were selected for Landsat MSS and the HJ sensor. To ensure classification accuracy, the classification maps in 2017 were calculated by a band combination of UNVI, MNDWI, NIR, Red, and Green (combination 1), and NDVI, NDWI, NIR, Red, and Green (combination 2). The accuracy reports for 2017 are shown in Table 3. The accuracy reports of combinations 1 and 2 are almost the same, and the difference of the total accuracy is less than 2.67%. Consistent classification results can be obtained using combinations 1 and 2, i.e., the classification results from the band combination of NDVI, NDWI, NIR, Red, and Green for Landsat MSS and HJ, and the combination of UNVI, MNDWI, NIR, Red, and Green for Landsat TM and OLI was consistent.
As shown in Figure 3, the distribution of landcover types was different between the regions. Basically, the boundaries of vegetation were covered with swamp, marsh, and mudflat. In the long-term, for regions 1 and 2, the main types were water, swamp, marsh, and mudflat, whereas regions 3 and 4 were dominated by water and vegetation. In the center of regions 5 and 6, the major type was vegetation. The landcover type in the center of the Poyang Lake wetland (the junction of region 2 and region 5) was mainly water before 2003 but changed into vegetation and swamp, marsh and mudflat after 2003. The sandy areas were the largest in 1973, 572.701 km2, and were mainly distributed in the north of Songmen Mountain from 1973–2019. In 1983, the water covered 1988.22 km2 during the dry season, comprising 55.52% of the Poyang Lake wetland. This occurred primarily because Jiangxi Province experienced increased precipitation and floods, and the rainfall from January to July was 1529 mm, which was 3.8 times that in the same period in the previous year [66]. The Junshan and Qinglan Lakes, located in the south of region 4, were mainly covered by water from 1973 to 2019. The main wetland types in eastern region 5 have transformed into vegetation, swamp, marsh, and mudflat since 2003.
The Poyang Lake wetland landcover types experienced different stages from 1973 to 2019, as shown in Figure 4. The area of all landcover types showed statistically significant trends. The total area of sand in Poyang Lake experienced a significant trend: (except for the initial year, 1973, with 592.701 km2), slowly increasing (1974–2003, 7.21 km2/year, p < 0.01), and then decreasing (2003–2019, –10.71 km2/year, p < 0.01). The swamp, marsh, and mudflat in Poyang Lake experienced four stages: a sharp increase (1973–1984, 45.345 km2/year, p < 0.01), a slow increase (1987–2003, 20.737 km2/year, p < 0.01), a sharp decrease (2003–2015, –44.491 km2/year, p < 0.01), and then another sharp increase (2015–2019, 98.273 km2/year, p < 0.01). A similar situation occurred with vegetation. The vegetation of Poyang Lake experienced a slow but significant trend of 39.208 km2/year, p < 0.01, from 1981–1996. During the periods of 1996 to 2004 and 2004 to 2019, the vegetation experienced a sharp decreasing trend (–47.278 km2/year, p < 0.01) and then a slow increasing trend (9.820 km2/year, p < 0.01), respectively. The water in Poyang Lake experienced three stages: a sharp decrease (1981–2003, –32.507 km2/year, p < 0.01), a sharp increase (2003–2015, 44.497 km2/year, p < 0.01), and then another sharp decrease (2015–2019, –129.53 km2/year, p < 0.01). In conclusion, all landcover types of wetlands experienced significant trends before and after 2003: the water and vegetation increased; conversely, the sand, swamp, and mudflat decreased. The TGD has been storing water since 2003, at which point the trends of the landcover types reversed, the wetland landcover changes before and after the TGD period are discussed accordingly in Section 4.1.

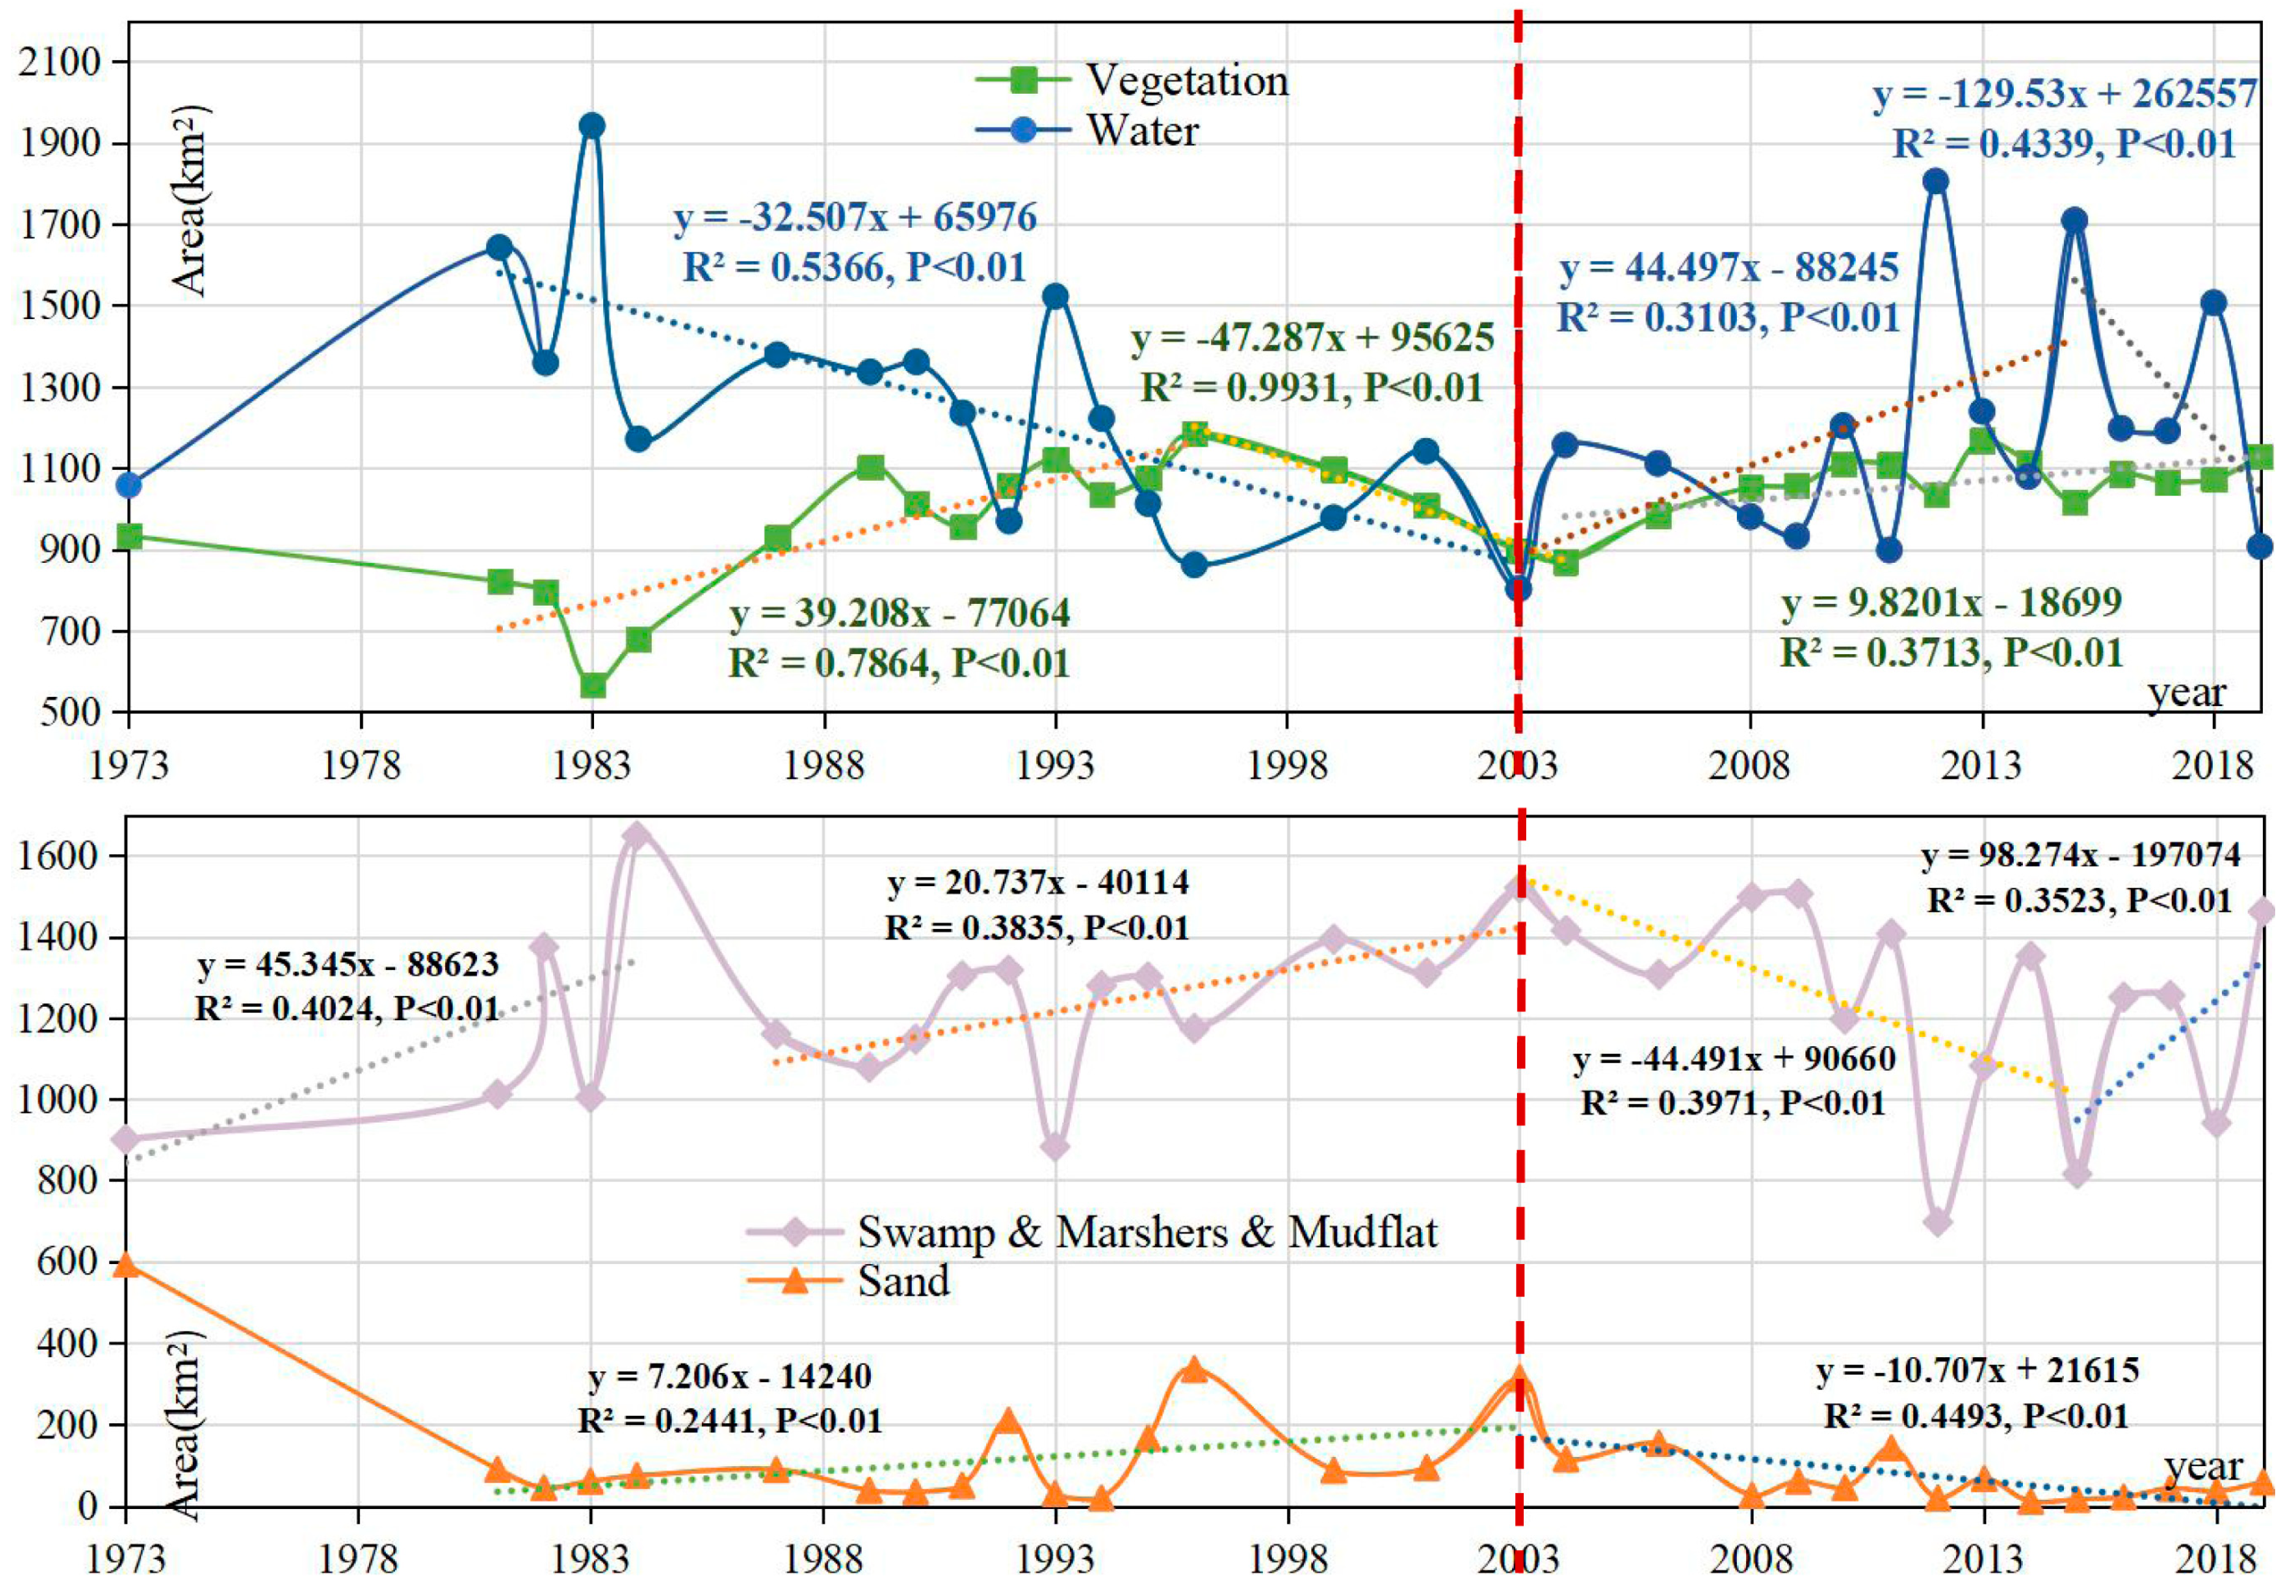
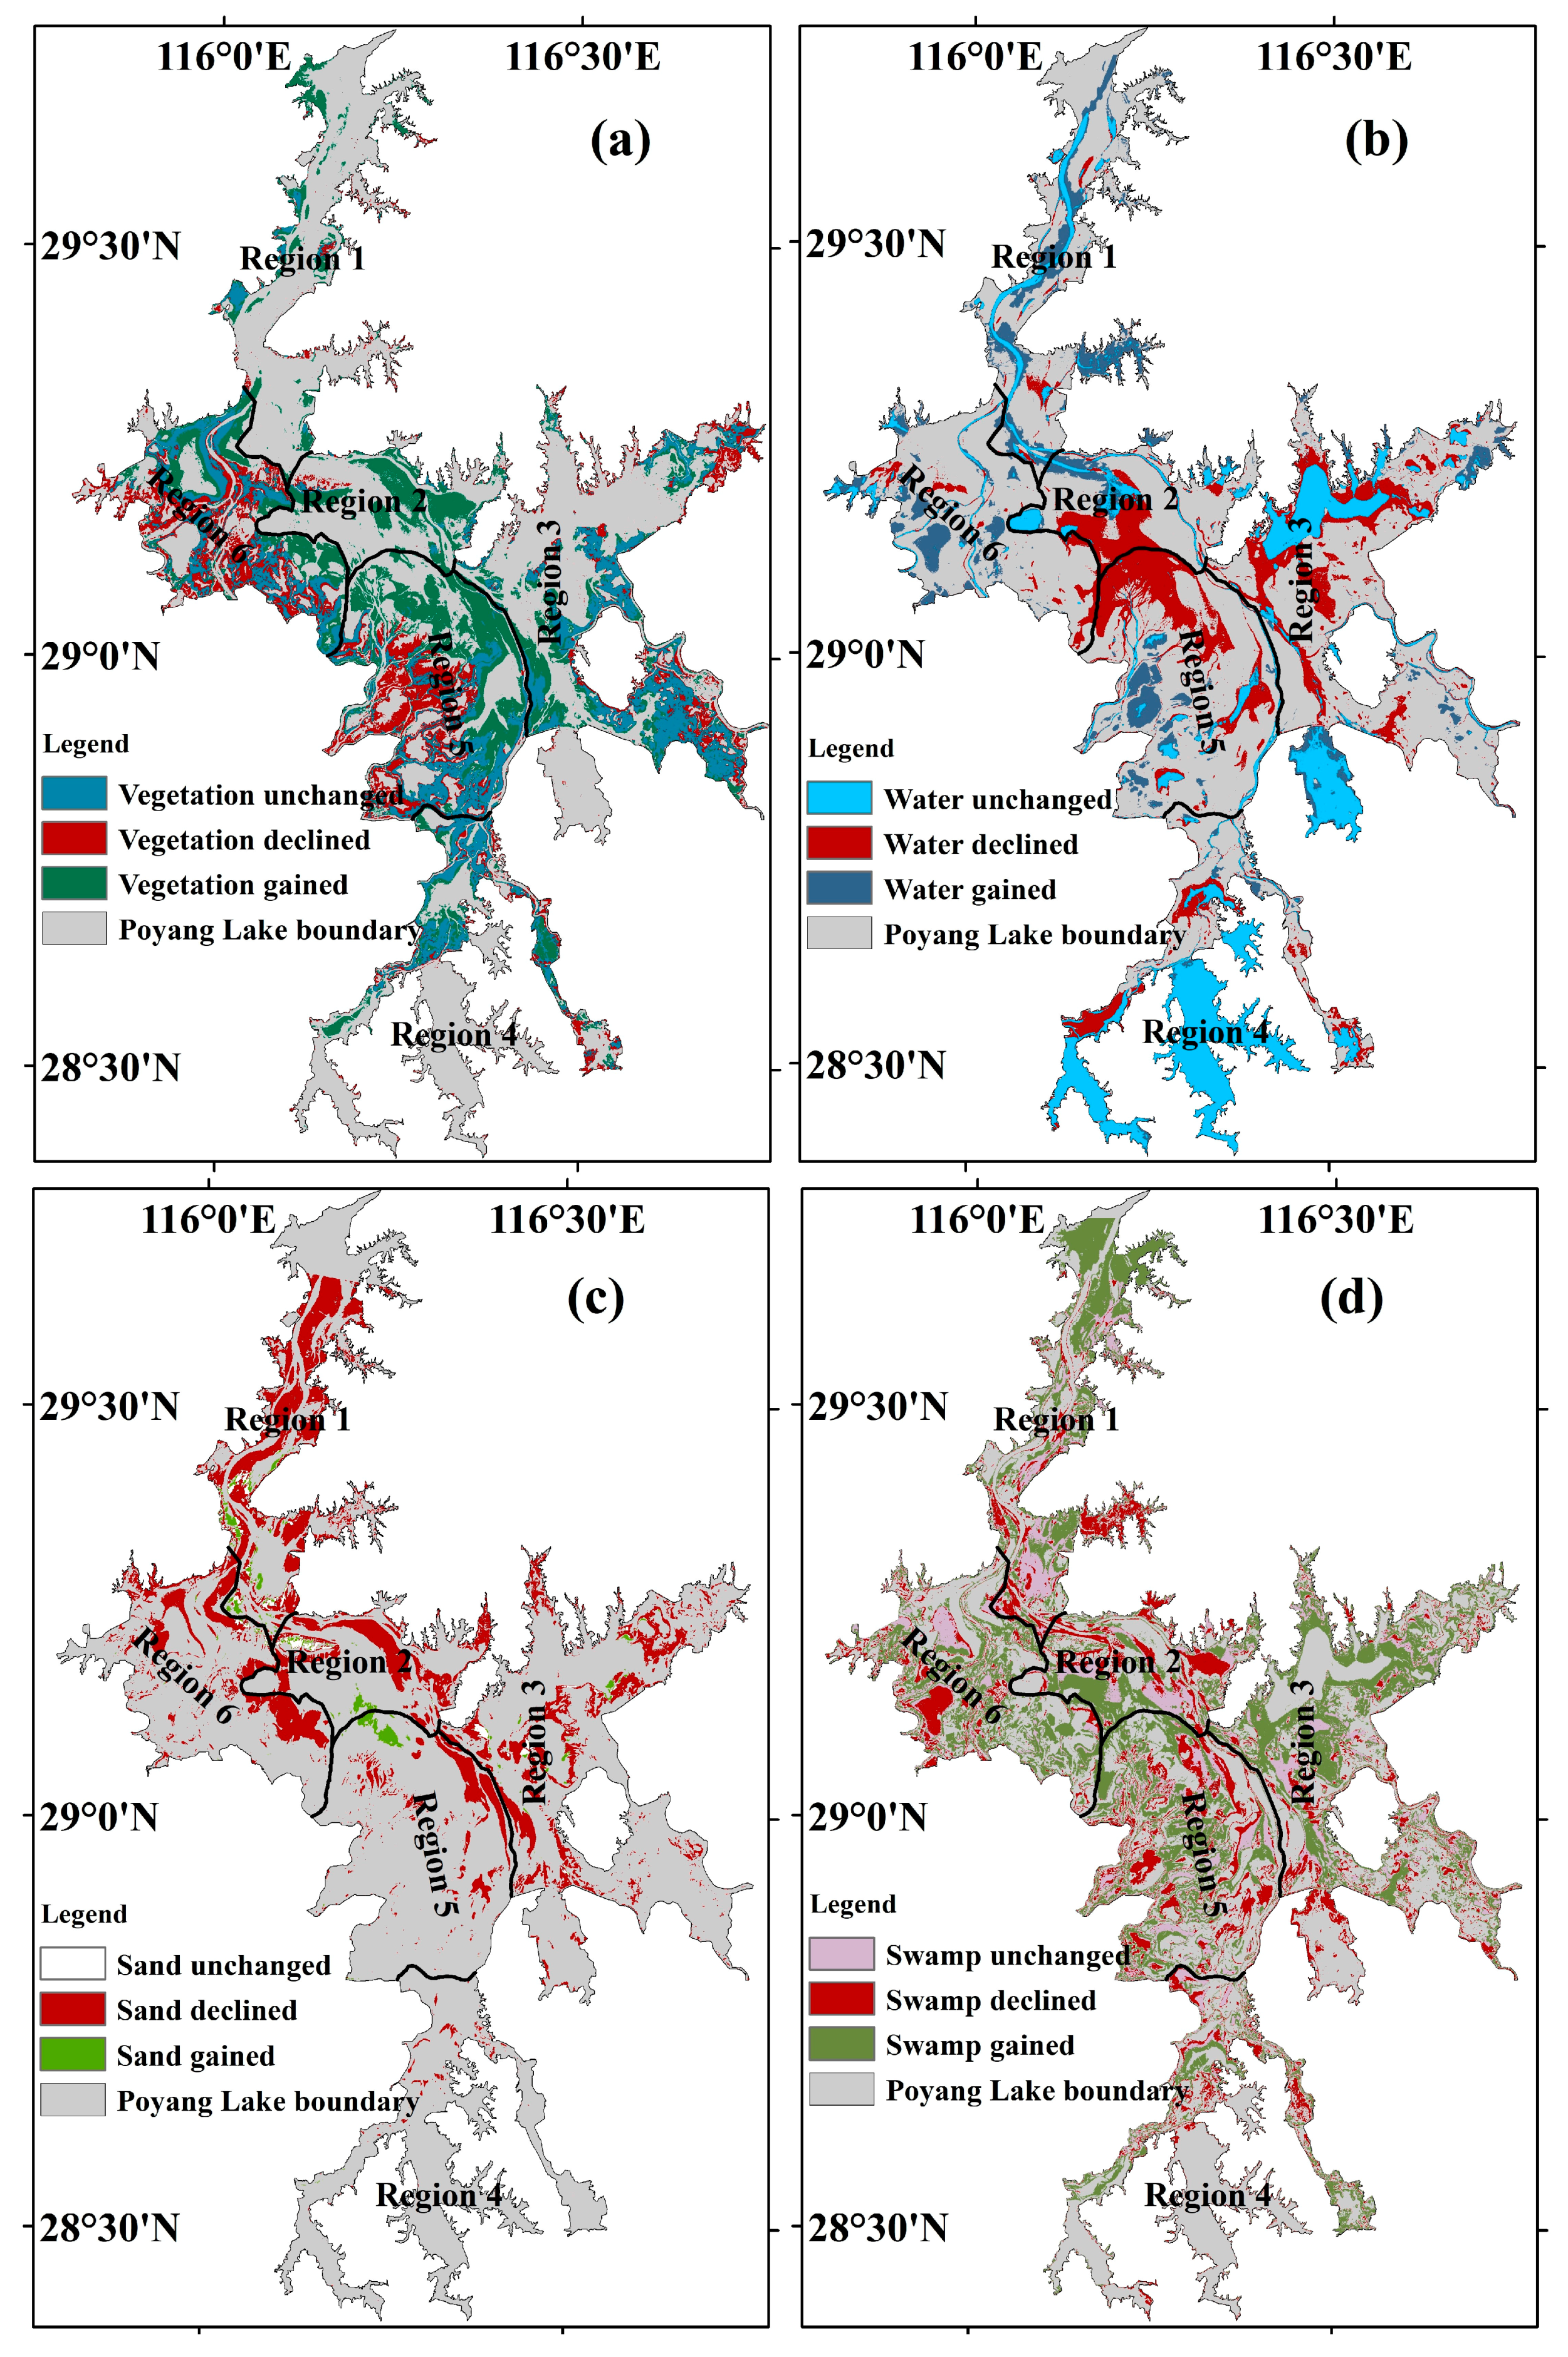
3.2. Spatial-Temporal Change Analysis

Figure 5 and Table 3 show a map of the spatial distribution changes and the areas of different wetland types of Poyang Lake during the dry seasons from 1973 to 2019. For the long-term vegetation in the dry seasons shown in Figure 5a, the declining areas were mainly distributed in the west of regions 5 and 6, while the other areas were concentrated in the east of region 3. The expanding area is mainly in the center of Poyang Lake, namely, in regions 2 and 5. This indicates that the vegetation tended to expand from west to east. The total area of increased vegetation was 597.376 km2, while the total area of decline was 399.152 km2 (Table 4). Overall, the distribution of water declined. The increased areas were mainly distributed in the central and western portions of Poyang Lake (Figure 5b), with areas of 499.127 and 350.706 km2, respectively. Regions 2 and 5, located at the center of Poyang Lake, were mainly covered with water. In the early stage, they showed a tendency to turn into vegetation, swamp, and mudflat. At the same time, the unchanged water area was mainly distributed in region 1 and the north of region 4. The largest sand area was observed in 1973, at 592.679 km2, which turned into vegetation and swamp and mudflat after 1973, except in the north of Songmen Mountain. The total unchanged, decreased, and increased areas of swamp, marsh and mudflat were 465.296, 434.621, and 1008.187 km2 (Table 4), respectively. The swamp, marsh and mudflat mainly expanded in the north of Poyang Lake (Figure 5d).
Figure 6 depicts the long-term trends and provides a model of wetland landcover types in different regions of Poyang Lake from 1973 to 2019. The trends of the regions were different from those of the whole Poyang Lake wetland. The vegetation in regions 1 and 2 showed a statistically significant expanding trend from 1973–2019, at 1.487 km2/year (R2 = 0.688, p < 0.01) and 2.571 km2/year (R2 = 0.617, p < 0.01), respectively. Additionally, the vegetation in other areas, except region 5, showed the same trend in three stages: a sharp increase (1983–1996), a sharp decrease (1996–2004), and then a slow increase (2004–2019). The vegetation situation in region 5 was complex: a sharp increasing trend occurred from 1983–1996 (9.215 km2/year, p < 0.01) as in other regions, followed by sharp decreasing, increasing, and decreasing trends in the periods of 1996–2003, 2003–2008, and 2008–2016, respectively. Considering the spatial distribution of the different regions, these trends represent the process of vegetation migrating from west to east. The year 2003 was also found to be notable. From 1981–2009, water in region 4 decreased by –2.118 km2/year (R2 = 0.469, p < 0.01). The water in regions 1, 3, and 6 experienced two stages: loss and expansion. The year 2003 was a demarcation year for regions 1 and 6, while 1996 was the separation year for region 3. The water in region 5 showed decreasing trends with different rates: 1981–2011 at –5.621 km2/year (R2 = 0.698, p < 0.01) and 2012–2019 at –13.869 km2/year (R2 = 0.374, p < 0.01). Region 2 showed the same decreasing trend as region 5: 1983–2011 at –4.675 km2/year (R2 = 0.623, p < 0.01) and 2012–2019 at –15.955 km2/year (R2 = 0.444, p < 0.01). Similarly, 2003 was notable for the water in regions 1 and 6 (north of Poyang Lake), which are near the TGD. Swamp, marsh and mudflat areas in region 1 decreased at –3.655 km2/year (R2 = 0.468, p < 0.01) from 1973–2019. Region 2 showed a sharp decreasing trend from 2008 to 2013 at –29.803 km2/year (R2 = 0.858, p < 0.01), with periodic variation in the other periods. At the same time, regions 4, 5, and 6 showed three statistically significant stages: a sharp decrease (1983–1993), sharp expansion (1993–2003), and slow decrease (2003–2015).

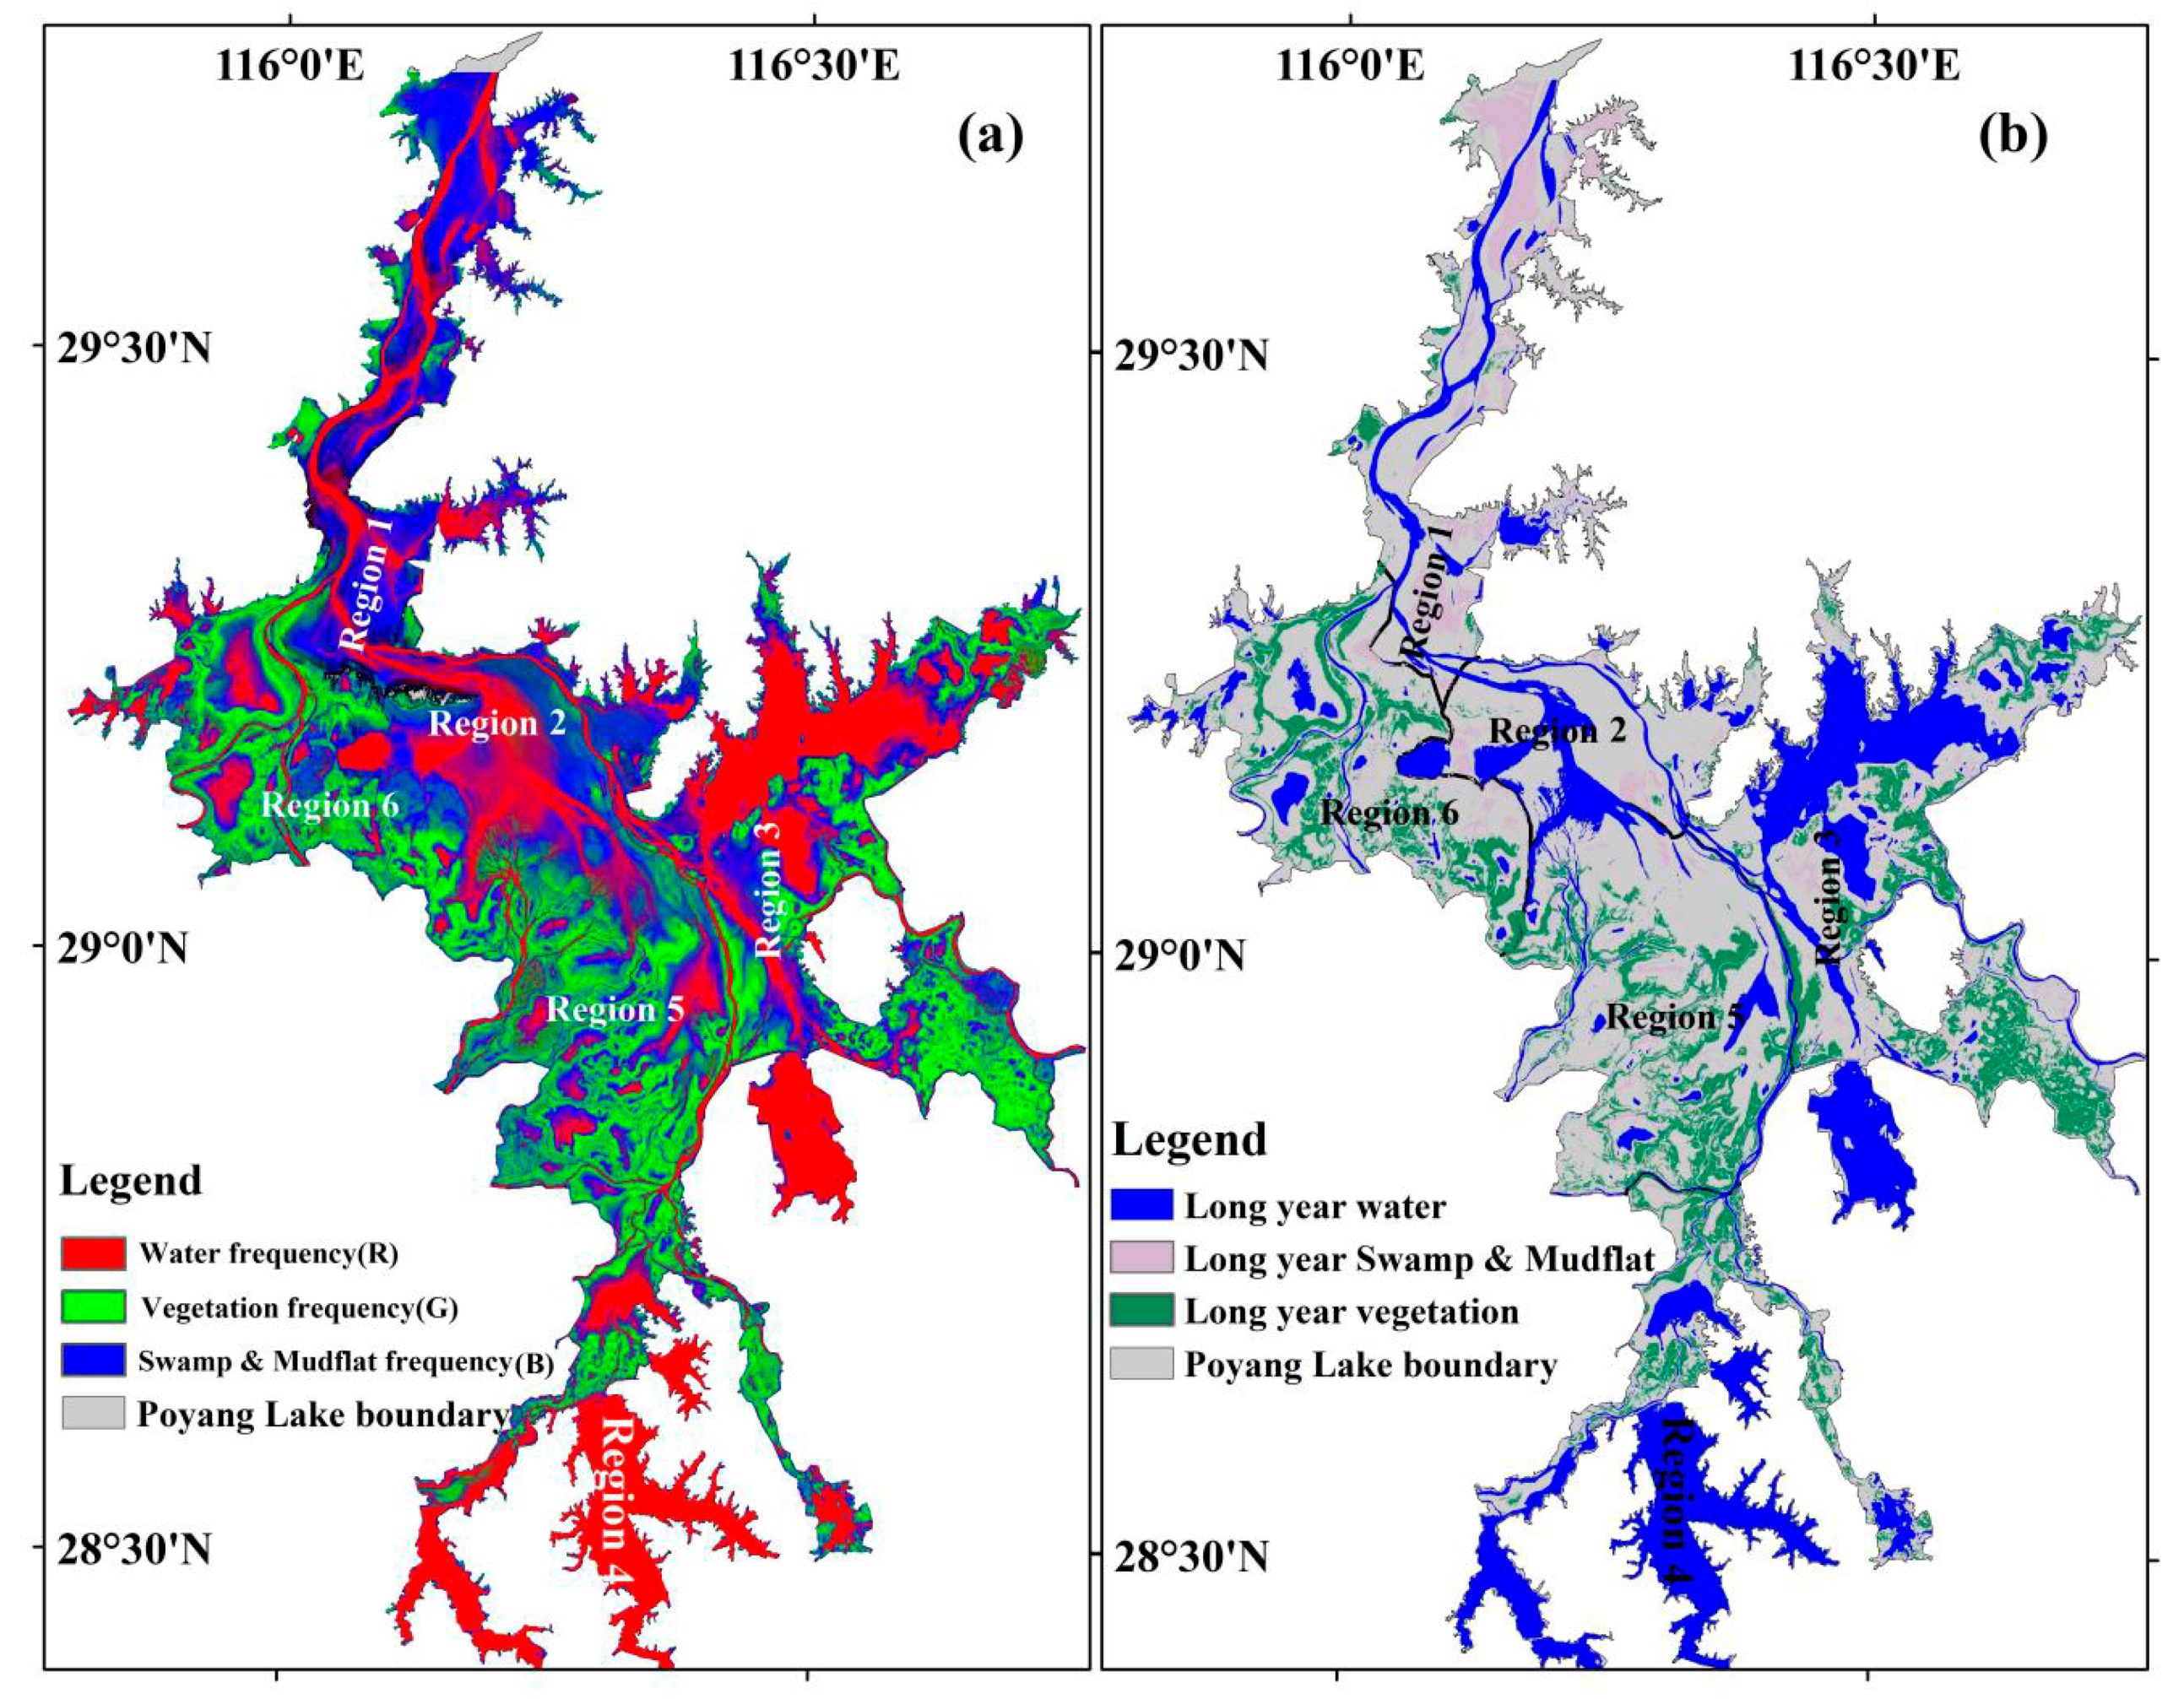
3.3. Wetland Landcover Variation Frequency of Poyang Lake

The wetland landcover frequency map of Poyang Lake is shown in Figure 7a. This section does not discuss sand because it was mainly distributed in the north of Songmen Mountain from 1974–2019 and remained largely unchanged over this period. As shown in Figure 7a, the RGB composites are the frequency of water (R), vegetation (G), and swamp, marsh, and mudflat (B). This figure depicts the main spatial distribution of wetland landcover types during the period of 1973–2019. Figure 7a clearly shows that the main color in the west of Poyang Lake, the east of region 3, region 5, and the south of region 6 was green, indicating that the dominant wetland type was vegetation. Similarly, red, representing the dominant wetland type, is water, which was mainly distributed in regions 3 and 4, a narrow channel in region 1, and in the center of region 2. Finally, the blue color, representing the swamp, marsh, and mudflat, was mainly concentrated in the north of the Poyang Lake wetland. The main wetland landcover types from the center to the boundary were water, swamp, marsh, and mudflat, and vegetation.
Figure 7b depicts the long-year distribution of water, vegetation, and swamp, marsh, and mudflat (the long-term represents a frequency ≥0.75) from 1973 to 2019. The long-year water was mainly distributed in the center of regions 1, 5, and 6, with a narrow channel, and the areas were 81.03, 72.27, and 50.64 km2, respectively (shown in Table 5). Regions 2, 3, and 4 showed a wide surface water distribution, with areas of 91.68, 322.22, and 73.08 km2, respectively. For the long-term vegetation, the main distribution was found in regions 5 and 6, which are the locations of the Poyang Lake Nanjishan Wetland National Reserve and the Poyang Lake National Reserve, i.e., 146.48 and 136.29 km2, respectively. The lower-right of region 3 was another major distribution area of vegetation, which covered 175.05 km2. The, annular channel and northern area of region 6 were also covered with the long-year vegetation, i.e., 136.29 km2. The long-year swamp, marsh, and mudflat areas were distributed in regions 1 and 3, i.e., 119.76 and 45.01 km2, respectively. There was 30.33 km2 of long-year swamp, marsh, and mudflat in region 5. The areas of the long-year water, vegetation, and swamp, and mudflat were 891.01, 540.80, and 254.42 km2, respectively.

4. Discussion

4.1. Wetland Landcover Changes before and after the TGD Period

As mentioned in Section 3.2 and Section 3.3, 2003 was the main demarcation year. Therefore, we discussed wetland changes in these two periods: pre-TGD period (1973–2003) and post-TGD period (2003–2019). The spatial distribution of the frequency and transitions maps in the dry seasons during the pre- and post-TGD periods is shown in Figure 8. As shown in Figure 8a,b, the color in the center of Poyang Lake, which is mostly located in region 2, was markedly different pre- and post-TGD. In the pre-TGD period, the main color was red, whereas blue was the dominant color in the post-TGD period. This indicates that the wetland type in this area changed considerably in these two periods, and the water in the pre-TGD period turned into swamp, marsh and mudflat. The wetland type also changed in the eastern portion of region 5 from water to vegetation. Simultaneously, similar observations were recorded in the eastern portion of region 2. During the pre-TGD period, blue was the primary color in eastern region 2, which turned green in the post-TGD period. These results show that swamp, marsh and mudflat transitioned into vegetation. In northern Poyang Lake, the channel water broadened, especially in region 1 during the pre- and post-TGD periods. The water located in southern region 4 did not change from 1973–2019. In conclusion, the water in the center of Poyang Lake turned into swamp, mudflat, and vegetation, while the swamp, marsh and mudflat in the eastern parts of regions 2 and 5 turned into vegetation. Therefore, the dominant wetland types changed post-TDG. The top three changes pre-TGD during the dry season were vegetation to swamp, marsh and mudflat, water to swamp and mudflat, and sand to vegetation, i.e., 333.152, 313.522, and 117.448 km2, respectively, and the distributions are shown in Figure 8c. Swamp and mudflat to vegetation, vegetation to swamp and mudflat, and swamp and mudflat to water were the top three transitions post-TGD (Figure 8d), i.e., 478.453, 293.891, and 219.008 km2, respectively. The dominant changes were the conversion of swamp and mudflat, vegetation, and water, the area of which was mainly concentrated in the center of Poyang Lake (Figure 8c,d), namely, in regions 2, 3, 5, and 6, which contain a large portion of the Poyang Lake Nanjishan Wetland National Reserve and National Reserve.
The results in Section 3.1 showed that water in Poyang Lake experienced three stages: a sharp decrease (1981–2003, –32.507 km2/year, p < 0.01), a sharp increase (2003–2015, 44.497 km2/year, p < 0.01), and a sharp decrease (2015–2019, –129.53 km2/year, p < 0.01). However, the water in regions 2, 4, and 5 decreased after 2003, while the area of vegetation increased. This phenomenon may be related to the implementation of the TGD. Some research suggested that Poyang lake’s submerged area has decreased since the TGD’s construction in 2003 [28,29]. More importantly, implementation of the TGD reduced flooding from September–November [27]. The water harvesting of the TGD could lead to prolonged exposure of the lake bottom, resulting in suitable conditions for vegetation, and precipitating the transition of water and swamp and mudflat into vegetation. The TGD’s construction has clearly affected the vegetation distribution of Poyang lake. The extent of the TDG’s effect, however, still requires further study.

4.2. Driving Forces

4.2.1. Climate and Topography

The factor detector was used to detect the driving factors of climate and topography in response to the spatial distribution of wetland landcover types from 1973–2019. All the climate and topography factors and response variables’ q values are shown in Table 6. All the dominant factors for different wetland distributions passed a significance test at p < 0.01. In general, the dominant factor affecting vegetation and water was elevation in regions 2, 3, 5, and 6 (p < 0.01). At the same time, slope was the main factor affecting vegetation and water distribution in the whole of Poyang Lake and in region 4, with q > 0.3 universally. In region 1 (mostly north of Poyang Lake), elevation and the average temperature from September to November were the dominant factors affecting vegetation and water, respectively. The main driving factor for sand was different. The maximum, minimum, and average temperatures from September to November were the main factors affecting the whole of Poyang Lake, and region 1, and region 5. The elevation, curvature, and precipitation from September to November were the dominant factors for regions 2 and 3, region 4, and region 6, respectively. Similarly, elevation was the dominant factor for the swamp and mudflat areas in regions 2, 3, 5, and 6, while the maximum and average temperatures from September to November, as well as slope, were the main factors in the whole of Poyang Lake, and region 1, and region 4, respectively. In conclusion, the main driving factors varied with respect to the spatial distribution of different wetland types in different regions.
The interaction analysis is shown in Table 7, which lists the top four interactive q values. For the whole of Poyang Lake, the interaction between elevation and slope explained 55.8% and 45% of the spatial variability of vegetation and water. The interaction of the driving factors listed in Table 7 had an explanatory ability above 45% for vegetation and water in the whole of Poyang Lake. For swamp and mudflat, the top interaction factors were elevation and minimum temperature from September to November with a 20.7% explanatory ability. Although the top interaction factors differed in different regions, they all had a relationship with elevation; maximum, minimum, and average temperature; and precipitation. For example, for water in region 4, the elevation and minimum temperature showed an interaction explanatory ability of 71.9%. The interaction between elevation and the other factors listed in Table 6 showed q values above 62% for vegetation in region 3. For sand, all factors had less than 10% explanatory ability in regions 3, 4, and 5. This indicates that the driving factors listed in Table 6 and 7 were not the dominant factors for the distribution of sand in regions 3, 4, and 5. However, for region 2, the interaction explanatory ability of all factors was above 57%, and the largest q value was 63.7% (the elevation and minimum temperature for September to November). This explains why sand was distributed in the north of Songmen Mountain from 1974–2019.
Some studies showed that the changes in water are mainly caused by local precipitation in the non-summer months, as well as the water level [22,28]. In our study, the GeoDetector results showed that the frequency variability of water was closely linked to topology factors, such as elevation and slope. In addition, the water in region 1 was mainly linked to the average temperature from September to November. Therefore, topological and temperature factors should be considered in the management of Poyang Lake. Decisions should also be made according to the different zones of Poyang Lake. First, region 2, where the main influential factor was temperature, should be considered. Second, the elevation and minimum temperature should be considered when managing water in region 4 because the interaction between elevation and minimum temperature had an explanatory ability of 71.9%. Related studies on Poyang Lake showed that the mean temperature was significantly correlated with the vegetation area [4,22]. Vegetation levels are related to temperature and precipitation, but different types of vegetation have adapted to the environment. For example, shade plants do not grow on sunny slopes, no matter how suitable the rainfall. Therefore, the distribution of vegetation is not only affected by temperature or precipitation—the elevation and slope should also be considered. The vegetation in region 4 was primarily affected by slope and had a 41.3% explanatory power, whereas the interaction factors of the elevation ∩ slope and elevation ∩ minimum temperature had explanatory power of 55.4% and 54.7%, respectively. This demonstrates that the distribution of vegetation is determined by both topography and temperature. The factor results provide more accurate information about the factor weight and can help local governments to reasonably formulate protection and development strategies.

4.2.2. Human Activities and Policies

In addition to topological and climate factors, human activities and policies also caused wetland changes in Poyang Lake. Covering a total area of 592.678 km2 in 1973, sand was mainly distributed in the north and sharply decreased to 90.078 km2 in 1981 with a transition to vegetation, swamp, and mudflat. The large amount of sand in 1973 was related to the deforestation and soil erosion from the 1950s to the 1970s [4]. Then, the local government proposed forest protection policies to restore vegetation and decrease the sand area. In the 20th century, the sand area increased to 314.782 km2 in 2003, but the total sand area in Poyang Lake significantly decreased after 2003 (–10.71 km2/year, p < 0.01). Sand excavation partially caused this phenomenon. Driven by the demand for sand in the construction industry in the middle-lower Yangtze River, a large number of sand excavation activities occurred near Poyang Lake after a total ban on sand excavation of the Yangtze River in 2000 [67], resulting in a rise in sediment. However, as sand dredging decreased, sediment also decreased.
The water in Poyang Lake also sharply decreased (1981–2003, –32.507 km2/year, p < 0.01). From 1981–2003, this phenomenon was linked to land reclamation activities. From 1954–1999, a total area of 1210 km2 was reclaimed in Poyang Lake. The area decreased from 5050 km2 in 1954 to 3840 km2 in 1997 [17]. On the one hand, the large-scale reclamation of Poyang Lake caused soil erosion, resulting in sediment deposition. On the other hand, reclamation occupied the space of flood storage, significantly reducing the area of Poyang Lake. The sharp increasing trend (2003–2015, 44.497 km2/year, p <0.01) could be related to the returning farmland policy and impoundment of the TGD. Returning farmland to lake increased the area of natural wetlands, further, the area of Poyang lake has increased by 885.6 km2 during the highstand period [19]. In 2008, the local government defined the Poyang Lake Eco-Economic Zone to protect the environment. All these activities partly resulted in increased water and vegetation in Poyang Lake. As a result of the TGD’s construction since 2003, the smallest water area occurred in 2003 during the period of 1973–2019, at 803.846 km2. However, the area of Poyang Lake increased to 1716.583 km2 in 2015 in the dry season. Many studies indicated that Poyang Lake’s inundation area has decreased overall since the TGD started retaining water in 2003 [28,29]. According to the analysis of spatial–temporal changes, the water in regions 1, 3, and 6 increased after 2003. This is not consistent with previous studies. However, the water area in regions 2, 4, and 5 decreased simultaneously. The results in regions 2, 4, and 5, to some extent, align with the TGD construction, causing a decrease in the water area.
During the period of 2004 to 2019, vegetation experienced a slow increasing trend (9.820 km2/year, p < 0.01), related to the influence of the TGD. The water harvesting of the TGD led to the prolonged exposure of the lake bottom, producing suitable conditions for vegetation and converting water, swamp, and mudflat transit into vegetation. The increase in vegetation is also closely related to the efforts of the local government. The Poyang Lake Wetland National Reserve and Nanjishan Wetland National Reserve, which were constructed in 1983 and 2008, respectively, play an important role in protecting and benefiting the natural environment. They also promote the growth of vegetation. The sharp decreasing trend (–47.278 km2/year, p < 0.01) from 1996–2004 could be linked to the development of the economy. For example, artificial culture of fish, crabs, and pearls, etc., could reduce the distribution of the local vegetation through the regulation of water quality, nutrition, and the consumption of local macrophytes. As this area is a habitat for winter migrants, providing food would reduce the vegetation. The numbers and activities of winter migrants require future analyses.

4.3. Uncertainty of the Results

The limitations of this study are mainly as follows: (1) Time scale: the remote sensing images, which were acquired from late November and early February, obtained the landcover type during the dry season of Poyang Lake based on only one image. It is generally known that the dry season is the period from October to March, not a date, and that the wetland type and atmospheric conditions change during this time, thereby making the time of wetland type changes uncertain. Ideally, we would have acquired images taken at the same time, but due to cloud cover and other conditions, this was impossible. To reduce the difference, we tried to select images in the same period from late November and early February of the following year. (2) Spatial resolution scale: The spatial resolutions of the images used to produce the classification maps were 30 m (TM/OLI/HJ) and 60 m (MSS). Due to the limitations of technology in the 1970s and 1980s, the images were only acquired with a resolution of 60 m. To compare and analyze the classification, the images with a 60 m resolution were re-sampled to 30 m using the bilinear method, which increased the uncertainty of the classification and the mixed pixels problem. (3) Meteorological data: The local climate of a location generally stays the same with slight differences. Thus, sufficient data were able to provide us with sufficiently detailed findings. In this study area, 19 hydrological stations were used to represent the hydrological conditions to more accurately understand the climate conditions and their explanatory abilities for landcover type changes.

5. Conclusions

In this paper, the RF method, UNVI, and MNDWI were used to classify the wetland landcover types of Poyang Lake and discuss the driving forces of landcover changes based on the Geodetector model from 1973–2019 in the dry season. The wetland landcover types of Poyang Lake experienced different stages, and 2003 is the year that is most worthy of attention and divided the trend model into 2 stages. The coverage of water and mudflats showed opposite trends from 1987–2019. Water and vegetation experienced a significantly sharp decrease from 1981–2003 and from 1996–2004 (p < 0.01), respectively. After 2003, the opposite trend was observed. The phenomenon of vegetation expanding from west to east was found, and the water in the center of Poyang Lake declined and turned into vegetation, swamp, and mudflat during the five-decade period. The vegetation in regions 1 and 2 showed a significantly expanded trend (R2 > 0.6, p < 0.01) over the past 47 years. Elevation and temperature were the key driving factors affecting wetland evolution in the dry season of Poyang Lake according to the GeoDetector model. The interaction of elevation with slope was the dominant factor causing the variation in Poyang Lake’s landcover changes (~55.8% in the spatial variability of vegetation and ~45% in the spatial variability of water), whereas the elevation and the minimum temperature for September to November showed an interaction explanatory ability of 71.9% for the water in region 4 and 63.7% for sand in region 2. Human activities and policies also caused short-term changes in wetland types.
The results and findings of this work provide detailed information for landcover changes in Poyang Lake, which could be used for policymakers to formulate scientific and appropriate policies to achieve restoration in Poyang Lake wetland. In general, topological and temperature factors should be considered in the management of Poyang Lake and the central wetland zone of Poyang Lake, at the junction of region 2 and 5, where complex land use changes have taken place, and policymakers should pay more attention to protect those zones.

Author Contributions

L.Z. (Lifu Zhang) and S.W. designed the research and wrote the original draft. S.W. and H.Z. contributed to data processing and analysis. X.H. and L.Z. (Linshan Zhang) revised the manuscript. All authors reviewed and contributed to the organization of the manuscript. All authors have read and agreed to the published version of the manuscript.

Funding

This research was funded by the National Natural Science Foundation of China (41830108, 4197071442), Innovation Team of XCPP’s Key Area (2018CB004), and Major Science and Technology Projects of XPCC (2018AA00402).

Acknowledgments

We appreciate the DEM of Poyang Lake from the Geospatial Data Cloud site, Computer Network Information Center, Chinese Academy of Sciences. (http://www.gscloud.cn). The Landsat images were provided by the United States Geological Survey (https://earthexplorer.usgs.gov/). The HJ data were provided by the China Centre for Resources Satellite Data and Application (http://www.cresda.com/CN/). Meteorological data were provided by the National Meteorological Information Center, China (https://data.cma.cn). The GeoDetector software was obtained from http://geodetector.cn/.

Conflicts of Interest

The authors declare no conflict of interest.

References

  1. Pinay, G.; Clement, J.C.; Naiman, J.N. Basic principles and ecological consequences of changing water regimes on nitrogen cycling in fluvial systems. Environ. Manag. 2002, 30, 481–491. [Google Scholar] [CrossRef] [PubMed]
  2. Shao, M.; Jiang, J.; Gao, H.; Zeng, B. Abundance, Distribution and Diversity Variations of Wintering Water Birds in Poyang Lake, Jiangxi Province, China. Pakistan J. Zool. 2014, 42, 451–462. [Google Scholar]
  3. Nilsson, C.; Keddy, P.A. Predictability of Change in Shoreline Vegetation in a Hydroelectric Reservoir, Northern Sweden. Can. J. Fish. Aquat. Sci. 1988, 45, 1896–1904. [Google Scholar] [CrossRef]
  4. Han, X.; Chen, X.; Feng, L. Four decades of winter wetland changes in Poyang Lake based on Landsat observations between 1973 and 2013. Remote Sens. Environ. 2015, 156, 426–437. [Google Scholar] [CrossRef]
  5. Adam, E.; Mutanga, O.; Rugege, D. Multispectral and hyperspectral remote sensing for identification and mapping of wetland vegetation: A review. Wetl. Ecol. Manag. 2009, 18, 281–296. [Google Scholar] [CrossRef]
  6. You, H.; Fan, H.; Xu, L.; Wu, Y.; Liu, L.; Yao, Z. Poyang Lake Wetland Ecosystem Health Assessment of Using the Wetland Landscape Classification Characteristics. Water 2019, 11, 825. [Google Scholar] [CrossRef] [Green Version]
  7. Zedler, J.B.; Kercher, S. Wetland Resources: Status, Trends, Ecosystem Services, and Restorability. Annu. Rev. Environ. Resour. 2005, 30, 39–74. [Google Scholar] [CrossRef] [Green Version]
  8. Palmer, S.C.J.; Kutser, T.; Hunter, P.D. Remote sensing of inland waters: Challenges, progress and future directions. Remote Sens. Environ. 2015, 157, 1–8. [Google Scholar] [CrossRef] [Green Version]
  9. Gong, P.; Niu, Z.; Cheng, X.; Zhao, K.; Zhou, D.; Guo, J.; Liang, L.; Wang, X.; Li, D.; Huang, H.; et al. China’s wetland change (1990–2000) determined by remote sensing. Sci. China Earth Sci. 2010, 53, 1036–1042. [Google Scholar] [CrossRef]
  10. Nicholls, R.J.; Hoozemans, F.M.J.; Marchand, M. Increasing Flood Risk and Wetland Losses Due to Global Sea-Level Rise: Regional and Global Analyses. Glob. Environ. Chang. 1999, 9, S69–S87. [Google Scholar] [CrossRef]
  11. Zhu, C.; Zhang, X.; Huang, Q. Four Decades of Estuarine Wetland Changes in the Yellow River Delta Based on Landsat Observations Between 1973 and 2013. Water 2018, 10, 933. [Google Scholar] [CrossRef] [Green Version]
  12. Zhu, P.; Gong, P. Suitability mapping of global wetland areas and validation with remotely sensed data. Sci. China Earth Sci. 2014, 57, 2283–2292. [Google Scholar] [CrossRef]
  13. Qi, S.; Brown, D.G.; Tian, Q.; Jiang, L.; Zhao, T.; Bergen, K.A. Inundation Extent and Flood Frequency Mapping Using LANDSAT Imagery and Digital Elevation Models. GISci. Remote Sens. 2009, 46, 101–127. [Google Scholar] [CrossRef]
  14. Shankman, D.; Keim, B.D.; Song, J. Flood frequency in China’s Poyang Lake region: Trends and teleconnections. Int. J. Climatol. 2006, 26, 1255–1266. [Google Scholar] [CrossRef] [Green Version]
  15. Shankman, D.; Liang, Q. Landscape changes and increasing flood frequency in China’s Poyang Lake region. Prof. Geogr. 2003, 55, 434–445. [Google Scholar] [CrossRef]
  16. Yuan, W.; Liu, X.; Wang, W.; Di, M.; Wang, J. Microplastic abundance, distribution and composition in water, sediments, and wild fish from Poyang Lake, China. Ecotoxicol. Environ. Saf. 2019, 170, 180–187. [Google Scholar] [CrossRef]
  17. Cai, H.; Zhao, X.; Cai, H. Reality and Conservation of Wetland in Poyang Lake. Acta Agric. Univ. Jiangxiensis Nat. Sci. Ed. 2003, 25, 943–947. [Google Scholar]
  18. Finlayson, M.; Harris, J.; McCartney, M.; Lew, Y.; Zhang, C. Report on Ramsar visit to Poyang Lake Ramsar Site, P.R. China. Ramsar Convention. Available online: https://www.ramsar.org/sites/default/files/documents/pdf/Poyang_lake_report_v8.pdf (accessed on 5 May 2020).
  19. Hu, Q.; Yao, B.; Liu, Y. Analysis on Changes of Man-Land Relationship and Associated driving force in Poyang Lake Region. Resour. Environ. Yangtze Basin. 2010, 19, 628–633. [Google Scholar]
  20. Yang, L.; Jiang, F.; Xie, Z. Study on Land Reclamation around Poyang Lake in the Abandoned Farmland in the Context of the Policy for Converting Farmland to Lake. China Land Sci. 2017, 31, 44–50. [Google Scholar]
  21. Sun, Y.; Huang, S.; Li, J.; Ma, J.; Li, S.; Wang, H. Dynamic monitoring of Poyang Lake water body area using MODIS images between 2000 and 2014. In Proceedings of the International Conference on Intelligent Earth Observing and Applications, Guilin, China, 23–24 October 2015. [Google Scholar]
  22. Feng, L.; Han, X.; Hu, C.; Chen, X. Four decades of wetland changes of the largest freshwater lake in China: Possible linkage to the Three Gorges Dam? Remote Sens. Environ. 2016, 176, 43–55. [Google Scholar] [CrossRef]
  23. Feng, L.; Hu, C.; Chen, X.; Song, Q. Influence of the Three Gorges Dam on total suspended matters in the Yangtze Estuary and its adjacent coastal waters: Observations from MODIS. Remote Sens. Environ. 2014, 140, 779–788. [Google Scholar] [CrossRef]
  24. Wang, P.; Zhang, X.; Qi, S. Was the trend of the net sediment flux in Poyang Lake, China, altered by the Three Gorges Dam or by sand mining? Environ. Earth Sci. 2019, 78, 64. [Google Scholar] [CrossRef]
  25. Mei, X.; Dai, Z.; Du, J.; Chen, J. Linkage between Three Gorges Dam impacts and the dramatic recessions in China’s largest freshwater lake, Poyang Lake. Sci. Rep. 2015, 5, 18197. [Google Scholar] [CrossRef] [PubMed] [Green Version]
  26. Guo, H.; Hu, Q.; Zhang, Q.; Feng, S. Effects of the Three Gorges Dam on Yangtze River flow and river interaction with Poyang Lake, China: 2003–2008. J. Hydrol. 2012, 416–417, 19–27. [Google Scholar] [CrossRef]
  27. Wu, G.; Liu, Y. Assessment of the Hydro-Ecological Impacts of the Three Gorges Dam on China’s Largest Freshwater Lake. Remote Sens. 2017, 9, 1069. [Google Scholar] [CrossRef] [Green Version]
  28. Feng, L.; Hu, C.; Chen, X.; Cai, X.; Tian, L.; Gan, W. Assessment of inundation changes of Poyang Lake using MODIS observations between 2000 and 2010. Remote Sens. Environ. 2012, 121, 80–92. [Google Scholar] [CrossRef]
  29. Wang, Y.; Ma, J.; Xiao, X.; Wang, X.; Dai, S.; Zhao, B. Long-Term Dynamic of Poyang Lake Surface Water: A Mapping Work Based on the Google Earth Engine Cloud Platform. Remote Sens. 2019, 11, 313. [Google Scholar] [CrossRef] [Green Version]
  30. Wang, Y.; Yésou, H. Remote Sensing of Floodpath Lakes and Wetlands: A Challenging Frontier in the Monitoring of Changing Environments. Remote Sens. 2018, 10, 1955. [Google Scholar] [CrossRef] [Green Version]
  31. Zeng, L.; Schmitt, M.; Li, L.; Zhu, X.X. Analysing changes of the Poyang Lake water area using Sentinel-1 synthetic aperture radar imagery. Int. J. Remote Sens. 2017, 38, 7041–7069. [Google Scholar] [CrossRef] [Green Version]
  32. Chen, B.; Chen, L.; Huang, B.; Michishita, R.; Xu, B. Dynamic monitoring of the Poyang Lake wetland by integrating Landsat and MODIS observations. ISPRS J. Photogramm. Remote Sens. 2018, 139, 75–87. [Google Scholar] [CrossRef]
  33. Wan, R.; Wang, P.; Wang, X.; Yao, X.; Dai, X. Mapping Aboveground Biomass of Four Typical Vegetation Types in the Poyang Lake Wetlands Based on Random Forest Modelling and Landsat Images. Front. Plant Sci. 2019, 10, 1281. [Google Scholar] [CrossRef] [PubMed]
  34. Feng, L.; Hu, C.; Han, X.; Chen, X.; Qi, L. Long-Term Distribution Patterns of Chlorophyll-a Concentration in China’s Largest Freshwater Lake: MERIS Full-Resolution Observations with a Practical Approach. Remote Sens. 2014, 7, 275–299. [Google Scholar] [CrossRef] [Green Version]
  35. Zhang, L.; Yin, J.; Jiang, Y.; Wang, H. Relationship between the hydrological conditions and the distribution of vegetation communities within the Poyang Lake National Nature Reserve, China. Ecol. Inform. 2012, 11, 65–75. [Google Scholar] [CrossRef]
  36. Zhang, P.; Lu, J.; Feng, L.; Chen, X.; Zhang, L.; Xiao, X.; Liu, H. Hydrodynamic and Inundation Modeling of China’s Largest Freshwater Lake Aided by Remote Sensing Data. Remote Sens. 2015, 7, 4858–4879. [Google Scholar] [CrossRef] [Green Version]
  37. Zhou, H.; Luo, Z.; Tangdamrongsub, N.; Zhou, Z.; He, L.; Xu, C.; Li, Q.; Wu, Y. Identifying Flood Events over the Poyang Lake Basin Using Multiple Satellite Remote Sensing Observations, Hydrological Models and In Situ Data. Remote Sens. 2018, 10, 713. [Google Scholar] [CrossRef] [Green Version]
  38. Li, X.; Yu, X.; Jiang, L.; Li, W.; Liu, Y.; Hou, X. How important are the wetlands in the middle-lower Yangtze River region: An ecosystem service valuation approach. Ecosyst. Serv. 2014, 10, 54–60. [Google Scholar] [CrossRef]
  39. Vanonckelen, S.; Lhermitte, S.; Van Rompaey, A. The effect of atmospheric and topographic correction methods on land cover classification accuracy. Int. J. Appl. Earth Obs. Geoinf. 2013, 24, 9–21. [Google Scholar] [CrossRef] [Green Version]
  40. Masek, J.G.; Huang, C.; Wolfe, R.; Cohen, W.; Hall, F.; Kutler, J.; Nelson, P. North American forest disturbance mapped from a decadal Landsat record. Remote Sens. Environ. 2008, 112, 2914–2926. [Google Scholar] [CrossRef]
  41. Vermote, E.; Justice, C.; Claverie, M.; Franch, B. Preliminary analysis of the performance of the Landsat 8/OLI land surface reflectance product. Remote Sens. Environ. 2016, 185, 46–56. [Google Scholar] [CrossRef]
  42. Zheng, S.; Zhao, X.; Zhang, H.; He, Q.; Cao, C.; Chen, l. Atmospheric correction on CCD data of HJ-1 satellite and analysis of its effect. J. Remote Sens. 2011, 15, 709–713. [Google Scholar]
  43. Li, J.; Chen, X.; Tian, L.; Feng, L. Tracking radiometric responsivity of optical sensors without on-board calibration systems-case of the Chinese HJ-1A/1B CCD sensors. Opt. Express 2015, 23, 1829–1847. [Google Scholar] [CrossRef] [PubMed]
  44. Dronova, I.; Gong, P.; Wang, L. Object-based analysis and change detection of major wetland cover types and their classification uncertainty during the low water period at Poyang Lake, China. Remote Sens. Environ. 2011, 115, 3220–3236. [Google Scholar] [CrossRef]
  45. Yu, L.; He, L.; Zhang, Q.; Wang, X. Landsat-TM Data Based Study on Dynamic Changes of the Typical Wetlands of Poyang Lake. Remote Sens. Inform. 2010, 32, 48–54. [Google Scholar]
  46. Cutler, D.R.; Edwards, T.C.; Beard, K.H.; Cutler, A.; Hess, K.T.; Gibson, J.; Lawler, J.J. Random Forests for Classification in Ecology. Ecology 2007, 88, 2783–2792. [Google Scholar] [CrossRef] [PubMed]
  47. Van der Linden, S.; Rabe, A.; Held, M.; Jakimow, B.; Leitao, P.J.; Okujeni, A.; Schwieder, M.; Suess, S.; Hostert, P. The EnMAP-Box-A Toolbox and Application Programming Interface for EnMAP Data Processing. Remote Sens. 2015, 7, 11249–11266. [Google Scholar] [CrossRef] [Green Version]
  48. Mariana, B.; Dragut, L. Random forest in remote sensing: A review of applications and futuredirections. ISPRS J. Photogramm. Remote Sens. 2016, 114, 24–31. [Google Scholar]
  49. Leo, B. Random Forests. Mach. Learn. 2001, 45, 5–32. [Google Scholar]
  50. Zhang, L.; Furumi, S.; Muramatsu, K.; Fujiwara, N.; Daigo, M.; Zhang, L. A new vegetation index based on the universal pattern decomposition method. Int. J. Remote Sens. 2007, 28, 107–124. [Google Scholar] [CrossRef]
  51. Zhang, L.; Qiao, N.; Baig, M.H.A.; Huang, C.; Lv, X.; Sun, X.; Zhang, Z. Monitoring vegetation dynamics using the universal normalized vegetation index (UNVI): An optimized vegetation index-VIUPD. Remote Sens. Lett. 2019, 10, 629–638. [Google Scholar] [CrossRef]
  52. McFeeters, S. The use of the normalized difference water index (NDWI) in the delineation of open water features. Int. J. Remote Sens. 1996, 17, 1425–1432. [Google Scholar] [CrossRef]
  53. Xu, H. A Study on Information Extraction of Water Body with the Modified Normalized Difference Water Index (MNDWI). J. Remote Sens. 2005, 9, 589–595. [Google Scholar]
  54. Defries, R.S.; Townshend, J.R.G. NDVI-derived land cover classifications at a global scale. Int. J. Remote Sens. 1994, 15, 3567–3586. [Google Scholar] [CrossRef]
  55. Meroni, M.; Fasbender, D.; Rembold, F.; Atzberger, C.; Klisch, A. Near real-time vegetation anomaly detection with MODIS NDVI: Timeliness vs. accuracy and effect of anomaly computation options. Remote Sens. Environ. 2019, 221, 508–521. [Google Scholar] [CrossRef] [PubMed]
  56. Singh, K.V.; Setia, R.; Sahoo, S.; Prasad, A.; Pateriya, B. Evaluation of NDWI and MNDWI for assessment of waterlogging by integrating digital elevation model and groundwater level. Geocarto Int. 2015, 30, 650–661. [Google Scholar] [CrossRef]
  57. Xu, H. Modification of normalised difference water index (NDWI) to enhance open water features in remotely sensed imagery. Int. J. Remote Sens. 2007, 27, 3025–3033. [Google Scholar] [CrossRef]
  58. Wang, J.; Li, X.; Christakos, G.; Liao, Y.; Zhang, T.; Gu, X.; Zheng, X. Geographical Detectors-Based Health Risk Assessment and its Application in the Neural Tube Defects Study of the Heshun Region, China. Int. J. Geogr. Inf. Sci. 2010, 24, 107–127. [Google Scholar] [CrossRef]
  59. Meng, X.; Gao, X.; Li, S.; Lei, J. Spatial and Temporal Characteristics of Vegetation NDVI Changes and the Driving Forces in Mongolia during 1982–2015. Remote Sens. 2020, 12, 603. [Google Scholar] [CrossRef] [Green Version]
  60. Han, Y.; Guo, X.; Jiang, Y.; Xu, Z.; Li, Z. Environmental factors influencing spatial variability of soil total phosphorus content in a small watershed in Poyang Lake Plain under different levels of soil erosion. Catena 2020, 187, 104357. [Google Scholar] [CrossRef]
  61. Liu, C.; Zhang, K.; Liu, J. A long-term site study for the ecological risk migration of landscapes and its driving forces in the Sanjiang Plain from 1976 to 2013. Acta Ecol. Sinica 2018, 38, 3729–3740. [Google Scholar]
  62. Liu, D.; Zhang, J.; Li, H.; Cao, E.; Gong, J. Impact factors of soil phosphorus loss in watershed based on geographical detector. Acta Sci. Circumstantiae 2018, 38, 4814–4822. [Google Scholar]
  63. Hu, D.; Meng, Q.; Zhang, L.; Zhang, Y. Spatial quantitative analysis of the potential driving factors of land surface temperature in different “Centers” of polycentric cities: A case study in Tianjin, China. Sci. Total Environ. 2020, 706, 135244. [Google Scholar] [CrossRef]
  64. Tan, Z.; Zhang, Q.; Li, Y.; Xu, X.; Jiang, J. Distribution of Typical Vegetation Communities along Elevation in Poyang Lake Wetlands. Wetl. Sci. 2016, 14, 506–515. [Google Scholar]
  65. Zhao, X.; Stein, A.; Chen, X.L. Monitoring the dynamics of wetland inundation by random sets on multi-temporal images. Remote Sens. Environ. 2011, 706, 2390–2401. [Google Scholar] [CrossRef]
  66. Cheng, S. Brief introduction of “83.7” flood in Poyang Lake. J. Hydrol. 1988, 53–54. [Google Scholar]
  67. Jiang, F.; Qi, S.; Liao, F.; Zhang, X.; Wang, D.; Zhu, J.; Xiong, M. Hydrological and sediment effects from sand mining in Poyang Lake during 2001-2010. Acta Geogr. Sin. 2015, 70, 837–845. [Google Scholar]
Figure 1. Location of Poyang Lake and its hydrographical regions. The bold blue lines are the boundaries of the six hydrographical regions. The inset shows the locations of the Yangtze, the TGD (the red triangle), and Poyang Lake. The black triangles are the locations of 19 hydrological stations.
Remotesensing 12 01595 g001
Figure 2. Work flow of this study.
Remotesensing 12 01595 g002
Figure 3. A time series distribution of the main four wetland types in Poyang Lake from 1973 to 2019 (In some periods, there were no images available, and the red lines are the boundary of the six regions shown in Figure 1).
Remotesensing 12 01595 g003
Figure 4. Long-term area variation of different landcover types in Poyang Lake from 1973 to 2019. The dotted vertical lines in red represent the year when the TGD began to store water.
Remotesensing 12 01595 g004
Figure 5. Spatial distribution of (a) vegetation, (b) water, (c) sand, and (d) swamp and marsh, and mudflat with unchanged, decreased, and increased areas in Poyang Lake from 1973 to 2019
Remotesensing 12 01595 g005
Figure 6. Long-term trends and model of vegetation and water from 1973–2019 in Poyang Lake: (a) region 1, (b) region 2, (c) region 3, (d) region 4, (e) region 5, and (f) region 6 between 1973 and 2019. swamp and mudflat trends and modes of (g) regions 1, 2, and 3 and (h) regions 4, 5, and 6.
Remotesensing 12 01595 g006
Figure 7. (a) RGB composite of the frequency map in the dry season from 1973–2019 (R: water frequency, G: vegetation frequency, B: swamp and mudflat frequency). (b) Spatial distribution of long-term unchanged wetland cover type in Poyang Lake between 1973 and 2019.
Remotesensing 12 01595 g007
Figure 8. The RGB composite of the landcover type frequency map in the dry season (R: water frequency, G: vegetation frequency, B: swamp and mudflat frequency): (a) between 1973 and 2003 (pre-TGD period) and (b) between 2003 and 2019 (post-TGD period) in Poyang Lake. The transition map from (c) 1973–2003 and (d) 2003–2019.
Remotesensing 12 01595 g008
Table 1. List of remote sensing images of Poyang Lake.
Year 1Acquisition TimeSensor TypeSpatial Resolution (m)Year 1Acquisition TimeSensor TypeSpatial Resolution (m)
19731973/12/24MSS6020032004/02/15TM30
19811981/12/09MSS6020042004/12/15TM30
19821983/01/28MSS6020062006/12/21TM30
19831983/11/28MSS6020082008/12/10TM30
19841984/12/08MSS6020092010/01/14TM30
19871987/12/17TM3020102010/12/31HJ-1A30
19891990/01/23TM3020112011/12/24HJ-1A30
19901990/12/09TM3020122012/12/08HJ-1A30
19911991/11/10TM3020132013/12/24OLI30
19921993/01/31TM3020142014/12/17HJ-1A30
19931993/12/17TM3020152016/02/16OLI30
19941994/12/04TM3020162016/12/16OLI30
19951995/12/07TM3020172017/12/19OLI30
19961997/01/10TM3020182019/01/23OLI30
19991999/12/18TM3020192019/12/06HJ-1A30
20012002/01/08TM30
1 Year represents the hydrological year for Poyang Lake. April 1 indicates the start of the dry to wet transition.
Table 2. Classification accuracy evaluation in 2017.
TypeVegetationWaterSandSwamp & MudflatTotal
Vegetation294000294
Water029207299
Sand001390139
Swamp & Mudflat6811293318
total3003001503001050
Prod. accuracy%98.00%97.33%92.67%97.67%
Overall accuracy = 96.95%Kappa coefficient = 0.96
Note: The Landsat OLI images were acquired on 19 December 2017. The true sample points were acquired from Quick bird images on 21 December 2017 that were available in Google Earth.
Table 3. Classification accuracy of different band combinations in 2017.
Prod. AccuracyVegetationWaterSandSwamp & MudflatAllKappa
UNVI, MNDWI, NIR, Red, and Green98.00%97.33%92.67%97.67%96.95%0.96
NDVI, NDWI, NIR, Red, and Green94.00%98.33%91.33%95.00%95.14%0.94
Table 4. The areas of different wetland type changes in Poyang Lake from 1973–2019.
TypeUnchanged (km2)Declined (km2)Increased (km2)
Vegetation534.106399.152597.376
Water558.302499.127350.706
Sand24.137568.54234.717
Swamp and Mudflat465.296434.6211008.187
Table 5. Long-year wetland area of different types in Poyang Lake from 1973 to 2019.
RegionLong-year Water (km2)Long-year Vegetation (km2)Long-year Swamp and Mudflat (km2)
181.0314.89119.76
291.684.7519.97
3322.20175.0545.01
4273.0863.0912.97
572.27146.4830.33
650.64136.2925.64
Poyang Lake891.01540.80254.42
Table 6. q values of driving factors affecting the distribution of wetland landcover types between 1973 and 2019.
TypeESlopeAspectCTMAXTMINTPDP
Poyang LakeV0.387 **0.426 **0.266 **0.250 **0.011 **0.012 **0.027 **0.017 **0.040 **
W0.226 **0.306 **0.216 **0.202 **0.057 **0.045 **0.112 **0.029 **0.018 **
S0.031 **0.033 **0.0000.004 **0.028 **0.059 **0.021 **0.020 **0.024 **
S&M0.103 **0.009 **0.0000.007 **0.094 **0.074 **0.113 **0.041 **0.044 **
Region 1V0.329 **0.273 **0.201 **0.242 **0.019 **0.021 **0.009 **0.061 **0.108 **
W0.112 **0.089 **0.069 **0.095 **0.183 **0.019 **0.032 **0.053 **0.046 **
S0.014 **0.013 **0.0050.006*0.122 **0.104 **0.147 **0.047 **0.019 **
S&M0.027 **0.019 **0.009*0.024 **0.051 **0.028 **0.050 **0.029 **0.028 **
Region 2V0.239 **0.173 **0.163 **0.140 **0.0010.0010.014 **0.060 **0.060 **
W0.139 **0.110 **0.110 **0.096 **0.008 **0.0070.0070.019 **0.013 **
S0.500 **0.290 **0.120 **0.143 **0.012 **0.0020.095 **0.0070.010 **
S&M0.034 **0.020 **0.0040.0080.010 **0.0040.019 **0.0050.002
Region 3V0.589 **0.493 **0.312 **0.281 **0.072 **0.042 **0.056 **0.049 **0.125 **
W0.524 **0.485 **0.351 **0.309 **0.069 **0.019 **0.038 **0.054 **0.101 **
S0.014 **0.009 **0.0010.0040.020 **0.033 **0.034 **0.029 **0.032 **
S&M0.074 **0.064 **0.029 **0.037 **0.013 **0.0010.009 **0.040 **0.025 **
Region 4V0.337 **0.413 **0.244 **0.293 **0.126 **0.039 **0.191 **0.0000.013 **
W0.494 **0.563 **0.385 **0.412 **0.193 **0.074 **0.289 **0.0020.008 **
S0.016 **0.017 **0.0070.019 **0.0020.0000.0050.0020.000
S&M0.315 **0.322 **0.205 **0.243 **0.117 **0.043 **0.163 **0.007 **0.000
Region 5V0.502 **0.379 **0.190 **0.176 **0.038 **0.011 **0.040 **0.006 **0.003*
W0.400 **0.307 **0.159 **0.146 **0.045 **0.013 **0.057 **0.011 **0.008 **
S0.0040.0010.0000.0030.017 **0.0000.016 **0.011 **0.002
S&M0.114 **0.050 **0.025 **0.026 **0.030 **0.0000.022 **0.0000.000
Region 6V0.360 **0.228 **0.112 **0.101 **0.038 **0.023 **0.027 **0.036 **0.033 **
W0.294 **0.186 **0.099 **0.094 **0.043 **0.057 **0.028 **0.072 **0.055 **
S0.056 **0.045 **0.0010.0040.112 **0.063 **0.078 **0.179 **0.047 **
S&M0.097 **0.041 **0.023 **0.023 **0.007*0.011 **0.006 *0.0070.005
Note: V, W, S, E, C, and S&M represent vegetation, water, sand, elevation, curvature, and swamp and mudflat, respectively; T, MAXT, and MINT represent the respective average temperature, maximum, and minimum temperature for September to November between 1973 and 2019; P, and DP represent the total precipitation, and days with daily precipitation ≥0.1 mm, respectively. ** p < 0.01, * p < 0.05. The bold represents the maximum q value.
Table 7. q values of the interaction driving factors affecting the distribution of wetland landcover types between 1973 and 2019.
TypeDominant Interaction 1, qDominant Interaction 2, qDominant Interaction 3, qDominant Interaction 4, q
Poyang LakeVE ∩ Slope, 0.558E ∩ C, 0.487E ∩ MINT, 0.486Slope ∩ C, 0.462
WE ∩ Slop, 0.450E ∩ MINT, 0.421Slope ∩ MINT, 0.415Slope ∩ MAXT, 0.398
SMAXT ∩ MINT, 0.169MAXT ∩ Slope, 0.163MAXT∩E, 0.114MAXT ∩ T, 0.114
S&ME ∩ MINT, 0.207E ∩ T, 0.204E ∩ MAXT, 0.192E ∩ P, 0.184
Region 1VE ∩ DP, 0.564E ∩ P, 0.533E ∩ MINT, 0.522E ∩ T, 0.499
WE ∩ P, 0.167E ∩ DP, 0.165E ∩ MINT, 0.154C ∩ DP, 0.149
SMINT ∩ P, 0.243MINT ∩ C, 0.242MINT ∩ Slope, 0.23MINT ∩ E, 0.228
S&MMINT ∩ DP, 0.188T ∩ DP, 0.186P ∩ MINT, 0.173P ∩ T, 0.172
Region 2VE ∩ C, 0.320E ∩ Slope, 0.304E ∩ Aspect, 0.298E∩DP, 0.282
WE ∩ C, 0.163E ∩ Aspect, 0.160E ∩ Slope, 0.158E ∩ P, 0.156
SE ∩ MINT, 0.637E ∩ T, 0.588E ∩ DP, 0.576E ∩ C, 0.562
S&ME ∩ T, 0.088E ∩ MINT, 0.067E ∩ DP, 0.067E ∩ Aspect, 0.057
Region 3VE ∩ Slope, 0.658E ∩ C, 0.634E ∩ DP, 0.622E ∩ P, 0.622
WE ∩ Slope, 0.604E ∩ DP, 0.598E ∩ P, 0.594E ∩ Aspect, 0.587
SE ∩ T, 0.081E ∩ DP, 0.067Slope ∩ DP, 0.065C ∩ DP, 0.063
S&ME ∩ DP, 0.170E ∩ P, 0.166E ∩ Slope, 0.164E ∩ T, 0.159
Region 4VE ∩ Slope, 0.554E ∩ MINT, 0.547E ∩ C, 0.517C ∩ Slope, 0.480
WE ∩ MINT, 0.719E ∩ Slope, 0.693E ∩ C, 0.672MINT ∩ Slope, 0.666
SC ∩ Slope, 0.047C ∩ E, 0.041C ∩ T, 0.040C ∩ Aspect, 0.039
S&ME ∩ Slope, 0.439E ∩ Slope, 0.432E ∩ MINT, 0.425Slope ∩ MINT, 0.418
Region 5VE ∩ Slope, 0.570E ∩ MINT, 0.560E ∩ T, 0.558E ∩ P, 0.557
WE ∩ Slope, 0.479E ∩ T, 0.476E ∩ MINT, 0.472E ∩ DP, 0.465
SE ∩ MINT, 0.053E ∩ T, 0.050Slope ∩ T, 0.041Aspect ∩ T, 0.040
S&ME ∩ T, 0.211E ∩ MINT, 0.210E ∩ DP, 0.157E ∩ P, 0.156
Region 6VE ∩ P, 0.453E ∩ Slope, 0.440E ∩ MAXT, 0.440E ∩ T, 0.440
WE ∩ Slope, 0.440E ∩ P, 0.428E ∩ MAXT, 0.409E ∩ T, 0.407
SP ∩ Slope, 0.375P ∩ E, 0.329MAXT ∩ E, 0.320MAXT ∩ Slope, 0.295
S&MP ∩ E, 0.181MAXT ∩ E, 0.179T ∩ E, 0.165MINT ∩ E, 0.163

