Article

Characteristic Analysis of Droughts and Waterlogging Events for Maize Based on a New Comprehensive Index through Coupling of Multisource Data in Midwestern Jilin Province, China

1
School of Environment, Northeast Normal University, Changchun 130024, China
2
Key Laboratory for Vegetation Ecology, Ministry of Education, Changchun 130117, China
3
State Environmental Protection Key Laboratory of Wetland Ecology and Vegetation Restoration, Northeast Normal University, Changchun 130117, China
4
Chinese Academy of Meteorological Sciences, Beijing 100081, China
5
School of Geoscience, Inner Mongolia Normal University, Hohhot 010000, China
6
Inner Mongolia Key Laboratory of Disaster and Ecological Security on the Mongolia Plateau, Inner Mongolia Normal University, Hohhot 010000, China
*
Author to whom correspondence should be addressed.
Remote Sens. 2020, 12(1), 60; https://doi.org/10.3390/rs12010060
Submission received: 19 November 2019 / Revised: 15 December 2019 / Accepted: 20 December 2019 / Published: 23 December 2019

Abstract

:
Frequent droughts and waterlogging events are a threat to food security. An understanding of the spatial and temporal variations that occur during such events is essential when conducting a regional and/or global drought and waterlogging assessment. The goal of this study is to define a comprehensive index that considers the continuum system of atmosphere, crops, and soil moisture impacts on droughts and waterlogging events, and to analyze the temporal and spatial distribution of such events in the development of maize. The results show that the proposed comprehensive drought and waterlogging index (CDWI) can bring together the advantages of a single drought and waterlogging index and reasonably describe its range. During the study period, the annual trends of the CDWI decreased at different growth stages from 1982 to 2015, whereas the CDWI did not show significant spatial heterogeneity during any particular stage. Increasing trends of CDWI over 0.019/year were found in the northern part of Midwestern Jilin Province from the emergence to tasseling stages. In addition, decreasing trends were observed in the study area from the tasseling to maturation stages. Slight drought and waterlogging events occurred more frequently than moderate and serious drought and waterlogging events.

Graphical Abstract

1. Introduction

As one of the countries with the most natural disasters in the world, the various types of natural disasters that take place frequently often cause severe damage in China [1], and meteorological and related disasters account for more than 70% of the losses incurred [2]. China is located in East Asian monsoon region, which is a special climate condition determined by geographical position. In addition, soil erosion caused by human activities has led to an uneven distribution of rainfall in terms of both location and time [3,4]. The precipitation is governed by the East Asian summer monsoons, extreme droughts and waterlogging events have increased owing to the impact of the East Asian monsoons since the 1970s, threatening human life and development [5,6]. An increase in droughts has been widely documented in China, with adverse effects on water resources and ecosystems, particularly during the past 20 years [7,8]. Under future climate conditions, the probability of drought occurrence is expected to increase by nearly 100% by the year 2050 [9]. Since the 1960s, owing to climate warming, the frequency of extreme weather events has steadily increased, including severe precipitation [10]. Since the founding of the People’s Republic of China, waterlogging disasters have affected crop-growing areas, damaging 3 × 10⁷ hm2 of farmland, and have resulted in disaster areas of up to 10% of the arable land [11]. The frequent occurrence of droughts and waterlogging disasters has been a problem inhibiting the survival and development of the Chinese people, which has not only interfered with normal agricultural production, but has also restricted the production and livelihood of regional areas [12]. The characteristics of drought and waterlogging disasters have become the focus and a key research subject of local meteorological departments, and has attracted increasing attention from policy makers and scholars in various countries.
Droughts and waterlogging indices have been widely cited in global and/or regional drought and waterlogging assessment and monitoring. A dependable drought and waterlogging index is indispensable to accurately identify drought and waterlogging events. The most popular drought and waterlogging indices have recently included three types: single, multiple, and aggregated indices. Most single drought and waterlogging indices are designed for specific applications, and their use has thus been challenging [13,14,15]. For example, the standardized precipitation index (SPI) only considers one or more hydrological and climatic variables [16], and indices of precipitation and soil moisture (SM) are used to estimate drought and waterlogging largely based on changes in water supply, and not vegetation [17,18,19]. By contrast, with continuing technological development, particularly within the field of remote sensing, such as in the normalized difference vegetation index (NDVI), the vegetation dynamics are taken as the primary consideration, whereas climate change is less considered when analyzing drought threat [20,21,22]. Indices based on a single variable usually depend on the following assumptions: (a) the variability of a single specific variable, such as precipitation, water flow, temperature, or soil moisture, is much higher than that of other variables, and (b) other variables have no time trend [23,24,25]. Furthermore, multiple drought and waterlogging indices take more variables into consideration, such as the standardized precipitation evapotranspiration index (SPEI), Palmer drought severity index (PDSI), and surplus deficit intensity index (SDI), all of which are calculated based on the precipitation, potential or reference evapotranspiration, and available water capacity [26,27,28,29,30,31,32]. However, these indices depend only on precipitation and evapotranspiration data, omitting soil conditions and crop development, thereby decreasing their effectiveness.
Due to the complexity of regarding the cause and effect of agricultural drought and waterlogging involving natural factors, such as the atmosphere, crops, soil, and relevant social aspects, a composite index based on different drought and waterlogging indices has been developed to overcome the limitations of a single drought index, which can reflect multivariate drought and waterlogging variables simultaneously [33,34,35,36]. For example, Andreia et al. (2019) evaluated the drought hazard on the Iberian Peninsula based on the multiscalar standardized precipitation evapotranspiration index (SPEI) and three remote sensing indices, namely, the vegetation condition index (VCI), temperature condition index (TCI), and vegetation health (VHI) indices [37]. Yang et al. (2018) identified drought events and evaluated multivariate drought characteristics based on a nonlinear multivariate drought index (NMDI) [38]. Waseem et al. (2015) encouraged the development and evaluation of a multivariate composite drought index (CDI) and compared it to the SPI index [15]. Svoboda et al. (2002) developed the United States drought monitoring (USDM) system by assimilating the PDSI, SPI, percentage of normal precipitation, NDVI, soil moisture, water flow, and other indicators [39]. Meteorological droughts and waterlogging occur more frequently, and normally trigger other types of drought and waterlogging, including agricultural, hydrological, and socioeconomic droughts [40]. For agricultural drought and waterlogging, soil moisture content and plant growth are commonly used along with the secondary parameters of precipitation and/or evapotranspiration [41,42]. Therefore, we propose the use of a comprehensive drought and waterlogging index based on the atmosphere-soil-vegetation continuum system to reflect the regional drought and waterlogging variations for the development of maize.
Midwestern Jilin Province is located in a monsoon climate area, and is a region with numerous droughts and waterlogging events. Owing to the differences in geographical location, as well as the scope of the influence and intensity of the annual occurrence of cold and warm air masses, Midwestern Jilin Province faces the threat of frequent and repeated drought and waterlogging disasters. According to statistics, during the past 300 years, there have been more than 90 drought and waterlogging events in Midwestern Jilin Province, which occur every 3 years on average [43]. This presents a huge threat to the agricultural production and food security of China, affecting the sustainable development of the region. Therefore, studies on the spatial and temporal distribution of droughts and waterlogging disasters in Midwestern Jilin Province have important practical and theoretical significance for formulating a reasonable irrigation system and improving the utilization efficiency of water resources.

2. Materials and Methods

2.1. Study Area

China’s golden corn belt starts from the southern part of Heilongjiang Province, including most of Jilin Province, the eastern part of the Inner Mongolia Autonomous Region, and extends to the northern part of Liaoning Province. It is one of the three golden corn belts of the world, along with the American corn belt and the Ukrainian corn belt, both at the same latitude [44]. Its core region is located in Midwestern Jilin Province.
Midwestern Jilin Province is located in the southwest of Songnen Plain, the western area of the Inner Mongolia Autonomous Region, the eastern part of Horqin grassland, and the northern part of Heilongjiang Province, extending from a latitude of 43°16′N to 46°18′N and a longitude of 121°38′E to 127°45′E (Figure 1). It covers an area of 8.29 million ha, accounting for 44.23% of the land area of Jilin Province. The cultivated area is nearly 3 million ha, accounting for 75.1% of the cultivated area of Jilin Province [45,46]. It is an important part of the grain production base of Jilin Province, and is also the main region ensuring the safe production of grain throughout the whole province. Therefore, reducing the impact and loss of meteorological disasters on the agriculture in Jilin Province is an urgent task.

2.2. Data and Preprocessing

2.2.1. Meteorological and Remote Sensing Data

Actual evapotranspiration (AET), potential evapotranspiration (PET), Palmer Drought Severity Index (PDSI), and soil moisture (SM) datasets were obtained based on the TerraClimate dataset from 1982–2015, with a high spatial resolution of 4 km (1/24°) and were created using climatically aided interpolation, combining the WorldClim versions 1.4 and 2 datasets with CRU Ts4.0 and JRA-55 [47]. To match grid points, we conducted a grid treatment of 4 × 4 km in Midwestern Jilin Province, and there were 5478 grid points in the study area.
The GIMMS 3g NDVI dataset with a spatial resolution of 8 km (1/12°) and a temporal resolution of 15 days was obtained from the NASA Earth Exchange (https://nex.nasa.gov/). The data were derived from advanced very high resolution radiometer sensors on board several NOAA satellites [48,49,50]. The images from the GIMMS 3g NDVI data used in this study were resampled to a resolution of 4 km, making it correspond to the grid points.
The gridded SPEI-1 was derived from SPEIbase version 2.4 with a spatial resolution of 0.5°, based on monthly precipitation and potential evapotranspiration of the CRU TS 3.23 dataset from the Climatic Research Unit of the University of East Anglia. The gridded SPEI-1 was also derived from the FAO-56 Penman–Monteith estimation of potential evapotranspiration [51].

2.2.2. Maize Yield Records
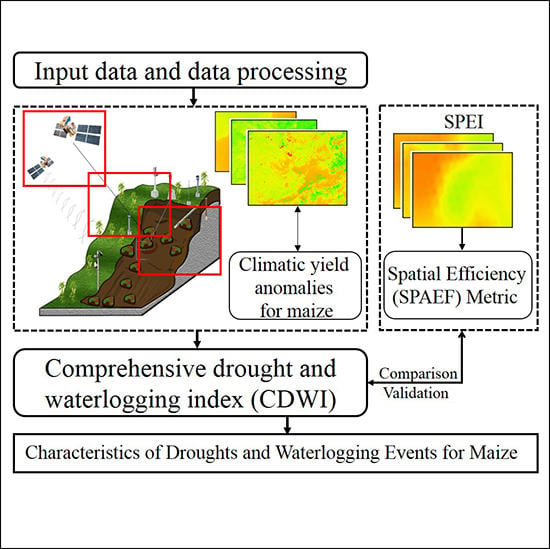
Data on the maize yield in Midwestern Jilin Province were derived from the Ministry of Agriculture and Rural Affairs of the People’s Republic of China (http://www.moa.gov.cn/), using a time series of 1960–2015 years. The data on the maize development period were from Jilin Academy of Agricultural Sciences, and mainly include the date of emergence, tassel, milk ripening, and maturity from 1980 to 2010. In this study, we counted the historical development period data of each county and city within the study area and calculated the annual average value for each growth period of maize. Finally, to study the characteristics of drought and waterlogging for maize, we selected three growth stages, namely, from seedling to tassel, from tassel to milk ripening, and from milk ripening to ripening.

2.3. Methods

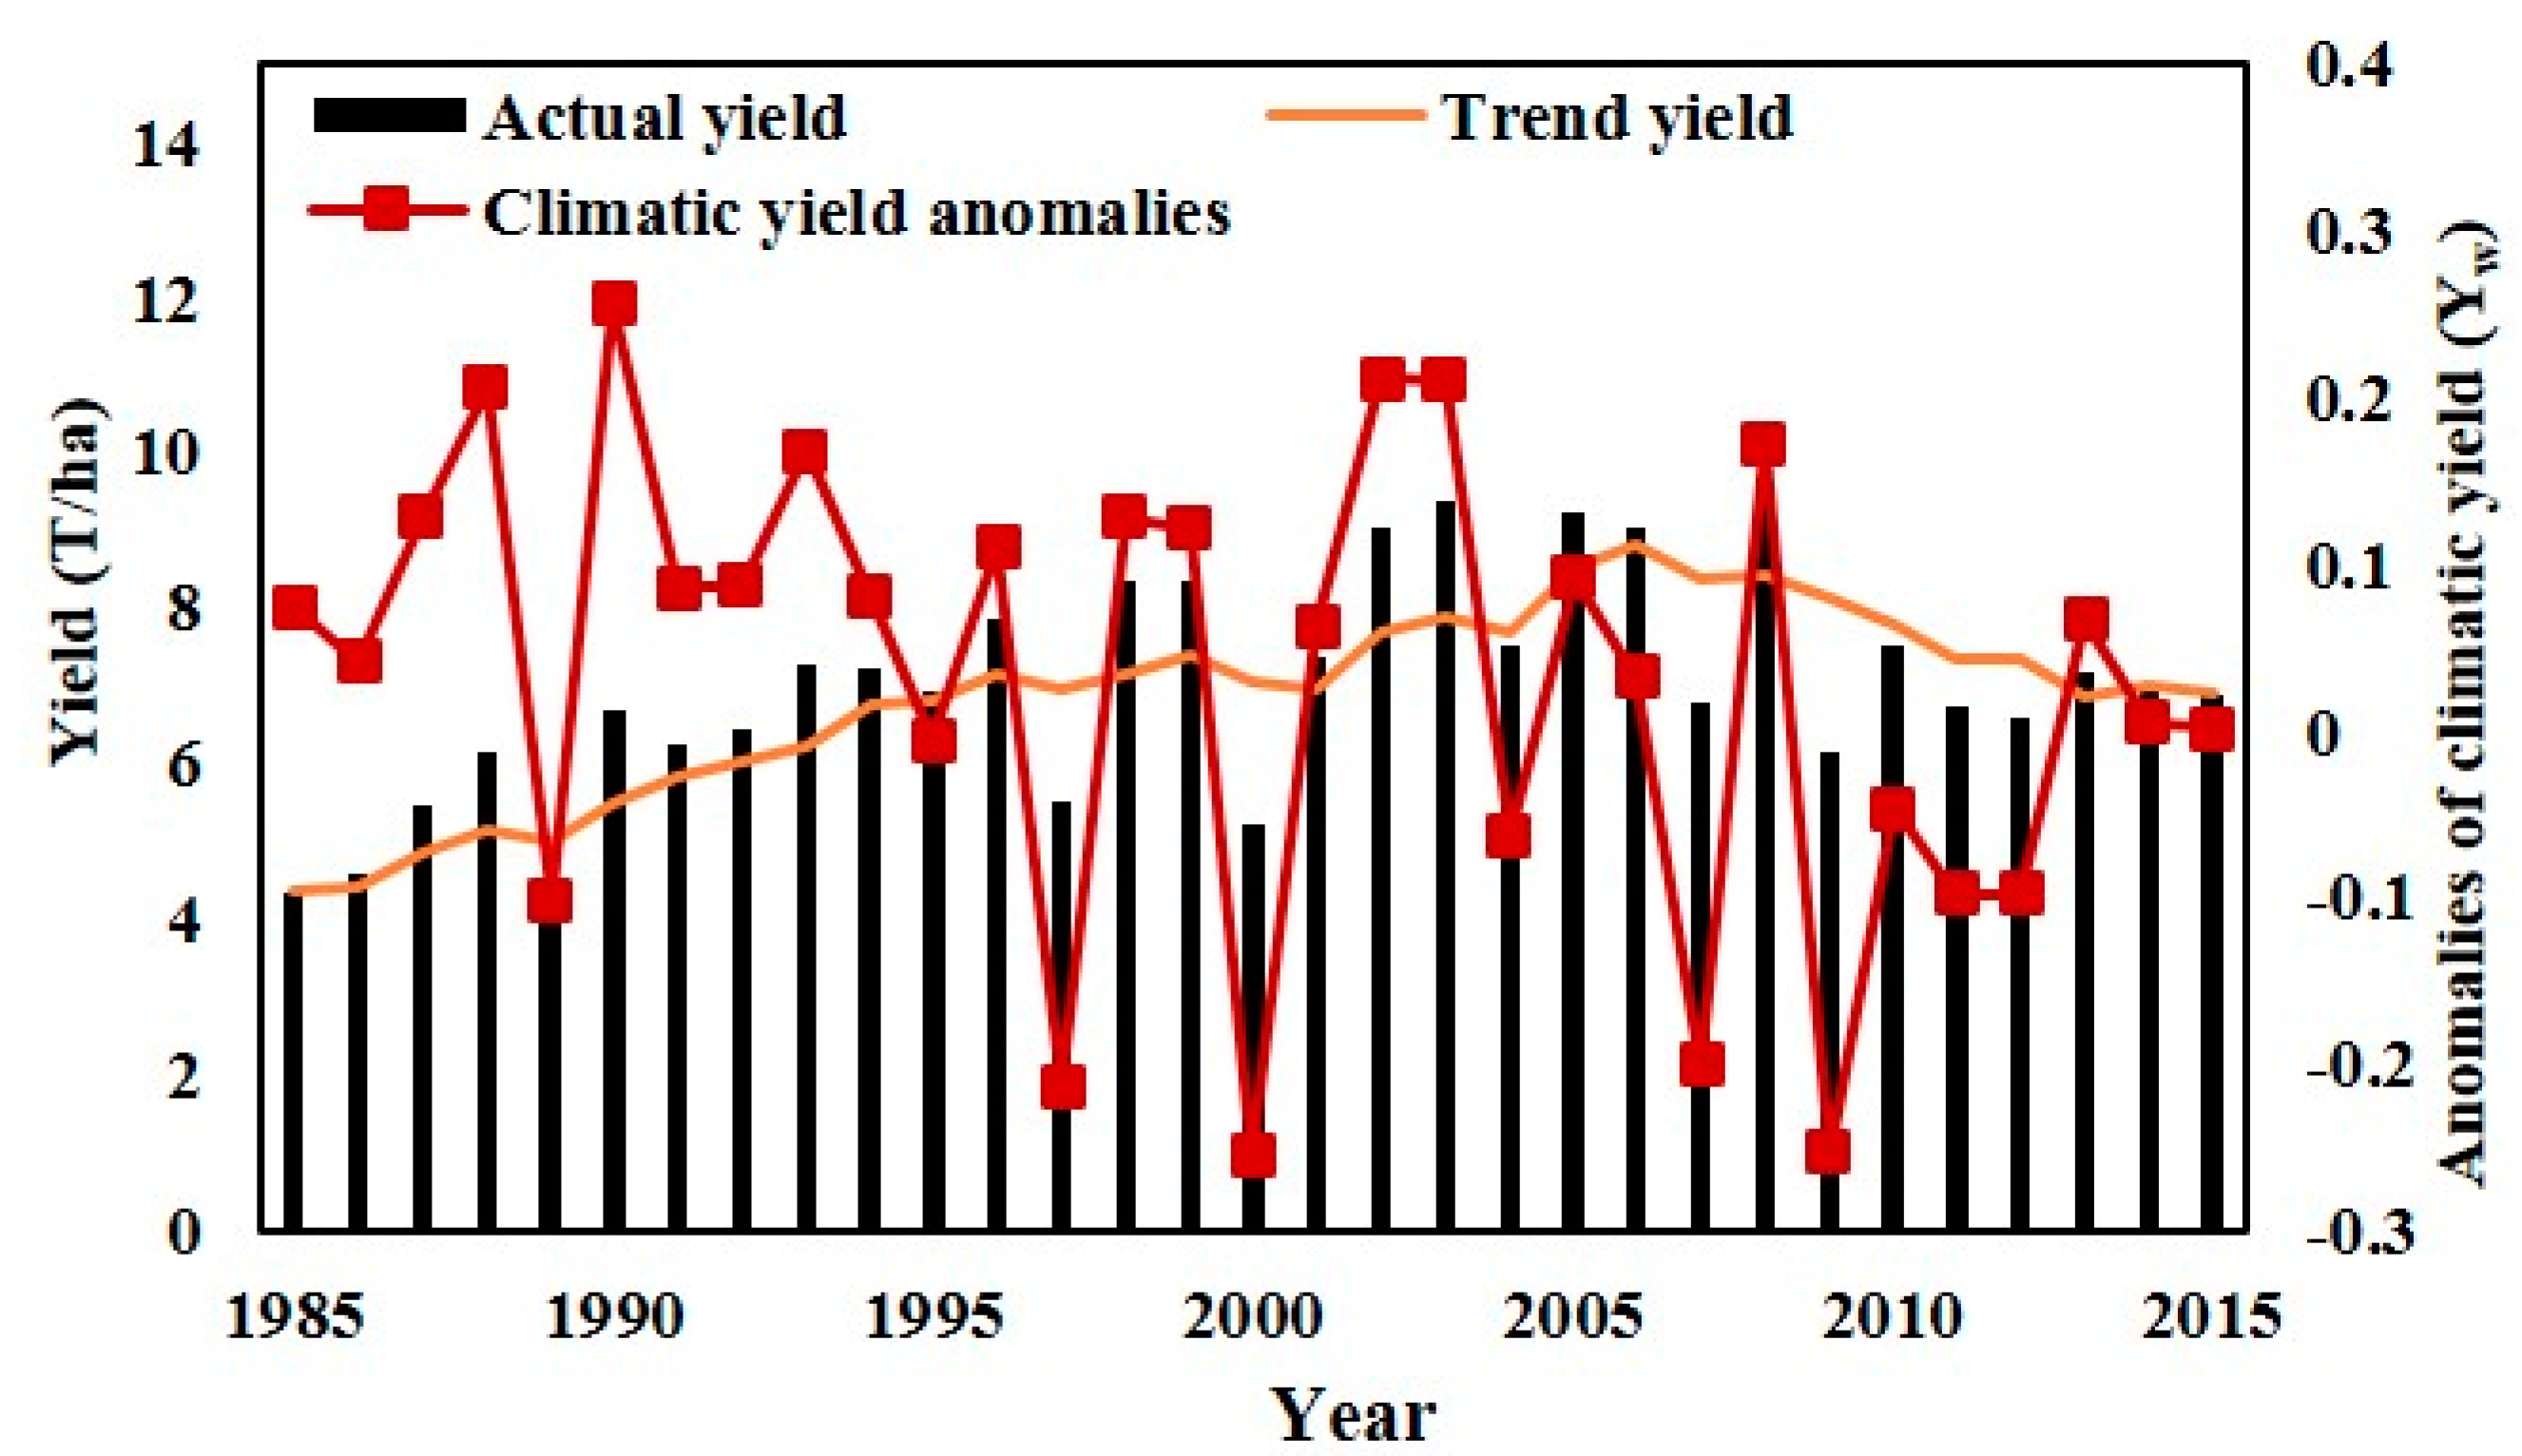
2.3.1. Anomalies of Climatic Yield

Crop yield is often affected by climate change and human activities, such as crop variety renewal and agricultural technology development. Therefore, in order to eliminate the interference of human activities, crop yield is divided into three parts: climate yield, trend yield, and random error. The five-year moving average method is used to calculate the trend yield [52,53]. The meteorological yield is the difference between the actual yield and the trend yield. The anomalies of climatic yield can be defined as follows:
Y w = Y Y t Y t ,
where Y w is the anomalies of climatic yield; Y is the actual yield; Y t is the trend yield. The interannual variation of climatic yield anomalies during 1985–2015 in Midwestern Jilin Province is shown in Figure 2, which shows negative value of climatic yield anomalies accounting for a large proportion in the study area.

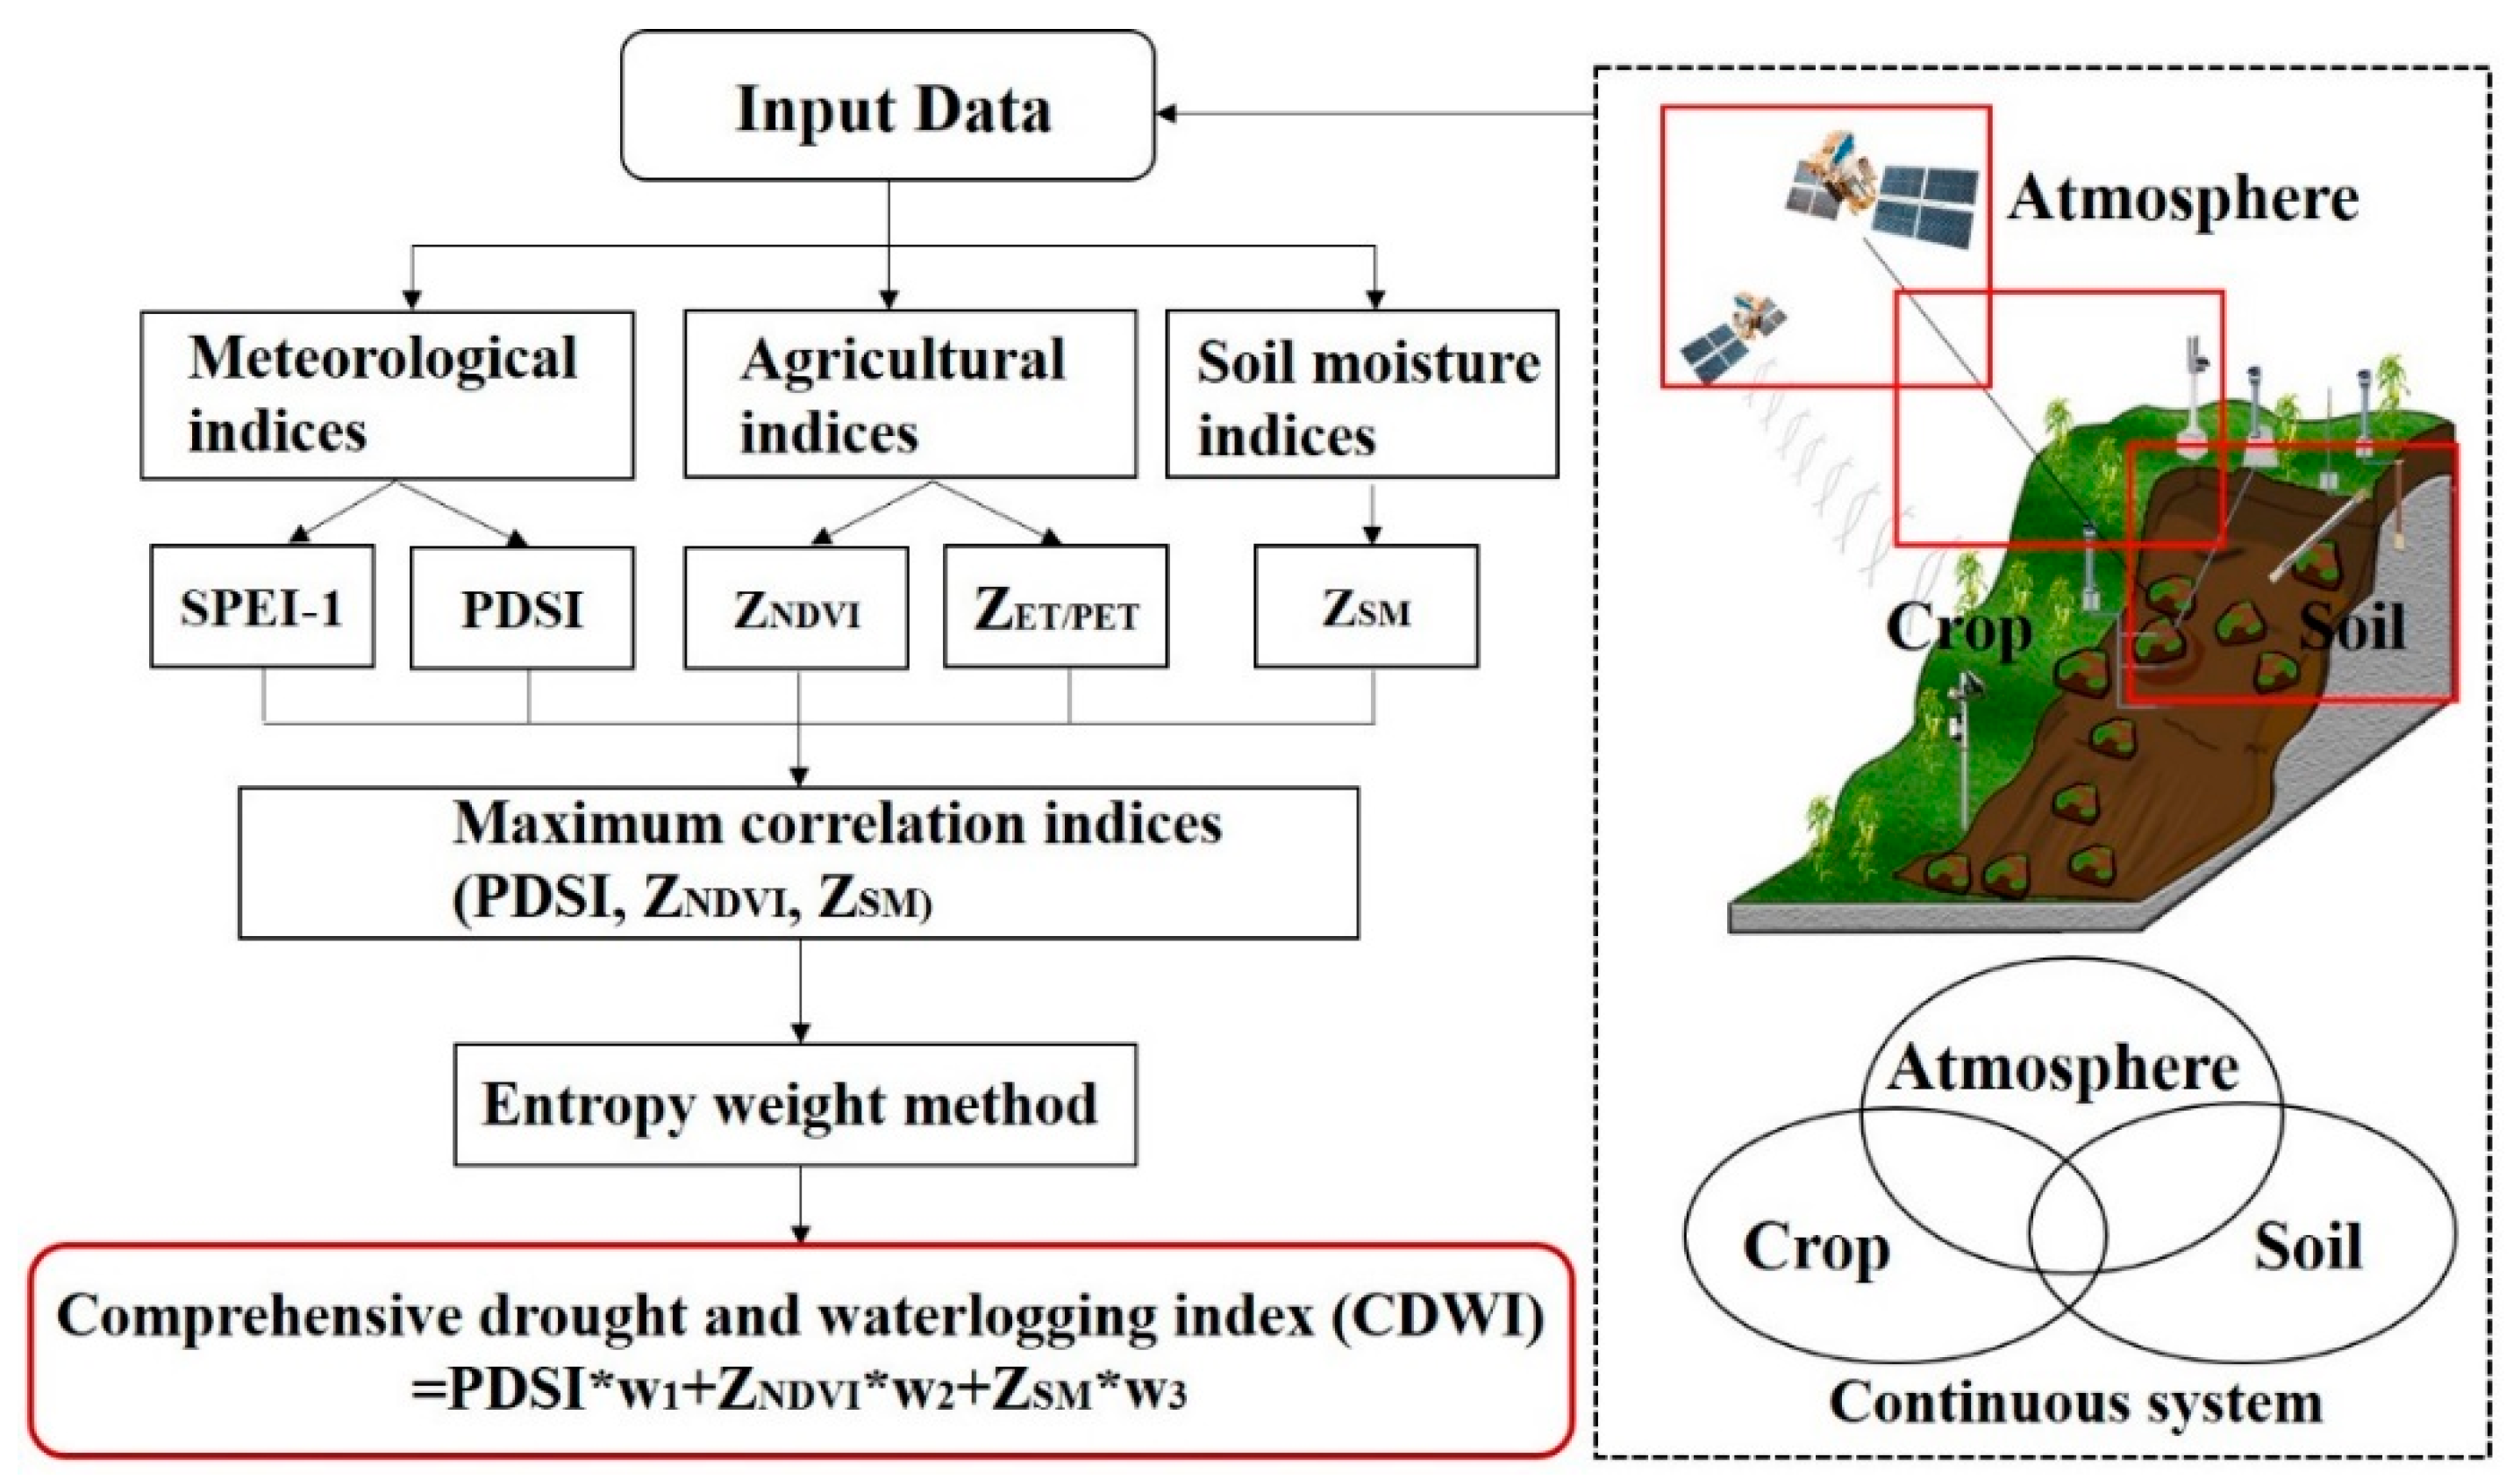
2.3.2. Comprehensive Drought and Waterlogging Index (CDWI)

Drought and waterlogging disasters for maize are affected not only by precipitation, soil moisture, and crop growth conditions can also affect such occurrences. Thus, we constructed the CDWI from atmosphere-soil-crop systems. The CDWI was built according to the following three steps: (a) five drought and waterlogging indices from the three groups were selected, SPEI-1 and PDSI were chosen as meteorological drought and waterlogging indicators, standardized NDVI and standardized ET/PET were selected as crop drought and waterlogging indicators, and standardized soil moisture was selected as soil drought and waterlogging indicators. (b) To exert the advantage of each drought and waterlogging index, we calculated the correlations between the climatic yield anomalies and each index. The indices with the highest correlation coefficient for the above three groups were then maintained. (c) Finally, we calculated the weighted values of the three groups with the selected drought and waterlogging indices based on the entropy weight method (Figure 3).
Based on the above steps, we built a comprehensive drought and waterlogging index based on the PDSI, standardized NDVI (ZNDVI), and standardized soil moisture (Zsm). The weights calculated using the entropy weight method applying the above three indicators are 0.463, 0.228, and 0.309, respectively. The calculation formula of the CDWI is as follows:
C D W I i j = w 1 × P D S I i j + w 2 × Z N D V I i j + w 3 × Z s m i j ,
Z N D V I ij = N D V I ij N D V I min N D V I max N D V I min ,
Z s m ij = S M ij S M min S M max S M min .
The CDWI indexes for the three different stages of maize growth, namely, the emergence-tasseling stage (STAGE 1), tasseling-milk maturity (STAGE 2), and milk maturity-mature stage (STAGE 3). STAGE 1 is defined as the period from May to July. STAGE 2 is the period in August and STAGE 3 is the period in September. SPEI is one of the most commonly used indicators of agricultural drought and waterlogging, which uses temperature and precipitation inputs to evaluate drought and waterlogging. Thus, we defined the CDWI categories based on the equal interval method by referring to the corresponding SPEI (Table 1).

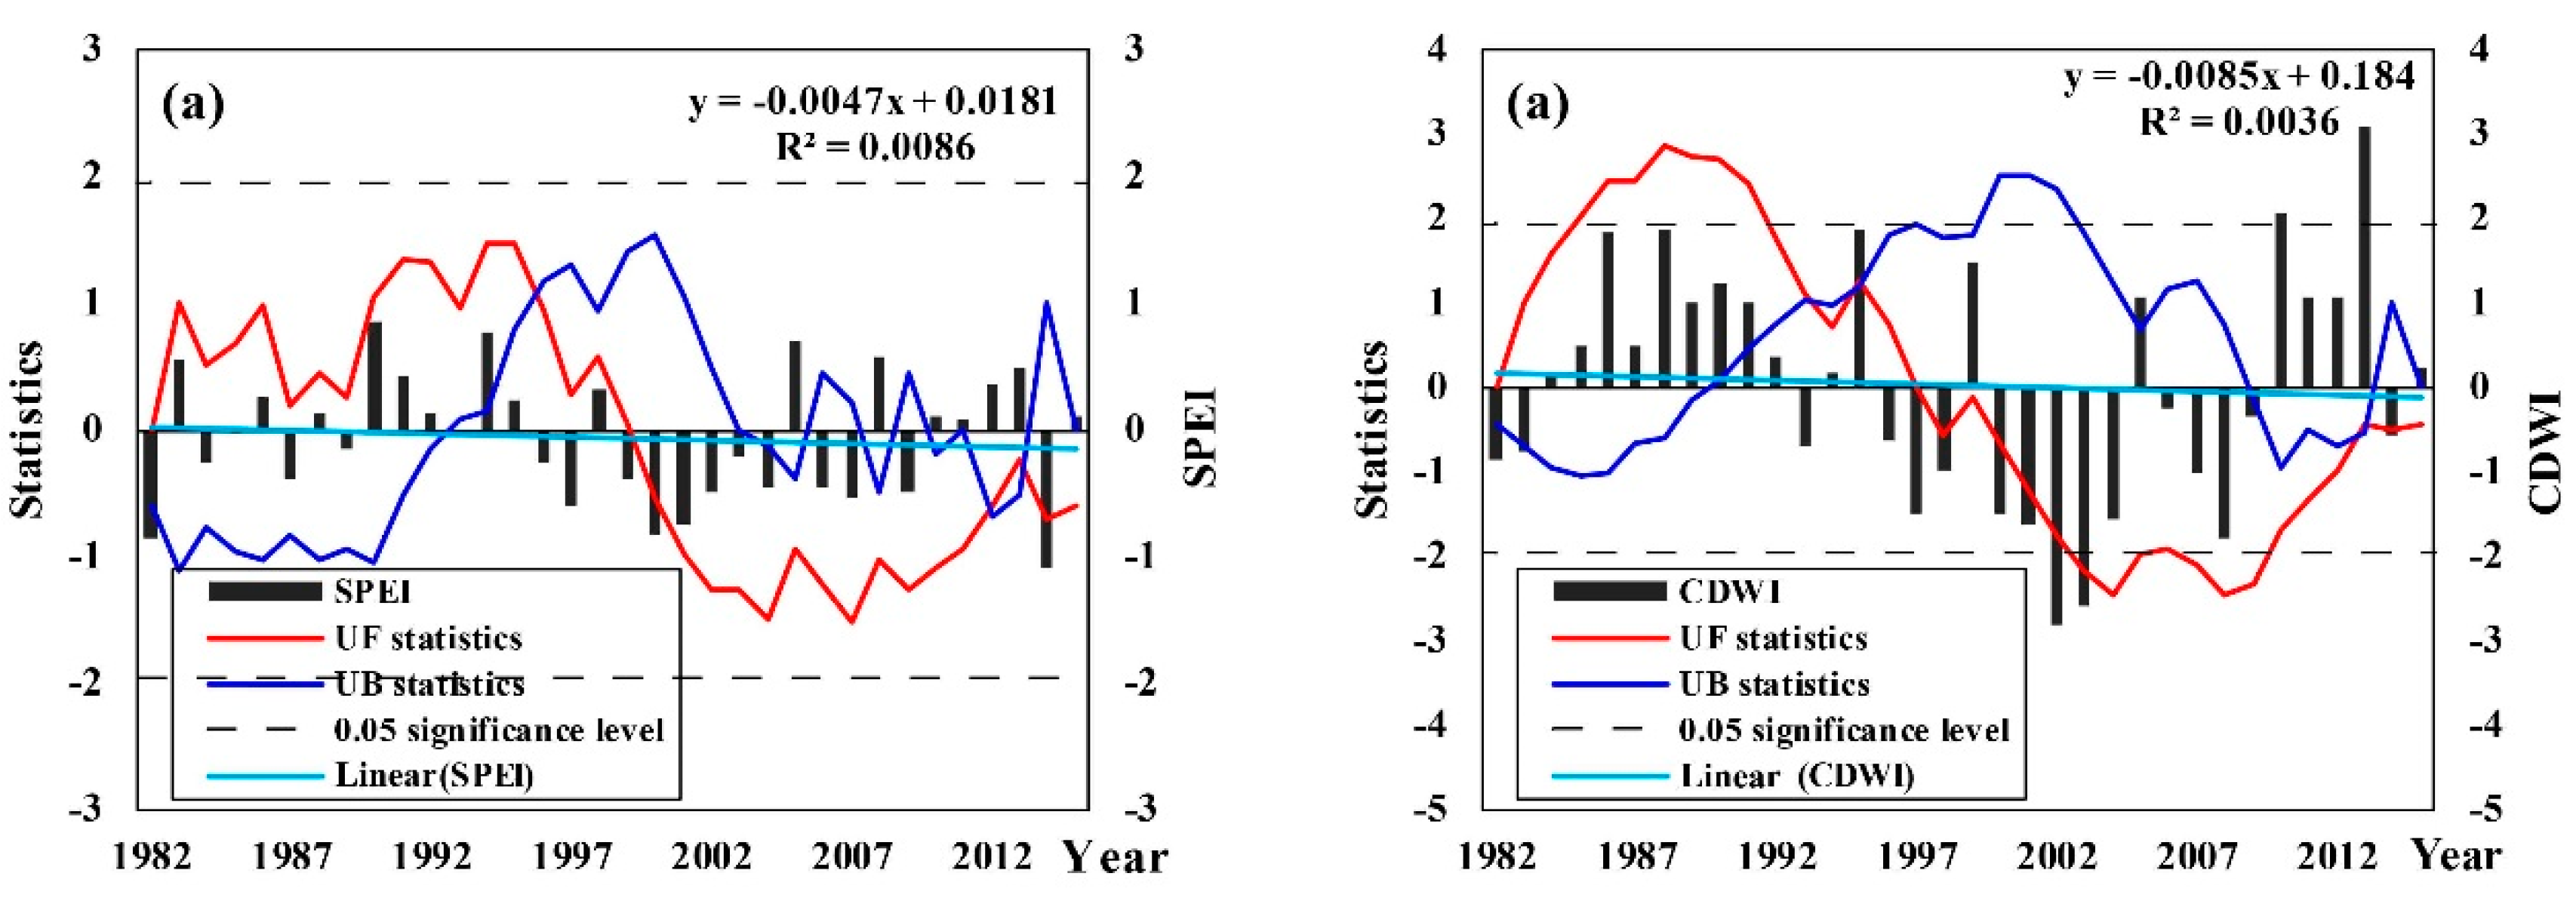
2.3.3. Sen’s Slope Method

Sen’s slope method can reduce the interference of noise by calculating the median value of a certain time series. Sen developed a nonparametric text for estimating the true slope of a linear trend in a time series [54].

2.3.4. Mann–Kendall Test

The Mann–Kendall test is a nonparametric test recommended by the World Meteorological Organization and has been widely used. It does not need to follow a certain distribution or be disturbed by a few outliers [55]. It can be used for mutation detection and also for testing the variation trend of data sequence.

2.3.5. Spatial Efficiency (SPAEF) Metric

Demirel et al. (2018) introduced the brand new multicomponent spatial efficiency (SPAEF) metric that shows the utility of SPAEF in an ensemble model calibration [56]. We used the SPAEF metric to compare the spatial distribution characteristics of the two indexes. SPAEF is defined as follows:
SPAEF = 1 ( α 1 ) 2 + ( β 1 ) 2 + ( γ 1 ) 2 ,
α = ρ ( A ,   B ) ,   and   β = ( σ A μ B ) / ( σ B μ B ) ,
γ = j = 1 n min ( K j , L j ) / j = 1 n K j ,
where α is the Pearson’s correlation coefficient between two indices, β is the fraction of coefficient of variations representing spatial variability, and γ is the percentage of histogram intersection. In addition, γ is calculated for a given histogram K of index (A) and the histogram L of index (B), each containing 100 bins.

2.3.6. Entropy Weight Method

We used the entropy weight method to define the weight of each indicator. Compared with the Bayesian model, this method does not need to know the prior probabilities, which depend on a hypothesis in many cases. Compared with the analytic hierarchy process (AHP) and expert opinion, the entropy weight method is based on the amount of information to determine the weight of the index, which is an objective fixed weight method [57], and can avoid the difficulty of relying on subjective expert scores. Information entropy is a quantity used to describe the disorder of the information contained in information theory. The greater the entropy is, the higher the degree of disorder, and the lower the effectiveness held by the corresponding information. With information theory, the entropy weight represents useful information of the evaluation index. Therefore, the larger the entropy weight of the index is, the more useful the information of the index [58].

3. Results

3.1. Comparisons of the SPEI and CDWI

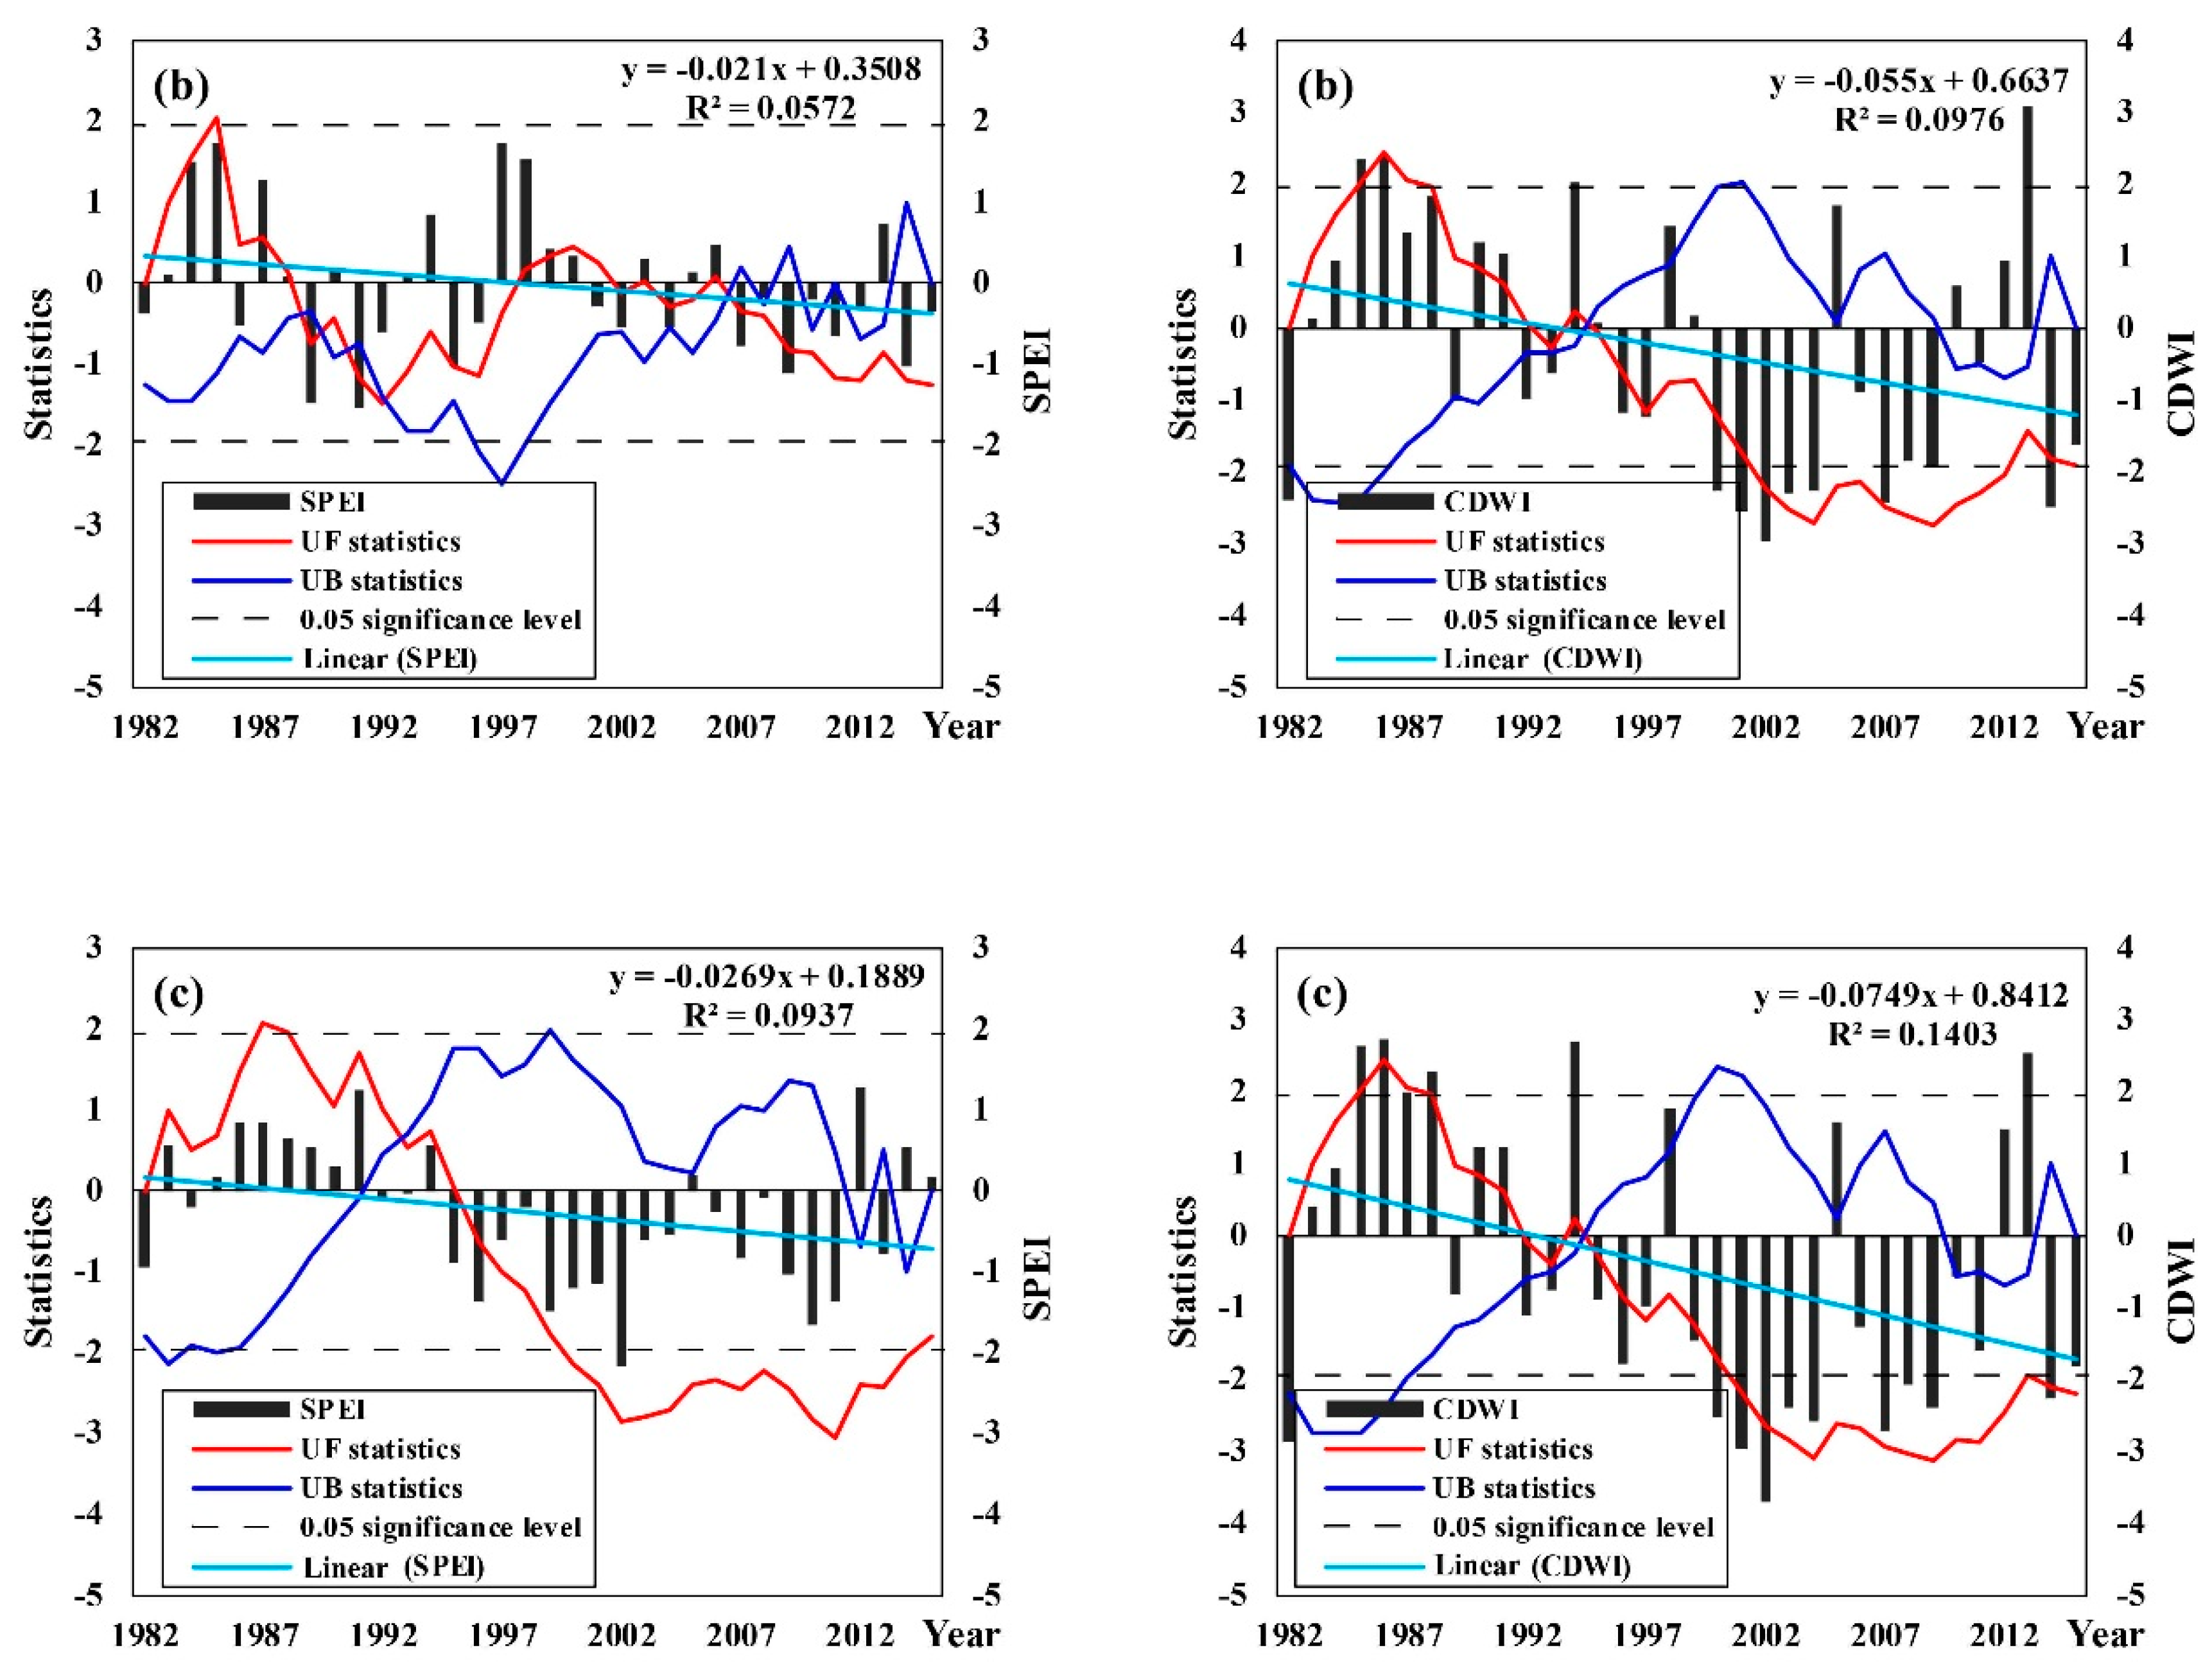
3.1.1. Comparison of the Two Indices in Time

The lifecycle of maize in Midwestern Jilin Province is generally from May to September. In this study, the monthly PDSI, NDVI, and soil moisture were used to construct the comprehensive drought and waterlogging index. Therefore, we selected the one-month scale SPEI (SPEI-1) for comparison with the CDWI.
Figure 4 shows the temporal trends and abrupt change by year of the SPEI and CDWI in different growth stages for maize in Midwestern Jilin Province from 1982 to 2015. In general, the temporal trends showed a high similarity between the SPEI and CDWI, which decreased during each growth period of maize. During the periods from emergence to tasseling, the declining trend of both the SPEI and CDWI were not obvious, and the slopes of decline were −0.0047/year and −0.0085/year, respectively. Regardless of whether the SPEI or the CDWI is applied, the UF statistics were greater than 0 before 1997 and less than 0 after 1997, which indicated that the SPEI and the CDWI showed an upward trend before 1997 and a downward trend after 1997. The phenomenon is due to that from 1985 to 1992, there was more rainfall in May to July in Jilin Province, and waterlogging occurred for eight consecutive years. After 1997, with climate warming, droughts were more serious, and spring drought occurred for five consecutive years in Jilin Province since 2000 [59]. Although abrupt change changes based on year for both the SPEI and the CDWI occurred in 1993, these abrupt changes were not considered to be significant. From the histogram, the values of the SPEI and CDWI differed as follows: the CDWI showed a significant upward trend in 1985, whereas the SPEI showed an insignificant upward trend. According to historical data, high intensity rainfall occurred in Midwestern Jilin Province in 1985 because of typhoons “Lee” and “Minlie.” On 10 June 1985, the rainfall in Qianguo County reached 50 mm/h and the affected area of the cultivated land was 1.5 × 10⁴ acres [60]. Typical historical waterlogging occurred in the study area in 1985 and 1986. In 2010 and 2013, the SPEI value did not reach the waterlogging status, but waterlogging occurred in the study area in these years based on the CDWI. As the data indicate, in July 2010, the south-eastern part of Midwestern Jilin province experienced a very rare rainstorm, and waterlogging disasters were affected by the northeast cold vortex and the high- and low-level jet streams. In 2013, the largest waterlogging occurred in Songhua River Basin and the disaster in Northeast China was severe, according to a report from the Jilin Provincial Department; the waterlogging disaster affected 78,000 ha of crops and caused direct economic losses of more than 47 million yuan. During the periods from tassel to milk maturity, some differences in the trends of the SPEI and the CDWI are shown. The SPEI demonstrated upward trends in 1982–1988 and 1998–2001, whereas the CDWI showed an upward trend in 1982–1992, and the SPEI and the CDWI both reached a significant growth trend in 1985. The significant difference between the two indices occurred between 2000 and 2010, and during this period Midwestern Jilin Province showed a normal state based on the SPEI, but most were in severe drought based on CDWI. According to previous studies, droughts in Jilin Province from 2000 to 2011, particularly in the western region, were serious, and the frequency of drought reached 98%. During the periods from milk maturity to mature, the trends of the SPEI and the CDWI were basically similar. There were both upward trends before 1994 and downward trends after 1994, and the downward trend reached a significant level of 95% after 2000 based on the two indices.
Although the temporal trends and abrupt year between the SPEI and CDWI are basically similar, there are still some differences during certain years at different growth stages. We screened out the differences in years of drought and waterlogging disasters that resulted in a maize yield reduction based on the CDWI and SPEI, and compared them with actual historical disaster data from “The Meteorology Disaster Almanac over China” and “China meteorological disaster collection—Jilin roll” [59,61]. The results are shown in Table 2. During periods from emergence to tasseling, serious waterlogging occurred from June to July in 1989 in most regions of the study area (such as Da’an, Shuangyang, Gongzhuling, Dunhua, and Shulan city), which were affected by a northeast vortex, cyclogenesis, and surface cold front. In June 2011, heavy rainfall events occurred repeatedly in Jilin Province, and the crops in an area of 9000 ha were seriously affected. From 24 May to 8 August of 2000, the crop growth in Jilin Province was affected by the high temperature and smaller amount of rainfall for two continuous months. In spring, summer, and autumn of 2007, droughts occurred in Jilin Province, and the affected crop area was 2.889 million ha. During spring and summer of 2009, the drought-affected crop area in Jilin Province was 2.44 million ha. During the periods from tasseling to milky maturity stage, there was no rain for 30 consecutive days in the western part of Jilin Province, including Da’an, Yushu, and Taonan City in August of 1989, and the affected area reached 270,000 ha. In 2004, the drought-affected area of crops in Jilin Province was 2.362 million ha, and the disaster area was 986,000 ha. Few droughts from summer to autumn were seen in Baicheng and Songyuan City in 2004. Concentrated periods of heavy rainfall occurred in Jilin Province from 20 July to 14 August 2000, with an average rainfall of 248.1 mm, which is 78% more than the same period of the year, breaking through the historical extreme. In 2011, droughts occurred in summer and autumn in Jilin Province, with a drought area of 252,000 ha. In 2012, Jilin Province was affected by Typhoons Dawei, Bulawan, Libra, and Sanba, with a frequent precipitation and waterlogging area of 200,000 ha. During the period from milky maturity to mature, the western part of Jilin Province, including Baicheng, Taonan City, Qianguo, and Nongan County experienced a rare autumn drought in 1997, which had not occurred since 1949. It can be seen from the above that droughts and waterlogging occurred in 2000 and 2012 in Jilin Province, respectively.

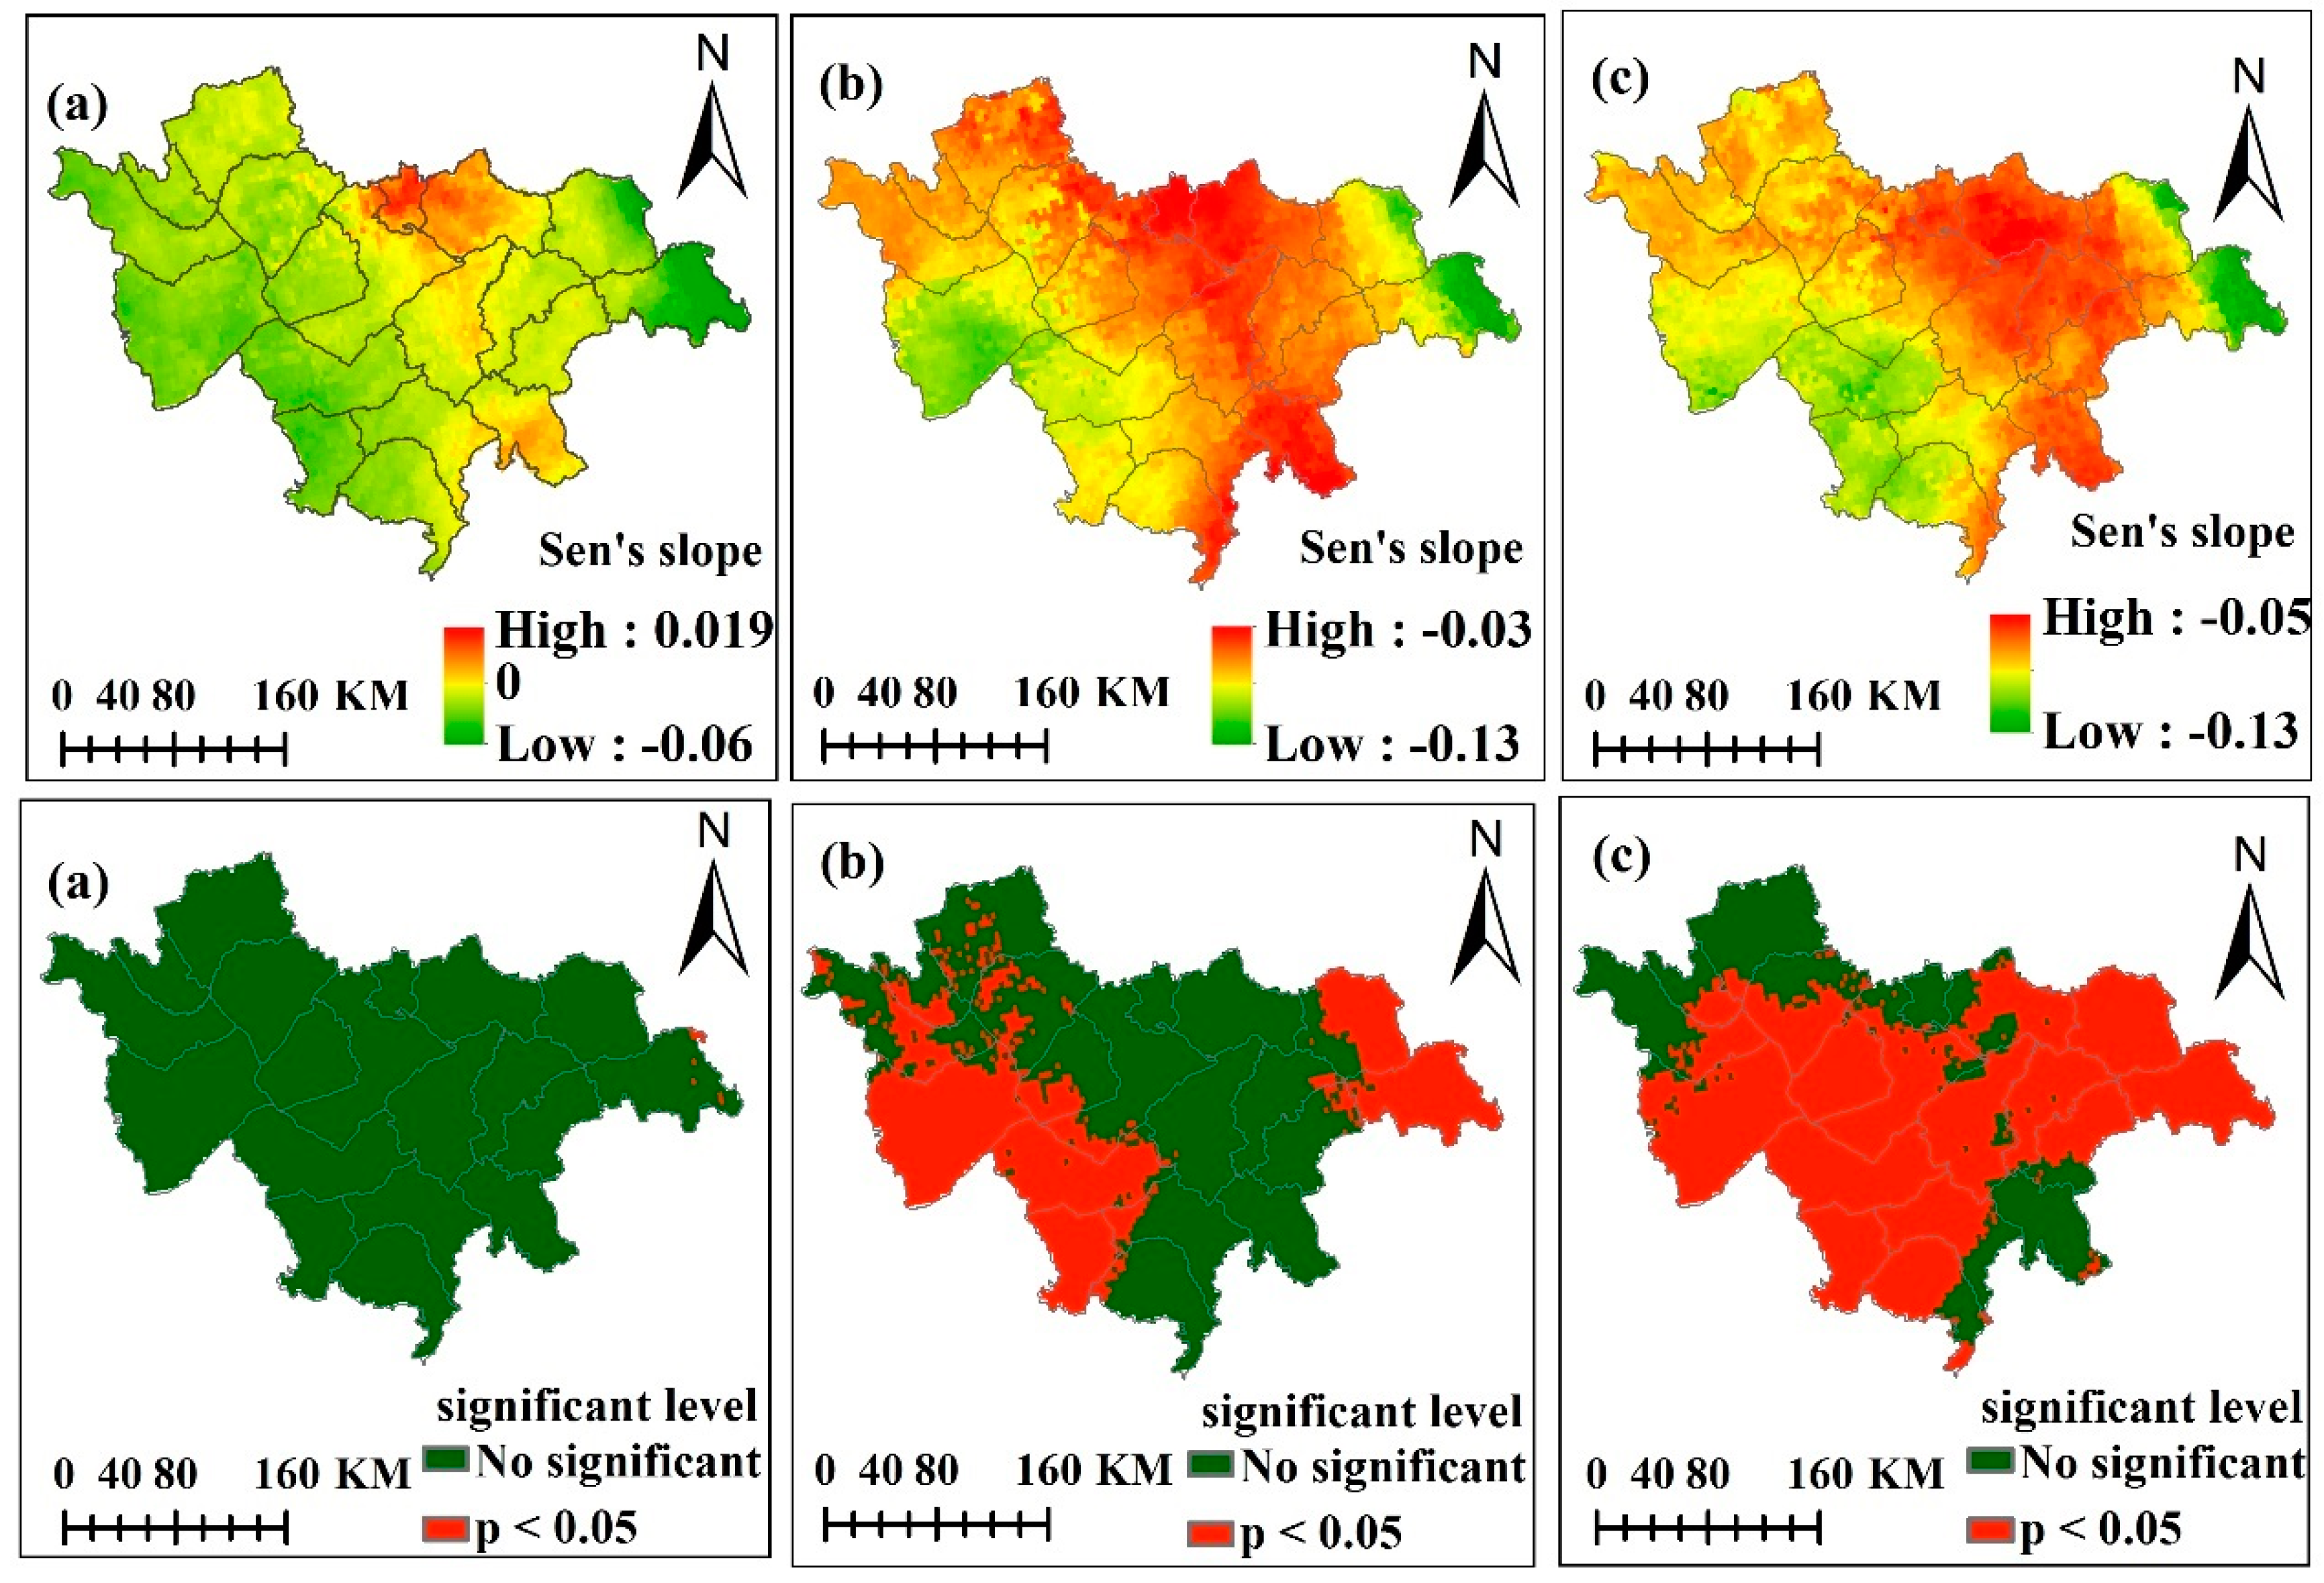
3.1.2. Comparison of Two Indices in Space

To further explore the applicability of the CDWI in Midwestern Jilin Province, we calculated the SPAEF metric components, histogram matching and correlation, between the CDWI and SPEI and the soil humidity, respectively, in each grid point, based on the SPAEF method. The results, shown in Figure 5, indicate that there was a positive correlation between the CDWI and soil humidity at the different growth stages of maize. With an increase in soil humidity, the CDWI also increased. In contrast, there was a negative correlation between the SPEI and soil humidity during the period from emergence to tasseling, which is likely caused through irrigation management. The early growth periods commonly require sufficient soil moisture to maintain seed germination. In the western part of Jilin Province, a drought in spring leads to a lack of soil water, which can influence the sprouting and seedling of crops, and therefore farmers often regard irrigation as an effective measure to deal with drought events. During the period from emergence to tasseling, the correlation coefficient, histogram matching, and SPAEF between the CDWI and soil humidity were 0.802, 0.565, and 0.503. The value of correlation coefficient, histogram matching, and SPAEF between the SPEI and soil humidity were −0.680, 0.520, and −0.768. During the period from tasseling to milky maturity, the value of correlation coefficient, histogram matching, and SPAEF between the CDWI and soil humidity were 0.754, 0.540, and 0.387, and the correlation coefficient, histogram matching, and SPAEF between the SPEI and soil humidity were 0.381, 0.425, and 0.118. During the period from milky maturity to mature, the correlation coefficient, histogram matching, and SPAEF between the CDWI and soil humidity were 0.740, 0.592, and 0.487, and the correlation coefficient, histogram matching, and SPAEF between the SPEI and soil humidity were 0.292, 0.473, and 0.117. The growth and development for maize are closely related to soil moisture, and on the whole the CDWI can better reflect the actual soil moisture than the SPEI within the study area. Combined with Figure 4, it can be seen that it is feasible in terms of change in both time and location to use the CDWI to monitor for droughts and waterlogging events for maize growth within the study area. The CDWI can be used as a comprehensive index to further study the drought and waterlogging disasters for the development of maize in Midwestern Jilin Province.

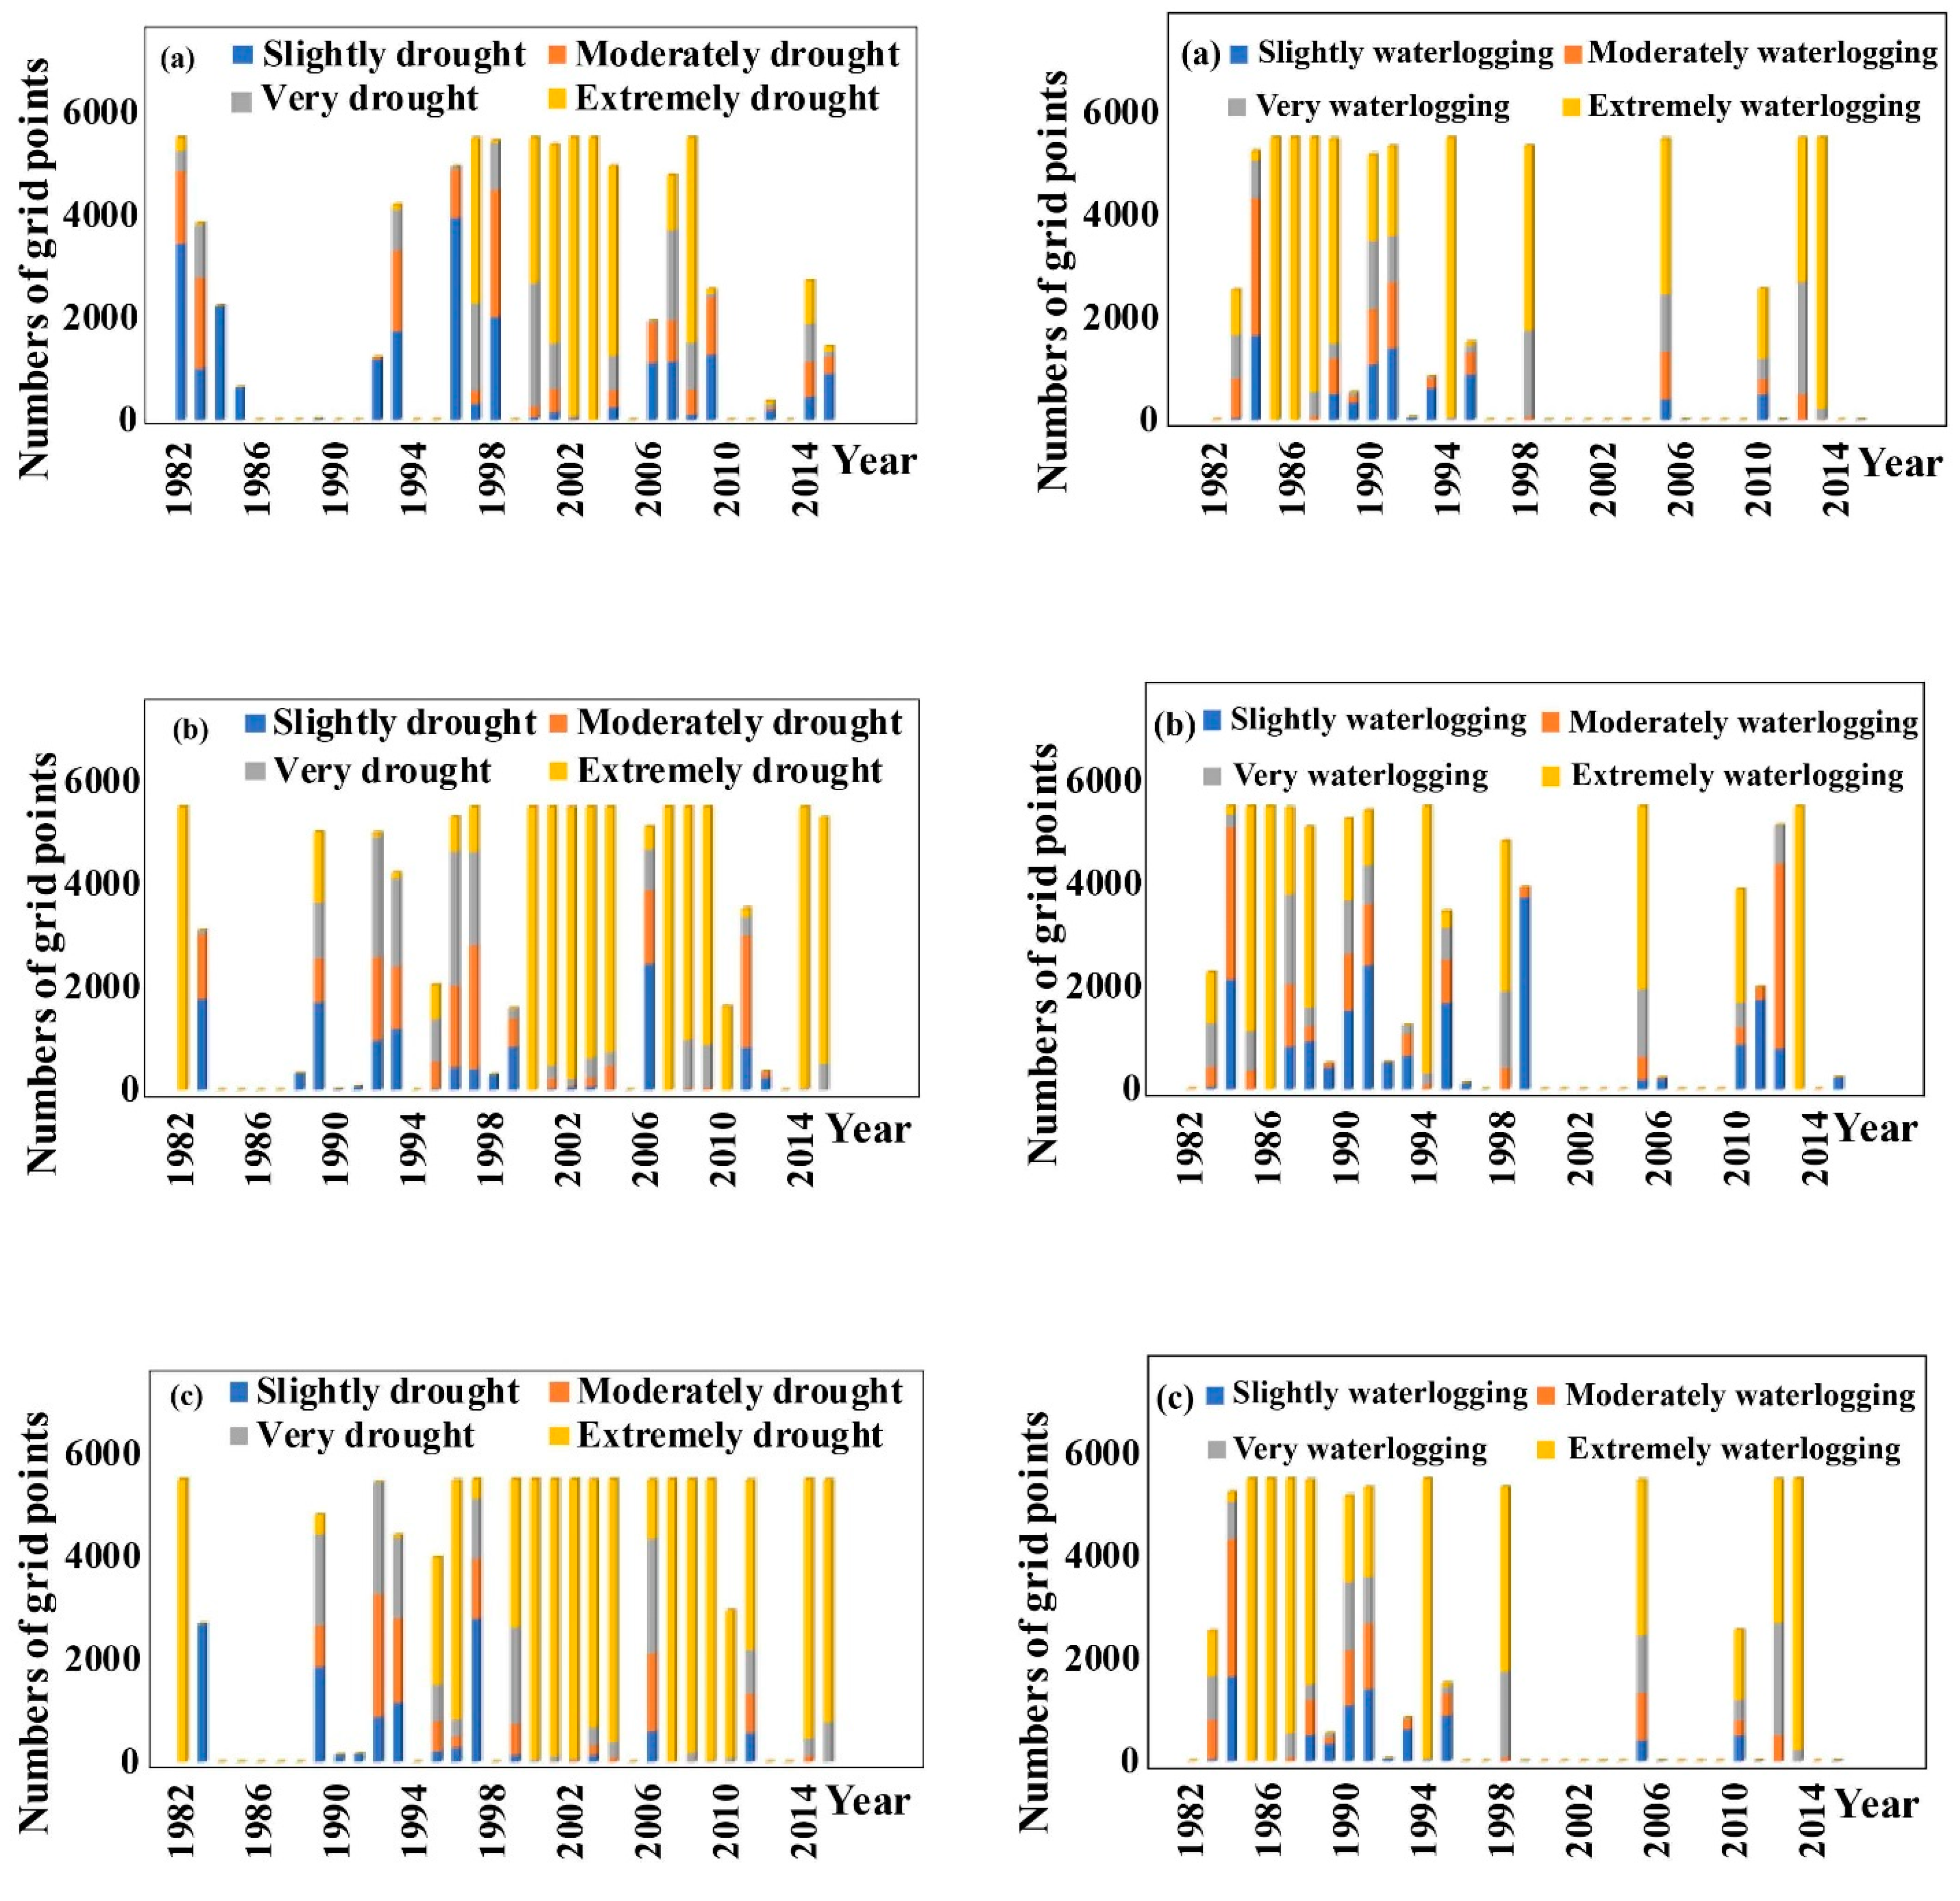
3.2. Temporal Distribution of Drought and Waterlogging for Maize Based on the CDWI

Figure 4 shows the change trends of the CDWI during different growth periods of maize in Midwestern Jilin Province from 1982 to 2015 based on the Mann–Kendall test. To analyze the change trends of each grid point in the study area over time, we calculated the slopes of the CDWI in Midwestern Jilin Province from 1982–2015 based on the Sen’s slope method, the results of which are shown in Figure 6. On the whole, the change trends of the CDWI showed a downward trend in Midwestern Jilin Province. During the periods from emergence to tasseling, the value of the Sen’s slope value ranged from −0.06/year to 0.019/year. Most regions showed a downward trend except for the growth trend in the northern central region, including Songyuan City, Fuyu County, and Changchun City in the southeast. However, change trends within the entire study area did not reach a significant level, and thus the temporal changes in drought and waterlogging from 1982 to 2015 were not obvious. During the periods from tasseling to milky maturity and the periods from milky maturity to mature, the Sen’s slope ranged from −0.13/year to −0.03/year and −0.13/year to −0.05/year, respectively. The spatial characteristics of the Sen’s slope declined both from the middle region to the east and western regions of Midwestern Jilin Province. During the periods from tasseling to milky maturity, the decreasing trends in the eastern and western regions were significant, whereas those in the central area were not significant, which indicates that the CDWI decreased significantly in the East-West side of the study area in recent 34 years. During the periods from milky maturity to mature, most regions reached a level of significant decline except for partial areas in the northwest and southeast part of Midwestern Jilin Province.
According to the drought and waterlogging classifications of the CDWI shown in Table 1, we calculated the average values of the CDWI at all grid points of the study from 1982 to 2015 and calculated the annual regional average frequency of different drought and waterlogging grades at different growth stages. The results are shown in Figure 7. During the periods from emergence to tasseling, the drought events in Midwestern Jilin Province mainly focused on the years from 1982 to 1986, 1996 to 1998, 2000 to 2004, and 2006 to 2009. Slight drought events occurred mainly before the 1900s and extreme drought events occurred mainly after the 1900s, meaning that with global warming, drought events tend to be more severe, and extreme drought events occur more frequently. At the same time, the waterlogging events were concentrated in 2010 and from 1986 to 1992. Greater than moderate waterlogging events, particularly extreme waterlogging events frequently occur, implying that extremely heavy rainfall events often occur in Midwestern Jilin Province, and the precipitation events may be more concentrated and of higher intensity. During the periods from tasseling to milky maturity in Midwestern Jilin Province, drought disasters readily occurred during the most recent 34 years except for a few sporadic years in the late 1980s. From 2000 to 2004, extreme drought events occurred for five consecutive years. Meanwhile, waterlogging events occurred mainly in the late 1980s and early 1990s. Most of the grid points have above moderate waterlogging events, and extreme waterlogging events occurred in 1986. The average rainfall reached 624 mm from June to September 1986, which is 39.2% more than that during the same period of the previous year, and 7% higher than that during 1985. That year, with the waterlogging disaster of the Taoerhe and East Liaohe Rivers, the most serious rainfall in history occurred [62]. During the periods from milky maturity to mature, waterlogging events were mainly concentrated in the mid-1980s to the early 1990s, and in 1994, 1998, 2005, 2012, and 2013. Drought events occurred in the other years in the province. In general, degrees of drought and waterlogging were both very serious in this growth period, and thus it is important to strengthen the research on the water supply and drainage for maize and carry out a drought and waterlogging disaster risk assessment in order to help the government meteorological and agricultural departments apply proper response measures.
According to the ratio between the number of drought and waterlogging events and the total number of grid points from 1982 to 2015, we determined the influence range of drought and waterlogging disasters on maize growth. The classifications of influence range of drought and waterlogging are shown in Table 3. Table 4 shows the distribution of drought and waterlogging disaster years in different growth stages of maize in Midwestern Jilin Province, where the years in bold represent years in which both drought and waterlogging events occurred in the growth stages of the year. During the periods from emergence to tasseling, drought and waterlogging disasters occurred at the same time in 1984, 1985, 1992, 1993, and 2009. Local drought and waterlogging events occurred in 1984, and global regional waterlogging events and local droughts occurred in 1985 and 1992, which indicates that a large part of the study area experienced a waterlogging disaster, and only less than 25% of the grid points suffered from drought. In 1993, the study area suffered from global regional drought and local waterlogging, which indicates that Midwestern Jilin Province in 1993 was still in a state of drought, and the number of grid points of drought and waterlogging disasters together did not exceed 25% of the total number of grid points. During the periods from tasseling to milky maturity, droughts and waterlogging events occurred simultaneously in 1983, 1993, and 1995. Global regional droughts occurred in 1983 and 1993, during which regional and local waterlogging events occurred, respectively. Global regional waterlogging events and regional drought events occurred in 1995, which indicates that waterlogging disasters occurred in most regions of the study area, and approximately half of the areas suffered from droughts at the same time. This year was a typical disaster year for droughts and waterlogging events. During the periods from milky maturity to mature, both droughts and waterlogging events occurred in 1983, 1993, and 2010. Local droughts and waterlogging events occurred simultaneously in 1983 and approximately 50% of the areas suffered from such disasters. In 1993 and 2010, local waterlogging and global and regional droughts occurred; however, the study area was mainly still in a state of drought.

3.3. Spatial Variation Characteristics of Drought and Waterlogging for Maize Based on the CDWI

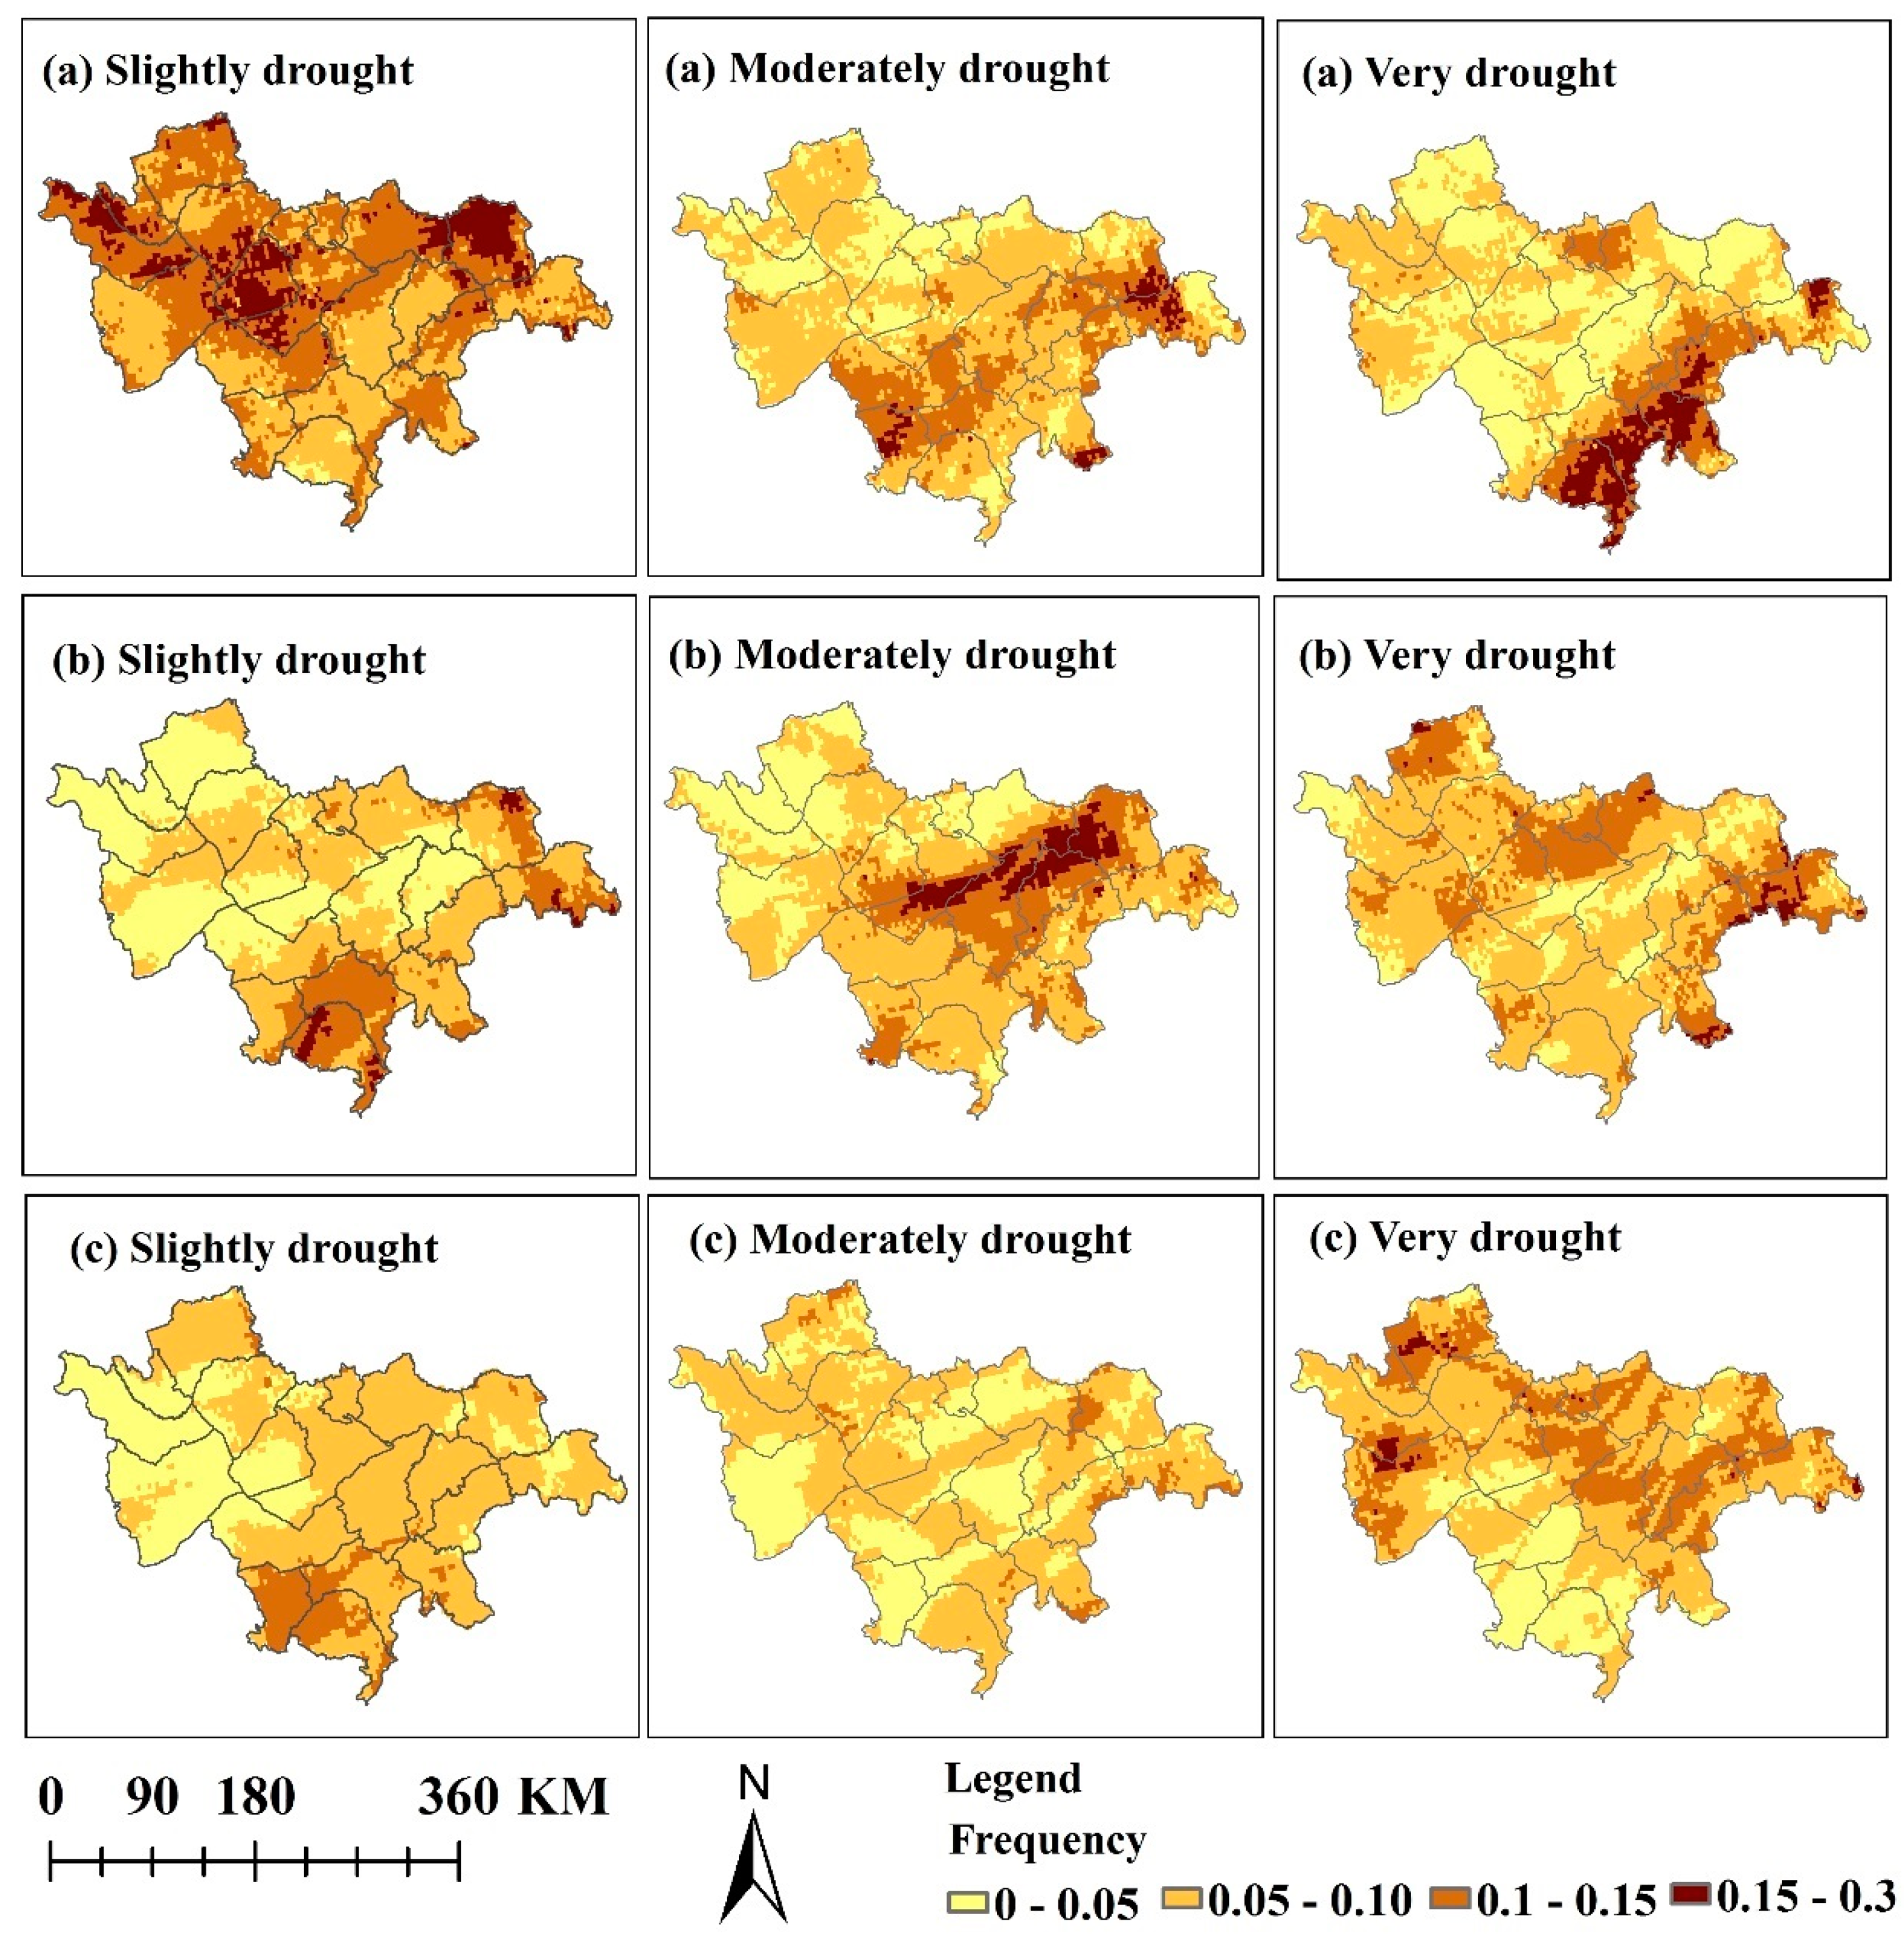
3.3.1. Spatial Variation Characteristics of Drought Frequency for Maize Based on the CDWI

According to the drought and waterlogging classifications of the CDWI shown in Table 1, we calculated the annual average values of the CDWI for each grid point from 1982 to 2015, as well as the frequency of occurrence of slight, moderate, and serious droughts in different growth stages of each grid point. The spatial distribution is based on the inverse distance weight interpolation method (IDW), the results of which are shown in Figure 8. During the periods from emergence to tasseling, the frequency of slight droughts ranged from 0.15 to 0.3, which decreased from the north to the south within the study area. High-frequency regions were mainly concentrated in the western part of the study area including Baicheng and Taonan City, the central part of the study area comprising Qian’an County and the eastern part of the study area including Yushu City. Low-frequency regions were concentrated in Lishu County, Gongzhuling, and Shuangliao City. The frequency of moderate drought events was mainly concentrated in Siping City and the western part of Shulan City, whereas the frequency of moderate drought events in other areas were relatively low. The high-frequency regions of serious drought events were mainly concentrated in the south-eastern part of the study area, including Lishu County, east of Gongzhuling, Changchun, and the northern part of Shulan City. In general, the frequency of slight drought events were higher in the central and western regions of the study area at this growth stage, and serious drought events were more likely to occur in the eastern part of the study area. During the periods from tasseling to milky maturity, the high-frequency regions of slight drought events were mainly in the corner of the southern and north-eastern areas of Midwestern Jilin Province, whereas the frequency of slight drought events was relatively lower in the western part. The high-frequency regions of moderate drought events were located in Qianguo and Fuyu Counties, whereas the other areas experienced a low frequency of moderate drought events. The serious drought events were mainly concentrated in sporadic areas of the northwest and northeast areas, and the frequency of such droughts in the south were relatively low. During the periods from milky maturity to mature, the frequency of occurrence of drought events within the entire region was significantly lower than that in the last two growth stages. The high-frequency regions of slight drought were mainly concentrated in the southern part of the study area, and showed a value of less than 0.1. The frequency of moderate drought events was low throughout the entire region, and the spatial distribution of serious drought frequency decreased from north to south. The frequency of serious drought was higher in Baicheng and Taonan City; thus, more attention should be paid toward achieving a reasonable irrigation in this area to avoid affecting the maize harvest.

3.3.2. Spatial Variation Characteristics of Waterlogging Frequency for Maize Based on the CDWI

According to the drought and waterlogging classifications of the CDWI shown in Table 1, we calculated the annual average values of the CDWI of each grid point from 1982 to 2015, and the frequency of occurrence of slight, moderate, and serious waterlogging in different growth stages of each grid point. The spatial distribution is based on the inverse distance weight interpolation method (IDW). The results are shown in Figure 9. During the periods from emergence to tasseling, high-frequency regions of slight waterlogging events were concentrated in the central and eastern areas of Midwestern Jilin Province, whereas the high-frequency regions of moderate and serious waterlogging events were located in the western areas of the study area, including Taonan and Baicheng City, which indicates that the western areas were more prone to concentrated high-intensity rainstorms. During the periods from tasseling to milky maturity, high-frequency regions of slight waterlogging were mainly concentrated in the northern and southern part of Midwestern Jilin Province, and the frequency of slight waterlogging was lower in the eastern and western areas. High-frequency regions of moderate and serious waterlogging were located in Zhenlai County and Shuangliao City. During the growth stages, there was no heavy waterlogging in the whole study area. During periods from milky maturity to mature, basically no waterlogging disaster occurred within the entire region except in Changling City and the northern part of Shulan City. Therefore, the monitoring of the water level such as Songhua, Xilin, Hulan rivers, etc., in Changling city and Shulan city should be improved during these growth stages to prevent disasters brought about by the waterlogging events.

4. Discussion

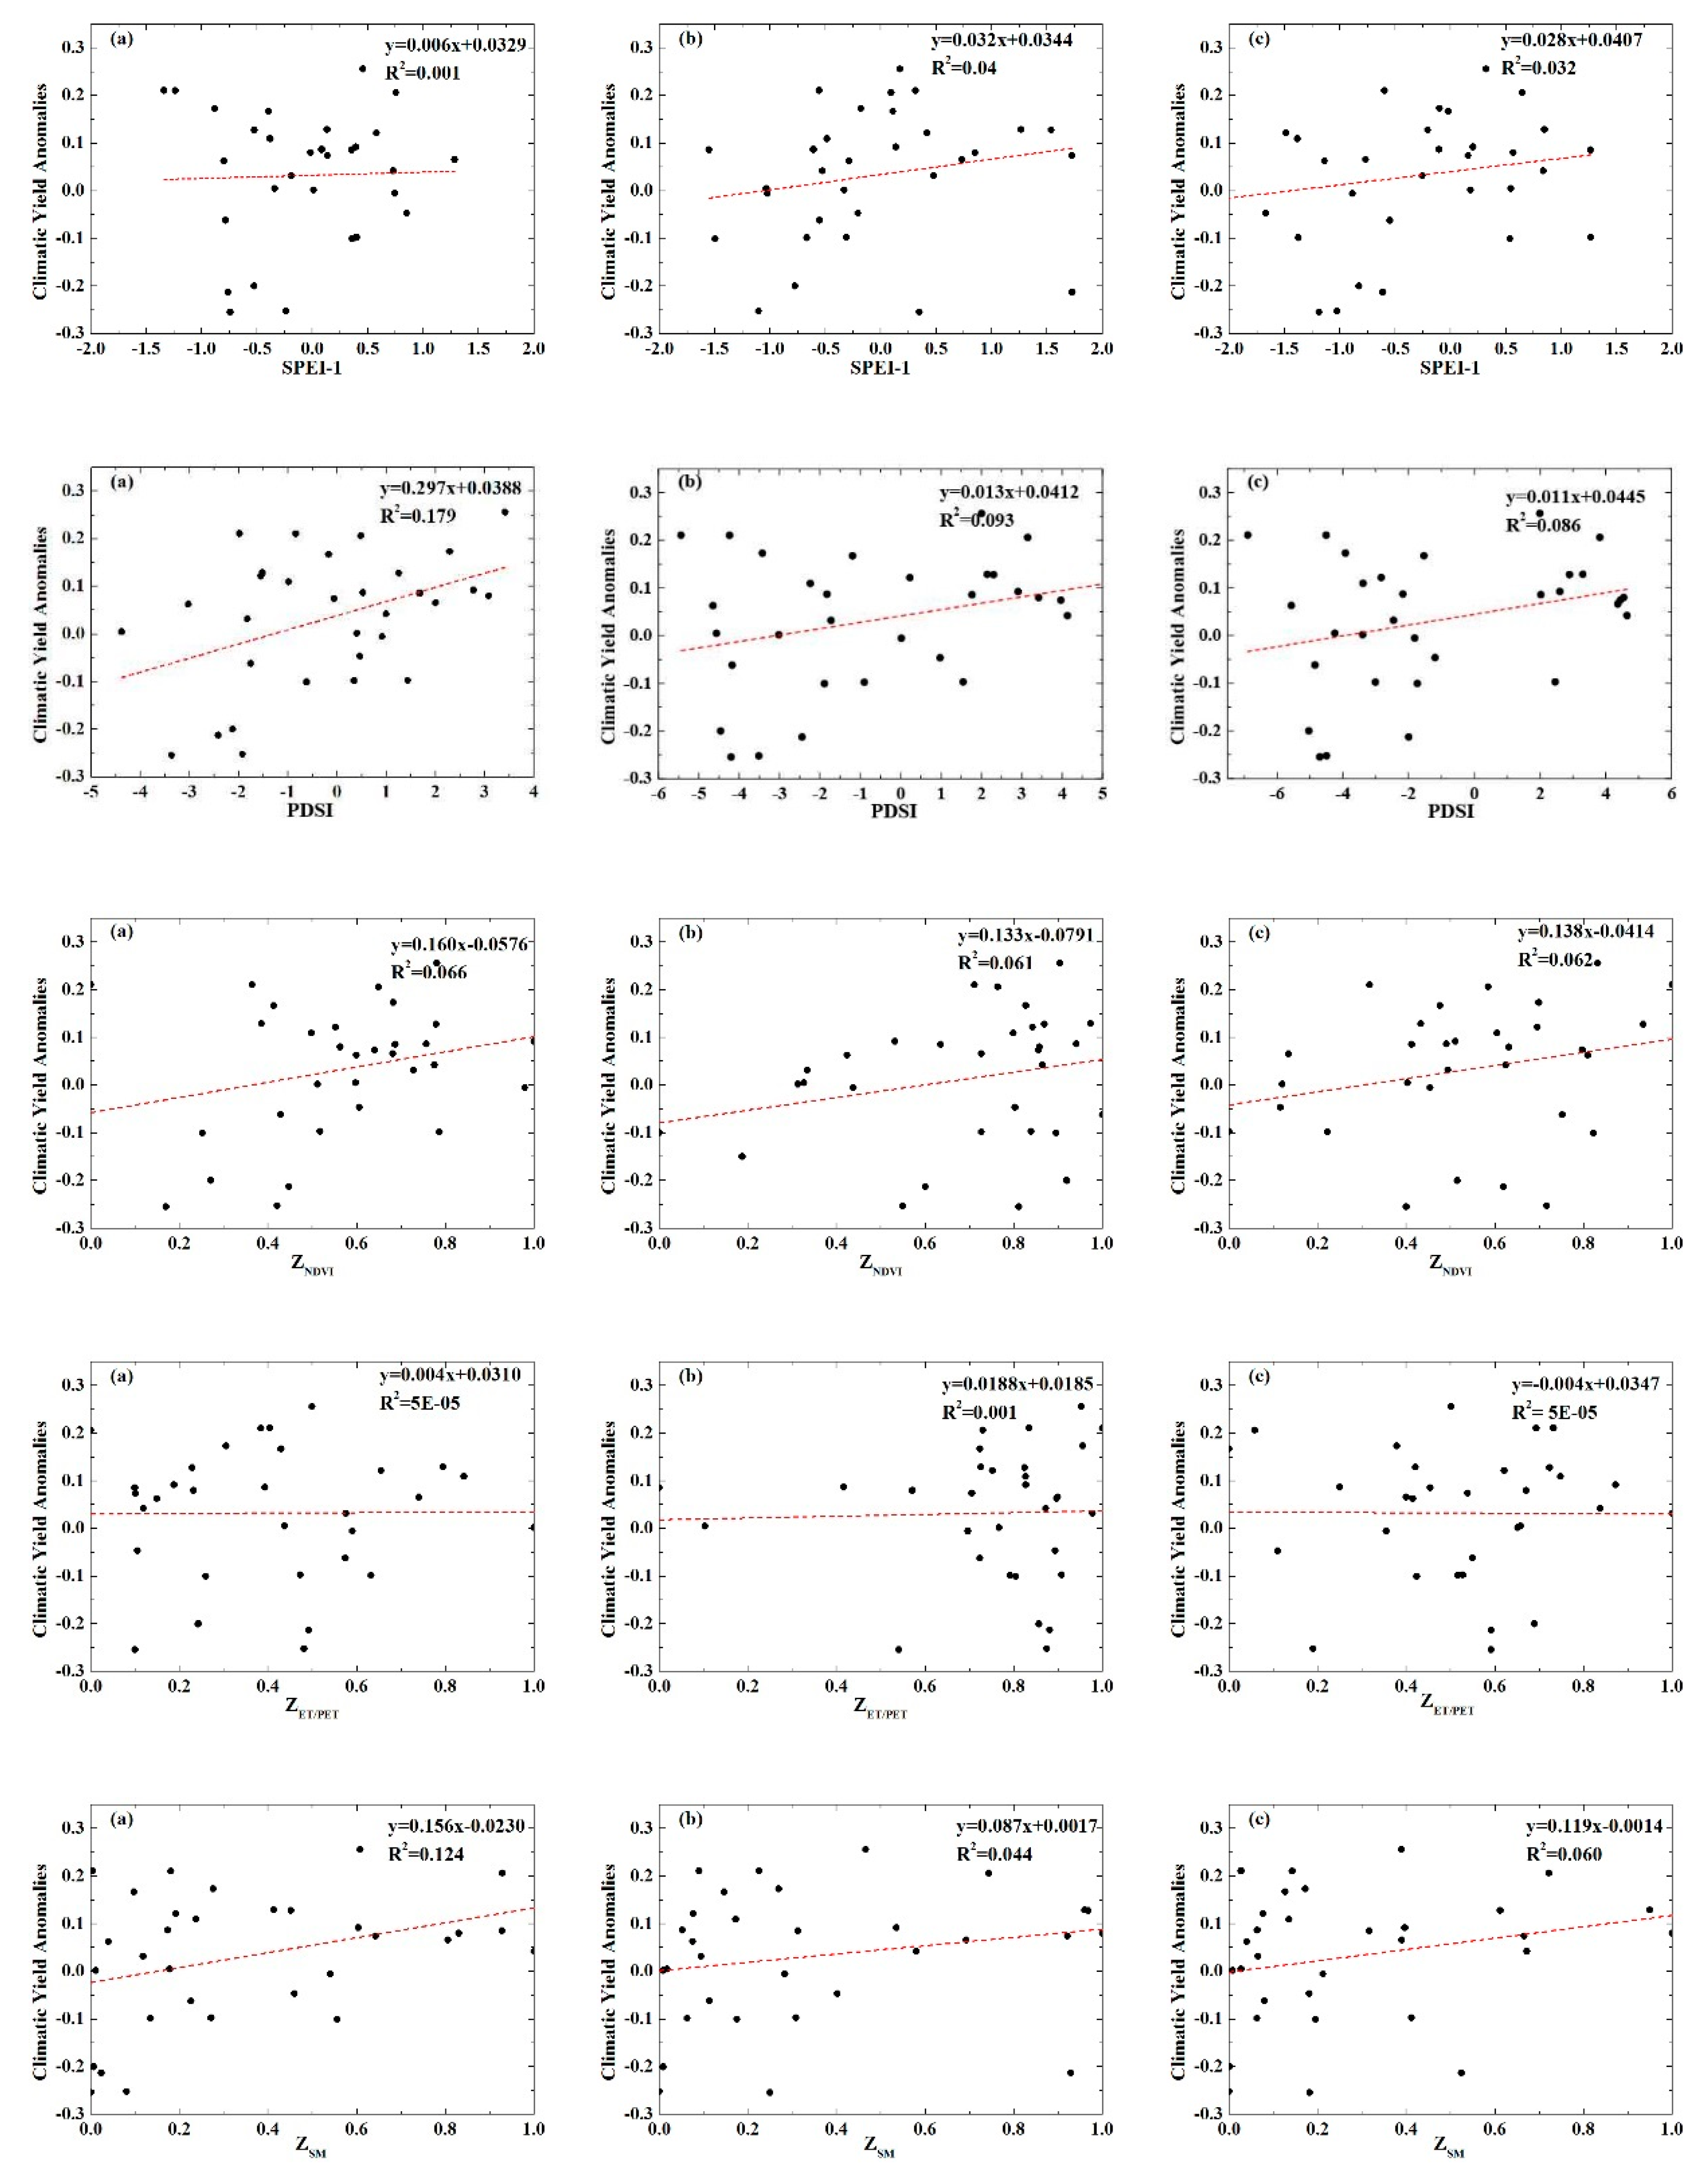
4.1. Correlation Analysis Between Each Index with Climatic Yield Anomalies for Maize

The characteristics of agricultural droughts and waterlogging events are not only related to meteorological indexes such as precipitation and temperature, but also to such factors as soil moisture, vegetation, and the sensitivity of different stages of corn to water [63]. Therefore, to obtain a more accurate estimation of the yield loss, we need to consider the distribution characteristics of drought and waterlogging based on the continuum system of the atmosphere, soil, and crops.
Spearman’s rank correlation coefficient is a nonparametric rank statistic proposed by Charles Spearman as a measure of the strength of an association between two variables. Unlike Pearson’s correlation coefficient, it does not require the assumption that the relationship between the variables is linear, nor does it require the variables to be measured on interval scales. It can be used for variables measured at the ordinal level, which has a wider scope than Person’s correlation [64]. As the data distributions were usually abnormal, the Spearman’s rank correlation was chosen instead of a Pearson’s correlation analysis to calculate the correlation coefficients between the maize climatic yield anomalies and five indices. Drought and waterlogging anomalies were obtained based on the regional average SPEI-1, PDSI, ZNDVI, ZET/PET, and ZSM values from 1985 to 2015 during agricultural drought and waterlogging events (three phases of onset and development for maize). The final correlations are shown in Table 5 and Figure 10. The results show that PDSI is closely related to maize climatic yield anomalies. The Spearman’s rank correlation coefficients during three phases of maize growth are 0.423, 0.306, and 0.294 (one superscript asterisk indicates p < 0.05), respectively. The average correlation coefficient is 0.341. This finding suggests that meteorological indicators of drought and waterlogging in the study area explain approximately 34% of maize yield anomalies. Previous studies have shown that precipitation variability explains approximately 35%–50% of crop yield variability, which is consistent with our findings [63,65]. The results show that there is a weak relationship between SPEI-1 and maize yield because the values of SPEI are calculated based only on the precipitation and temperature data.
A large number of studies have shown that not only meteorological factors but also the crop itself should be taken into account in studies on agricultural drought and waterlogging [22,66]. To calculate the correlation relationship with maize yield anomalies, ZNDVI and ZET/PET were chosen. Interestingly, there was no significant correlation between ZET/PET and maize yield anomalies, which may be affected by crop irrigation effects. The value of ZNDVI is closely related to maize yield anomalies, which indicates that the wilting of plant leaves and physiological effects have more direct effects on maize yield, which is consistent with the findings by Zhang et al. (2017) [63]. The ZSM value showed more significant correlations with the maize yield anomalies in all regions with Spearman’s rank correlation coefficients of 0.352, 0.281, and 0.245, respectively. Soil water in the root zone is directly affected by precipitation, and different soil properties have different storage/water supply capacities, which will also indirectly affect the maize yield. Based on the above research, PDSI, ZNDVI, and ZSM were chosen to construct a comprehensive drought and waterlogging index (CDWI) for maize. However, it should be noted that the CDWI and other indexes are only indicators based on the relationship between crop yield loss, rather than crop models. There are many factors that affect the final yield for maize, including the maize variety, fertilization amount, soil characteristics, environmental parameters, and maize management decisions.

4.2. Relationship Between Precipitation Concentration Index (CI) and the Two Indices (SPEI and CDWI)

Droughts and waterlogging events are closely related to precipitation. The occurrence of heavy rainfall for consecutive several days will cause the waterlogging disaster. Since the 21st century, some scholars have shown the high percentages of annual total precipitation were concentrated mainly on a limited number of very rainy days, as result of the heightening of the global water cycle and rainfall intensity [67,68]. This phenomenon will cause extreme droughts and waterlogging events. The precipitation concentration index (CI) can analyze the contribution of the days of greatest rainfall to the total amount and the weight of the daily precipitation events [69]. Thus, to explore the relationship between drought and waterlogging index and precipitation, we calculated correlation coefficients between the CI and the CDWI and SPEI based on the Spearman‘s rank correlation (Table 6). The calculation process of the CI value was described in detail in our published paper [70]. The results shown that the SPEI and CDWI were both positively correlated with the precipitation concentration index. That is, the more concentrated the precipitation, waterlogging events were more likely to occur. Royé and Martin (2017) showed that extreme rainfall events at a daily scale are characterized by durations limited to a small number of days [71]. It is similar to our results. In addition, Table 6 showed that the correlation coefficients between the CI and CDWI reached 95% significant positive correlation in each growth stage of maize, that means the CDWI can reflect the precipitation situation in the study area well.

4.3. Comparison with Other Studies

Reviewing the previous studies, scholars have indicated that the goals of an agricultural drought and waterlogging assessment including their impact can be effectively achieved through the use of comprehensive indicators combining multisource data and multiple sensors [72,73,74]. Meteorologists indicated that drought indices integrate large amounts of data, such as precipitation, snowpack, streamflow, and other water supply indicators, to monitor drought severity in a comprehensive framework and to measure how much the climate in a given period has deviated from historically established normal conditions [75]. Zhang et al. (2016) constructed the drought severity index (DSI) from NDVI and ET/PET as a remotely sensed drought indicator, integrating both vegetation conditions and evapotranspiration information of wheat [76]. Esfahanian et al. (2017) used 13 commonly applied drought indices to develop a comprehensive drought index (MASH) based on the meteorological, hydrological, and agricultural categories [66]. Liu et al. (2018) conducted statistical assessments to compare the strengths of different drought indices, including PDSI, SPI, and SPEI, for agricultural droughts in the North China Plain, and suggested that multiple indices are needed to assess and monitor the occurrence of agricultural droughts [77].
Considering the above indicators and suggestions, the CDWI has the following significant characteristics. The CDWI was designed as a comprehensive model of agricultural drought and waterlogging. It is not only described using three indices from the continuum system of the atmosphere, soil, and plants, but also shows the interactions of these indices with three key maize growth stages. In contrast to the SPEI, the CDWI is highly suitable for monitoring the drought and waterlogging characteristics for maize, although there are still some key limitations to its use. Drought is usually a slow and persistent phenomenon, but waterlogging is typically caused by short and intense rainfall. The CDWI may not be able to fully depict the development of waterlogging owing to a lack of high-temporal resolution input data. Thus, the CDWI is potentially more suitable for medium- and long-term agricultural droughts and waterlogging events. Therefore, the CDWI is not meant to replace the currently available indicators. Rather, it should be used alongside other drought and waterlogging indicators to make up for shortcomings.

5. Conclusions

In this paper, according to the continuum system of the atmosphere, crops, and soil conditions, a multisource data-collaborated CDWI was proposed as a new agricultural drought and waterlogging monitoring approach. First, this index improves the current monitoring and evaluation of agricultural drought and waterlogging by applying a single index. Then, the CDWI was compared with the SPEI to verify its applicability. Finally, the temporal and spatial changes of drought and waterlogging events at different growth stages of maize in Midwestern Jilin Province were analyzed, and the following conclusions were obtained:
(1) Compared with the SPEI, by considering the soil moisture and vegetation growth, the CDWI can better reflect the actual drought and waterlogging situation for maize growth.
(2) During the maize growth stages, the CDWI value shows a decreasing trend in terms of time and location, that is, a drought disaster is more serious than a waterlogging disaster, and the entire study area showed a relatively higher number of droughts.
(3) Based on the different levels of drought and waterlogging, the frequencies of slight drought and waterlogging in the Midwest Jilin Province were higher. The frequency of serious drought was higher in the south-east part of the study area, such as Changchun, Lishu, and Gongzhuling City, and the frequency of serious waterlogging was higher in the north-western and central areas, such as Baicheng, Taonan, and Changling City.

Author Contributions

Original idea and the study conception, R.W. and E.G.; methodology design; E.G.; data collection and preprocessing, C.W., and J.Z.; Funding acquisition, J.Z.; manuscript draft, R.W. All authors have read and agreed to the published version of the manuscript.

Funding

This research is supported by the Supported by the National Science Foundation of China (41571491, 41371495 and 41807507); The China Special Fund for Meteorological Research in the Public Interest (No. GYHY201506001-6); The National Key Technology R&D Program of China under Grant (2013BAK05B01); The Fundamental Research Funds for the Central Universities of China (2412016KJ046).

Acknowledgments

The authors are thanks to the pseudonymous reviewers for their useful suggestions.

Conflicts of Interest

The authors declare no conflict of benefit.

References

  1. Alexander, D. Natural Disasters; CRC Press: Boca Raton, FL, USA, 2017; pp. 120–213. [Google Scholar]
  2. Wang, S.; Huo, Z.; Guo, J.; Wang, C. Agrometeorological Disaster Risk Management in China of the chapter XIV. In Natural Disasters and Extreme Events in Agriculture; Springer: Berlin/Heidelberg, Germany, 2005; pp. 241–258. [Google Scholar]
  3. Ding, Y.H. The Variability of the Asian Summer Monsoon. J. Meteorol. Soc. Jpn. 2007, 85, 21–54. [Google Scholar] [CrossRef] [Green Version]
  4. Ding, Y.H.; Chan, C.L. The East Asian summer monsoon: An overview. Meteorol. Atmos. Phys. 2005, 89, 117–142. [Google Scholar]
  5. Ding, Y.H.; Wang, Z.Y.; Sun, Y. Inter-decadal variation of the summer precipitation in East China and its association with decreasing Asian summer monsoon. Part I: Observed evidences. Int. J. Climatol. 2008, 28, 1139–1161. [Google Scholar] [CrossRef]
  6. Wang, H.J. The Weakening of the Asian Monsoon Circulation after the End of 1970’s. Adv. Atmos. Sci. 2001, 18, 376–386. [Google Scholar]
  7. Zhai, J.Q.; Su, B.; Krysanova, V.; Vetter, T.; Chao, G.; Tong, J. Spatial variation and trends in PDSI and SPI indices and their relation to streamflow in 10 large regions of China. J. Clim. 2010, 3, 649–663. [Google Scholar] [CrossRef]
  8. Liang, L.; Zhao, S.H.; Qin, Z.H.; He, K.X.; Luo, Y.X.; Zhou, X. Drought Change Trend Using MODIS TVDI and Its Relationship with Climate Factors in China from 2001 to 2010. J. Integr. Agric. 2014, 7, 1501–1508. [Google Scholar] [CrossRef]
  9. Chen, H.; Sun, J. Anthropogenic warming has caused hot droughts more frequently in China. J. Hydrol. 2017, 544, 306–318. [Google Scholar] [CrossRef]
  10. Trenberth, K.E. Observations: Surface and atmospheric climate change. In Climate Change 2007: The Physical Science Basis; Contribution of WGI to IPCC AR4; Solomon, S., Ed.; IPCC: Geneva, Switzerland, 2007; pp. 235–336. [Google Scholar]
  11. Gao, Q.H.; Ma, Z.J. Comprehensive Research Pregress on Natural Disasters in China; Meteorological Press of China: Beijing, China, 2009; pp. 33–54. (In Chinese) [Google Scholar]
  12. Liu, Y.; You, M.; Zhu, J.; Wang, F.; Ran, R. Integrated risk assessment for agricultural drought and flood disasters based on entropy information diffusion theory in the middle and lower reaches of the Yangtze River, China. Int. J. Disaster Risk Reduct. 2019, 38, 101194. [Google Scholar] [CrossRef]
  13. Singh, V.P.; Mishra, A.K. A review of drought concepts. J. Hydrol. 2010, 391, 202–216. [Google Scholar]
  14. Cammalleri, C.; Micale, F.; Vogt, J. A novel soil moisture-based drought severity index (DSI) combining water deficit magnitude and frequency. Hydrol. Process. 2016, 30, 289–301. [Google Scholar] [CrossRef] [Green Version]
  15. Waseem, M.; Ajmal, M.; Kim, T.W. Development of a new composite drought index for multivariate drought assessment. J. Hydrol. 2015, 527, 30–37. [Google Scholar] [CrossRef]
  16. McKee, T.B.; Doesken, N.J.; Kleist, J. The relationship of drought frequency and duration to time scales. In Proceedings of the Eighth Conference on Applied Climatology, American Meteorological Society, Boston, MA, USA, 17–22 January 1993; pp. 179–184. [Google Scholar]
  17. Wang, S.; Mo, X.; Liu, S.; Lin, Z.; Hu, S. Validation and trend analysis of ECV soil moisture data on cropland in North China Plain during 1981–2010. Int. J. Appl. Earth Obs. 2016, 48, 110–121. [Google Scholar] [CrossRef]
  18. McCabe, M.F.; Van Dijk, A.I.J.M.; De Jeu, R.A.M.; Wagner, W.; Liu, Y.Y.; Parinussa, R.M.; Dorigo, W.A.; Evans, J.P. Trend-preserving blending of passive and active microwave soil moisture retrievals. Remote Sens. Environ. 2012, 123, 280–297. [Google Scholar]
  19. Zhenghu, Z.; Chuankuan, W.; Yiqi, L. Response of soil microbial communities to altered precipitation: A global synthesis. Glob. Ecol. Biogeogr. 2018, 27, 1121–1136. [Google Scholar]
  20. Gregoire, J.; Flasse, S.; Ceccato, P. Designing a spectral index to estimate vegetation water content from remote sensing data. Remote Sens. Environ. 2002, 82, 198–207. [Google Scholar]
  21. Bajgain, R.; Xiao, X.; Wagle, P.; Basara, J.; Zhou, Y. Sensitivity analysis of vegetation indices to drought over two tallgrass prairie sites. ISPRS J. Photogramm. 2015, 108, 151–160. [Google Scholar] [CrossRef]
  22. Bajgain, R.; Xiao, X.; Basara, J.; Wagle, P.; Zhou, Y.; Zhang, Y.; Mahan, H. Assessing agricultural drought in summer over Oklahoma Mesonet sites using the water-related vegetation index from MODIS. Int. J. Biometeorol. 2017, 61, 377–390. [Google Scholar] [CrossRef] [Green Version]
  23. Hao, Z.C.; Aghakouchak, A. A Nonparametric Multivariate Multi-Index Drought Monitoring Framework. J. Hydrometeorol. 2014, 15, 89–101. [Google Scholar] [CrossRef]
  24. Hao, C.; Zhang, J.; Yao, F. Combination of multi-sensor remote sensing data for drought monitoring over Southwest China. Int. J. Appl. Earth Obs. 2015, 35, 270–283. [Google Scholar] [CrossRef]
  25. Gonzalez-Zamora, A.; Pablos, M.; Sanchez, N.; Martinez-Fernandez, J.; Piles, M. Integrated remote sensing approach to global agricultural drought monitoring. Agric. Forest Meteorol. 2018, 259, 141–153. [Google Scholar]
  26. Beguería, S.; Vicente-Serrano, S.M.; Angulo-Martínez, M. A multiscalar global drought dataset: The SPEI base A New Gridded Product for the Analysis of Drought Variability and Impacts. Bull. Am. Meteorol. Soc. 2010, 91, 1351–1356. [Google Scholar] [CrossRef] [Green Version]
  27. Rhee, J.; Im, J.; Carbone, G.J. Monitoring agricultural drought for arid and humid regions using multi-sensor remote sensing data. Remote Sens. Environ. 2010, 114, 2875–2887. [Google Scholar] [CrossRef]
  28. Xiang, Z.; Hong, W.; Shunlin, L.; Tao, Z.; Bin, H.; Bijian, T.; Donghai, W. Responses of Natural Vegetation to Different Stages of Extreme Drought during 2009–2010 in Southwestern China. Remote Sens. 2015, 7, 14039–14054. [Google Scholar]
  29. Labudová, L.; Labuda, M.; Takáč, J. Comparison of SPI and SPEI applicability for drought impact assessment on crop production in the Danubian Lowland and the East Slovakian Lowland. Theor. Appl. Climatol. 2017, 128, 491–506. [Google Scholar] [CrossRef]
  30. Sergio, V.S.; Daniel, C.; Miquel, T.; Natalia, M.; Santiago, B.; Cesar, A.; Ahmed, K. Drought Variability and Land Degradation in Semiarid Regions: Assessment Using Remote Sensing Data and Drought Indices (1982–2011). Remote Sens. 2015, 7, 4391–4423. [Google Scholar]
  31. Wang, G.; Gong, T.; Lu, J.; Lou, D.; Hagan, D.F.T.; Chen, T. On the long-term changes of drought over China (1948–2012) from different methods of potential evapotranspiration estimations. Int. J. Climatol. 2018, 38, 2954–2966. [Google Scholar] [CrossRef]
  32. Ficklin, D.L.; Abatzoglou, J.T.; Novick, K.A. A New Perspective on Terrestrial Hydrologic Intensity That Incorporates Atmospheric Water Demand. Geophys. Res. Lett. 2019, 46, 8114–8124. [Google Scholar] [CrossRef]
  33. Rajsekhar, D.; Singh, V.P.; Mishra, A.K. Multivariate drought index: An information theory based approach for integrated drought assessment. J. Hydrol. 2015, 526, 164–182. [Google Scholar] [CrossRef]
  34. Li, Y.; Chang, J.; Yuan, M.; Wang, Y. Copula-based drought risk assessment combined with an integrated index in the Wei River Basin, China. J. Hydrol. 2016, 540, 824–834. [Google Scholar]
  35. Chang, J.; Wang, Y.; Istanbulluoglu, E.; Bai, T.; Huang, Q.; Yang, D.; Huang, S. Impact of climate change and human activities on runoff in the Weihe River Basin, China. Quat. Int. 2015, 380, 169–179. [Google Scholar] [CrossRef]
  36. Huang, S.; Chang, J.; Huang, Q.; Chen, Y. Spatio-temporal changes and frequency analysis of drought in the wei river basin, China. Water Resour. Manag. 2014, 10, 3095–3110. [Google Scholar] [CrossRef]
  37. Andreia, F.; Russo, A.; Gouveia, C.; Páscoa, P. Modelling drought-related yield losses in Iberia using remote sensing and multiscalar indices. Theor. Appl. Climatol. 2019, 136, 203–220. [Google Scholar]
  38. Yang, J.; Wang, Y.; Hu, H.; Huang, Q.; Chang, J.; Li, Y.; Yao, J.; Chen, Y. Comprehensive drought characteristics analysis based on a nonlinear multivariate drought index. J. Hydrol. 2018, 557, 651–667. [Google Scholar] [CrossRef]
  39. Svoboda, M.; Doug, L.; Hayes, M.; Richard, H.; Karin, G.; Angel, J.; Rippey, B.; Tinker, R.; Palecki, M.; Stooksbury, D. The Drought Monitor. Bull. Am. Meteorol. Soc. 2002, 83, 1181–1190. [Google Scholar] [CrossRef] [Green Version]
  40. WMO. Drought Monitoring and Early Warning: Concepts, Progress and Future Challenges; Report WMO; No. 100692-63-11006-9; World Meteorological Organization: Geneva, Switzerland, 2006; p. 24. [Google Scholar]
  41. Dai, A. Drought under global warming: A review. Wiley Interdiscip. Rev. Clim. Chang. 2011, 1, 45–65. [Google Scholar] [CrossRef] [Green Version]
  42. Zhang, A.; Jia, G. Monitoring meteorological drought in semiarid regions using multi-sensor microwave remote sensing data. Remote Sens. Environ. 2013, 134, 12–23. [Google Scholar] [CrossRef]
  43. Wang, H. A Study on the Drought Situation in Jilin Province Based on MODIS Data; Southwest University: Chongqing, China, 2013. (In Chinese) [Google Scholar]
  44. Wang, B. Jilin: The world pearl of the golden corn belt. J. Heilongjiang Grain 2014, 8, 35–36. (In Chinese) [Google Scholar]
  45. Deng, R.X.; Li, Y.; Zhang, S.W.; Shi, X.L.; Wang, W.J. Change Analysis of Shelterbelt Landscape in Midwestern Jilin Province; IEEE: Piscataway, NJ, USA, 2010; Volume 1, pp. 128–131. [Google Scholar]
  46. Wang, R.; Zhang, J.; Guo, E.; Li, D.; Ha, S.; Alu, S. Spatiotemporal characteristics of drought and waterlogging during maize growing season in midwestern Jilin province for recent 55 years. J. Nat. Disasters 2018, 27, 186–197. (In Chinese) [Google Scholar]
  47. Abatzoglou, J.T.; Dobrowski, S.Z.; Parks, S.A.; Hegewisch, K.C. TerraClimate, a high-resolution global dataset of monthly climate and climatic water balance from 1958–2015. Sci. Data 2018, 5, 170191. [Google Scholar] [CrossRef] [Green Version]
  48. Jorge, P.; Compton, T. A Non-Stationary 1981–2012 AVHRR NDVI3g Time Series. Remote Sens. 2014, 6, 6929–6960. [Google Scholar]
  49. Wang, S.; Mo, X.; Liu, Z.; Baig, M.H.A.; Chi, W. Understanding long-term (1982–2013) patterns and trends in winter wheat spring green-up date over the North China Plain. Int. J. Appl. Earth Obs. 2017, 57, 235–244. [Google Scholar] [CrossRef]
  50. Liu, H.; Gao, Y.; Sun, J.; Wu, X.; Jha, S.K.; Zhang, H.; Gong, X.; Li, Y. Responses of yield, water use efficiency and quality of short-season cotton to irrigation management: Interactive effects of irrigation methods and deficit irrigation. Irrig. Sci. 2017, 35, 125–139. [Google Scholar] [CrossRef]
  51. Vicente-Serrano, S.M.; Beguería, S.; López-Moreno, J.I. A Multiscalar Drought Index Sensitive to Global Warming: The Standardized Precipitation Evapotranspiration Index. J. Clim. 2010, 23, 1696–1718. [Google Scholar] [CrossRef] [Green Version]
  52. Shi, W.J.; Tao, F.L. Spatio-temporal distributions of climate disasters and the response of wheat yields in China from 1983 to 2008. Nat. Hazards 2014, 74, 569–583. [Google Scholar] [CrossRef]
  53. JQ, Z. Risk assessment of drought disaster in the maize-growing region of Songliao Plain, China. Agric. Ecosyst. Environ. 2004, 102, 133–153. [Google Scholar]
  54. Sen, P.K. Estimates of the Regression Coefficient Based on Kendall’s Tau. J. Am. Stat. Assoc. 1968, 63, 1379–1389. [Google Scholar] [CrossRef]
  55. Prabhakar, A.K.; Singh, K.K.; Lohani, A.K. Regional level long-term rainfall variability assessment using Mann-Kendall test over the Odisha state of India. J. Agrometeorol. 2018, 20, 164–165. [Google Scholar]
  56. Demirel, M.C.; Koch, J.; Stisen, S.; Samaniego, L.; Mendiguren, G.; Mai, J. Combining satellite data and appropriate objective functions for improved spatial pattern performance of a distributed hydrologic model. Hydrol. Earth Syst. Sci. 2018, 22, 1299–1315. [Google Scholar] [CrossRef] [Green Version]
  57. Vatansever, K.; Akgűl, Y. Performance evaluation of websites using entropy and grey relational analysis methods: The case of airline companies. Decis. Sci. Lett. 2018, 2, 119–130. [Google Scholar] [CrossRef]
  58. Li, J. Weight Determining of Factors Influencing Grain Output Based on Entropy Weight Method. Asian Agric. Res. 2012, 4, 7–9. [Google Scholar]
  59. Wen, K.G. China Meteorological Disaster Collection-Jilin Roll; Meteorological Press in China: Beijing, China, 2008. (In Chinese) [Google Scholar]
  60. Bureau, S.S. China Statistical Yearbook; China Statistics Press: Beijing, China, 2015. (In Chinese) [Google Scholar]
  61. Administration, C.M. The Meteorology Disaster Almanac over China; China Meteorological Press: Beijing, China, 2001–2015. (In Chinese) [Google Scholar]
  62. Water Resources Department of Jilin Province. Flood and Drought Disaster in Jilin Province; Jilin Science and Technology Press: Changchun, China, 1996. (In Chinese) [Google Scholar]
  63. Zhang, X.; Chen, N.; Li, J.; Chen, Z.; Niyogi, D. Multi-sensor integrated framework and index for agricultural drought monitoring. Remote Sens. Environ. 2017, 188, 141–163. [Google Scholar] [CrossRef] [Green Version]
  64. Hauke, J.; Kossowski, T. Comparison of values of Pearson’s and Spearman’s correlation coefficients on the same sets of data. Quaest. Geogr. 2011, 2, 87–93. [Google Scholar] [CrossRef] [Green Version]
  65. Ray, D.K.; Gerber, J.S.; MacDonald, G.K.; West, P.C. Climate variation explains a third of global crop yield variability. Nat. Commun. 2015, 6, 5989. [Google Scholar] [CrossRef] [PubMed] [Green Version]
  66. Esfahanian, E.; Nejadhashemi, A.P.; Abouali, M.; Adhikari, U.; Zhang, Z.; Daneshvar, F.; Herman, M.R. Development and evaluation of a comprehensive drought index. J. Environ. Manag. 2017, 185, 31–43. [Google Scholar] [CrossRef] [PubMed] [Green Version]
  67. Singh, D.; Tsiang, M.; Rajaratnam, B.; Diffenbaugh, N.S. Precipitation extremes over the continental United States in a transient, high-resolution, ensemble climate model experiment. J. Geophys. Res. Atmos. 2013, 118, 7063–7086. [Google Scholar] [CrossRef]
  68. Wu, P.; Christidis, N.; Stott, P. Anthropogenic impact on Earth’s hydrological cycle. Nat. Clim. Change. 2013, 3, 807. [Google Scholar] [CrossRef]
  69. Martin-Vide, J. Spatial distribution of a daily precipitation concentration index in peninsular Spain. Int. J. Climatol. 2004, 24, 959–971. [Google Scholar] [CrossRef]
  70. Wang, R.; Zhang, J.; Guo, E.; Zhao, C.; Cao, T. Spatial and temporal variations of precipitation concentration and their relationships with large- scale atmospheric circulations across Northeast China. Atmos. Res. 2019, 222, 62–73. [Google Scholar] [CrossRef]
  71. Roye, D.; Martin-Vide, J. Concentration of daily precipitation in the contiguous United States. Atmos. Res. 2017, 196, 237–247. [Google Scholar] [CrossRef]
  72. Du, L.; Tian, Q.; Yu, T.; Meng, Q.; Jancso, T.; Udvardy, P.; Huang, Y. A comprehensive drought monitoring method integrating MODIS and TRMM data. Int. J. Appl. Earth Obs. 2013, 23, 245–253. [Google Scholar] [CrossRef]
  73. Hao, Z.; AghaKouchak, A. Multivariate Standardized Drought Index: A parametric multi-index model. Adv. Water Resour. 2013, 57, 12–18. [Google Scholar] [CrossRef] [Green Version]
  74. Huang, S.; Leng, G.; Xing, L.; Zhu, Y.; Huang, Q.; Chang, J. Drought structure based on a nonparametric multivariate standardized drought index across the Yellow River basin, China. J. Hydrol. 2015, 530, 127–136. [Google Scholar] [CrossRef]
  75. Zhao, M.; Kimball, J.S.; McDowell, N.G.; Running, S.W.; Mu, Q. A remotely sensed global terrestrial drought severty index. Bull. Am. Meteorol. Soc. 2013, 94, 83–98. [Google Scholar]
  76. Zhang, J.; Huang, J.; Mu, Q. Assessing the remotely sensed Drought Severity Index for agricultural drought monitoring and impact analysis in North China. Ecol. Indic. 2016, 63, 296–309. [Google Scholar] [CrossRef]
  77. Liu, X.; Zhu, X.; Pan, Y.; Bai, J.; Li, S. Performance of different drought indices for agriculture drought in the North China Plain. J. Arid Land 2018, 10, 507–516. [Google Scholar] [CrossRef] [Green Version]
Figure 1. Location of the study area.
Remotesensing 12 00060 g001
Figure 2. Interannual variations of actual yield, trend yield, and climatic yield anomalies for maize in Midwestern Jilin Province.
Remotesensing 12 00060 g002
Figure 3. Flowchart of comprehensive drought and waterlogging index (CDWI).
Remotesensing 12 00060 g003
Figure 4. Variation tendency of the SPEI and CDWI at different time scales from 1982 to 2015 in Midwestern Jilin Province. (ac) Represent the stages of emergence-tasseling stage, tasseling-milky maturity, and milky maturity-mature, respectively.
Remotesensing 12 00060 g004aRemotesensing 12 00060 g004b
Figure 5. Scatter plots comparing spatial patterns between CDWI, SPEI, and soil humidity. Scores for the SPAEF components (histogram matching and correlation) are given in the graphs at different stages in Midwestern Jilin Province. (ac) Represent the stages of emergence-tasseling stage, tasseling-milky maturity, and milky maturity-mature, respectively.
Remotesensing 12 00060 g005
Figure 6. Spatial pattern of Sen’s slope of the CDWI from 1982 to 2015 at different stages in Midwestern Jilin Province. (ac) Represent the stages of emergence-tasseling stage, tasseling-milky maturity, and milky maturity-mature, respectively.
Remotesensing 12 00060 g006
Figure 7. Variations of the regional average values of different drought and waterlogging conditions at different stages for maize based on CDWI from 1982 to 2015 in Midwestern Jilin Province. (ac) represent the stages of emergence-tasseling stage, tasseling-milky maturity, and milky maturity- mature, respectively.
Remotesensing 12 00060 g007
Figure 8. Spatial pattern of frequency of different drought grades based on the CDWI from 1982 to 2015 at different stages in Midwestern Jilin Province. (ac) represent the stages of emergence-tasseling, tasseling-milky maturity, and milky maturity-mature, respectively.
Remotesensing 12 00060 g008
Figure 9. Spatial pattern of frequency of different waterlogging grades based on the CDWI from 1982 to 2015 at different stages in Midwestern Jilin Province. (ac) Represent the stages of emergence-tasseling stage, tasseling-milky maturity, and milky maturity-mature, respectively.
Remotesensing 12 00060 g009
Figure 10. Scatter plot and linear fitting line among SPEI-1, PDSI, ZNDVI, ZET/PET, ZSM, and climatic yield anomalies for maize at different growth stages from 1985 to 2015. (ac) Represent the stages of emergence-tasseling stage, tasseling-milky maturity, and milky maturity-mature, respectively.
Remotesensing 12 00060 g010
Table 1. Drought and waterlogging classification of the CDWI and standardized precipitation evapotranspiration index (SPEI).
ClassificationSPEICDWI
Extreme waterloggingSPEI ≥ 2.0CDWI ≥ 1.5
Serious waterlogging1.5 ≤ SPEI < 5.01.2 ≤ CDWI < 1.5
Moderate waterlogging1.0 ≤ SPEI < 1.50.9 ≤ CDWI < 1.2
Slight waterlogging0.5 ≤ SPEI < 1.00.3 ≤ CDWI < 0.9
Near normal−0.5 < SPEI < 0.5−0.3 < CDWI < 0.3
Slight drought−1.0 < SPEI ≤ −0.5−0.9 < CDWI ≤ −0.3
Moderate drought−1.5< SPEI ≤ −1.0−1.2 < CDWI ≤ −0.9
Serious drought−2.0 < SPEI ≤ −1.5−1.5 < CDWI ≤ −1.2
Extreme droughtSPEI ≤ −2.0CDWI ≤ −1.5
Table 2. Comparison of drought and waterlogging conditions based on the CDWI, SPEI, and historical records of the different years of disasters resulting in maize yield loss (D, W, and N represent drought, waterlogging, and normal year, respectively).
Growing StageDifferent Years of DisastersCDWISPEIActual Situation
Emergence-tasseling stage1989WNW
2000DND
2007DND
2009DND
2011WNW
Tasseling-milky maturity stage1989DND
2004DND
2010WNW
2011DND
2012WNW
Milky maturity-mature stage1997DWD
2000DND
2012WNW
Table 3. Classification of the range of influence of drought and waterlogging for maize.
TypeNumber of Grid PointsInfluence Range
Drought≥50%Global regional drought
≥30%, and <50%Regional drought
≥10%, and ≤25%Local drought
Waterlogging≥50%Global regional waterlogging
≥30%, and <50%Regional waterlogging
≥10%, and ≤25%Local waterlogging
Table 4. Years of drought and waterlogging in different growth stages for maize in Midwestern Jilin Province. (ac) Represent the stages of emergence-tasseling stage, tasseling-milky maturity, and milky maturity-mature, respectively.
Growth StagesYear
Global Regional DroughtRegional DroughtLocal DroughtGlobal Regional WaterloggingRegional WaterloggingLocal Waterlogging
a1982, 1983, 1993, 1996, 1997, 1998, 2000, 2001, 2002, 2003, 2004, 2007, 20081984, 2006, 2009, 20141985, 19921985, 1986, 1987, 1988, 1989, 1990, 1991, 1992, 1995, 1999, 2005, 2010, 2011, 2012, 2013, 201519841993, 1994, 2009
b1982, 1983, 1989, 1992, 1993, 1996, 1997, 2000, 2001, 2002, 2003, 2004, 2006, 2007, 2008, 2009, 2011, 2014, 20151995-1984, 1985, 1986, 1987, 1988, 1990, 1991, 1994, 1995, 1998, 1999, 2005, 2010, 2012, 20131983, 20111993
c1982, 1989, 1992, 1993, 1995, 1996, 1997, 1999, 2000, 2001, 2002, 2003, 2004, 2006, 2007, 2008, 2009, 2010, 2011, 2014, 20151983-1984,1985,1986,1987,1988,1990,1991,1994,1998,2005,2012,20131983, 20101993
Table 5. Correlations between maize climatic yield anomalies and five indices.
Spearman Correlation CoefficientsSPEI-1PDSIZNDVIZET/PETZSM
Emergence-tasseling−0.0420.423 *0.256−0.0350.352
Tasseling-milky maturity0.2010.3060.1050.0750.281
Milky maturity-mature0.1810.2940.2640.0320.245
* represent a value at 0.05 significance level.
Table 6. Correlations between the CI and the two indices (SPEI and CDWI).
Spearman Correlation CoefficientsEmergence-TasselingTasseling-Milky MaturityMilky Maturity-Mature
SPEI and CI0.1480382 *0.319
CDWI and CI0.377 *0.357 *0.378 *
* represent a value at 0.05 significance level.

